

i
SIZE-BY-SIZE ANALYSIS OF BREAKAGE PARAMETERS OF CEMENT
CLINKER FEED AND PRODUCT SAMPLES OF AN INDUSTRIAL ROLLER
PRESS
A THESIS SUBMITTED TO
THE GRADUATE SCHOOL OF NATURAL AND APPLIED SCIENCES
OF
MIDDLE EAST TECHNICAL UNIVERSITY
BY
MAHMUT CAMALAN
IN PARTIAL FULFILLMENT OF THE REQUIREMENTS
FOR
THE DEGREE OF MASTER OF SCIENCE
IN
MINING ENGINEERING
AUGUST 2012

ii
Approval of the thesis:
SIZE-BY-SIZE ANALYSIS OF BREAKAGE PARAMETERS OF CEMENT
CLINKER FEED AND PRODUCT SAMPLES OF AN INDUSTRIAL
ROLLER PRESS
submitted by MAHMUT CAMALAN in partial fulfillment of the requirements for
the degree of Master of Science in Mining Engineering Department, Middle
East Technical University by,
Prof. Dr. Canan ÖZGEN _____________________
Dean, Graduate School of Natural and Applied Sciences
Prof. Dr. Ali İhsan Arol _____________________
Head of Department, Mining Engineering
Prof. Dr. Çetin Hoşten
Supervisor, Mining Engineering Dept., METU _____________________
Examining Committee Members:
Prof. Dr. Ali İhsan Arol _____________________
Mining Engineering Dept., METU
Prof. Dr. Çetin Hoşten _____________________
Mining Engineering Dept., METU
Prof. Dr. Yavuz Topkaya _____________________
Metallurgical and Materials Engineering Dept., METU
Asst. Prof. Dr. Sinan Turhan Erdoğan _____________________
Civil Engineering Dept., METU
Dr. Tuğcan Tuzcu _____________________
Dama Engineering
Date: 15.08.2012
Date: 15.08.2012

iii
I hereby declare that all information in this document has been obtained and
presented in accordance with academic rules and ethical conduct. I also
declare that, as required by these rules and conduct, I have fully cited and
referenced all material and results that are not original to this work.
Name, Last Name:
Signature:

iv
ABSTRACT
SIZE-BY-SIZE ANALYSIS OF BREAKAGE PARAMETERS OF CEMENT
CLINKER FEED AND PRODUCT SAMPLES OF AN INDUSTRIAL ROLLER
PRESS
Camalan, Mahmut
M.Sc., Department of Mining Engineering
Supervisor: Prof. Dr. Çetin Hoşten
August 2012, 189 pages
The main objective in this study is to compare breakage parameters of narrow size
fractions of cement clinker taken from the product end and feed end of
industrial-scale high pressure grinding rolls (HPGR) in order to assess whether the
breakage parameters of clinker broken in HPGR are improved or not. For this
purpose, drop weight tests were applied to six narrow size fractions above 3.35 mm,
and batch grinding tests were applied to three narrow size fractions below 3.35 mm.
It was found that the breakage probabilities of coarse sizes and breakage rates in
fine sizes were higher in the HPGR product. This indicated that clinker broken by
HPGR contained weaker particles due to cracks and damage imparted. However, no
significant weakening was observed for the -19.0+12.7 mm HPGR product.
Although HPGR product was found to be weaker than HPGR feed, fragment size
distribution of HPGR product did not seem to be finer than that of the HPGR feed at
a given loading condition in either the drop weight test or batch grinding test. Also,
drop weight tests on HPGR product and HPGR feed showed that the breakage
distribution functions of coarse sizes depended on particle size and impact energy
(J).

v
Batch grinding tests showed that the specific breakage rates of HPGR product and
HPGR feed were non-linear which could be represented with a fast initial breakage
rate and a subsequent slow breakage rate. The fast breakage rates of each size
fraction of HPGR product were higher than HPGR feed due to cracks induced in
clinker by HPGR. However, subsequent slow breakage rates of HPGR product were
close to those of HPGR feed due to elimination of cracks and disappearance of
weaker particles. Besides, the variation in breakage rates of HPGR product and
HPGR feed with ball size and particle size also showed an abnormal breakage zone
where ball sizes were insufficient to effectively fracture the coarse particles.
Breakage distribution functions of fine sizes of HPGR product and HPGR feed were
non-normalizable and depended on particle size to be ground. However, batch
grinding of -2.36+1.7 mm and -1.7+1.18 mm HPGR feed yielded the same breakage
pattern.
Keywords: Clinker, HPGR, Ball Mill, Drop Weight Test, Breakage Parameters

vi
ÖZ
YÜKSEK BASINÇLI MERDANELİ PRESTEN ALINAN GİRİŞ VE ÜRÜN
NUMUNELERİNİN KIRMA PARAMETRELERİNİN KARŞILAŞTIRILMASI
Camalan, Mahmut
Y. Lisans, Maden Mühendisliği Bölümü
Tez Yöneticisi: Prof. Dr. Çetin Hoşten
Ağustos 2012, 189 sayfa
Bu çalışmada yüksek basınçlı merdaneli preste (HPGR) kırılan klinkerin kırılma
parameterlerinin değişip değişmediğini belirlemek amacıyla; endüstriyel ölçekli,
yüksek basınçlı merdaneli presin girişinden (HPGR besleme) ve çıkışından (HPGR
ürün) alınan klinkerin dar tane aralıklarındaki kırılma parametreleri
karşılaştırılmıştır. Bu amaçla, 3.35 mm’nin üzerinde 6 adet dar tane aralığına,
ağırlık düşürme yöntemi uygulanmış; 3.35 mm’nin altındaki 3 adet dar tane aralığı
ise laboratuvar ölçekli bilyalı değirmen ile test edilmiştir. Bu testler sonucunda, iri
tanelerdeki kırılma olasılığı ile ince tanelerdeki özgül kırılma hızlarının HPGR
ürününde daha fazla olduğu bulunmuştur. Bu durum, HPGR’de kırılan klinkerin
içindeki çatlaklar ve hasarlar nedeniyle zayıfladığını göstermektedir. Ancak,
-19.0+12.7 mm HPGR ürüründe belirgin bir zayıflama görülememiştir. HPGR
ürünü, HPGR beslemesine nazaran daha zayıf olduğu halde; aynı yükleme
koşullarında yapılmış ağırlık düşürme yöntemi ya da değirmen testlerinde, kırılan
parça boyutunun HPGR ürününde daha ince çıktığını gösteren bir yönelim
bulunamamıştır. Ayrıca, ağırlık düşürme yöntemi, iri boyutların kırılım dağılım
fonksiyonlarının tane boyu ve kırılım enerjisine (J) bağlı olduğunu göstermektedir.

vii
Bilyalı değirmen testleri, HPGR ürünü ve HPGR beslemesinin kırılma hızlarının
doğrusal olmadığını göstermektedir. Bu aşamada özgül kırılma hızı, öncül hızlı
kırılma sonra da yavaş kırılma olarak ifade edilebilmektedir. Belli bir tane
boyundaki HPGR ürününün öncül özgül kırılma hızı, HPGR tarafından klinkerde
oluşturulan çatlaklar yüzünden, HPGR beslemesine göre daha yüksektir. Ancak,
sonrasındaki yavaş kırılmalarda HPGR ürünü, HPGR beslemesine yakın kırılma
hızları vermekte, bu ise çatlakların ve zayıf parçaların ortadan kaybolduğunu
göstermektedir. Bunun yanı sıra, HPGR ürünü ve HPGR beslemesindeki özgül
kırılım hızlarının bilya ve parçacık tane boyuna göre değişimi, bilya boyutunun iri
taneleri kırmakta yetersiz kaldığı anormal kırılım davranışını işaret etmektedir.
HPGR ürünü ve HPGR beslemesindeki ince tanelerin kırılım dağılım fonksiyonları
normalize olmamakta ve tane boyuna bağlı değişim göstermektedir. Ancak,
-2.36+1.7 mm ve -1.7+1.18 mm HPGR beslemesi aynı kırılım şekli vermektedir.
Anahtar Kelimeler: Klinker, HPGR, Bilyalı Değirmen, Ağırlık Düşürme Testi,
Kırılma Parametreleri

viii
To My Family and My Late Father

ix
ACKNOWLEDGEMENTS
I would like to express my gratitude to my supervisor, Prof. Dr. Çetin Hoşten, for
guiding me throughout the experimental procedure and thesis preparation with his
deep knowledge and inspirational criticism.
I would also like to thank the members of the examining committee for their kind
suggestions and contributions to the content and format of my thesis.
I would like to thank METU Central Laboratory for the experimental support given
to this study.
I would like to thank my colleague Cemil Acar for kindly supporting and guiding
me throughout the experimental work. Also, I would like to thank my colleagues
Mahmut Çavur, Mustafa Çırak, Mustafa Erkayaoğlu, Selin Yoncacı, Ömer Erdem
and Mustafa Kemal Emil for their moral support and guidance throughout the thesis
writing.
I would like to thank Tahsin Işıksal, Aytekin Aslan, Hakan Uysal and İsmail Kaya
for their help in the experimental work.
I would like to thank my friends Fatih Açıkgöz, Sarper Çubuk, Habip Demir,
Metehan Demir, Erbil Postallı and Mehmet Ali Recai Önal for their friendship and
moral support throughout the thesis preparation.
Finally, I would like to give my deepest love to my family who has supported and
loved me at every moment of my life.

x
TABLE OF CONTENTS
ABSTRACT............................................................................................................ iv
ÖZ..... ...................................................................................................................... vi
ACKNOWLEDGEMENTS .................................................................................... ix
TABLE OF CONTENTS......................................................................................... x
LIST OF TABLES ................................................................................................. xii
LIST OF FIGURES .............................................................................................. xxi
LIST OF SYMBOLS .......................................................................................... xxix
CHAPTERS
1. INTRODUCTION ............................................................................................. 1
1.1 General ..................................................................................................... 1
1.2 Objective and Scope of the Thesis ........................................................... 2
2. BACKGROUND ............................................................................................... 4
2.1 Comminution Methods ............................................................................. 4
2.1.1 High Pressure Grinding Rolls .................................................... 5
2.1.2 Ball Mill ..................................................................................... 6
2.2 Comminution Models ............................................................................... 8
2.2.1 Breakage Parameters of the Kinetic Model ............................... 9
2.2.2 Single Particle Breakage Tests ................................................ 14
2.2.2.1 Drop Weight Testing ................................................ 15
2.3 Portland Cement Clinker ........................................................................ 18
2.3.1 Cement Clinker Grinding ........................................................ 19
2.4 Utilization of HPGR Prior To Ball Mill ................................................. 21
3. EXPERIMENTAL MATERIAL AND METHODS ....................................... 23
3.1 Material .................................................................................................. 23
3.2 Methods .................................................................................................. 24

xi
4. RESULTS AND DISCUSSION...................................................................... 36
4.1 Evaluation of Single Particle Breakage Tests ........................................ 36
4.2 Evaluation of Batch Grinding Tests ....................................................... 54
4.2.1 Product Size Distributions ....................................................... 54
4.2.2 Specific Rates of Breakage ...................................................... 59
4.2.3 Primary Breakage Distribution Functions ............................... 67
5. CONCLUSIONS ............................................................................................. 76
REFERENCES ...................................................................................................... 79
APPENDICES
A. SIZE DISTRIBUTIONS OF HPGR PRODUCT AND HPGR FEED ......... 82
B. DROP WEIGHT TEST DATA .................................................................... 84
C. BLANK SIEVE ANALYSIS OF MONOSIZE MATERIAL USED IN
BATCH GRINDING OF HPGR PRODUCT AND HPGR FEED ............ 151
D. BATCH GRINDING TEST DATA ........................................................... 161

xii
LIST OF TABLES
TABLES
Table 2.1. Breakage distribution functions in a matrix form ................................... 12
Table 3.1. Experimental conditions for drop weight testing of -4.7+3.35 mm of
HPGR product .......................................................................................................... 25
Table 3.2. Experimental conditions for drop weight testing of -4.7+3.35 mm of
HPGR feed ............................................................................................................... 25
Table 3.3. Experimental conditions for drop weight testing of -6.35+4.7 mm of
HPGR product .......................................................................................................... 26
Table 3.4. Experimental conditions for drop weight testing of -6.35+4.7 mm of
HPGR feed ............................................................................................................... 26
Table 3.5. Experimental conditions for drop weight testing of -9.53+6.35 mm of
HPGR product .......................................................................................................... 27
Table 3.6. Experimental conditions for drop weight testing of -9.53+6.35 mm of
HPGR feed ............................................................................................................... 27
Table 3.7. Experimental conditions for drop weight testing of -12.7+9.53 mm of
HPGR product .......................................................................................................... 28
Table 3.8. Experimental conditions for drop weight testing of -12.7+9.53 mm of
HPGR feed ............................................................................................................... 29
Table 3.9. Experimental conditions for drop weight testing of -19.0+12.7 mm of
HPGR product .......................................................................................................... 30
Table 3.10. Experimental conditions for drop weight testing of -19.0+12.7 mm of
HPGR feed ............................................................................................................... 30
Table 3.11. Experimental conditions for drop weight testing of -25.4+19.0 mm of
HPGR product .......................................................................................................... 31
Table 3.12. Experimental conditions for drop weight testing of -25.4+19.0 mm of
HPGR feed ............................................................................................................... 31

xiii
Table 3.13. Experimental conditions for batch ball mill grinding of HPGR product
and HPGR feed (dB = 19.05 mm)............................................................................. 33
Table 3.14. Experimental conditions for batch ball mill grinding of HPGR product
and HPGR feed (dB = 25.4 mm)............................................................................... 34
Table 3.15. Experimental conditions for batch ball mill grinding of HPGR product
and HPGR feed (dB = 31.75 mm)............................................................................. 35
Table 4.1. Fast (S1) and slow (S2) breakage rates of the size fractions of HPGR
product and HPGR feed (Raw data at Appendix C and Appendix D) ..................... 60
Table A.1. Size distribution of HPGR product ........................................................ 82
Table A.2. Size distribution of HPGR feed .............................................................. 83
Table B.1. Product size distribution after impact breakage of -4.7+3.35 mm of
HPGR product (specific impact energy=0.54 kWh/t) .............................................. 84
Table B.2. Product size distribution after impact breakage of -4.7+3.35 mm of
HPGR product (specific impact energy=1.09 kWh/t) .............................................. 85
Table B.3. Product size distribution after impact breakage of -4.7+3.35 mm of
HPGR product (specific impact energy=2.18 kWh/t) .............................................. 86
Table B.4. Product size distribution after impact breakage of -4.7+3.35 mm of
HPGR product (specific impact energy=3.32 kWh/t) .............................................. 87
Table B.5. Product size distribution after impact breakage of -4.7+3.35 mm of
HPGR feed (specific impact energy=0.54 kWh/t) ................................................... 88
Table B.6. Product size distribution after impact breakage of -4.7+3.35 mm of
HPGR feed (specific impact energy=1.09 kWh/t) ................................................... 89
Table B.7. Product size distribution after impact breakage of -4.7+3.35 mm of
HPGR feed (specific impact energy=2.18 kWh/t) ................................................... 90
Table B.8. Product size distribution after impact breakage of -4.7+3.35 mm of
HPGR feed (specific impact energy=3.32 kWh/t) ................................................... 91
Table B.9. Product size distribution after impact breakage of -6.35+4.7 mm of
HPGR product (specific impact energy=0.23 kWh/t) .............................................. 92
Table B.10. Product size distribution after impact breakage of -6.35+4.7 mm of
HPGR product (specific impact energy=0.45 kWh/t) .............................................. 93
xiv
Table B.11. Product size distribution after impact breakage of -6.35+4.7 mm of
HPGR product (specific impact energy=0.88 kWh/t) .............................................. 94
Table B.12. Product size distribution after impact breakage of -6.35+4.7 mm of
HPGR product (specific impact energy=1.74 kWh/t) .............................................. 95
Table B.13. Product size distribution after impact breakage of -6.35+4.7 mm of
HPGR feed (specific impact energy=0.23 kwh/t) .................................................... 96
Table B.14. Product size distribution after impact breakage of -6.35+4.7 mm of
HPGR feed (specific impact energy=0.45 kWh/t) ................................................... 97
Table B.15. Product size distribution after impact breakage of -6.35+4.7 mm of
HPGR feed (specific impact energy=0.88 kWh/t) ................................................... 98
Table B.16. Product size distribution after impact breakage of -6.35+4.7 mm of
HPGR feed (specific impact energy=1.74 kWh/t) ................................................... 99
Table B.17. Product size distribution after impact breakage of -9.53+6.35 mm of
HPGR product (specific impact energy=0.10 kWh/t) ............................................ 100
Table B.18. Product size distribution after impact breakage of -9.53+6.35 mm of
HPGR product (specific impact energy=0.22 kWh/t) ............................................ 101
Table B.19. Product size distribution after impact breakage of -9.53+6.35 mm of
HPGR product (specific impact energy=0.55 kWh/t) ............................................ 102
Table B.20. Product size distribution after impact breakage of -9.53+6.35 mm of
HPGR product (specific impact energy=0.92 kWh/t) ............................................ 103
Table B.21. Product size distribution after impact breakage of -9.53+6.35 mm of
HPGR product (specific impact energy=2.21 kWh/t) ............................................ 104
Table B.22. Product size distribution after impact breakage of -9.53+6.35 mm of
HPGR product (specific impact energy=4.35 kWh/t) ............................................ 105
Table B.23. Product size distribution after impact breakage of -9.53+6.35 mm of
HPGR feed (specific impact energy=0.10 kWh/t) ................................................. 106
Table B.24. Product size distribution after impact breakage of -9.53+6.35 mm of
HPGR feed (specific impact energy=0.22 kWh/t) ................................................. 107
Table B.25. Product size distribution after impact breakage of -9.53+6.35 mm of
HPGR feed (specific impact energy=0.55 kWh/t) ................................................. 108

xv
Table B.26. Product size distribution after impact breakage of -9.53+6.35 mm of
HPGR feed (specific impact energy=0.92 kWh/t) ................................................. 109
Table B.27. Product size distribution after impact breakage of -9.53+6.35 mm of
HPGR feed (specific impact energy=2.21 kWh/t) ................................................. 110
Table B.28. Product size distribution after impact breakage of -9.53+6.35 mm of
HPGR feed (specific impact energy=4.35 kWh/t) ................................................. 111
Table B.29. Product size distribution after impact breakage of -12.7+9.53 mm of
HPGR product (specific impact energy=0.03 kWh/t) ............................................ 112
Table B.30. Product size distribution after impact breakage of -12.7+9.53 mm of
HPGR product (specific impact energy=0.11 kWh/t) ............................................ 113
Table B.31. Product size distribution after impact breakage of -12.7+9.53 mm of
HPGR product (specific impact energy=0.22 kWh/t) ............................................ 114
Table B.32. Product size distribution after impact breakage of -12.7+9.53 mm of
HPGR product (specific impact energy=0.44 kWh/t) ............................................ 115
Table B.33. Product size distribution after impact breakage of -12.7+9.53 mm of
HPGR product (specific impact energy=0.88 kWh/t) ............................................ 116
Table B.34. Product size distribution after impact breakage of -12.7+9.53 mm of
HPGR product (specific impact energy=1.32 kWh/t) ............................................ 117
Table B.35. Product size distribution after impact breakage of -12.7+9.53 mm of
HPGR product (specific impact energy=1.7 kWh/t) .............................................. 118
Table B.36. Product size distribution after impact breakage of -12.7+9.53 mm of
HPGR feed (specific impact energy=0.03 kWh/t) ................................................. 119
Table B.37. Product size distribution after impact breakage of -12.7+9.53 mm of
HPGR feed (specific impact energy=0.11 kWh/t) ................................................. 120
Table B.38. Product size distribution after impact breakage of -12.7+9.53 mm of
HPGR feed (specific impact energy=0.22 kWh/t) ................................................. 121
Table B.39. Product size distribution after impact breakage of -12.7+9.53 mm of
HPGR feed (specific impact energy=0.44 kWh/t) ................................................. 122
Table B.40. Product size distribution after impact breakage of -12.7+9.53 mm of
HPGR feed (specific impact energy=0.88 kWh/t) ................................................. 123

xvi
Table B.41. Product size distribution after impact breakage of -12.7+9.53 mm of
HPGR feed (specific impact energy=1.32 kWh/t) ................................................. 124
Table B.42. Product size distribution after impact breakage of -12.7+9.53 mm of
HPGR feed (specific impact energy=1.70 kWh/t) ................................................. 125
Table B.43. Product size distribution after impact breakage of -19.0+12.7 mm of
HPGR product (specific impact energy=0.03 kWh/t) ............................................ 126
Table B.44. Product size distribution after impact breakage of -19.0+12.7 mm of
HPGR product (specific impact energy=0.11 kWh/t) ............................................ 127
Table B.45. Product size distribution after impact breakage of -19.0+12.7 mm of
HPGR product (specific impact energy=0.22 kWh/t) ............................................ 128
Table B.46. Product size distribution after impact breakage of -19.0+12.7 mm of
HPGR product (specific impact energy=0.44 kWh/t) ............................................ 129
Table B.47. Product size distribution after impact breakage of -19.0+12.7 mm of
HPGR product (specific impact energy=0.88 kWh/t) ............................................ 130
Table B.48. Product size distribution after impact breakage of -19.0+12.7 mm of
HPGR feed (specific impact energy=0.03 kWh/t) ................................................. 131
Table B.49. Product size distribution after impact breakage of -19.0+12.7 mm of
HPGR feed (specific impact energy=0.11 kWh/t) ................................................. 132
Table B.50. Product size distribution after impact breakage of -19.0+12.7 mm of
HPGR feed (specific impact energy=0.22 kWh/t) ................................................. 133
Table B.51. Product size distribution after impact breakage of -19.0+12.7 mm of
HPGR feed (specific impact energy=0.44 kWh/t) ................................................. 134
Table B.52. Product size distribution after impact breakage of -19.0+12.7 mm of
HPGR feed (specific impact energy=0.88 kWh/t) ................................................. 135
Table B.53. Product size distribution after impact breakage of -25.4+19.0 mm of
HPGR product (specific impact energy=0.01 kWh/t) ............................................ 136
Table B.54. Product size distribution after impact breakage of -25.4+19.0 mm of
HPGR product (specific impact energy=0.05 kWh/t) ............................................ 137
Table B.55. Product size distribution after impact breakage of -25.4+19.0 mm of
HPGR product (specific impact energy=0.11 kWh/t) ............................................ 138

xvii
Table B.56. Product size distribution after impact breakage of -25.4+19.0 mm of
HPGR product (specific impact energy=0.22 kWh/t) ............................................ 139
Table B.57. Product size distribution after impact breakage of -25.4+19.0 mm of
HPGR product (specific impact energy=0.59 kWh/t) ............................................ 140
Table B.58. Product size distribution after impact breakage of -25.4+19.0 mm of
HPGR product (specific impact energy=0.88 kWh/t) ............................................ 141
Table B.59. Product size distribution after impact breakage of -25.4+19.0 mm of
HPGR feed (specific impact energy=0.01 kWh/t) ................................................. 142
Table B.60. Product size distribution after impact breakage of -25.4+19.0 mm of
HPGR feed (specific impact energy=0.05 kWh/t) ................................................. 143
Table B.61. Product size distribution after impact breakage of -25.4+19.0 mm of
HPGR feed (specific impact energy=0.11 kWh/t) ................................................. 144
Table B.62. Product size distribution after impact breakage of -25.4+19.0 mm of
HPGR feed (specific impact energy=0.22 kWh/t) ................................................. 145
Table B.63. Product size distribution after impact breakage of -25.4+19.0 mm of
HPGR feed (specific impact energy=0.59 kWh/t) ................................................. 146
Table B.64. Product size distribution after impact breakage of -25.4+19.0 mm of
HPGR feed (specific impact energy=0.88 kWh/t) ................................................. 147
Table B.65. t10 and d50 of HPGR product ............................................................. 148
Table B.66. t10 and d50 of HPGR feed ................................................................... 149
Table C.1. Size distribution of -3.35+2.36 mm HPGR product used for ball milling
(dB =19.05 mm, ɸBALL=0.35) ................................................................................ 151
Table C.2. Size distribution of -3.35+2.36 mm HPGR product used for ball milling
(dB =25.4 mm, ɸBALL=0.35) .................................................................................. 152
Table C.3. Size distribution of -3.35+2.36 mm HPGR product used for ball milling
(dB =31.75 mm, ɸBALL=0.35) ................................................................................ 152
Table C.4. Size distribution of -3.35+2.36 mm HPGR feed used for ball milling
(dB=19.05 mm, ɸBALL=0.35) ................................................................................. 153
Table C.5. Size distribution of -3.35+2.36 mm HPGR feed used for ball milling
(dB=25.4 mm, ɸBALL=0.35) .................................................................................... 153

xviii
Table C.6. Size distribution of -3.35+2.36 mm HPGR feed used for ball milling
(dB=31.75 mm, ɸBALL=0.35) ................................................................................. 154
Table C.7. Size distribution of -2.36+1.7 mm HPGR product used for ball milling
(dB =19.05 mm, ɸBALL=0.35) ................................................................................ 154
Table C.8. Size distribution of -2.36+1.7 mm HPGR product used for ball milling
(dB =25.4 mm, ɸBALL=0.35) .................................................................................. 155
Table C.9. Size distribution of -2.36+1.7 mm HPGR product used for ball milling
(dB=31.75 mm, ɸBALL=0.35) ................................................................................. 155
Table C.10. Size distribution of -2.36+1.7 mm HPGR feed used for ball milling
(dB=19.05 mm, ɸBALL=0.35) ................................................................................. 156
Table C.11. Size distribution of -2.36+1.7 mm HPGR feed used for ball milling
(dB=25.4 mm, ɸBALL=0.35) ................................................................................... 156
Table C.12. Size distribution of -2.36+1.7 mm HPGR feed used for ball milling
(dB=31.75 mm, ɸBALL=0.35) ................................................................................. 157
Table C.13. Size distribution of –1.7+1.18 mm HPGR product used for ball milling
(dB=19.05 mm, ɸBALL=0.35) ................................................................................. 157
Table C.14. Size distribution of –1.7+1.18 mm HPGR product used for ball milling
(dB=25.4 mm, ɸBALL=0.35) ................................................................................... 158
Table C.15. Size distribution of –1.7+1.18 mm HPGR product used for ball milling
(dB=31.75 mm, ɸBALL=0.35) ................................................................................. 158
Table C.16. Size distribution of –1.7+1.18 mm HPGR feed used for ball milling
(dB=19.05 mm, ɸBALL=0.35) ................................................................................. 159
Table C.17. Size distribution of –1.7+1.18 mm HPGR feed used for ball milling
(dB=25.4 mm, ɸBALL=0.35) ................................................................................... 159
Table C.18. Size distribution of –1.7+1.18 mm HPGR feed used for ball milling
(dB=31.75 mm, ɸBALL=0.35) ................................................................................. 160
Table D.1. Product size distribution after batch grinding of -3.35+2.36 mm of
HPGR product (dB =19.05 mm, ɸBALL=0.35)......................................................... 161
Table D.2. Product size distribution after batch grinding of -3.35+2.36 mm of
HPGR product (dB =25.4 mm, ɸBALL=0.35)........................................................... 163

xix
Table D.3. Product size distribution after batch grinding of -3.35+2.36 mm of
HPGR product (dB =31.75 mm, ɸBALL=0.35)......................................................... 165
Table D.4. Product size distribution after batch grinding of -3.35+2.36 mm of
HPGR feed (dB =19.05 mm, ɸBALL=0.35) .............................................................. 167
Table D.5. Product size distribution after batch grinding of -3.35+2.36 mm of
HPGR feed (dB =25.4 mm, ɸBALL=0.35) ................................................................ 168
Table D.6. Product size distribution after batch grinding of -3.35+2.36 mm of
HPGR feed (dB =31.75 mm, ɸBALL=0.35) .............................................................. 170
Table D.7. Product size distribution after batch grinding of -2.36+1.7 mm of HPGR
product (dB =19.05 mm, ɸBALL=0.35) .................................................................... 171
Table D.8. Product size distribution after batch grinding of -2.36+1.7 mm of HPGR
product (dB =25.4 mm, ɸBALL=0.35) ...................................................................... 173
Table D.9. Product size distribution after batch grinding of -2.36+1.7 mm of HPGR
product (dB =31.75 mm, ɸBALL=0.35) .................................................................... 174
Table D.10. Product size distribution after batch grinding of -2.36+1.7 mm of
HPGR feed (dB =19.05 mm, ɸBALL=0.35) .............................................................. 176
Table D.11. Product size distribution after batch grinding of -2.36+1.7 mm of
HPGR feed (dB =25.4 mm, ɸBALL=0.35) ................................................................ 177
Table D.12. Product size distribution after batch grinding of -2.36+1.7 mm of
HPGR feed (dB =31.75 mm, ɸBALL=0.35) .............................................................. 179
Table D.13. Product size distribution after batch grinding of -1.7+1.18 mm of
HPGR product (dB =19.05 mm, ɸBALL=0.35)......................................................... 181
Table D.14. Product size distribution after batch grinding of -1.7+1.18 mm of
HPGR product (dB =25.4 mm, ɸBALL=0.35)........................................................... 182
Table D.15. Product size distribution after batch grinding of -1.7+1.18 mm of
HPGR product (dB =31.75 mm, ɸBALL=0.35)......................................................... 184
Table D.16. Product size distribution after batch grinding of -1.7+1.18 mm of
HPGR feed (dB =19.05 mm, ɸBALL=0.35) .............................................................. 185
Table D.17. Product size distribution after batch grinding of -1.7+1.18 mm of
HPGR feed (dB =25.4 mm, ɸBALL=0.35) ................................................................ 187

xx
Table D.18. Product size distribution after batch grinding of -1.7+1.18 mm of
HPGR feed (dB =31.75 mm, ɸBALL=0.35) .............................................................. 188

xxi
LIST OF FIGURES
FIGURES
Figure 2.1. Operating principle of HPGR (De, 1995) ................................................ 6
Figure 2.2. Non-linear deviations observed in breakage rates (Bilgili et al., 2006) 11
Figure 2.3. Graphical procedure for estimating parameters of and Ф1 in functional
form of Bi1 ................................................................................................................ 14
Figure 2.4. Schematics of a drop weight tester ........................................................ 16
Figure 2.5. One-parameter family curves ................................................................ 17
Figure 2.6. Conceptual flowsheet of cement production ......................................... 19
Figure 2.7. The modes of operation for cement grinding circuits (Patzelt, 1992) ... 20
Figure 3.1. Particle size distributions of HPGR product and HPGR feed (Raw data
at Table A.1 and Table A.2 in Appendix A) ............................................................ 23
Figure 4.1. Mass-Basis Breakage Probabilities of -4.7+3.35 mm HPGR product and
HPGR feed (Raw data at Table B.1 through Table B.8 in Appendix B) ................. 37
Figure 4.2. Mass-Basis Breakage Probabilities of -6.35+4.7 mm HPGR product and
HPGR feed (Raw data at Table B.9 through Table B.16 in Appendix B) ............... 38
Figure 4.3. Mass-Basis Breakage Probabilities of -9.53+6.35 mm HPGR product
and HPGR feed (Raw data at Table B.17 through Table B.28 in Appendix B) ...... 38
Figure 4.4. Mass-Basis Breakage Probabilities of -12.7+9.53 mm HPGR product
and HPGR feed (Raw data at Table B.29 through Table B.42 in Appendix B) ...... 39
Figure 4.5. Mass-Basis Breakage Probabilities of -19+12.7 mm HPGR product and
HPGR feed (Raw data at Table B.43 through Table B.52 in Appendix B) ............. 39
Figure 4.6. Mass-Basis Breakage Probabilities of -25.4+19 mm HPGR product and
HPGR feed (Raw data at Table B.53 through Table B.64 in Appendix B) ............. 40
Figure 4.7. Cumulative breakage distribution functions after impact breakage of
-4.7+3.35 mm of HPGR product and HPGR feed at various energy levels (Raw data
at Table B.1 through Table B.8 in Appendix B) ...................................................... 41

xxii
Figure 4.8. Cumulative breakage distribution functions after impact breakage of
-6.35+4.7 mm of HPGR product and HPGR feed at various energy levels (Raw data
at Table B.9 through Table B.16 in Appendix B) .................................................... 42
Figure 4.9. Cumulative breakage distribution functions after impact breakage of
-9.53+6.35 mm of HPGR product and HPGR feed at various energy levels (Raw
data at Table B.17 through Table B.28 in Appendix B) .......................................... 42
Figure 4.10. Cumulative breakage distribution functions after impact breakage of
-12.7+9.53 mm of HPGR product and HPGR feed at various energy levels (Raw
data at Table B.29 through Table B.42 in Appendix B) .......................................... 43
Figure 4.11. Cumulative breakage distribution functions after impact breakage of
-19.0+12.7 mm of HPGR product and HPGR feed at various energy levels (Raw
data at Table B.43 through Table B.52 in Appendix B) .......................................... 43
Figure 4.12. Cumulative breakage distribution functions after impact breakage of
-25.4+19.0 mm of HPGR product and HPGR feed at various energy levels (Raw
data at Table B.53 through Table B.64 in Appendix B) .......................................... 44
Figure 4.13. Non-self similar product size distributions after drop weight tests of
-4.7+3.35 mm HPGR product with varying specific impact energy levels (Raw data
at Table B.1 through Table B.4, and at Table B.65 in Appendix B) ........................ 45
Figure 4.14. Non-self similar product size distributions after drop weight tests of
-4.7+3.35 mm HPGR feed with varying specific impact energy levels (Raw data at
Table B.5 through Table B.8, and at Table B.66 in Appendix B)............................ 46
Figure 4.15. Non-self similar product size distributions after drop weight tests of
-6.35+4.7 mm HPGR product with varying specific impact energy levels (Raw data
at Table B.9 through Table B.12, and at Table B.65 in Appendix B) ...................... 46
Figure 4.16. Non-self similar product size distributions after drop weight tests of
-6.35+4.7 mm HPGR feed with varying specific impact energy levels (Raw data at
Table B.13 through Table B.16, and at Table B.66 in Appendix B) ....................... 47
Figure 4.17. Non-self similar product size distributions after drop weight tests of
-9.53+6.35 mm HPGR product with varying specific impact energy levels (Raw
data at Table B.17 through Table B.22, and at Table B.65 in Appendix B) ............ 47

xxiii
Figure 4.18. Non-self similar product size distributions after drop weight tests of
-9.53+6.35 mm HPGR feed with varying specific impact energy levels (Raw data at
Table B.23 through Table B.28, and at Table B.66 in Appendix B) ....................... 48
Figure 4.19. Non-self similar product size distributions after drop weight tests of
-12.7+9.53 mm HPGR product with varying specific impact energy levels (Raw
data at Table B.29 through Table B.35, and at Table B.65 in Appendix B) ............ 48
Figure 4.20. Non-self similar product size distributions after drop weight tests of
-12.7+9.53 mm HPGR feed with varying specific impact energy levels (Raw data at
Table B.36 through Table B.42, and at Table B.66 in Appendix B) ....................... 49
Figure 4.21. Non-self similar product size distributions after drop weight tests of
-19.0+12.7 mm HPGR product with varying specific impact energy levels (Raw
data at Table B.43 through Table B.47, and at Table B.65 in Appendix B) ............ 49
Figure 4.22. Non-self similar product size distributions after drop weight tests of
-19.0+12.7 mm HPGR feed with varying specific impact energy levels (Raw data at
Table B.48 through Table B.52, and at Table B.66 in Appendix B) ....................... 50
Figure 4.23. Non-self similar product size distributions after drop weight tests of
-25.4+19.0 mm HPGR product with varying specific impact energy levels (Raw
data at Table B.53 through Table B.58, and at Table B.65 in Appendix B) ............ 50
Figure 4.24. Non-self similar product size distributions after drop weight tests of
-25.4+19.0 mm HPGR feed with varying specific impact energy levels (Raw data at
Table B.59 through Table B.64, and at Table B.66 in Appendix B) ....................... 51
Figure 4.25. Non-normalizable breakage distribution functions of -4.7+3.35 mm,
-6.35+4.7 mm, -9.53+6.35 mm, and -12.7+9.53 mm HPGR product (Raw data at
Table B.1, Table B.9, Table B.17 and Table B.29 in Appendix B) ........................ 52
Figure 4.26. Non-normalizable breakage distribution functions of -4.7+3.35 mm,
-6.35+4.7 mm, -9.53+6.35 mm, and -12.7+9.53 mm HPGR feed (Raw data at
Table B.5, Table B.13, Table B.23 and Table B.36 in Appendix B) ...................... 52
Figure 4.27. Non-normalizable breakage distribution functions of -12.7+9.53 mm,
-19+12.7 mm, -25.4+19.0 mm HPGR product (Raw data at Table B.30, Table B.43
and Table B.53 in Appendix B) ............................................................................... 53

xxiv
Figure 4.28. Non-normalizable breakage distribution functions of -12.7+9.53 mm,
-19+12.7 mm, -25.4+19.0 mm HPGR feed (Raw data at Table B.37, Table B.48 and
Table B.59 in Appendix B) ...................................................................................... 53
Figure 4.29. Product size distributions after batch grinding of -1.7+1.18 mm of
HPGR product and HPGR feed; dB = 19.05 mm, ɸBall = 0.35, 633 g of material
(Raw data at Table D.13 and Table D.16 in Appendix D) ....................................... 55
Figure 4.30. Product size distributions after batch grinding of -1.7+1.18 mm of
HPGR product and HPGR feed; dB = 25.4 mm, ɸBall = 0.35, 633 g of material (Raw
data at Table D.14 and Table D.17 in Appendix D) ................................................ 55
Figure 4.31. Product size distributions after batch grinding of -1.7+1.18 mm of
HPGR product and HPGR feed; dB = 31.75 mm, ɸBall = 0.35, 633 g of material
(Raw data at Table D.15 and Table D.18 in Appendix D) ....................................... 56
Figure 4.32. Product size distributions after batch grinding of -2.36+1.7 mm of
HPGR product and HPGR feed; dB = 19.05 mm, ɸBall = 0.35, 633 g of material
(Raw data at from Table D.7 and Table D.10 in Appendix D) ................................ 56
Figure 4.33. Product size distributions after batch grinding of -2.36+1.7 mm of
HPGR product and HPGR feed; dB = 25.4 mm, ɸBall = 0.35, 633 g of material (Raw
data at Table D.8 and Table D.11 in Appendix D) .................................................. 57
Figure 4.34. Product size distributions after batch grinding of -2.36+1.7 mm of
HPGR product and HPGR feed; dB = 31.75 mm, ɸBall = 0.35, 633 g of material
(Raw data at Table D.9 and Table D.12 in Appendix D) ......................................... 57
Figure 4.35. Product size distributions after batch grinding of -3.35+2.36 mm of
HPGR product and HPGR feed; dB = 19.05 mm, ɸBall = 0.35, 720 g of material
(Raw data at Table D.1 and Table D.4 in Appendix D) ........................................... 58
Figure 4.36. Product size distributions after batch grinding of -3.35+2.36 mm of
HPGR product and HPGR feed; dB = 25.4 mm, ɸBall = 0.35, 720 g of material (Raw
data at Table D.2 and Table D.5 in Appendix D) .................................................... 58
Figure 4.37. Product size distributions after batch grinding of -3.35+2.36 mm of
HPGR product and HPGR feed; dB = 31.75 mm, ɸBall = 0.35, 720 g of material
(Raw data at Table D.3 and Table D.6 in Appendix D) ........................................... 59

xxv
Figure 4.38. Breakage rate plots after batch grinding of -1.7+1.18 mm of HPGR
product and HPGR feed; dB = 19.05 mm, ɸBall =0.35, 633 g of material
(Raw data at Table C.13, Table C.16 in Appendix C, and Table D.13, Table D.16 in
Appendix D) ............................................................................................................. 61
Figure 4.39. Breakage rate plots after batch grinding of -1.7+1.18 mm of HPGR
product and HPGR feed; dB = 25.4 mm, ɸBall =0.35, 633 g of material
(Raw data at Table C.14, Table C.17 in Appendix C, and Table D.14, Table D.17 in
Appendix D) ............................................................................................................. 61
Figure 4.40. Breakage rate plots after batch grinding of -1.7+1.18 mm of HPGR
product and HPGR feed; dB = 31.75 mm, ɸBall =0.35, 633 g of material
(Raw data at Table C.15, Table C.18 in Appendix C, and Table D.15, Table D.18 in
Appendix D) ............................................................................................................. 62
Figure 4.41. Breakage rate plots after batch grinding of -2.36+1.7 mm of HPGR
product and HPGR feed; dB = 19.05 mm, ɸBall =0.35, 633 g of material
(Raw data at Table C.7, Table C.10 in Appendix C, and Table D.7, Table D.10 in
Appendix D) ............................................................................................................. 62
Figure 4.42. Breakage rate plots after batch grinding of -2.36+1.7 mm of HPGR
product and HPGR feed; dB = 25.4 mm, ɸBall =0.35, 633 g of material
(Raw data at Table C.8, Table C.11 in Appendix C, and Table D.8, Table D.11 in
Appendix D) ............................................................................................................. 63
Figure 4.43. Breakage rate plots after batch grinding of -2.36+1.7 mm of HPGR
product and HPGR feed; dB = 31.75 mm, ɸBall =0.35, 633 g of material
(Raw data at Table C.9, Table C.12 in Appendix C, and Table D.9, Table D.12 in
Appendix D) ............................................................................................................. 63
Figure 4.44. Breakage rate plots after batch grinding of -3.35+2.36 mm of HPGR
product and HPGR feed; dB = 19.05 mm, ɸBall =0.35, 720 g of material
(Raw data at Table C.1, Table C.4 in Appendix C, and Table D.1, Table D.4 in
Appendix D) ............................................................................................................. 64

xxvi
Figure 4.45. Breakage rate plots after batch grinding of -3.35+2.36 mm of HPGR
product and HPGR feed; dB = 25.4 mm, ɸBall =0.35, 720 g of material
(Raw data at Table C.2, Table C.5 in Appendix C, and Table D.2, Table D.5 in
Appendix D) ............................................................................................................. 64
Figure 4.46. Breakage rate plots after batch grinding of -3.35+2.36 mm of HPGR
product and HPGR feed; dB = 31.75 mm, ɸBall =0.35, 720 g of material
(Raw data at Table C.3, Table C.6 in Appendix C, and Table D.3, Table D.6 in
Appendix D) ............................................................................................................. 65
Figure 4.47. Variation of S1 and S2 with particle size in batch grinding of HPGR
product and HPGR feed (dB = 19.05 mm) ............................................................... 66
Figure 4.48. Variation of S1 and S2 with particle size in batch grinding of HPGR
product and HPGR feed (dB = 25.4 mm) ................................................................. 66
Figure 4.49. Variation of S1 and S2 with particle size in batch grinding of HPGR
product and HPGR feed (dB = 31.75 mm) ............................................................... 67
Figure 4.50. Primary breakage distribution functions after batch grinding of
-1.7+1.18 mm of HPGR product and HPGR feed; dB = 19.05 mm, ɸBall = 0.35, 633
g of material (Raw data at Table C.13, Table C.16 in Appendix C, and Table D.13,
Table D.16 in Appendix D) ...................................................................................... 68
Figure 4.51. Primary breakage distribution functions after batch grinding of
-1.7+1.18 mm of HPGR product and HPGR feed; dB = 25.4 mm, ɸBall = 0.35, 633 g
of material (Raw data at Table C.14, Table C.17 in Appendix C, and Table D.14,
Table D.17 in Appendix D) ...................................................................................... 68
Figure 4.52. Primary breakage distribution functions after batch grinding of
-1.7+1.18 mm of HPGR product and HPGR feed; dB =31.75 mm, ɸBall =0.35, 633 g
of material (Raw data at Table C.15, Table C.18 in Appendix C, and Table D.15,
Table D.18 in Appendix D) ...................................................................................... 69
Figure 4.53. Primary breakage distribution functions after batch grinding of
-2.36+1.7 mm of HPGR product and HPGR feed; dB =19.05 mm, ɸBall =0.35, 633 g
of material (Raw data at Table C.7, Table C.10 in Appendix C, and Table D.7,
Table D.10 in Appendix D) ...................................................................................... 69

xxvii
Figure 4.54. Primary breakage distribution functions after batch grinding of
-2.36+1.7 mm of HPGR product and HPGR feed; dB =25.4 mm, ɸBall =0.35, 633 g
of material (Raw data at Table C.8, Table C.11 in Appendix C, and Table D.8,
Table D.11 in Appendix D) ...................................................................................... 70
Figure 4.55. Primary breakage distribution functions after batch grinding of
-2.36+1.7 mm of HPGR product and HPGR feed; dB =31.75 mm, ɸBall =0.35, 633 g
of material (Raw data at Table C.9, Table C.12 in Appendix C, and Table D.9,
Table D.12 in Appendix D) ...................................................................................... 70
Figure 4.56. Primary breakage distribution functions after batch grinding of
-3.35+2.36 mm of HPGR product and HPGR feed; dB=19.05 mm, ɸBall=0.35, 720 g
of material (Raw data at Table C.1, Table C.4 in Appendix C, and Table D.1, Table
D.4 in Appendix D) .................................................................................................. 71
Figure 4.57. Primary breakage distribution functions after batch grinding of
-3.35+2.36 mm of HPGR product and HPGR feed; dB =25.4 mm, ɸBall =0.35, 720 g
of material (Raw data at Table C.2, Table C.5 in Appendix C, and Table D.2, Table
D.5 in Appendix D) .................................................................................................. 71
Figure 4.58. Primary breakage distribution functions after batch grinding of
-3.35+2.36 mm of HPGR product and HPGR feed; dB =31.75 mm, ɸBall =0.35, 720
g of material (Raw data at Table C.3, Table C.6 in Appendix C, and Table D.3,
Table D.6 in Appendix D) ........................................................................................ 72
Figure 4.59. Primary breakage distribution functions after batch grinding of three
monosize fractions of HPGR product; dB = 19.05 mm, ɸBall = 0.35 (Raw data at
Table C.1, Table C.7, Table C.13 in Appendix C, and Table D.1, Table D.7, Table
D.13 in Appendix D) ................................................................................................ 73
Figure 4.60. Primary breakage distribution functions after batch grinding of three
monosize fractions of HPGR product; dB = 25.4 mm, ɸBall = 0.35 (Raw data at Table
C.2, Table C.8, Table C.14 in Appendix C, and Table D.2, Table D.8 and Table
D.14 in Appendix D) ................................................................................................ 73

xxviii
Figure 4.61. Primary breakage distribution functions after batch grinding of three
monosize fractions of HPGR product; dB = 31.75 mm, ɸBall = 0.35 (Raw data at
Table C.3, Table C.9, Table C.15 in Appendix C, and Table D.3, Table D.9, Table
D.15 in Appendix D) ................................................................................................ 74
Figure 4.62. Primary breakage distribution functions after batch grinding of three
monosize fractions of HPGR feed; dB = 19.05 mm, ɸBall = 0.35 (Raw data at Table
C.4, Table C.10, Table C.16 in Appendix C, and Table D.4, Table D.10, Table D.16
in Appendix D) ......................................................................................................... 74
Figure 4.63. Primary breakage distribution functions after batch grinding of three
monosize fractions of HPGR feed; dB = 25.4 mm, ɸBall = 0.35 (Raw data at Table
C.5, Table C.11, Table C.17 in Appendix C, and Table D.5, Table D.11, Table D.17
in Appendix D) ......................................................................................................... 75
Figure 4.64. Primary breakage distribution functions after batch grinding of three
monosize fractions of HPGR feed; dB = 31.75 mm, ɸBall = 0.35 (Raw data at Table
C.6, Table C.12, Table C.18 in Appendix C, and Table D.6, Table D.12, Table D.18
in Appendix D) ......................................................................................................... 75

xxix
LIST OF SYMBOLS
Vmill Empty volume inside the mill (dm3)
ɸB Fraction of ball bed in the empty mill volume
εball Porosity of the ball bed expressed as fraction
Mball Mass of ball bed inside mill (kg)
ρball Density of ball (kg/dm3)
dB Ball size (mm)
fc Fraction of particle bed in the empty mill volume
εpowder Porosity of the particle bed expressed as fraction
ɸM Fraction of particle bed in the empty volume of ball bed
ρpowder Density of particle (kg/dm3)
Mpowder Mass of particle bed ground in ball mill (kg)
D Internal diameter of the mill (m)
d Largest ball diameter used in the mill (m)
Nc Critical speed of the mill (rpm)
ɸc Ratio of operating speed to critical speed of the mill
Si Breakage rate of size interval “i” in ball milling (min-1
)
bij Individual breakage distribution function
Bij Cumulative breakage distribution function
S1 Fast Breakage Rate of top size class “1” in ball milling (min-1
)
S2 Slow Breakage Rate of top size class “1” in ball milling (min-1
)
wi(t) Fraction or percentage of material of size “i” inside mill at time “t”
Pi(t) Cumulative fraction of the ground material passing below the upper
sieve size of the size interval “i” at time “t”
xi Upper sieve size of the size interval “i”
Eis Specific impact energy in drop weight testing (kWh/t)
M Mass of drop head (kg)
h0 Drop height (cm)

xxx
hf Height between bottom of the drop weight and surface of the anvil
after impact (cm)
Average mass of a particle in a given set of particles (g)
tn Percentage of material passing 1/nth
of the original feed size after
drop weight testing
d50 Median product size (µm)

1
CHAPTER 1
INTRODUCTION
1.1 General
Comminution is an essential, but an energy-inefficient part of mineral processing,
providing fine material for downstream beneficiation process. As an example,
energy consumption in comminution is estimated to be 29.3 % of the total mining
energy in USA. This is approximately equal to 1.14 % of the energy used in
industrial sector of USA, being more or less the same at other countries (Tromans,
2008). Moreover, the energy consumption in the comminution process will increase
as finer grinding is adopted due to subsequent downstream processes of low-grade
ores.
Size reduction processes also play a crucial role in cement production. These
processes mainly involve grinding raw feed that yields cement clinker at high-
temperature and grinding cement clinker which is the major constituent of cement.
Considering that about 40 % of the total energy expended in the cement-making
process goes into clinker grinding, there exists a need for lower energy usage in
cement clinker grinding in order to reduce high production costs and environmental
problems (Jankovic et al., 2004).
Increasing energy expenditure in size reduction processes pushes toward the
development of new energy-efficient comminution equipment. A recently-
developed machine to serve this purpose is the high pressure grinding rolls (HPGR)

2
which is commonly adopted to cement grinding circuits; gold, diamond and iron ore
crushing circuits. HPGR consists of a pair of rotating rolls through which a bed of
particles are nipped and ground with high external pressure exerted on the particle
bed. It is found that high interparticle stresses induced around the particles are
responsible for breakage, and this breakage mode makes HPGR more energy-
efficient than a ball mill at low reduction ratios (Fuerstenau et al., 1990; Fuerstenau
and Vazquez-Favela, 1997). It is also believed that HPGR is not only energy-
efficient at low reduction ratios, but it also induces cracks throughout the particle
due to high interparticle stresses acted on the particle bed, which facilitates
breakage in downstream size reduction processes (De, 1995; Fuerstenau et al.,
1999; Patzelt et al., 1995; Tavares, 2005).
1.2 Objective and Scope of the Thesis
In this study, breakage parameters of narrow size clinker samples taken from the
product end of an industrial-scale HPGR (HPGR product) were compared with the
feed end of HPGR (HPGR feed) in order to assess the extent to which breakage
parameters of the product end of HPGR is improved with respect to fresh feed
clinker. For this purpose, single particle breakage tests were performed to compare
breakage parameters of narrowly sized HPGR product and HPGR feed above 3.35
mm, while batch grinding tests were performed to compare fine sizes of HPGR
product and HPGR feed below 3.35 mm. Single particle breakage tests were
performed over six size fractions of clinker by means of drop-weight test. Each size
fraction was tested at four to six specific impact energies. The product size
distributions, experimental breakage probabilities and energy-dependent impact
breakage distribution functions of each narrow size fraction of HPGR product and
HPGR feed were compared at the same specific impact energy.
The batch ball mill experiments were performed with three size fractions of HPGR
product and HPGR feed using three different ball sizes. For each size fraction and
ball size combination tested, an equal mass of balls and material were put in the ball

3
mill, assuming that specific grinding energy applied to HPGR product and HPGR
feed would be the same. The resultant product size distributions, specific breakage
rate and primary breakage distribution functions of HPGR product and HPGR feed
were compared at each size fraction and ball size combination.

4
CHAPTER 2
BACKGROUND
2.1 Comminution Methods
Comminution methods can be broadly classified as single-particle comminution,
loose-bed comminution and particle-bed comminution (Fuerstenau and Vazquez-
Favela, 1997). Single-particle breakage can be achieved either by breaking particles
individually in a testing machine or by breaking it in a rigidly mounted roll mill
individually so that particles don’t interact with each other. The mode of loading in
single particle breakage could be impact, shear or slow compression. Loose-bed
comminution is achieved in grinding vessels where the energy is transferred to a
loose bed of particles by grinding media. The common example for loose-bed
comminution is the ball mill where the energy is transferred to particles by tumbling
steel balls. This transfer mode makes loose-bed comminution the most inefficient
size reduction method, since there exist non-productive collision events between
ball and ball, ball and liner, particle and particle. Moreover, frictional losses could
occur during tumbling motion of grinding media and particle bed. Particle-bed
comminution is achieved by externally stressing a bed of particles. This external
stress induces high interparticle stresses within the bed, which is responsible for the
breakage of the particles. The inefficiency in particle-bed comminution arises from
frictional losses due to the interaction between particles, and compaction or
briquetting of fines produced (Fuerstenau et al., 2004).

5
2.1.1 High Pressure Grinding Rolls
A recently developed equipment for particle-bed comminution is the High Pressure
Grinding Rolls (HPGR) which was invented in 1979. It was first developed by
KHD®
and Polysius® in Germany (Fuerstenau et al., 1993; Gutsche et al., 1993;
Schönert, 1988). At the beginning, it was utilized on industrial scale for the grinding
of clinker and raw material in cement production. Since then, HPGR has been
adopted into various size reduction processes including gold ore crushing prior to
heap leaching; diamond ore crushing; iron ore pre-pelletizing, etc.
Breakage in HPGR is accomplished by passing the material through two counter-
rotating rolls. One of the rolls rotates on a fixed axis while the other moves linearly
with external pressure applied to the movable roll. The material is fed into the gap
between the rolls through a feed hopper. As the material is nipped into the gap, it is
compacted by external pressure. This external pressure on the particle bed induces
high interparticle stresses on each particle, which causes breakage. It is estimated
that these stresses are 40 to 60 times the external pressure applied (Schönert, 1988).
The operating principle of the HPGR is illustrated in Figure 2.1. As shown in Figure
2.1, three zones form during breakage in HPGR. The first zone is the acceleration
zone where particles are nipped through the gap into the breakage zone. In this
zone, densification of the particle bed occurs. Then, the bed is compacted and
comminuted in the compression zone due to interparticle stresses acted on each
particle. Lastly, the material bed expands and leaves the gap at the dilation zone
(De, 1995).
The breakage behavior inside HPGR and the resultant product size distribution
depend upon operating and material variables such as:
- External grinding pressure applied to the rolls
- Roll diameter, roll speed, surface pattern of rolls

6
- Operating gap distance between rolls
- Particle size distribution, chemical composition and moisture content of the feed
Figure 2.1. Operating principle of HPGR (De, 1995)
2.1.2 Ball Mill
The most commonly used size reduction equipment in mineral processing and
cement production is the ball mill. It is a cylindrical vessel containing steel balls
and the material to be ground. It can be operated in either dry or wet condition.
Grinding is performed by rotating the mill such that the material is comminuted by
the motion of loose grinding medium. When the mill is rotated at low rotational
speeds, the balls move frequently in an inclined path where the balls are emerging,
rolling down, and getting back to the surface, referred to as cascading state. At high
rotational speeds, more balls are ejected from the ball bed, known as cataracting
state. In the former case, the material bed is expanded between ball bed, and
breakage is achieved by a series of collisions between balls. In the latter case,
ejected balls fall onto ball bed, nipping and stressing the particles in between.

7
The complete explanation of grinding behavior in a ball mill is complex. It depends
on material properties, mill environment, and operating variables such as:
- Physical and chemical characteristics of the feed such as particle size distribution,
chemical composition of feed, etc.
- Ball diameter and ball density
- Mill diameter, mill length and lifter design
- The fraction of feed material filling the mill volume (powder loading)
- The fraction of balls filling the mill volume (ball loading)
- Rotational speed of the mill
- Dry or wet grinding condition
- Mass transport and hold-up
- Pulp density for wet grinding
It is necessary to define some test variables in order to describe the ball mill
grinding conditions. In a ball mill, ball loading, ɸB, is defined as the fraction of the
volume of ball bed in the mill volume, including porosity inside the ball bed. It is
formulated as
ɸB = (Mb ρ
b ) Vm 1 (1-εb ) (1)
where Mball is the mass of balls (kg), ρball is the density of balls (kg/dm3), Vmill is the
empty volume inside the mill and εball is the porosity of the ball bed, expressed as
fraction. εball values for mono-size ball bed is generally taken as 0.4. Similarly,
powder loading, fc, is defined as the fraction of the volume of feed material in the
mill volume, including porosity inside powder bed. It is defined as
fc= (Mp ρ
p ) Vmill (1 (1-εp ) (2)

8
where Mpowder is the mass of powder to be ground (kg), ρpowder is the density of
powder (kg/dm3), Vmill is the empty volume inside the mill (dm
3) and εpowder is the
porosity of the powder bed, expressed as fraction. Knowing the true density of the
powder, εpowder can be estimated easily. ɸB and fc can be related with each other by
defining the fraction of powder volume in the empty volume between balls, ɸM, by;
ɸM=fc (εball ) (3)
The number of balls and the weight of the feed material added to the batch mill can
be computed easily after selecting ɸM and ɸB.
Critical speed, Nc, is also another variable affecting the mill performance. It is
defined as the rotational speed of the mill above which balls start to centrifuge
around the mill case (Austin et al., 1984). Thus, the tumbling motion of the balls
does not occur above critical speed, i.e., no breakage occurs. The critical speed
depends on mill diameter and ball diameter. It is expressed as;
N (rpm) =42.2 √D-d (4)
where D is the internal mill diameter and d is the maximum ball diameter in meters.
Rotational mill speed is determined as a fraction of critical speed, ɸc.
2.2 Comminution Models
It is necessary to adopt accurate mathematical models into comminution systems so
as to describe the milling operations fully. The models constructed should
determine optimal conditions and circuit designs to use as little energy as possible
while providing better product specifications suitable for downstream processes. In
developing comminution models, the main purpose is to develop a relationship
between feed and product size distribution. A popular method used for this purpose

9
is population balance modeling (PBM). It basically explains the breakage of any
monosize interval based on the average of individual breakage events in a mill.
Then, for a number of repetitive steps of breakage or a time of breakage,
accumulation or depletion of each size interval can be estimated which eventually
leads to estimation of overall product size distribution. There are mainly two
approaches for PBM of size reduction. The first one is the matrix model where each
breakage event is assigned to a stage, and shown in a matrix form. Details of the
matrix model can be found in the literature (Lynch, 1977). The kinetic model, on
the other hand, accepts breakage as a continuous process, and implements time-
dependent process characteristics into the model. The difference between kinetic
model and matrix model is that time is explicitly defined in the former while it is
implicitly defined in the latter. For both models, two parameters should be
determined. First, the fraction for each size interval that is to be broken should be
found. This fraction is called the selection function in the matrix model or specific
breakage rate in the kinetic model. The broken fraction then yields a progeny size
distribution, which is called the breakage function in the matrix model and breakage
distribution function in the kinetic model.
2.2.1 Breakage Parameters of the Kinetic Model
The specific rate of breakage, Si, is defined as the mass fraction of material in size
“i” broken per unit time. For a monosize interval of size “i”, it was found that rate
of disappearance of size “i” follows first-order law for most of the materials tested
(Austin et al., 1984):
dwi(t) d(t) =-Si wi(t) (5)
where wi(t) is the mass fraction retained inside the mill at time t. Solving Equation 5
for time t will yield:

10
wi(t)=wi(0) e p (-Si t) (6)
where wi(0) is the mass fraction retained inside the mill before grinding. Si value
can be estimated by fitting experimental wi(t)-t pairs to Equation 6. Also, Si could
be determined graphically by transforming Equation 6 to:
log wi(t) wi(0) = – Si t 2.3 (7)
Then, plotting log[wi(t)/wi(0)] versus time gives the slope of (-Si/2.3).
Although breakage rates are considered to be first-order, non-linearity in breakage
rates might also be observed (Austin and Bagga, 1981; Austin et al., 1982). The
non-linear breakage encountered could be defined as first-order breakage with
subsequent accelerated or decelerated first-order breakage as shown in Figure 2.2.
The non-linearity in breakage rates could arise from environmental effects inside
ball mill or material effects or complex interaction of both. A number of possible
reasons for non-linearity are given by Austin et al. (1984) as the following:
-Stronger fractions might increase in unbroken material as grinding continues.
-The unbroken material might not get broken with successive impacts, yet, get
weakened with time.
-Harder component might be liberated which facilitates the grinding of softer
component.
-Fines accumulated in the mill pack around coarse particles, preventing breakage of
coarse sizes.
-Fines accumulated in the mill adversely affect the tumbling action inside mill,
which results in a decrease in energy input and number of impacts.
-Fines might agglomerate inside the mill forming large particles as grinding
continues.

11
Figure 2.2. Non-linear deviations observed in breakage rates (Bilgili et al., 2006)
The other breakage parameter in kinetic modeling is the primary breakage
distribution function. For a given size interval, it is defined as the progeny size
distribution of broken fragments at primary breakage. Considering that particles
might re-break as grinding proceeds, primary distribution function should be
estimated at the point where no re-breakage of particles occurs. Elements of the
breakage distribution function are shown as bij which is the mass fraction of the
broken fragments in size interval “j” which appears in size interval “i”, where size
“i” is smaller than size “j”. The breakage distribution matrix is illustrated in Table
2.1 for a set of N size intervals where 1 is the top size interval and N is the residue.

12
Table 2.1. Breakage distribution functions in a matrix form
j=1 j=2 j=3 . j=N-1 j=N
i=1 0 0 0 . 0 0
i=2 b21 0 0 . 0 0
i=3 b31 b32 0 . 0 0
. . . . . . .
. . . . . . .
i=N bN1 bN2 bN3 . bN(N-1) 0
By definition, the sum of each column is equal to 1.
∑ bij=1Ni=j+1 (8)
Another form of representation for the primary breakage distribution is the
cumulative breakage distribution function, Bij, which is the cumulative mass
fraction of material broken from size “j” which appears in size intervals less than
the upper limit of the size interval “i”:
Bij=∑ bkjNk=ii j
(9)
The transformation between B and b values can be shown as:
bij=Bij-B(i+1)j (10)
and, by definition:
bN =B j , B(j+1)j =1 (11)

13
In principle, B values for monosize feeds should be estimated from short time
grinding data in order to prevent re-breakage of fragments. However, it is difficult
to get accurate size distribution at small degrees of breakage. As a result, a method
named the BII method was developed based on the solution of the batch grinding
equation which was based on compensation condition and claimed to correct for
secondary breakage (Austin et al., 1984). Then, for a monosize feed having a size
index of 1, Bi1 can be estimated as:
( -Pi(0)) ( -Pi(t)) ( -P2(0) ) ( -P2(t)) (12)
where Pi(t) and Pi(0) are the cum. mass fraction passing upper size of the size
interval “i” at time t and 0, respectively. This equation is known as the BII method.
Moreover, Bi1 values can be fitted to the following functional form:
Bi1=Ф1( i-1 1)+(1-Ф1)( i-1 1)
(13)
where xi is the upper size limit of size interval “i”, Ф1, and are functional
parameters. Plotting left-hand side of Equation 13 against (xi-1/x1) gives sum of two
straight lines. As given in Figure 2.3, the parameters of and Ф1 is the slope and
intercept of the small end of the plot, respectively. After estimating and Ф1, can
be estimated by rearranging Equation 13 such that:
Bi1
-Ф1( i-1 1) (1-Ф1)=( i-1 1)
(14)
plotting left-hand side of Equation 14 against (xi-1/x1) in log-log scale will give the
slope of .

14
Figure 2.3. Graphical procedure for estimating parameters of and Ф1 in functional
form of Bi1
2.2.2 Single Particle Breakage Tests
Grinding in a ball mill involves a complex interaction between material effects,
stressing conditions and environmental effects inside the mill which, in overall,
determines the product size distribution and product quality. In this aspect, single
particle breakage tests provide insight to understand breakage process in microscale
event basis. Single particle breakage tests are classified with respect to the mode of
loading: Single particle will be broken either by impact or compression or shearing.
The following can be estimated from single particle breakage data:
-Functional relationship between specific impact energy and product size
distribution (Napier-Munn et al., 1996)
-Specific fracture energy of a single particle (J/g) and specific fracture energy or
fracture strength distribution of a given material (Bourgeois et al., 1992; Tavares
and King, 1998; Tavares, 2007)

15
-Breakage probability of particles as a function of stressing energy or specific
stressing energy applied (Aman et al., 2010; Krogh, 1980; Tuzcu et al., 2011)
-Effect of particle size, shape, material physical properties and modes of loading on
particle breakage characteristics (Tavares, 2007)
2.2.2.1 Drop Weight Testing
One of the most commonly used single-particle impact testing method is the drop
weight testing. It provides extended input energy range, shorter test duration,
extended particle size range and possibility to conduct particle-bed breakage studies
(Napier-Munn et al., 1996). However, the experimental procedure becomes tedious
as the feed size decreases such that a large number of particles should be broken to
get a sufficient weight of sample to be analyzed for size distribution.
As illustrated in Figure 2.4, the test consists of stressing each particle placed on an
anvil by dropping a steel weight from a certain height. The weight of the drop head
and drop height can be adjusted with respect to the energy input, where the weight
of drop head can be up to 50 kg, and the standard range of drop height is between
0.05 and 1 m. The specific impact energy applied to an average weight of the
particle in a given set of particles is the potential energy of drop head with respect
to surface of the anvil, assuming that frictional losses occurred during the falling
motion of drop head are negligible. Then, the specific impact energy applied to a
given set of particles (Eis) can be calculated as:
Eis= 0.0272 M (h0-hf) m (15)
where Eis is the specific impact energy applied (kWh/t), M is the mass of the drop
weight (kg), h0 is the initial drop height (cm) measured from the surface of anvil to
the bottom of the drop head and m is the average weight of a particle in the set of
particles tested (g). Also, it may be required to subtract an average offset height (hf)

16
from “h0” term in Equation 15 for a more precise estimation of specific impact
energy although this term is relatively small with respect to initial drop height. In
this case, offset height is defined as the height (cm) between bottom of the drop
weight and surface of the anvil after impacting the particle. It should be noted that
average offset height can only be calculated after breaking all particles in a given
test. Thus, precise estimation of Eis is possible at the end of the experiment.
It has been observed that drop weight might rebound at high impact energies. This
rebound energy is not directly measured, yet it is known to be small relative to the
input energy. This might be eliminated by using different combination of drop
weight and drop height that gives the same input energy.
Figure 2.4. Schematics of a drop weight tester
The key concept in the drop weight test is to estimate product size distribution as a
function of specific impact energy. In order to model this breakage function, a set of
cubic spline curves is employed to describe the product size distribution obtained by
breakage of a set of particles in narrow size intervals at various specific impact
energies. These curves are referred to as one-parameter family curves (Napier-

17
Munn et al., 1996). The one-parameter is defined as t10, which is the cumulative
percentage of material passing 1/10th
of the original size. Then, tn which is the
percentage passing 1/nth
of the original size are plotted against the corresponding
t10 values, as shown in Figure 2.5. As each tn and t10 is unique for a given input
specific energy, each vertical line in Figure 2.5 represents the product size
distribution at a given t10 value. Therefore, the product size distribution and impact
breakage distribution function can be estimated by calculating t10 from a given
specific impact energy. Moreover, the relationship between specific impact energy
and t10 for each narrow size fraction might be fitted to the following functional
form (Napier-Munn et al., 1996):
t10 = A 1-e p(-b Eis) (16)
where A and b are the impact breakage parameters to be fitted.
Figure 2.5. One-parameter family curves
In addition to functional relationship between product size distributions (or impact
breakage distribution functions) and various specific energy levels, breakage
0
10
20
30
40
50
60
70
80
90
100
10 30 50 70 90
tn (
%)
t10 (%)
t2
t4
t10
t25
t50
t75
t100

18
probability and specific fracture energy distribution might be estimated in drop-
weight testing. These two concepts are analogous to specific breakage rate in ball
milling. Considering a sample of a given size, the specific fracture energy
distribution is obtained by measuring the primary specific fracture energy (the
energy per unit mass required up to the first instant of failure) of each particle in the
sample, then calculating the cumulative probability distribution of specific fracture
energy. The breakage probability is calculated by measuring the cumulative
percentage of particles broken either in mass basis or number basis for a given
specific impact energy. Breakage probability could be easily estimated in
conventional drop weight testers, while primary fracture energy is measured
through a specialized drop weight device called UFLC (Ultra Fast Load Cell).
Determination of specific fracture energy of a particle is beyond the scope of this
work, and the details to estimate specific fracture energy and specific fracture
energy distribution in UFLC are given in the literature (Bourgeois et al., 1992;
Bourgeois, 1993; Tavares and King, 1998; Tavares, 2007).
2.3 Portland Cement Clinker
Portland cement clinker is the chemically-transformed product of raw materials
including calcium oxide, aluminium oxide, silica, and iron oxides in varying
proportions. It is a heterogeneous product consisting mostly of C3S [(CaO)3·SiO2],
C2S [(CaO)2·SiO2], C3A [(CaO)3·Al2O3], and C4AF [(CaO)4·Al2O3·Fe2O3] while
the minor compounds are calcium oxide, magnesium oxide, alkali sulfates and other
compounds incorporating them. Portland cement clinker is a basic constituent for
Portland cement which is commonly used to produce concrete and mortar.
The first step in the production of cement clinker is to prepare a mixture of
limestone-clay minerals to ensure a certain proportion of calcium oxide, aluminium
oxide, silica and iron oxides in a raw feed. Then, the raw feed is crushed and ground
down to a certain size and burned at high temperatures (up to 1450°C). This
process, called sintering makes the raw feed transform into clinker. After sintering,

19
the clinker is ground again with gypsum. The ground product at the end of this
process is Portland cement. The conceptual flowsheet for cement production is
shown in Figure 2.6.
Figure 2.6. Conceptual flowsheet of cement production
2.3.1 Cement Clinker Grinding
The main objective for cement clinker grinding is to increase the specific surface
area of clinker to ensure fast hydration of cement when mixed with water.
Regarding this, the cement clinker is ground from 80 % passing between 10-20 mm
to 100 % passing 90 µm (Jankovic et al., 2004). Normal conventional grinding
equipment is a two-compartment ball mill. The compartments in the ball mill are
separated by a diaphragm that allows only particles finer than a certain size to pass
through to the second compartment. Then, coarse clinker is ground in the first
compartment while the fine grinding is done in second compartment. However, in
some plants, these circuits have been replaced with various HPGR-integrated ball

20
mill arrangements as these circuits are found to be more energy-efficient than the
conventional cement grinding circuits. Patzelt (1992) described four different
HPGR-ball mill arrangements in cement grinding:
-Pre-grinding: HPGR and ball mill is operated in open circuit.
-Hybrid-Grinding: Raw feed of clinker, a split of the HPGR product and the
oversize of the ball mill product is fed into HPGR. The ball mill is in closed circuit.
-Combi-Grinding: The oversize of HPGR product and raw feed of clinker is fed into
HPGR. The undersize of HPGR product is sent to ball mill which might be either in
open or closed circuit.
-Finish-Grinding: The HPGR product undersize is the final product. Yet, it is not
commonly used for cement grinding. Instead, it is adapted to grinding of raw feed,
and blast furnace slag.
The mode of operation of each HPGR-ball mill circuit is illustrated in Figure 2.7
below:
Figure 2.7. The modes of operation for cement grinding circuits (Patzelt, 1992)

21
2.4 Utilization of HPGR Prior To Ball Mill
In the literature, utilizing HPGR prior to ball mill was generally found to consume
less energy than conventional ball mill grinding for the same degree of product
fineness. Patzelt (1992) stated that various HPGR-ball mill arrangements use up to
30 % less energy than ball mills. Also, case studies obtained from cement grinding
plants showed that use of HPGR with ball mill where both were in closed circuit
use 55-70 % less energy than a conventional ball mill circuit (Von Seebach et al.,
1996). The energy-efficiency of HPGR-ball mill arrangements were linked to the
efficient breakage of particles in HPGR due to high interparticle stresses acted, and
weakening of particles due to cracks imparted by HPGR which resulted less energy
usage at downstream ball mills.
Fuerstenau et al. (1990) compared the reduction ratios and product size distributions
of quartz, dolomite, limestone and hematite in ball milling and single particle high
pressure roll mill comminution on an equal energy consumption basis. The results
showed that high pressure roll mill is more energy-efficient than ball milling at low
reduction ratios for the selected minerals and the range of energy levels tested.
These results supported the use of HPGR prior to ball mill for an initial low degree
of size reduction.
Fuerstenau and Vazquez-Favela (1997) compared the relative energy efficiency for
grinding narrowly-sized dolomite in hybrid grinding with respect to ball mill
grinding for the same reduction ratio basis. The hybrid grinding experiments
involved grinding material in laboratory-scale HPGR and then in ball mill where
both HPGR and ball mill were in open circuit. It was found that hybrid grinding
became more energy-efficient than ball mill at the same reduction ratio. This result
was linked to weakening of particles in HPGR such that less energy was used in
subsequent ball milling step.

22
A detailed investigation for optimal use of various HPGR-ball mill arrangements on
coal grinding was investigated by De (1995). In this research, it was shown that the
utilization of HPGR prior to ball mill was more energy-efficient than ball mill for a
given percentage of fines where HPGR and ball mill were in open circuit. However,
any energy savings could reverse upon a threshold energy value in HPGR due to
compaction and briquetting of coal bed which caused significant energy losses in
terms of size reduction. Moreover, it was shown that high-pressure roll mill product
exhibited faster rates of disappearance of a given size than fresh feed of coal when
both are ground in a ball mill. This was linked to fracturing of coal by HPGR which
in turn yielded faster grinding kinetics in subsequent ball milling.
Tavares (2005) studied particle weakening of copper and gold ores in high pressure
grinding rolls. This study consisted of comparing primary fracture energy
distribution and mean mass-specific fracture energies of narrowly-sized HPGR,
hammer mill, and roll crusher products estimated by means of single particle
breakage tests. Results show that there is a statistically significant weakening of
HPGR product at coarse particles with respect to hammer mill and roll crusher
products.
Fuerstenau et al. (1999) investigated the effect of ball size on the energy efficiency
of pre-grinding of -3.4+2.4 mm dolomite. The pre-grinding experiments involved
grinding material firstly in laboratory-scale HPGR, then in ball mill where both
HPGR and ball mill are in open circuit. It was found that the reduction ratio of
HPGR product in ball mill is higher at smaller ball sizes while the reduction ratio of
fresh feed of dolomite in ball mill is higher at larger ball sizes. This result indicated
that HPGR product contains internal damage to allow for the use of smaller balls.
Moreover, HPGR product was claimed to have higher breakage rates than fresh
feed in ball milling due to weakening imparted to particles by HPGR.

23
CHAPTER 3
EXPERIMENTAL MATERIAL AND METHODS
3.1 Material
Portland cement clinker produced by Baştaş Cement Plant was used in this study.
Samples of clinker were taken from the feed and product ends of an open-circuit
industrial-scale HPGR operated at a pressure of 100 bar. Samples of HPGR product
and HPGR feed weighed approximately 90 kg. Narrow size fractions following
nearly √2-order were obtained by screening the whole samples down to 106 µm.
The size distributions of HPGR feed and HPGR product are shown in Figure 3.1.
True density of samples was measured with a helium pycnometer in the Central
Laboratory of METU and was found to be 3.19 g/cm3.
Figure 3.1. Particle size distributions of HPGR product and HPGR feed (Raw data
at Table A.1 and Table A.2 in Appendix A)

24
3.2 Methods
The experimental methods involved single particle breakage tests and batch ball
mill grinding tests with narrowly-sized samples of HPGR product and HPGR feed.
Single particle breakage tests were performed with size fractions above 3.35 mm
while batch ball mill grinding tests were conducted with size fractions below 3.35
mm. Screen analyses of products after single particle breakage tests and batch
grinding tests were carried out using dry sieving with a set of sieves progressing in
√2-order.
Drop weight test was utilized for single particle breakage tests. For each test,
particles were stressed one by one with the drop head. Samples of HPGR product
and HPGR feed taken from each size fraction were tested at the same specific
impact energy. For each size fraction, 4-6 specific impact energy values were used.
Two laboratory drop weight testers were used, a larger one having a drop head of 20
kg, and the smaller one having a drop weight of 2 kg. Moreover, drop heads of 1.24
kg and 0.40 kg were used with small drop weight tester to achieve low specific
energy levels where necessary. The specific energy levels and experimental
conditions for each size fraction of HPGR product and HPGR feed tested are given
in Table 3.1 through Table 3.12. Size fractions of HPGR product and HPGR feed
coarser than 25.4 mm were not compared since the number of such particles was
insufficient in HPGR product to perform drop weight tests at various energy levels.
Also, it should be noted that dust or material losses could occur during drop weight
test and the subsequent screen analysis. In this case, care was taken during the
experiment for minimizing the mass losses, in order to obtain correct test results.

25
Table 3.1. Experimental conditions for drop weight testing of -4.7+3.35 mm of
HPGR product
-4.7+3.35 mm (HPGR product)
Specific Impact Energy
(kWh/t)
0.54 1.09 2.18 3.32
Number of Particles 487 392 381 382
Initial Sample Weight (g) 48.77 38.95 38.28 38.23
Final Sample Weight after
Screening (g) 48.55 38.83 38.13 38.20
Weight of the Drop Head (kg) 0.40 1.24 1.24 2.00
Drop Height (cm) 5.0 3.2 6.5 6.1
Drop Energy (J) 0.20 0.39 0.79 1.20
Table 3.2. Experimental conditions for drop weight testing of -4.7+3.35 mm of
HPGR feed
-4.7+3.35 mm (HPGR feed)
Specific Impact Energy
(kWh/t)
0.54 1.09 2.18 3.32
Number of Particles 309 324 320 344
Initial Sample Weight (g) 31.34 33.02 32.19 35.49
Final Sample Weight after
Screening (g) 31.04 32.65 31.81 35.13
Weight of the Drop Head (kg) 0.40 1.24 1.24 2.00
Drop Height (cm) 5.0 3.3 6.5 6.3
Drop Energy (J) 0.20 0.40 0.79 1.24

26
Table 3.3. Experimental conditions for drop weight testing of -6.35+4.7 mm of
HPGR product
-6.35+4.7 mm
(HPGR product)
Specific Impact Energy (kWh/t)
0.23 0.45 0.88 1.74
Number of particles tested 228 278 268 277
Initial Sample Weight (g) 54.83 64.08 61.57 64.05
Final Sample Weight after
Screening (g) 54.25 63.43 61.23 63.97
Weight of the
Drop Head (kg) 0.40 1.24 1.24 2.00
Drop Height (cm) 5.0 3.1 6.0 7.4
Drop Energy (J) 0.20 0.38 0.73 1.45
Table 3.4. Experimental conditions for drop weight testing of -6.35+4.7 mm of
HPGR feed
-6.35+4.7 mm
(HPGR feed)
Specific Impact Energy (kWh/t)
0.23 0.45 0.88 1.74
Number of particles tested 266 314 320 330
Initial Sample Weight (g) 63.92 75.93 77.10 77.53
Final Sample Weight after
Screening (g) 63.63 75.10 76.37 77.06
Weight of the Drop Head
(kg) 0.40 1.24 1.24 2.00
Drop Height (cm) 5.1 3.2 6.3 7.5
Drop Energy (J) 0.20 0.39 0.77 1.47

27
Table 3.5. Experimental conditions for drop weight testing of -9.53+6.35 mm of
HPGR product
-9.53+6.35 mm
(HPGR product)
Specific Impact Energy (kWh/t)
0.10 0.22 0.55 0.92 2.21 4.35
Number of
particles tested 181 89 85 82 82 82
Initial Sample
Weight (g) 101.49 54.83 50.25 54.79 49.39 47.83
Final Sample
Weight after Screening
(g)
101.48 54.74 50.12 54.55 49.02 47.12
Weight of the Drop
Head (kg) 0.40 1.24 1.24 2.00 2.00 1.24
Drop Height (cm) 5.0 4.0 9.7 11.3 24.5 75.2
Drop Energy (J) 0.20 0.49 1.18 2.22 4.81 9.15
Table 3.6. Experimental conditions for drop weight testing of -9.53+6.35 mm of
HPGR feed
-9.53+6.35 mm
(HPGR feed)
Specific Impact Energy (kWh/t)
0.10 0.22 0.55 0.92 2.21 4.35
Number of
particles tested 215 230 213 213 219 210
Initial Sample
Weight (g) 132.55 147.66 135.61 139.00 137.25 127.89
Final Sample
Weight after
Screening (g)
131.85 147.28 134.50 138.39 135.10 125.65
Weight of the Drop
Head (kg) 0.40 1.24 1.24 2.00 2.00 1.24
Drop Height (cm) 5.7 4.2 10.4 11.0 25.4 78.6
Drop Energy (J) 0.22 0.51 1.27 2.16 4.98 9.56
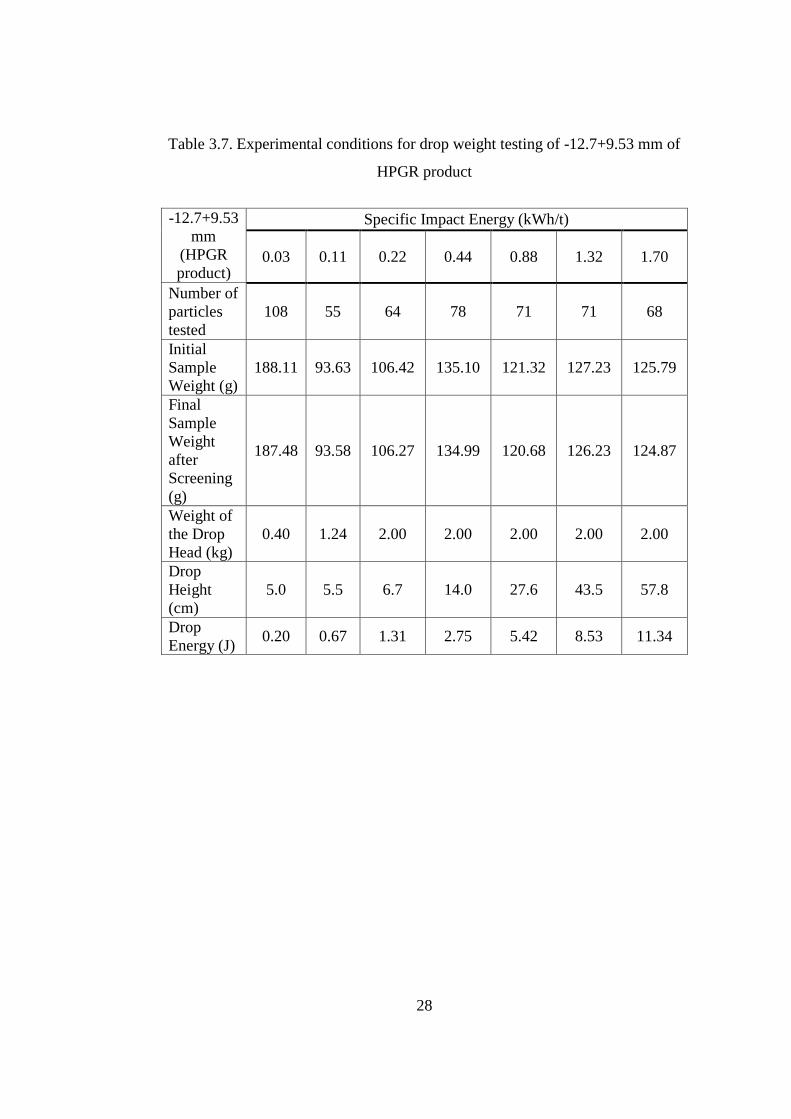
28
Table 3.7. Experimental conditions for drop weight testing of -12.7+9.53 mm of
HPGR product
-12.7+9.53
mm
(HPGR
product)
Specific Impact Energy (kWh/t)
0.03 0.11 0.22 0.44 0.88 1.32 1.70
Number of
particles
tested
108 55 64 78 71 71 68
Initial
Sample
Weight (g)
188.11 93.63 106.42 135.10 121.32 127.23 125.79
Final
Sample
Weight
after
Screening
(g)
187.48 93.58 106.27 134.99 120.68 126.23 124.87
Weight of
the Drop
Head (kg)
0.40 1.24 2.00 2.00 2.00 2.00 2.00
Drop
Height
(cm)
5.0 5.5 6.7 14.0 27.6 43.5 57.8
Drop
Energy (J) 0.20 0.67 1.31 2.75 5.42 8.53 11.34

29
Table 3.8. Experimental conditions for drop weight testing of -12.7+9.53 mm of
HPGR feed
-12.7+9.53
mm
(HPGR
feed)
Specific Impact Energy (kWh/t)
0.03 0.11 0.22 0.44 0.88 1.32 1.70
Number of
particles
tested
103 132 191 197 193 154 183
Initial
Sample
Weight (g)
195.10 249.49 334.95 370.55 342.92 277.97 343.47
Final
Sample
Weight
after
Screening
(g)
194.96 249.16 333.68 368.67 340.41 276.35 339.04
Weight of
the Drop
Head (kg)
0.40 1.24 2.00 2.00 2.00 2.00 2.00
Drop
Height
(cm)
5.0 6.1 7.1 15.2 28.7 43.8 58.7
Drop
Energy (J) 0.20 0.74 1.39 2.98 5.63 8.59 11.52
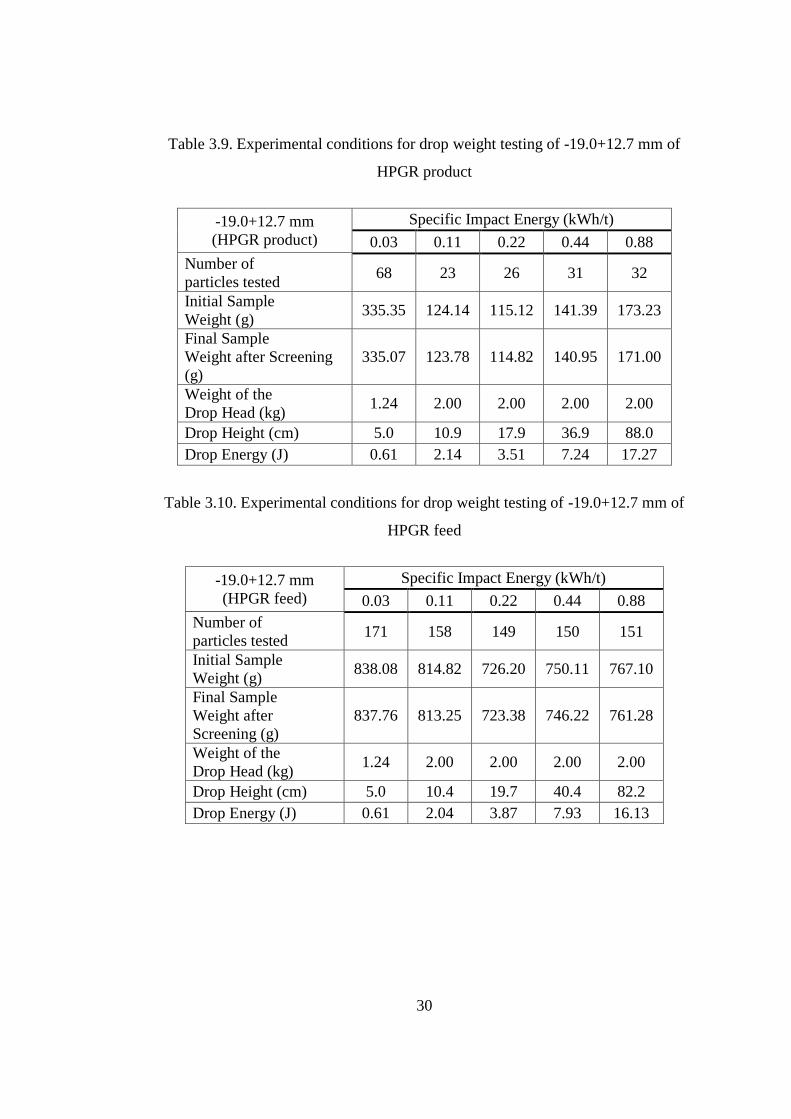
30
Table 3.9. Experimental conditions for drop weight testing of -19.0+12.7 mm of
HPGR product
-19.0+12.7 mm
(HPGR product)
Specific Impact Energy (kWh/t)
0.03 0.11 0.22 0.44 0.88
Number of
particles tested 68 23 26 31 32
Initial Sample
Weight (g) 335.35 124.14 115.12 141.39 173.23
Final Sample
Weight after Screening
(g)
335.07 123.78 114.82 140.95 171.00
Weight of the
Drop Head (kg) 1.24 2.00 2.00 2.00 2.00
Drop Height (cm) 5.0 10.9 17.9 36.9 88.0
Drop Energy (J) 0.61 2.14 3.51 7.24 17.27
Table 3.10. Experimental conditions for drop weight testing of -19.0+12.7 mm of
HPGR feed
-19.0+12.7 mm
(HPGR feed)
Specific Impact Energy (kWh/t)
0.03 0.11 0.22 0.44 0.88
Number of
particles tested 171 158 149 150 151
Initial Sample
Weight (g) 838.08 814.82 726.20 750.11 767.10
Final Sample
Weight after
Screening (g)
837.76 813.25 723.38 746.22 761.28
Weight of the
Drop Head (kg) 1.24 2.00 2.00 2.00 2.00
Drop Height (cm) 5.0 10.4 19.7 40.4 82.2
Drop Energy (J) 0.61 2.04 3.87 7.93 16.13

31
Table 3.11. Experimental conditions for drop weight testing of -25.4+19.0 mm of
HPGR product
-25.4+19 mm
(HPGR product)
Specific Impact Energy (kWh/t)
0.01 0.05 0.11 0.22 0.59 0.88
Number of
particles tested 26 26 24 11 15 13
Initial Sample
Weight (g) 327.34 368.96 325.63 151.65 194.68 170.65
Final Sample
Weight after
Screening (g)
327.06 368.36 324.13 151.24 192.72 168.78
Weight of the
Drop Head (kg) 1.24 2.00 2.00 2.00 20.00 20.00
Drop
Height (cm) 5.2 13.0 27.4 55.8 14.1 21.2
Drop Energy (J) 0.63 2.55 5.38 10.95 27.66 41.59
Table 3.12. Experimental conditions for drop weight testing of -25.4+19.0 mm of
HPGR feed
-25.4+19 mm
(HPGR feed)
Specific Impact Energy (kWh/t)
0.01 0.05 0.11 0.22 0.59 0.88
Number of
particles tested 45 30 26 25 26 28
Initial Sample
Weight (g) 655.94 402.59 385.10 304.01 335.81 338.46
Final Sample
Weight after
Screening (g)
655.20 402.09 382.71 302.22 335.03 334.94
Weight of the
Drop Head (kg) 1.24 2.00 2.00 2.00 20.00 20.00
Drop Height (cm) 5.0 12.3 30.0 50.0 14.0 19.5
Drop Energy (J) 0.61 2.41 5.89 9.81 27.47 38.26
Batch ball mill grinding tests were performed with a laboratory-scale ball mill
having an inner diameter of 18.8 cm and a length of 17.7 cm. Three monosize
fractions (-3.35+2.36 mm, -2.36+1.7 mm and -1.7+1.18 mm) of HPGR feed and
HPGR product were chosen for batch ball mill tests. For each size fraction, three

32
different monosize balls (19.05 mm, 25.4 mm and 31.75 mm) were used. Sizes
below 1.18 mm were not used in this study since there was insufficient amount
below 1.18 mm in HPGR feed to perform batch grinding at the defined ball load
and powder loading conditions.
For comparison purposes, the mass of balls and the mass of material were kept
constant in grinding of each size fraction so that the power draw of the mill and the
specific grinding energy would not differ significantly for any ball size and material
size combination. Experimental grinding conditions for the batch ball mill tests are
given in Table 3.13 through Table 3.15.
Samples were ground for cumulative times of 0.5, 1, 2, 4 and 8 minutes for
-3.35+2.36 mm while cumulative grinding times of 0.25, 0.5, 1, 2, 4 and 8 min.
were chosen for -2.36+1.7 and -1.7+1.18 mm. Breakage distribution functions were
estimated by the BII method using product size distributions at 0.5 min. grind time
for -3.35+2.36 mm and 0.25 min for -2.36+1.7 mm and -1.7+1.18 mm size
fractions. Breakage rates were estimated using the top size fraction remaining at all
cumulative times.

33
Table 3.13. Experimental conditions for batch ball mill grinding of HPGR product
and HPGR feed (dB = 19.05 mm)
dB (mm)
19.05 mm
Size Fraction
-3.35 mm+2.36 mm -2.36 mm+1.7 mm -1.7 mm+1.18 mm
HPGR
product
HPGR
feed
HPGR
product
HPGR
feed
HPGR
product
HPGR
feed
ɸB 0.35 0.35 0.35 0.35 0.35 0.35
ɸM 0.8 0.91 0.8 0.8 0.8 0.8
fc 0.11 0.13 0.11 0.11 0.11 0.11
Number
of balls 285 285 285 285 285 285
Mball (kg) 8.1 8.1 8.1 8.1 8.1 8.1
Mpowder
(kg) 0.720 0.720 0.633 0.633 0.633 0.633
Operating
Speed
(rpm)
60 60 60 60 60 60
Nc (rpm) 103 103 103 103 103 103
ɸc (%) 58 58 58 58 58 58
εball 0.4 0.4 0.4 0.4 0.4 0.4
εpowder 0.59 0.64 0.64 0.64 0.64 0.64

34
Table 3.14. Experimental conditions for batch ball mill grinding of HPGR product
and HPGR feed (dB = 25.4 mm)
dB (mm)
25.4 mm
Size Fraction
-3.35 mm+2.36 mm -2.36 mm+1.7 mm -1.7 mm+1.18 mm
HPGR
product
HPGR
feed
HPGR
product
HPGR
feed
HPGR
product
HPGR
feed
ɸB 0.35 0.35 0.35 0.35 0.35 0.35
ɸM 0.8 0.91 0.8 0.8 0.8 0.8
fc 0.11 0.13 0.11 0.11 0.11 0.11
Number of
balls 120 120 120 120 120 120
Mball (kg) 8.1 8.1 8.1 8.1 8.1 8.1
Mpowder (kg) 0.720 0.720 0.633 0.633 0.633 0.633
Operating
Speed (rpm) 60 60 60 60 60 60
Nc (rpm) 105 105 105 105 105 105
ɸc (%) 57 57 57 57 57 57
εball 0.4 0.4 0.4 0.4 0.4 0.4
εpowder 0.59 0.64 0.64 0.64 0.64 0.64

35
Table 3.15. Experimental conditions for batch ball mill grinding of HPGR product
and HPGR feed (dB = 31.75 mm)
dB (mm)
31.75 mm
Size Fraction
-3.35 mm+2.36 mm -2.36 mm+1.7 mm -1.7 mm+1.18 mm
HPGR
product
HPGR
feed
HPGR
product
HPGR
feed
HPGR
product
HPGR
feed
ɸB 0.35 0.35 0.35 0.35 0.35 0.35
ɸM 0.8 0.91 0.8 0.8 0.8 0.8
fc 0.11 0.13 0.11 0.11 0.11 0.11
Number of
balls 62 62 62 62 62 62
Mball (kg) 8.1 8.1 8.1 8.1 8.1 8.1
Mpowder (kg) 0.720 0.720 0.633 0.633 0.633 0.633
Operating
Speed
(rpm)
60 60 60 60 60 60
Nc (rpm) 107 107 107 107 107 107
ɸc (%) 56 56 56 56 56 56
εball 0.4 0.4 0.4 0.4 0.4 0.4
εpowder 0.59 0.64 0.64 0.64 0.64 0.64

36
CHAPTER 4
RESULTS AND DISCUSSION
4.1 Evaluation of Single Particle Breakage Tests
The primary interest in this work was to compare breakage parameters of HPGR
product and HPGR feed. In drop weight testing, these parameters may be defined as
breakage probability and impact breakage distribution function.
The breakage probability can be defined as the probability that particles of a given
material and size get broken for a given specific impact energy, which is analogous
to breakage rate in the kinetic model and selection function in the matrix model. In
this study, mass-basis breakage probability is used, which is the cumulative mass
fraction of the feed size interval passing down to lower size intervals after impact.
For comparison purposes, breakage probabilities of HPGR product and HPGR feed
were plotted together for each size fraction tested and compared at the same impact
energy level. As shown in Figure 4.1 through Figure 4.6, there exists a specific
impact energy range for each coarse size fraction where breakage probabilities of
HPGR product are higher than HPGR feed at the same impact energy. This is
possibly due to fracturing and weakening induced in HPGR product as cracks
imparted to clinker decrease the strength of the particle, easing the failure of the
particle upon a given impact energy. However, no significant weakening is
observed at -19+12.7 mm HPGR product as given in Figure 4.5. Also, the breakage
probabilities of HPGR product and HPGR feed tend to be close at high specific
impact energy levels corresponding to a breakage probability of near unity. It is
obvious that particles in HPGR product and HPGR feed have certain strength

37
distributions, and they are composed of a mixture of weak and strong particles. If
the impact energy is too high, then it will exceed the strength of almost every
particle in HPGR product and HPGR feed. Therefore, nearly all particles of HPGR
product and HPGR feed will get broken even if it gets weakened or not, resulting in
close breakage probabilities in HPGR product and HPGR feed. Similarly, mass-
basis breakage probabilities of HPGR product tend to be close to the probabilities of
HPGR feed at low specific impact energy levels. It is probable that low impact
energy levels are not sufficient for failure of weakened particles in HPGR product,
yielding the same degree of failure in HPGR product and HPGR feed. However,
this situation is not observed in size fractions of -12.7+9.53 mm, -6.35+4.7 mm and
-4.7+3.35 mm. It should be noted that low impact energies and low breakage
probabilities could not be generated on size fractions of -4.7+3.35 mm and -
6.35+4.7 mm even with the smallest drop head of 0.40 kg. In this case, using drop
weight smaller than 0.40 kg would not be suitable since the drop head got quite
thinner, and falling geometry of the drop head would become erratic.
Figure 4.1. Mass-Basis Breakage Probabilities of -4.7+3.35 mm HPGR product and
HPGR feed (Raw data at Table B.1 through Table B.8 in Appendix B)

38
Figure 4.2. Mass-Basis Breakage Probabilities of -6.35+4.7 mm HPGR product and
HPGR feed (Raw data at Table B.9 through Table B.16 in Appendix B)
Figure 4.3. Mass-Basis Breakage Probabilities of -9.53+6.35 mm HPGR product
and HPGR feed (Raw data at Table B.17 through Table B.28 in Appendix B)

39
Figure 4.4. Mass-Basis Breakage Probabilities of -12.7+9.53 mm HPGR product
and HPGR feed (Raw data at Table B.29 through Table B.42 in Appendix B)
Figure 4.5. Mass-Basis Breakage Probabilities of -19+12.7 mm HPGR product and
HPGR feed (Raw data at Table B.43 through Table B.52 in Appendix B)

40
Figure 4.6. Mass-Basis Breakage Probabilities of -25.4+19 mm HPGR product and
HPGR feed (Raw data at Table B.53 through Table B.64 in Appendix B)
The other breakage parameter in drop weight testing is the impact breakage
distribution function. Impact breakage distribution function is the size distribution
of broken fragments after drop weight testing. For comparison purposes, impact
breakage distribution functions of HPGR product and HPGR feed were plotted
together for each size fraction tested and compared at the same impact energy level.
The plots were constructed with a dimensionless size (xi-1/x1) where xi is the upper
sieve size of the size interval “i”. As shown in Figure 4.7 through Figure 4.12,
weakening in HPGR product does not extensively lead to finer fragment
distribution with respect to HPGR feed. At size fractions below 9.53 mm, breakage
distribution functions of HPGR product are finer than those of the HPGR feed only
at one specific impact energy tested. Above and below this energy level, the
breakage distribution functions of HPGR product and HPGR feed are close to each
other. On the other hand, weakening in HPGR product adversely affects the
fragment size of HPGR product at sizes above 9.53 mm such that the breakage
distribution functions of HPGR product get coarser than those of the HPGR feed.

41
As shown in Figure 4.7 through Figure 4.12, impact breakage distribution functions
of coarse sizes of HPGR product and HPGR feed tend to be identical at high
specific impact energy levels. Regarding this, it should be noted that if an excessive
impact energy is given to a set of particles which can already be broken at low
impact energy levels, then the rest of the energy goes into rebreakage of broken
fragments (Krogh, 1980; Tavares, 2007). In this case, excess energy causes high
degree of rebreakage; thus, HPGR product and HPGR feed will be broken to the
same extent.
Figure 4.7. Cumulative breakage distribution functions after impact breakage of
-4.7+3.35 mm of HPGR product and HPGR feed at various energy levels (Raw data
at Table B.1 through Table B.8 in Appendix B)

42
Figure 4.8. Cumulative breakage distribution functions after impact breakage of
-6.35+4.7 mm of HPGR product and HPGR feed at various energy levels (Raw data
at Table B.9 through Table B.16 in Appendix B)
Figure 4.9. Cumulative breakage distribution functions after impact breakage of
-9.53+6.35 mm of HPGR product and HPGR feed at various energy levels (Raw
data at Table B.17 through Table B.28 in Appendix B)

43
Figure 4.10. Cumulative breakage distribution functions after impact breakage of
-12.7+9.53 mm of HPGR product and HPGR feed at various energy levels (Raw
data at Table B.29 through Table B.42 in Appendix B)
Figure 4.11. Cumulative breakage distribution functions after impact breakage of
-19.0+12.7 mm of HPGR product and HPGR feed at various energy levels (Raw
data at Table B.43 through Table B.52 in Appendix B)

44
Figure 4.12. Cumulative breakage distribution functions after impact breakage of
-25.4+19.0 mm of HPGR product and HPGR feed at various energy levels (Raw
data at Table B.53 through Table B.64 in Appendix B)
One of the important aspects drawn from breakage distribution functions is that
breakage distribution functions of a given size of HPGR product and HPGR feed
increase with increasing specific impact energy. This may be due to:
- Failure of particles upon impact which could not possibly be broken at low impact
energy levels.
- Rebreakage of particles that could already be broken at low impact energy levels
Normally, it has been found out that size reduction processes including single
particle breakage are self-similar in nature (Avşar, 2003; De, 1995; Fuerstenau et
al., 1999; Kapur, 1972) such that the product size distributions rescaled by median
product size (d50) falls on to a single line. However, Kapur et al. (1997) checked
self-similarity of product size distributions after impact breakage and concluded that
non-self-similar size distributions occur mostly due to limited re-breakage,

45
especially at low impact energies. Regarding this, product size distributions after
impact breakage of each size fraction of HPGR product and HPGR feed are rescaled
and checked if self-similarity exists. As shown in Figure 4.13 through Figure 4.24,
impact breakage of HPGR product and HPGR feed are non-self-similar for all size
fractions tested except -4.7+3.35 mm. In fact, impact breakage of -4.7+3.35 mm
HPGR product and HPGR feed exhibit nearly self-similar breakage behaviour.
Also, at size fractions below 12.7 mm, the size distributions tend to be on a single
line at high specific impact energy levels, indicating a zone of rebreakage. All in all,
it can be concluded that the extent of rebreakage is limited for all size fractions
except -4.7+3.35 mm.
Figure 4.13. Non-self similar product size distributions after drop weight tests of
-4.7+3.35 mm HPGR product with varying specific impact energy levels (Raw data
at Table B.1 through Table B.4, and at Table B.65 in Appendix B)

46
Figure 4.14. Non-self similar product size distributions after drop weight tests of
-4.7+3.35 mm HPGR feed with varying specific impact energy levels (Raw data at
Table B.5 through Table B.8, and at Table B.66 in Appendix B)
Figure 4.15. Non-self similar product size distributions after drop weight tests of
-6.35+4.7 mm HPGR product with varying specific impact energy levels (Raw data
at Table B.9 through Table B.12, and at Table B.65 in Appendix B)

47
Figure 4.16. Non-self similar product size distributions after drop weight tests of
-6.35+4.7 mm HPGR feed with varying specific impact energy levels (Raw data at
Table B.13 through Table B.16, and at Table B.66 in Appendix B)
Figure 4.17. Non-self similar product size distributions after drop weight tests of
-9.53+6.35 mm HPGR product with varying specific impact energy levels (Raw
data at Table B.17 through Table B.22, and at Table B.65 in Appendix B)

48
Figure 4.18. Non-self similar product size distributions after drop weight tests of
-9.53+6.35 mm HPGR feed with varying specific impact energy levels (Raw data at
Table B.23 through Table B.28, and at Table B.66 in Appendix B)
Figure 4.19. Non-self similar product size distributions after drop weight tests of
-12.7+9.53 mm HPGR product with varying specific impact energy levels (Raw
data at Table B.29 through Table B.35, and at Table B.65 in Appendix B)

49
Figure 4.20. Non-self similar product size distributions after drop weight tests of
-12.7+9.53 mm HPGR feed with varying specific impact energy levels (Raw data at
Table B.36 through Table B.42, and at Table B.66 in Appendix B)
Figure 4.21. Non-self similar product size distributions after drop weight tests of
-19.0+12.7 mm HPGR product with varying specific impact energy levels (Raw
data at Table B.43 through Table B.47, and at Table B.65 in Appendix B)

50
Figure 4.22. Non-self similar product size distributions after drop weight tests of
-19.0+12.7 mm HPGR feed with varying specific impact energy levels (Raw data at
Table B.48 through Table B.52, and at Table B.66 in Appendix B)
Figure 4.23. Non-self similar product size distributions after drop weight tests of
-25.4+19.0 mm HPGR product with varying specific impact energy levels (Raw
data at Table B.53 through Table B.58, and at Table B.65 in Appendix B)

51
Figure 4.24. Non-self similar product size distributions after drop weight tests of
-25.4+19.0 mm HPGR feed with varying specific impact energy levels (Raw data at
Table B.59 through Table B.64, and at Table B.66 in Appendix B)
It is of interest to check if the breakage distribution functions of HPGR product and
HPGR feed are normalizable at nearly the same impact energy (J) tested. As given
in Figure 4.25 and Figure 4.26, impact breakage distribution functions of -
12.7+9.53 mm, -9.53+6.35 mm, -6.35+4.7 mm, -4.7+3.35 mm HPGR product and
HPGR feed are non-normalizable. Also, similar results were obtained for breakage
distributions of -12.7+9.53 mm, -19.0+12.7 mm and -25.4+19.0 mm HPGR product
and HPGR feed which is shown in Figure 4.27 and Figure 4.28. It is obvious that
breakage distribution functions of HPGR product and HPGR feed are a function of
particle size and contain higher proportion of fines as parent size is decreasing. In
this case, impact energy will probably become insufficient for fracturing with
increasing particle size, giving less amount of fines. In fact, this non-normalizable
breakage pattern was also observed in particle-bed breakage of coarse material
where the grinding energy became insufficient to fracture the particles (Datta and
Rajamani, 2002). In batch grinding, on the other hand, coarser feed was found to
contain the higher proportion of fine fragments. However, this was believed to

52
occur due to abrasion and chipping action inside mill rather than impact (Austin et
al., 1984).
Figure 4.25. Non-normalizable breakage distribution functions of -4.7+3.35 mm,
-6.35+4.7 mm, -9.53+6.35 mm, and -12.7+9.53 mm HPGR product (Raw data at
Table B.1, Table B.9, Table B.17 and Table B.29 in Appendix B)
Figure 4.26. Non-normalizable breakage distribution functions of -4.7+3.35 mm,
-6.35+4.7 mm, -9.53+6.35 mm, and -12.7+9.53 mm HPGR feed (Raw data at
Table B.5, Table B.13, Table B.23 and Table B.36 in Appendix B)

53
Figure 4.27. Non-normalizable breakage distribution functions of -12.7+9.53 mm,
-19+12.7 mm, -25.4+19.0 mm HPGR product (Raw data at Table B.30, Table B.43
and Table B.53 in Appendix B)
Figure 4.28. Non-normalizable breakage distribution functions of -12.7+9.53 mm,
-19+12.7 mm, -25.4+19.0 mm HPGR feed (Raw data at Table B.37, Table B.48 and
Table B.59 in Appendix B)

54
4.2 Evaluation of Batch Grinding Tests
4.2.1 Product Size Distributions
Product size distributions obtained from batch grinding tests on HPGR feed and
HPGR product are compared for each combination of size fraction and ball size in
Figure 4.29 through Figure 4.37. The plots show that batch grinding of HPGR
product yields slightly finer product size distribution than HPGR feed at each size
fraction tested, irrespective of the ball size used. This supports the fact that cracks in
the particles induced by HPGR facilitated breakage and led to finer product size
distribution than that of the HPGR feed. However, the difference between product
size distributions of HPGR product and HPGR feed tend to disappear at longer
grinding times. It is most probable that cracks induced in HPGR product were
eliminated at longer grinding times. Beyond this point, the weakened particles in
HPGR product disappeared and batch grinding of hold-up material gave nearly
same product size distribution with batch grinding of HPGR feed. Also, for a given
size fraction, it is observed that the time required to eliminate the difference
between the product size distributions of HPGR product and HPGR feed tends to
decrease with increasing ball size. In this case, higher impact energies generated by
larger balls could eliminate cracks in HPGR product at shorter grinding times.

55
Figure 4.29. Product size distributions after batch grinding of -1.7+1.18 mm of
HPGR product and HPGR feed; dB = 19.05 mm, ɸBall = 0.35, 633 g of material
(Raw data at Table D.13 and Table D.16 in Appendix D)
Figure 4.30. Product size distributions after batch grinding of -1.7+1.18 mm of
HPGR product and HPGR feed; dB = 25.4 mm, ɸBall = 0.35, 633 g of material (Raw
data at Table D.14 and Table D.17 in Appendix D)

56
Figure 4.31. Product size distributions after batch grinding of -1.7+1.18 mm of
HPGR product and HPGR feed; dB = 31.75 mm, ɸBall = 0.35, 633 g of material
(Raw data at Table D.15 and Table D.18 in Appendix D)
Figure 4.32. Product size distributions after batch grinding of -2.36+1.7 mm of
HPGR product and HPGR feed; dB = 19.05 mm, ɸBall = 0.35, 633 g of material
(Raw data at from Table D.7 and Table D.10 in Appendix D)

57
Figure 4.33. Product size distributions after batch grinding of -2.36+1.7 mm of
HPGR product and HPGR feed; dB = 25.4 mm, ɸBall = 0.35, 633 g of material (Raw
data at Table D.8 and Table D.11 in Appendix D)
Figure 4.34. Product size distributions after batch grinding of -2.36+1.7 mm of
HPGR product and HPGR feed; dB = 31.75 mm, ɸBall = 0.35, 633 g of material
(Raw data at Table D.9 and Table D.12 in Appendix D)

58
Figure 4.35. Product size distributions after batch grinding of -3.35+2.36 mm of
HPGR product and HPGR feed; dB = 19.05 mm, ɸBall = 0.35, 720 g of material
(Raw data at Table D.1 and Table D.4 in Appendix D)
Figure 4.36. Product size distributions after batch grinding of -3.35+2.36 mm of
HPGR product and HPGR feed; dB = 25.4 mm, ɸBall = 0.35, 720 g of material (Raw
data at Table D.2 and Table D.5 in Appendix D)

59
Figure 4.37. Product size distributions after batch grinding of -3.35+2.36 mm of
HPGR product and HPGR feed; dB = 31.75 mm, ɸBall = 0.35, 720 g of material
(Raw data at Table D.3 and Table D.6 in Appendix D)
4.2.2 Specific Rates of Breakage
Breakage rate plots of each size fraction of HPGR product and HPGR feed for each
ball size are compared in Figure 4.38 through Figure 4.46. Breakage rate plots of
HPGR product and HPGR feed show non-linear breakage which can be represented
as a fast initial breakage zone (S1) and a subsequent slow breakage zone (S2). The
estimated values of S1 and S2 are given in Table 4.1. In the fast breakage zone,
breakage rates of HPGR product are significantly higher than those of HPGR feed
for a given feed size. On the other hand, in the slow breakage zone, this difference
tends to diminish or breakage rates of HPGR feed become slightly higher than those
of the HPGR product. Significantly higher breakage rates in HPGR product may be
resulted from flaws and cracks induced in clinker as these may weaken the particle,
increasing the fracture probability with respect to HPGR feed upon the same degree
of impact. However, as grinding time increases, the cracks induced by HPGR will

60
be eliminated and breakage rates of HPGR product change into breakage rates of
HPGR feed.
Table 4.1. Fast (S1) and slow (S2) breakage rates of the size fractions of HPGR
product and HPGR feed (Raw data at Appendix C and Appendix D)
Size Fraction Ball Size
(mm)
S1 S2
HPGR
product
HPGR
feed
HPGR
product
HPGR
feed
-1.7+1.18 mm
19.05 0.324 0.253 0.110 0.101
25.40 0.345 0.266 0.164 0.144
31.75 0.338 0.285 0.232 0.236
Size Fraction Ball Size
(mm)
S1 S2
HPGR
product
HPGR
feed
HPGR
product
HPGR
feed
-2.36+1.7 mm
19.05 0.316 0.236 0.066 0.073
25.40 0.319 0.276 0.114 0.102
31.75 0.400 0.277 0.200 0.168
Size Fraction Ball Size
(mm)
S1 S2
HPGR
product
HPGR
feed
HPGR
product
HPGR
feed
-3.35+2.36 mm
19.05 0.234 0.175 0.047 0.051
25.40 0.274 0.206 0.077 0.065
31.75 0.316 0.254 0.124 0.110

61
Figure 4.38. Breakage rate plots after batch grinding of -1.7+1.18 mm of HPGR
product and HPGR feed; dB = 19.05 mm, ɸBall =0.35, 633 g of material (Raw data at
Table C.13, Table C.16 in Appendix C, and Table D.13, Table D.16 in Appendix D)
Figure 4.39. Breakage rate plots after batch grinding of -1.7+1.18 mm of HPGR
product and HPGR feed; dB = 25.4 mm, ɸBall =0.35, 633 g of material (Raw data at
Table C.14, Table C.17 in Appendix C, and Table D.14, Table D.17 in Appendix D)

62
Figure 4.40. Breakage rate plots after batch grinding of -1.7+1.18 mm of HPGR
product and HPGR feed; dB = 31.75 mm, ɸBall =0.35, 633 g of material (Raw data at
Table C.15, Table C.18 in Appendix C, and Table D.15, Table D.18 in Appendix D)
Figure 4.41. Breakage rate plots after batch grinding of -2.36+1.7 mm of HPGR
product and HPGR feed; dB = 19.05 mm, ɸBall =0.35, 633 g of material (Raw data at
Table C.7, Table C.10 in Appendix C, and Table D.7, Table D.10 in Appendix D)

63
Figure 4.42. Breakage rate plots after batch grinding of -2.36+1.7 mm of HPGR
product and HPGR feed; dB = 25.4 mm, ɸBall =0.35, 633 g of material (Raw data at
Table C.8, Table C.11 in Appendix C, and Table D.8, Table D.11 in Appendix D)
Figure 4.43. Breakage rate plots after batch grinding of -2.36+1.7 mm of HPGR
product and HPGR feed; dB = 31.75 mm, ɸBall =0.35, 633 g of material (Raw data at
Table C.9, Table C.12 in Appendix C, and Table D.9, Table D.12 in Appendix D)

64
Figure 4.44. Breakage rate plots after batch grinding of -3.35+2.36 mm of HPGR
product and HPGR feed; dB = 19.05 mm, ɸBall =0.35, 720 g of material (Raw data at
Table C.1, Table C.4 in Appendix C, and Table D.1, Table D.4 in Appendix D)
Figure 4.45. Breakage rate plots after batch grinding of -3.35+2.36 mm of HPGR
product and HPGR feed; dB = 25.4 mm, ɸBall =0.35, 720 g of material (Raw data at
Table C.2, Table C.5 in Appendix C, and Table D.2, Table D.5 in Appendix D)

65
Figure 4.46. Breakage rate plots after batch grinding of -3.35+2.36 mm of HPGR
product and HPGR feed; dB = 31.75 mm, ɸBall =0.35, 720 g of material (Raw data at
Table C.3, Table C.6 in Appendix C, and Table D.3, Table D.6 in Appendix D)
Beside the significant weakening observed in particles broken by HPGR, non-linear
breakage rates of HPGR product and HPGR feed may also be the result of
inefficient breakage of coarse sizes. In previous studies, it has been found that
breakage of a coarse feed above a maximum particle size become abnormal which
yields non-linear breakage rate including a faster initial breakage rate and a slower
following breakage rate (Austin et al., 1984). In this case, particles that are too big
in a given coarse size fraction cannot be efficiently fractured by balls, leading to
non-first order breakage. Also, it has been experimentally shown that breakage rates
in batch grinding of fine size fractions increase with increasing feed size; whereas,
the breakage rates in abnormal breakage of coarse sizes decrease with increasing
feed size (Austin et al., 1981; Austin et al., 1976; Austin et al., 1982). Regarding
this, for a given ball size, faster and slower breakage rates of each size interval of
HPGR product and HPGR feed were plotted against the top size of the
corresponding size interval (µm) in log-log plot, so as to compare the variation of
breakage rates with particle size. As shown in Figure 4.47 through Figure 4.49,
breakage rates of HPGR product and HPGR feed decrease with increasing particle

66
size, showing abnormal breakage behavior. Moreover, the plots indicate the
presence of a maximum particle size between 2.36 and 1.7 mm above which the S1
of HPGR product and HPGR feed decrease.
Figure 4.47. Variation of S1 and S2 with particle size in batch grinding of HPGR
product and HPGR feed (dB = 19.05 mm)
Figure 4.48. Variation of S1 and S2 with particle size in batch grinding of HPGR
product and HPGR feed (dB = 25.4 mm)

67
Figure 4.49. Variation of S1 and S2 with particle size in batch grinding of HPGR
product and HPGR feed (dB = 31.75 mm)
One noteworthy observation is that the S1 and S2 of HPGR product and HPGR feed
mostly increase with increasing ball size, as shown in Table 4.1. Actually, for a
given ball loading, it has been shown that decrease in ball size would increase the
number of ball-on-ball contacts which would result in higher breakage rates in batch
grinding of fine material. On the contrary, in abnormal breakage region of coarse
feeds, larger ball sizes gave higher breakage rates since smaller balls became
insufficient to fracture coarse particles (Austin et al., 1984). Regarding this, it is
probable that the breakage rates of HPGR product and HPGR feed decrease with
smaller ball size due to insufficient breakage of coarse particles.
4.2.3 Primary Breakage Distribution Functions
Although higher breakage rates in HPGR product show significant weakening with
respect to HPGR feed, the primary breakage distribution functions of batch grinding
HPGR product are coarser than those of the HPGR feed for each combination of
size fraction and ball size, which are shown in Figure 4.50 through Figure 4.58.
However, breakage distribution function of HPGR product is slightly coarser than
that of HPGR feed at batch grinding of -3.35+2.36 mm with 19.05 mm ball.

68
Figure 4.50. Primary breakage distribution functions after batch grinding of -
1.7+1.18 mm of HPGR product and HPGR feed; dB = 19.05 mm, ɸBall = 0.35, 633 g
of material (Raw data at Table C.13, Table C.16 in Appendix C, and Table D.13,
Table D.16 in Appendix D)
Figure 4.51. Primary breakage distribution functions after batch grinding of -
1.7+1.18 mm of HPGR product and HPGR feed; dB = 25.4 mm, ɸBall = 0.35, 633 g
of material (Raw data at Table C.14, Table C.17 in Appendix C, and Table D.14,
Table D.17 in Appendix D)

69
Figure 4.52. Primary breakage distribution functions after batch grinding of -
1.7+1.18 mm of HPGR product and HPGR feed; dB =31.75 mm, ɸBall =0.35, 633 g
of material (Raw data at Table C.15, Table C.18 in Appendix C, and Table D.15,
Table D.18 in Appendix D)
Figure 4.53. Primary breakage distribution functions after batch grinding of
-2.36+1.7 mm of HPGR product and HPGR feed; dB =19.05 mm, ɸBall =0.35, 633 g
of material (Raw data at Table C.7, Table C.10 in Appendix C, and Table D.7,
Table D.10 in Appendix D)

70
Figure 4.54. Primary breakage distribution functions after batch grinding of
-2.36+1.7 mm of HPGR product and HPGR feed; dB =25.4 mm, ɸBall =0.35, 633 g
of material (Raw data at Table C.8, Table C.11 in Appendix C, and Table D.8,
Table D.11 in Appendix D)
Figure 4.55. Primary breakage distribution functions after batch grinding of
-2.36+1.7 mm of HPGR product and HPGR feed; dB =31.75 mm, ɸBall =0.35, 633 g
of material (Raw data at Table C.9, Table C.12 in Appendix C, and Table D.9,
Table D.12 in Appendix D)

71
Figure 4.56. Primary breakage distribution functions after batch grinding of
-3.35+2.36 mm of HPGR product and HPGR feed; dB=19.05 mm, ɸBall=0.35, 720 g
of material (Raw data at Table C.1, Table C.4 in Appendix C, and Table D.1, Table
D.4 in Appendix D)
Figure 4.57. Primary breakage distribution functions after batch grinding of
-3.35+2.36 mm of HPGR product and HPGR feed; dB =25.4 mm, ɸBall =0.35, 720 g
of material (Raw data at Table C.2, Table C.5 in Appendix C, and Table D.2, Table
D.5 in Appendix D)

72
Figure 4.58. Primary breakage distribution functions after batch grinding of
-3.35+2.36 mm of HPGR product and HPGR feed; dB =31.75 mm, ɸBall =0.35, 720
g of material (Raw data at Table C.3, Table C.6 in Appendix C, and Table D.3,
Table D.6 in Appendix D)
It is of the interest to check whether breakage distribution functions of HPGR
product and HPGR feed are normalizable with respect to parent size interval at the
same ball loading condition. As shown in Figure 4.59 through Figure 4.64, the
breakage distribution functions of HPGR product and HPGR feed are non-
normalizable. In fact, it was previously found that the batch grinding of coarse feeds
gave non-normalizable breakage distribution functions (Austin et al., 1981; Austin
et al., 1982). For HPGR product, it is clear that the proportion of fines increase in
breakage distribution function as the size interval gets coarser. Actually, this was
previously observed and linked to chipping and abrasion action inside the mill that
provide a larger proportion of fines with increasing feed size (Austin et al., 1984).
On the other hand, this pattern is not observed in HPGR feed. In this case, batch
grinding of -3.35+2.36 mm HPGR feed gives the highest proportion of fines in
breakage distribution function. Meanwhile, batch grinding of -2.36+1.7 mm and
-1.7+1.18 mm HPGR feed exhibit nearly normalizable breakage distribution
function although they seem to be in abnormal breakage region.

73
Figure 4.59. Primary breakage distribution functions after batch grinding of three
monosize fractions of HPGR product; dB = 19.05 mm, ɸBall = 0.35 (Raw data at
Table C.1, Table C.7, Table C.13 in Appendix C, and Table D.1, Table D.7, Table
D.13 in Appendix D)
Figure 4.60. Primary breakage distribution functions after batch grinding of three
monosize fractions of HPGR product; dB = 25.4 mm, ɸBall = 0.35 (Raw data at Table
C.2, Table C.8, Table C.14 in Appendix C, and Table D.2, Table D.8 and Table
D.14 in Appendix D)

74
Figure 4.61. Primary breakage distribution functions after batch grinding of three
monosize fractions of HPGR product; dB = 31.75 mm, ɸBall = 0.35 (Raw data at
Table C.3, Table C.9, Table C.15 in Appendix C, and Table D.3, Table D.9, Table
D.15 in Appendix D)
Figure 4.62. Primary breakage distribution functions after batch grinding of three
monosize fractions of HPGR feed; dB = 19.05 mm, ɸBall = 0.35 (Raw data at Table
C.4, Table C.10, Table C.16 in Appendix C, and Table D.4, Table D.10, Table D.16
in Appendix D)

75
Figure 4.63. Primary breakage distribution functions after batch grinding of three
monosize fractions of HPGR feed; dB = 25.4 mm, ɸBall = 0.35 (Raw data at Table
C.5, Table C.11, Table C.17 in Appendix C, and Table D.5, Table D.11, Table D.17
in Appendix D)
Figure 4.64. Primary breakage distribution functions after batch grinding of three
monosize fractions of HPGR feed; dB = 31.75 mm, ɸBall = 0.35 (Raw data at Table
C.6, Table C.12, Table C.18 in Appendix C, and Table D.6, Table D.12, Table D.18
in Appendix D)

76
CHAPTER 5
CONCLUSIONS
Clinker broken in HPGR was found to be weaker than unbroken clinker considering
higher breakage probabilities and higher breakage rates encountered. This could be
attributed to the existence of cracks in clinker induced by HPGR. However, no
significant weakening was observed in drop weight testing of -19.0+12.7 mm
HPGR product.
Although clinker broken by HPGR was weaker, fragment size distribution did not
tend to be finer in HPGR product. Regarding this, breakage distribution of HPGR
product were same as that of HPGR feed only when breaking mid-size range. On
the other hand, breakage distribution functions of HPGR product tended to be
coarser than those of HPGR feed at coarse and fine size ranges. Moreover, coarse
clinker in HPGR product and in HPGR feed gave nearly the same fragment size
distribution at excessive impact energies due to rebreakage.
Single particle breakage tests on HPGR product and HPGR feed gave non-self-
similar product size distributions. However, impact breakage of -4.7+3.35 mm
HPGR product and HPGR feed exhibited nearly self-similar breakage behaviour.
Also, at size fractions below 12.7 mm, impact breakage of HPGR product and
HPGR feed tended to yield self-similar size distributions at excessive energy levels.
In this case, it was believed that rebreakage of particles might probably yield self-
similar size distributions; especially at excessive specific impact energy levels.
Meanwhile, non-self-similar size distributions arise from limited rebreakage of
particles.

77
The impact breakage distribution functions of coarse particles were a function of
particle size and impact energy (J) both in HPGR product and HPGR feed. For a
given particle size, broken fragments became finer with increasing impact energy.
Meanwhile, at a given impact energy, proportion of fines in broken fragments
increased with decreasing particle size. In this case, given impact energy would
probably be insufficient to generate breakage within coarser particles.
The batch grinding tests showed that at a given size fraction, the product size
distribution of HPGR product was slightly finer than HPGR feed for the same ball
loading and material loading conditions. This was due to the fact that cracks
induced in clinker by HPGR facilitate breakage, leading to finer product size
distributions in HPGR product. However, the product size distributions of HPGR
product and HPGR feed tended to become similar at long grinding times, indicating
disappearance of cracks with increasing grinding time. Also, time of disappearance
of cracks tended to decrease with larger balls, probably due to higher grinding
energies generated with larger balls.
Specific breakage rates of HPGR product and HPGR feed followed a non-linear
pattern which could be represented as a fast initial breakage rate and a slow
following breakage rate. The fast initial breakage rates of HPGR product were
found to be higher than HPGR feed for each size fraction, which was due to
weakening imparted to HPGR product by cracks. Meanwhile, the slow breakage
rates of HPGR product and HPGR feed tended to be nearly the same, indicating
elimination of cracks, hence, disappearance of weaker particles. All size fractions of
HPGR product and HPGR feed ground were in the abnormal breakage zone, that is,
the three ball sizes used were smaller related to particle size such that coarse
particles could not be broken efficiently inside the mill.
Breakage distribution functions of HPGR product and HPGR feed were non-
normalizable with respect to particle size. In HPGR product, batch grinding of
particles yielded high proportion of fines with increasing particle size. However, in

78
HPGR feed, breakage distribution function of -3.35+2.36 mm contained the largest
proportion of fines while -2.36+1.7 mm and -1.7+1.18 mm exhibited the same
breakage pattern. It is believed that the chipping and abrasion inside the mill was
responsible for generating more fines in the coarsest feed size.

79
REFERENCES
Aman, S., Tomas, J., & Kalman, H. (2010). Breakage probability of irregularly
shaped particles. Chemical Engineering Science, 65(5), 1503–1512.
Austin, L. G., Shoji, K., & Luckie, P. T. (1976). The effect of ball size on mill
performance. Powder Technology, 14(1), 71–79.
Austin, L. G. , & Bagga, P. (1981). An analysis of fine dry grinding in ball mills.
Powder Technology, 28(1), 83–90.
Austin, L. G., Bagga, P., & Celik, M. (1981). Breakage properties of some materials
in a laboratory ball mill. Powder Technology, 28(2), 235–243.
Austin, L. G., Shoji, K., & Bell, D. (1982). Rate equations for non-linear breakage
in mills due to material effects. Powder Technology, 31(1), 127–133.
Austin, L. G., Klimpel, R. R., & Luckie, P. T. (1984). Process engineering of size
reduction: ball milling (pp. 61–204). New York: SME/AIME.
Avşar, Ç. (2003). Breakage Characteristics of Cement Components (Ph.D. Thesis,
Middle East Technical University, Ankara, Turkey). Retrieved from
http://etd.lib.metu.edu.tr/upload/2/587147/index.pdf.
Bilgili, E., Yepes, J., & Scarlett, B. (2006). Formulation of a non-linear framework
for population balance modeling of batch grinding: Beyond first-order kinetics.
Chemical Engineering Science, 61(1), 33–44.
Bourgeois, F. S., King, R. P., & Herbst, J. A. (1992). Low-impact-energy single-
particle fracture. In S. K. Kawatra (Ed.), Comminution-Theory and Practice (pp.
99–108). Littleton: Society for Mining, Metallurgy, and Exploration, Inc.
Bourgeois, Florent Stephane. (1993). Single-particle fracture as a basis for
microscale modeling of comminution processes (Ph.D. Thesis, The University of
Utah, Salt Lake City, United States). Retrieved from ProQuest Dissertations and
Theses database (Order No. 9406111).
Datta, A., & Rajamani, R. K. (2002). A direct approach of modeling batch grinding
in ball mills using population balance principles and impact energy distribution.
International Journal of Mineral Processing, 64, 181–200.

80
De, A. K. (1995). Modeling and optimization of fine grinding of minerals in high-
pressure roll mill - ball mill hybrid comminution circuits (Ph.D. Thesis, University
of California, Berkeley, United States). Retrieved from ProQuest Dissertations and
Theses (Order No. 9602527).
Fuerstenau, D. W., Kapur, P. C., Schoenert, K., & Marktscheffel, M. (1990).
Comparison of energy consumption in the breakage of single particles in a rigidly
mounted roll mill with ball mill grinding. International Journal of Mineral
Processing, 28(1-2), 109–125.
Fuerstenau, D. W., Kapur, P. C., & Gutsche, O. (1993). Comminution of single
particles in a rigidly-mounted roll mill part 1: mill torque model and energy
investment. Powder Technology, 76(3), 253–262.
Fuerstenau, D. W., & Vazquez-Favela, J. (1997). On assessing and enhancing the
energy efficiency of comminution processes. Minerals and Metallurgical
Processing, 14(1), 41–48.
Fuerstenau, D. W., Lutch, J. J., & De, A. (1999). The effect of ball size on the
energy efficiency of hybrid high-pressure roll mill/ball mill grinding. Powder
Technology, 105, 199–204.
Fuerstenau, D. W., De, A., & Kapur, P. C. (2004). Linear and nonlinear particle
breakage processes in comminution systems. International Journal of Mineral
Processing, 74, S317–S327.
Gutsche, O., Kapur, P. C., & Fuerstenau, D. W. (1993). Comminution of single
particles in a rigidly-mounted roll mill part 2: product size distribution and energy
utilization. Powder Technology, 76(3), 263–270.
Jankovic, A., Valery, W., & Davis, E. (2004). Cement grinding optimisation.
Minerals Engineering, 17(11-12), 1075–1081.
Kapur, P. C. (1972). Self-preserving size spectra of comminuted particles. Chemical
Engineering Science, 27(2), 425–431.
Kapur, P.C., Pande, D., & Fuerstenau, D. W. (1997). Analysis of single-particle
breakage by impact grinding. Materials Science, 49, 223–236.
Krogh, S. R. (1980). Crushing Characteristics. Powder Technology, 27, 171–181.
Lynch, A. J. (1977). Mineral Crushing and Grinding Circuits. Amsterdam: Elsevier
Scientific Publishing Company.

81
Napier-Munn, T. J., Morrell, S., Morrison, R. D., & Kojovic, T. (1996). Rock
Testing - Determining the Material - Specific Breakage Function. In T. J. Napier-
Munn (Ed.), Mineral Comminution Circuits Their Operation and Optimization (pp.
49–94). Indooroopilly, Qld.: Julius Kruttschnitt Mineral Research Centre.
Patzelt, N. (1992). High-pressure grinding rolls, a survey of experience. Cement
Industry Technical Conference (pp. 149–181). Dallas: IEEE.
Patzelt, N., Knecht, H., & Baum, W. (1995). Case made for high-pressure-roll-
grinding in gold plants. Mining Engineering, 47(6), 524–529.
Schönert, K. (1988). A first survey of grinding with high-compression roller mills.
International Journal of Mineral Processing, 22(1-4), 401–412.
Tavares, L. M., & King, R. P. (1998). Single-particle fracture under impact loading.
International Journal of Mineral Processing, 54, 1–28.
Tavares, L. M. (2005). Particle weakening in high-pressure roll grinding. Minerals
Engineering, 18(7), 651–657.
Tavares, L. M. (2007). Breakage of Single Particles : Quasi-Static. In A. D. Salman,
M. Ghadiri, & M. J. Hounslow (Eds.), Handbook of Powder Technology (pp. 3–68).
Elsevier Science B.V.
Tromans, D. (2008). Mineral comminution: Energy efficiency considerations.
Minerals Engineering, 21(8), 613–620.
Tuzcu, E. T., & Rajamani, R. K. (2011). Modeling breakage rates in mills with
impact energy spectra and ultra fast load cell data. Minerals Engineering, 24(3-4),
252–260.
Von Seebach, H. M., Neumann, E., & Lohnherr, L. (1996). State-of-the-art of
energy-efficient grinding systems. ZKG, 49(2), 61–67.

82
APPENDIX A
SIZE DISTRIBUTIONS OF HPGR PRODUCT AND HPGR FEED
Table A.1. Size distribution of HPGR product
SIZE DISTRIBUTION OF HPGR PRODUCT
Size
(µm)
Weight
(g)
Weight
(%)
Cumulative
Percent
Retained
Cumulative
Percent Passing
34930 0.00 0.00 0.00 100.00
25400 428.00 0.47 0.47 99.53
19000 1332.00 1.45 1.92 98.08
12700 4209.00 4.59 6.50 93.50
9530 3910.00 4.26 10.76 89.24
6350 6178.00 6.73 17.50 82.50
4700 4473.00 4.87 22.37 77.63
3350 3942.00 4.30 26.67 73.33
2360 7260.00 7.91 34.58 65.42
1700 4377.00 4.77 39.35 60.65
1180 4550.00 4.96 44.31 55.69
850 3360.00 3.66 47.97 52.03
600 5173.00 5.64 53.60 46.40
425 4997.00 5.45 59.05 40.95
300 3317.00 3.61 62.66 37.34
212 4396.00 4.79 67.45 32.55
150 3660.00 3.99 71.44 28.56
106 3531.00 3.85 75.29 24.71
-106 22677.00 24.71 100.00 0.00
Total 91770.00 100.00

83
Table A.2. Size distribution of HPGR feed
SIZE DISTRIBUTION OF HPGR FEED
Size
(µm)
Weight
(g)
Weight
(%)
Cumulative
Percent
Retained
Cumulative
Percent Passing
50800 0.00 0.00 0.00 100.00
34930 3361.00 3.85 3.85 96.15
25400 6905.00 7.91 11.76 88.24
19000 11999.00 13.74 25.50 74.50
12700 17937.00 20.54 46.04 53.96
9530 11483.00 13.15 59.19 40.81
6350 11122.00 12.74 71.92 28.08
4699 5478.00 6.27 78.20 21.80
3350 5663.00 6.49 84.68 15.32
2360 4699.00 5.38 90.06 9.94
1700 1948.00 2.23 92.29 7.71
1180 1515.00 1.73 94.03 5.97
850 1023.00 1.17 95.20 4.80
600 1048.30 1.20 96.40 3.60
425 1005.66 1.15 97.55 2.45
300 302.14 0.35 97.90 2.10
212 169.90 0.19 98.09 1.91
150 240.01 0.27 98.37 1.63
106 184.03 0.21 98.58 1.42
-106 1240.88 1.42 100.00 0.00
Total 87323.92 100.00

84
APPENDIX B
DROP WEIGHT TEST DATA
Table B.1. Product size distribution after impact breakage of -4.7+3.35 mm of
HPGR product (specific impact energy=0.54 kWh/t)
-4.7+3.35 mm
(HPGR product)
Specific Impact Energy (kWh/t)
0.54
Size (µm) Weight (g) Weight (%) Cumulative Percent
Passing
4700.00 0.00 0.00 100.00
3350.00 1.84 3.79 96.21
2360.00 6.97 14.36 81.85
1700.00 10.94 22.53 59.32
1180.00 8.98 18.50 40.82
850.00 5.15 10.61 30.22
600.00 2.98 6.14 24.08
425.00 2.46 5.07 19.01
300.00 1.53 3.15 15.86
212.00 1.34 2.76 13.10
150.00 1.13 2.33 10.77
106.00 1.03 2.12 8.65
75.00 0.94 1.94 6.71
53.00 0.94 1.94 4.78
38.00 0.64 1.32 3.46
-38.00 1.68 3.46 0.00
Total 48.55 100.00 0.00

85
Table B.2. Product size distribution after impact breakage of -4.7+3.35 mm of
HPGR product (specific impact energy=1.09 kWh/t)
-4.7+3.35 mm
(HPGR product)
Specific Impact Energy (kWh/t)
1.09
Size (µm) Weight (g) Weight (%) Cumulative
Percent Passing
4700.00 0.00 0.00 100.00
3350.00 0.09 0.23 99.77
2360.00 1.80 4.64 95.13
1700.00 5.24 13.49 81.64
1180.00 6.92 17.82 63.82
850.00 5.73 14.76 49.06
600.00 4.14 10.66 38.40
425.00 3.23 8.32 30.08
300.00 2.07 5.33 24.75
212.00 1.55 3.99 20.76
150.00 1.33 3.43 17.33
106.00 1.28 3.30 14.04
75.00 1.14 2.94 11.10
53.00 1.20 3.09 8.01
38.00 0.58 1.49 6.52
-38.00 2.53 6.52 0.00
Total 38.83 100.00 0.00

86
Table B.3. Product size distribution after impact breakage of -4.7+3.35 mm of
HPGR product (specific impact energy=2.18 kWh/t)
-4.7+3.35 mm
(HPGR product)
Specific Impact Energy (kWh/t)
2.18
Size (µm) Weight (g) Weight (%) Cumulative
Percent Passing
4700.00 0.00 0.00 100.00
3350.00 0.00 0.00 100.00
2360.00 0.09 0.24 99.76
1700.00 0.76 1.99 97.77
1180.00 3.03 7.95 89.82
850.00 4.94 12.96 76.87
600.00 5.21 13.66 63.20
425.00 4.97 13.03 50.17
300.00 3.20 8.39 41.78
212.00 2.61 6.85 34.93
150.00 2.13 5.59 29.35
106.00 1.98 5.19 24.15
75.00 1.85 4.85 19.30
53.00 1.96 5.14 14.16
38.00 1.62 4.25 9.91
-38.00 3.78 9.91 0.00
Total 38.13 100.00 0.00

87
Table B.4. Product size distribution after impact breakage of -4.7+3.35 mm of
HPGR product (specific impact energy=3.32 kWh/t)
-4.7+3.35 mm
(HPGR product)
Specific Impact Energy (kWh/t)
3.32
Size (µm) Weight (g) Weight (%) Cumulative
Percent Passing
4700.00 0.00 0.00 100.00
3350.00 0.00 0.00 100.00
2360.00 0.00 0.00 100.00
1700.00 0.47 1.23 98.77
1180.00 1.30 3.40 95.37
850.00 3.11 8.14 87.23
600.00 4.65 12.17 75.05
425.00 5.24 13.72 61.34
300.00 3.59 9.40 51.94
212.00 3.13 8.19 43.74
150.00 2.55 6.68 37.07
106.00 2.38 6.23 30.84
75.00 2.09 5.47 25.37
53.00 2.41 6.31 19.06
38.00 1.79 4.69 14.37
-38.00 5.49 14.37 0.00
Total 38.20 100.00 0.00

88
Table B.5. Product size distribution after impact breakage of -4.7+3.35 mm of
HPGR feed (specific impact energy=0.54 kWh/t)
-4.7+3.35 mm
(HPGR feed)
Specific Impact Energy (kWh/t)
0.54
Size (µm) Weight (g) Weight (%) Cumulative
Percent Passing
4700.00 0.00 0.00 100.00
3350.00 3.36 10.82 89.18
2360.00 8.24 26.55 62.63
1700.00 6.61 21.30 41.33
1180.00 3.50 11.28 30.06
850.00 2.10 6.77 23.29
600.00 1.56 5.03 18.27
425.00 1.22 3.93 14.34
300.00 0.80 2.58 11.76
212.00 0.64 2.06 9.70
150.00 0.53 1.71 7.99
106.00 0.53 1.71 6.28
75.00 0.49 1.58 4.70
53.00 0.48 1.55 3.16
38.00 0.30 0.97 2.19
-38.00 0.68 2.19 0.00
Total 31.04 100.00
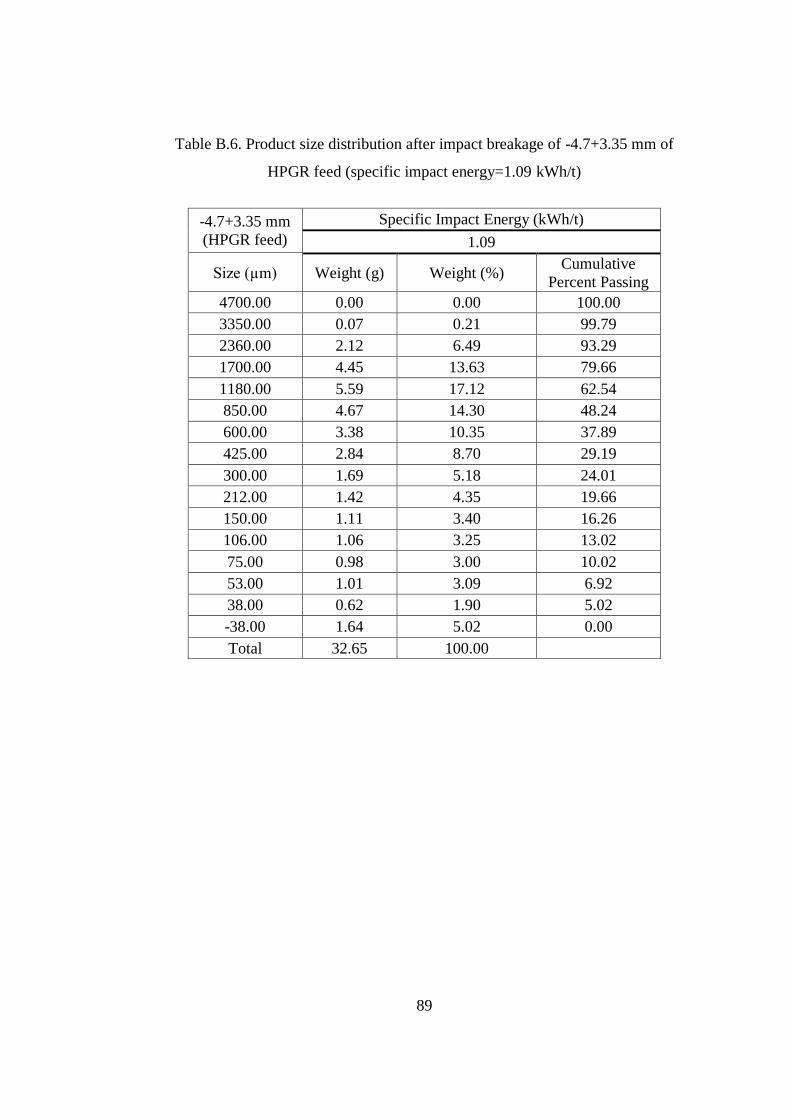
89
Table B.6. Product size distribution after impact breakage of -4.7+3.35 mm of
HPGR feed (specific impact energy=1.09 kWh/t)
-4.7+3.35 mm
(HPGR feed)
Specific Impact Energy (kWh/t)
1.09
Size (µm) Weight (g) Weight (%) Cumulative
Percent Passing
4700.00 0.00 0.00 100.00
3350.00 0.07 0.21 99.79
2360.00 2.12 6.49 93.29
1700.00 4.45 13.63 79.66
1180.00 5.59 17.12 62.54
850.00 4.67 14.30 48.24
600.00 3.38 10.35 37.89
425.00 2.84 8.70 29.19
300.00 1.69 5.18 24.01
212.00 1.42 4.35 19.66
150.00 1.11 3.40 16.26
106.00 1.06 3.25 13.02
75.00 0.98 3.00 10.02
53.00 1.01 3.09 6.92
38.00 0.62 1.90 5.02
-38.00 1.64 5.02 0.00
Total 32.65 100.00

90
Table B.7. Product size distribution after impact breakage of -4.7+3.35 mm of
HPGR feed (specific impact energy=2.18 kWh/t)
-4.7+3.35 mm
(HPGR feed)
Specific Impact Energy (kWh/t)
2.18
Size (µm) Weight (g) Weight (%) Cumulative
Percent Passing
4700.00 0.00 0.00 100.00
3350.00 0.00 0.00 100.00
2360.00 0.19 0.60 99.40
1700.00 0.85 2.67 96.73
1180.00 2.88 9.05 87.68
850.00 4.27 13.42 74.25
600.00 4.36 13.71 60.55
425.00 4.20 13.20 47.34
300.00 2.57 8.08 39.26
212.00 2.15 6.76 32.51
150.00 1.66 5.22 27.29
106.00 1.59 5.00 22.29
75.00 1.50 4.72 17.57
53.00 1.50 4.72 12.86
38.00 1.03 3.24 9.62
-38.00 3.06 9.62 0.00
Total 31.81 100.00

91
Table B.8. Product size distribution after impact breakage of -4.7+3.35 mm of
HPGR feed (specific impact energy=3.32 kWh/t)
-4.7+3.35 mm
(HPGR feed)
Specific Impact Energy (kWh/t)
3.32
Size (µm) Weight (g) Weight (%) Cumulative
Percent Passing
4700.00 0.00 0.00 100.00
3350.00 0.00 0.00 100.00
2360.00 0.10 0.28 99.72
1700.00 1.01 2.88 96.84
1180.00 1.63 4.64 92.20
850.00 3.09 8.80 83.40
600.00 3.99 11.36 72.05
425.00 4.95 14.09 57.96
300.00 3.40 9.68 48.28
212.00 2.78 7.91 40.36
150.00 2.33 6.63 33.73
106.00 2.28 6.49 27.24
75.00 2.07 5.89 21.35
53.00 1.99 5.66 15.68
38.00 1.75 4.98 10.70
-38.00 3.76 10.70 0.00
Total 35.13 100.00

92
Table B.9. Product size distribution after impact breakage of -6.35+4.7 mm of
HPGR product (specific impact energy=0.23 kWh/t)
-6.35+4.7 mm
(HPGR product)
Specific Impact Energy (kWh/t)
0.23
Size (µm) Weight (g) Weight (%) Cumulative Percent
Passing
6350.00 0.00 0.00 100.00
4700.00 3.93 7.28 92.72
3350.00 12.04 22.31 70.41
2360.00 17.40 32.24 38.17
1700.00 7.17 13.29 24.88
1180.00 3.94 7.30 17.58
850.00 1.91 3.54 14.04
600.00 1.33 2.46 11.58
425.00 1.22 2.26 9.32
300.00 0.83 1.54 7.78
212.00 0.73 1.35 6.43
150.00 0.64 1.19 5.24
106.00 0.62 1.15 4.09
75.00 0.53 0.98 3.11
53.00 0.56 1.04 2.08
-53.00 1.12 2.08 0.00
Total 53.97 100.00

93
Table B.10. Product size distribution after impact breakage of -6.35+4.7 mm of
HPGR product (specific impact energy=0.45 kWh/t)
-6.35+4.7 mm
(HPGR product)
Specific Impact Energy (kWh/t)
0.45
Size (µm) Weight (g) Weight (%) Cumulative
Percent Passing
6350.00 0.00 0.00 100.00
4700.00 0.35 0.55 99.45
3350.00 9.54 15.04 84.41
2360.00 16.93 26.69 57.72
1700.00 10.84 17.09 40.63
1180.00 6.95 10.96 29.67
850.00 3.84 6.05 23.62
600.00 2.48 3.91 19.71
425.00 2.16 3.41 16.30
300.00 1.59 2.51 13.79
212.00 1.29 2.03 11.76
150.00 1.10 1.73 10.03
106.00 1.13 1.78 8.25
75.00 1.04 1.64 6.61
53.00 1.08 1.70 4.90
-53.00 3.11 4.90 0.00
Total 63.43 100.00

94
Table B.11. Product size distribution after impact breakage of -6.35+4.7 mm of
HPGR product (specific impact energy=0.88 kWh/t)
-6.35+4.7 mm
(HPGR product)
Specific Impact Energy (kWh/t)
0.88
Size (µm) Weight (g) Weight (%) Cumulative
Percent Passing
6350.00 0.00 0.00 100.00
4700.00 0.00 0.00 100.00
3350.00 1.04 1.70 98.30
2360.00 7.21 11.78 86.53
1700.00 10.02 16.36 70.16
1180.00 10.15 16.58 53.58
850.00 7.26 11.86 41.73
600.00 4.79 7.82 33.90
425.00 3.92 6.40 27.50
300.00 2.59 4.23 23.27
212.00 2.27 3.71 19.57
150.00 1.94 3.17 16.40
106.00 1.84 3.01 13.39
75.00 1.71 2.79 10.60
53.00 1.80 2.94 7.66
-53.00 4.69 7.66 0.00
Total 61.23 100.00

95
Table B.12. Product size distribution after impact breakage of -6.35+4.7 mm of
HPGR product (specific impact energy=1.74 kWh/t)
-6.35+4.7 mm
(HPGR product)
Specific Impact Energy (kWh/t)
1.74
Size (µm) Weight (g) Weight (%) Cumulative
Percent Passing
6350.00 0.00 0.00 100.00
4700.00 0.00 0.00 100.00
3350.00 0.07 0.11 99.89
2360.00 1.05 1.64 98.25
1700.00 4.33 6.77 91.48
1180.00 8.92 13.94 77.54
850.00 8.75 13.68 63.86
600.00 6.96 10.88 52.98
425.00 6.29 9.83 43.15
300.00 4.25 6.64 36.50
212.00 3.65 5.71 30.80
150.00 3.11 4.86 25.93
106.00 2.98 4.66 21.28
75.00 2.57 4.02 17.26
53.00 2.76 4.31 12.94
-53.00 8.28 12.94 0.00
Total 63.97 100.00

96
Table B.13. Product size distribution after impact breakage of -6.35+4.7 mm of
HPGR feed (specific impact energy=0.23 kwh/t)
-6.35+4.7 mm
(HPGR feed)
Specific Impact Energy (kWh/t)
0.23
Size (µm) Weight (g) Weight (%) Cumulative
Percent Passing
6350.00 0.00 0.00 100.00
4700.00 7.81 12.38 87.62
3350.00 19.18 30.41 57.21
2360.00 14.98 23.75 33.47
1700.00 7.13 11.30 22.16
1180.00 4.00 6.34 15.82
850.00 2.18 3.46 12.37
600.00 1.40 2.22 10.15
425.00 1.34 2.12 8.02
300.00 0.87 1.38 6.64
212.00 0.72 1.14 5.50
150.00 0.63 1.00 4.50
106.00 0.63 1.00 3.50
75.00 0.58 0.92 2.58
53.00 0.61 0.97 1.62
-53.00 1.02 1.62 0.00
Total 63.08 100.00

97
Table B.14. Product size distribution after impact breakage of -6.35+4.7 mm of
HPGR feed (specific impact energy=0.45 kWh/t)
-6.35+4.7 mm
(HPGR feed)
Specific Impact Energy (kWh/t)
0.45
Size (µm) Weight (g) Weight (%) Cumulative
Percent Passing
6350.00 0.00 0.00 100.00
4700.00 9.15 12.18 87.82
3350.00 8.65 11.52 76.30
2360.00 20.99 27.95 48.35
1700.00 11.59 15.43 32.92
1180.00 6.82 9.08 23.83
850.00 3.55 4.73 19.11
600.00 2.39 3.18 15.93
425.00 2.32 3.09 12.84
300.00 1.68 2.24 10.60
212.00 1.32 1.76 8.84
150.00 1.17 1.56 7.28
106.00 1.15 1.53 5.75
75.00 1.06 1.41 4.34
53.00 1.07 1.42 2.92
-53.00 2.19 2.92 0.00
Total 75.10 100.00

98
Table B.15. Product size distribution after impact breakage of -6.35+4.7 mm of
HPGR feed (specific impact energy=0.88 kWh/t)
-6.35+4.7 mm
(HPGR feed)
Specific Impact Energy (kWh/t)
0.88
Size (µm) Weight (g) Weight (%) Cumulative
Percent Passing
6350.00 0.00 0.00 100.00
4700.00 0.00 0.00 100.00
3350.00 2.41 3.16 96.84
2360.00 10.24 13.41 83.44
1700.00 12.45 16.30 67.13
1180.00 12.23 16.01 51.12
850.00 7.89 10.33 40.79
600.00 5.88 7.70 33.09
425.00 4.93 6.46 26.63
300.00 3.66 4.79 21.84
212.00 2.86 3.74 18.10
150.00 2.42 3.17 14.93
106.00 2.33 3.05 11.88
75.00 2.10 2.75 9.13
53.00 2.20 2.88 6.25
-53.00 4.77 6.25 0.00
Total 76.37 100.00

99
Table B.16. Product size distribution after impact breakage of -6.35+4.7 mm of
HPGR feed (specific impact energy=1.74 kWh/t)
-6.35+4.7 mm
(HPGR feed)
Specific Impact Energy (kWh/t)
1.74
Size (µm) Weight (g) Weight (%) Cumulative
Percent Passing
6350.00 0.00 0.00 100.00
4700.00 0.00 0.00 100.00
3350.00 0.00 0.00 100.00
2360.00 1.43 1.86 98.14
1700.00 4.14 5.37 92.77
1180.00 8.81 11.43 81.34
850.00 10.69 13.87 67.47
600.00 8.69 11.28 56.19
425.00 8.29 10.76 45.43
300.00 5.98 7.76 37.67
212.00 4.78 6.20 31.47
150.00 3.98 5.16 26.30
106.00 3.87 5.02 21.28
75.00 3.54 4.59 16.69
53.00 3.90 5.06 11.63
-53.00 8.96 11.63 0.00
Total 77.06 100.00

100
Table B.17. Product size distribution after impact breakage of -9.53+6.35 mm of
HPGR product (specific impact energy=0.10 kWh/t)
-9.53+6.35 mm
(HPGR product)
Specific Impact Energy (kWh/t)
0.1
Size (µm) Weight (g) Weight (%)
Cumulative
Percent
Passing
9530.00 0.00 0.00 100.00
6350.00 36.73 36.19 63.81
4700.00 21.84 21.52 42.28
3350.00 22.56 22.23 20.05
2360.00 7.78 7.67 12.39
1700.00 3.46 3.41 8.98
1180.00 2.04 2.01 6.97
850.00 1.32 1.30 5.67
600.00 0.90 0.89 4.78
425.00 0.90 0.89 3.89
300.00 0.65 0.64 3.25
212.00 0.56 0.55 2.70
150.00 0.53 0.52 2.18
106.00 0.50 0.49 1.69
75.00 0.49 0.48 1.20
-75.00 1.22 1.20 0.00
Total 101.48 100.00

101
Table B.18. Product size distribution after impact breakage of -9.53+6.35 mm of
HPGR product (specific impact energy=0.22 kWh/t)
-9.53+6.35 mm
(HPGR product)
Specific Impact Energy (kWh/t)
0.22
Size (µm) Weight (g) Weight (%) Cumulative
Percent Passing
9530.00 0.00 0.00 100.00
6350.00 7.86 14.36 85.64
4700.00 12.59 23.00 62.64
3350.00 15.16 27.69 34.95
2360.00 8.15 14.89 20.06
1700.00 3.22 5.88 14.18
1180.00 1.95 3.56 10.61
850.00 0.95 1.74 8.88
600.00 0.78 1.42 7.45
425.00 0.68 1.24 6.21
300.00 0.48 0.88 5.33
212.00 0.39 0.71 4.62
150.00 0.36 0.66 3.96
106.00 0.36 0.66 3.31
75.00 0.34 0.62 2.69
-75.00 1.47 2.69 0.00
Total 54.74 100.00

102
Table B.19. Product size distribution after impact breakage of -9.53+6.35 mm of
HPGR product (specific impact energy=0.55 kWh/t)
-9.53+6.35 mm
(HPGR product)
Specific Impact Energy (kWh/t)
0.55
Size (µm) Weight (g) Weight (%) Cumulative
Percent Passing
9530.00 0.00 0.00 100.00
6350.00 0.72 1.44 98.56
4700.00 2.28 4.55 94.01
3350.00 6.78 13.53 80.49
2360.00 10.22 20.39 60.10
1700.00 7.23 14.43 45.67
1180.00 6.05 12.07 33.60
850.00 3.12 6.23 27.37
600.00 2.23 4.45 22.92
425.00 2.06 4.11 18.81
300.00 1.43 2.85 15.96
212.00 1.23 2.45 13.51
150.00 1.06 2.11 11.39
106.00 1.02 2.04 9.36
75.00 0.92 1.84 7.52
-75.00 3.77 7.52 0.00
Total 50.12 100.00

103
Table B.20. Product size distribution after impact breakage of -9.53+6.35 mm of
HPGR product (specific impact energy=0.92 kWh/t)
-9.53+6.35 mm
(HPGR product)
Specific Impact Energy (kWh/t)
0.92
Size (µm) Weight (g) Weight (%) Cumulative
Percent Passing
9530.00 0.00 0.00 100.00
6350.00 0.41 0.75 99.25
4700.00 1.20 2.20 97.05
3350.00 5.86 10.74 86.31
2360.00 8.93 16.37 69.94
1700.00 6.91 12.67 57.27
1180.00 7.23 13.25 44.01
850.00 4.18 7.66 36.35
600.00 3.12 5.72 30.63
425.00 2.84 5.21 25.43
300.00 2.07 3.79 21.63
212.00 1.77 3.24 18.39
150.00 1.56 2.86 15.53
106.00 1.37 2.51 13.02
75.00 1.31 2.40 10.61
-75.00 5.79 10.61 0.00
Total 54.55 100.00

104
Table B.21. Product size distribution after impact breakage of -9.53+6.35 mm of
HPGR product (specific impact energy=2.21 kWh/t)
-9.53+6.35 mm
(HPGR product)
Specific Impact Energy (kWh/t)
2.21
Size (µm) Weight (g) Weight (%) Cumulative
Percent Passing
9530.00 0.00 0.00 100.00
6350.00 0.00 0.00 100.00
4700.00 0.15 0.31 99.69
3350.00 0.57 1.16 98.53
2360.00 2.66 5.43 93.10
1700.00 4.20 8.57 84.54
1180.00 6.94 14.16 70.38
850.00 5.96 12.16 58.22
600.00 4.57 9.32 48.90
425.00 3.77 7.69 41.21
300.00 2.88 5.88 35.33
212.00 2.43 4.96 30.38
150.00 2.07 4.22 26.15
106.00 2.07 4.22 21.93
75.00 1.89 3.86 18.07
-75.00 8.86 18.07 0.00
Total 49.02 100.00

105
Table B.22. Product size distribution after impact breakage of -9.53+6.35 mm of
HPGR product (specific impact energy=4.35 kWh/t)
-9.53+6.35 mm
(HPGR product)
Specific Impact Energy (kWh/t)
4.35
Size (µm) Weight (g) Weight (%) Cumulative
Percent Passing
9530.00 0.00 0.00 100.00
6350.00 0.00 0.00 100.00
4700.00 0.00 0.00 100.00
3350.00 1.60 3.40 96.60
2360.00 1.56 3.31 93.29
1700.00 3.01 6.39 86.91
1180.00 5.40 11.46 75.45
850.00 5.07 10.76 64.69
600.00 4.68 9.93 54.75
425.00 4.05 8.60 46.16
300.00 2.80 5.94 40.22
212.00 2.66 5.65 34.57
150.00 2.26 4.80 29.78
106.00 2.40 5.09 24.68
75.00 2.05 4.35 20.33
-75.00 9.58 20.33 0.00
Total 47.12 100.00

106
Table B.23. Product size distribution after impact breakage of -9.53+6.35 mm of
HPGR feed (specific impact energy=0.10 kWh/t)
-9.53+6.35 mm
(HPGR feed)
Specific Impact Energy (kWh/t)
0.1
Size (µm) Weight (g) Weight (%) Cumulative
Percent Passing
9530.00 0.00 0.00 100.00
6350.00 48.16 36.53 63.47
4700.00 31.64 24.00 39.48
3350.00 27.13 20.58 18.90
2360.00 9.94 7.54 11.36
1700.00 3.75 2.84 8.52
1180.00 2.41 1.83 6.69
850.00 1.56 1.18 5.51
600.00 1.14 0.86 4.64
425.00 1.21 0.92 3.72
300.00 0.83 0.63 3.09
212.00 0.67 0.51 2.59
150.00 0.62 0.47 2.12
106.00 0.62 0.47 1.65
75.00 0.56 0.42 1.22
-75.00 1.61 1.22 0.00
Total 131.85 100.00

107
Table B.24. Product size distribution after impact breakage of -9.53+6.35 mm of
HPGR feed (specific impact energy=0.22 kWh/t)
-9.53+6.35 mm
(HPGR feed)
Specific Impact Energy (kWh/t)
0.22
Size (µm) Weight (g) Weight (%) Cumulative
Percent Passing
9530.00 0.00 0.00 100.00
6350.00 40.87 27.75 72.25
4700.00 31.81 21.60 50.65
3350.00 36.22 24.59 26.06
2360.00 14.40 9.78 16.28
1700.00 6.39 4.34 11.94
1180.00 3.83 2.60 9.34
850.00 2.17 1.47 7.87
600.00 1.67 1.13 6.74
425.00 1.80 1.22 5.51
300.00 1.25 0.85 4.66
212.00 1.06 0.72 3.94
150.00 0.96 0.65 3.29
106.00 0.94 0.64 2.65
75.00 0.90 0.61 2.04
-75.00 3.01 2.04 0.00
Total 147.28 100.00

108
Table B.25. Product size distribution after impact breakage of -9.53+6.35 mm of
HPGR feed (specific impact energy=0.55 kWh/t)
-9.53+6.35 mm
(HPGR feed)
Specific Impact Energy (kWh/t)
0.55
Size (µm) Weight (g) Weight (%) Cumulative
Percent Passing
9530.00 0.00 0.00 100.00
6350.00 5.00 3.72 96.28
4700.00 13.81 10.27 86.01
3350.00 25.35 18.85 67.17
2360.00 23.33 17.35 49.82
1700.00 16.55 12.30 37.52
1180.00 11.22 8.34 29.17
850.00 7.27 5.41 23.77
600.00 4.99 3.71 20.06
425.00 5.03 3.74 16.32
300.00 3.78 2.81 13.51
212.00 2.90 2.16 11.35
150.00 2.51 1.87 9.49
106.00 2.50 1.86 7.63
75.00 2.20 1.64 5.99
-75.00 8.06 5.99 0.00
Total 134.50 100.00

109
Table B.26. Product size distribution after impact breakage of -9.53+6.35 mm of
HPGR feed (specific impact energy=0.92 kWh/t)
-9.53+6.35 mm
(HPGR feed)
Specific Impact Energy (kWh/t)
0.92
Size (µm) Weight (g) Weight (%) Cumulative
Percent Passing
9530.00 0.00 0.00 100.00
6350.00 0.29 0.21 99.79
4700.00 3.62 2.62 97.17
3350.00 13.55 9.79 87.38
2360.00 20.36 14.71 72.67
1700.00 20.73 14.98 57.69
1180.00 17.69 12.78 44.91
850.00 11.09 8.01 36.90
600.00 7.64 5.52 31.38
425.00 7.58 5.48 25.90
300.00 5.88 4.25 21.65
212.00 4.80 3.47 18.18
150.00 4.06 2.93 15.25
106.00 3.94 2.85 12.40
75.00 3.57 2.58 9.82
-75.00 13.59 9.82 0.00
Total 138.39 100.00

110
Table B.27. Product size distribution after impact breakage of -9.53+6.35 mm of
HPGR feed (specific impact energy=2.21 kWh/t)
-9.53+6.35 mm
(HPGR feed)
Specific Impact Energy (kWh/t)
2.21
Size (µm) Weight (g) Weight (%) Cumulative
Percent Passing
9530.00 0.00 0.00 100.00
6350.00 0.00 0.00 100.00
4700.00 0.00 0.00 100.00
3350.00 0.68 0.50 99.50
2360.00 6.73 4.98 94.52
1700.00 13.50 9.99 84.52
1180.00 17.97 13.30 71.22
850.00 15.02 11.12 60.10
600.00 11.35 8.40 51.70
425.00 11.30 8.36 43.34
300.00 8.48 6.28 37.06
212.00 7.58 5.61 31.45
150.00 6.60 4.89 26.57
106.00 6.27 4.64 21.92
75.00 5.83 4.32 17.61
-75.00 23.79 17.61 0.00
Total 135.10 100.00

111
Table B.28. Product size distribution after impact breakage of -9.53+6.35 mm of
HPGR feed (specific impact energy=4.35 kWh/t)
-9.53+6.35 mm
(HPGR feed)
Specific Impact Energy (kWh/t)
4.35
Size (µm) Weight (g) Weight (%) Cumulative
Percent Passing
9530.00 0.00 0.00 100.00
6350.00 0.00 0.00 100.00
4700.00 0.28 0.22 99.78
3350.00 4.79 3.81 95.96
2360.00 3.39 2.70 93.27
1700.00 7.79 6.20 87.07
1180.00 13.39 10.66 76.41
850.00 14.89 11.85 64.56
600.00 11.33 9.02 55.54
425.00 11.61 9.24 46.30
300.00 8.58 6.83 39.47
212.00 7.41 5.90 33.58
150.00 6.36 5.06 28.52
106.00 6.05 4.81 23.70
75.00 5.35 4.26 19.44
-75.00 24.43 19.44 0.00
Total 125.65 100.00

112
Table B.29. Product size distribution after impact breakage of -12.7+9.53 mm of
HPGR product (specific impact energy=0.03 kWh/t)
-12.7+9.53 mm
(HPGR product)
Specific Impact Energy (kWh/t)
0.03
Size (µm) Weight (g) Weight (%) Cumulative
Percent Passing
12700.00 0.00 0.00 100.00
9530.00 105.34 56.19 43.81
6350.00 62.82 33.51 10.31
4700.00 9.75 5.20 5.10
3350.00 4.08 2.18 2.93
2360.00 1.28 0.68 2.25
1700.00 0.75 0.40 1.85
1180.00 0.62 0.33 1.51
850.00 0.35 0.19 1.33
600.00 0.27 0.14 1.18
425.00 0.32 0.17 1.01
300.00 0.25 0.13 0.88
212.00 0.22 0.12 0.76
150.00 0.21 0.11 0.65
106.00 0.23 0.12 0.53
-106.00 0.99 0.53 0.00
Total 187.48 100.00

113
Table B.30. Product size distribution after impact breakage of -12.7+9.53 mm of
HPGR product (specific impact energy=0.11 kWh/t)
-12.7+9.53 mm
(HPGR product)
Specific Impact Energy (kWh/t)
0.11
Size (µm) Weight (g) Weight (%) Cumulative
Percent Passing
12700.00 0.00 0.00 100.00
9530.00 21.29 22.75 77.25
6350.00 34.01 36.34 40.91
4700.00 17.15 18.33 22.58
3350.00 8.22 8.78 13.80
2360.00 4.24 4.53 9.26
1700.00 2.21 2.36 6.90
1180.00 1.29 1.38 5.52
850.00 0.84 0.90 4.63
600.00 0.57 0.61 4.02
425.00 0.56 0.60 3.42
300.00 0.42 0.45 2.97
212.00 0.35 0.37 2.60
150.00 0.32 0.34 2.25
106.00 0.33 0.35 1.90
-106.00 1.78 1.90 0.00
Total 93.58 100.00

114
Table B.31. Product size distribution after impact breakage of -12.7+9.53 mm of
HPGR product (specific impact energy=0.22 kWh/t)
-12.7+9.53 mm
(HPGR product)
Specific Impact Energy (kWh/t)
0.22
Size (µm) Weight (g) Weight (%) Cumulative
Percent Passing
12700.00 0.00 0.00 100.00
9530.00 3.82 3.59 96.41
6350.00 36.12 33.99 62.42
4700.00 24.76 23.30 39.12
3350.00 16.25 15.29 23.83
2360.00 7.54 7.10 16.73
1700.00 3.86 3.63 13.10
1180.00 2.42 2.28 10.82
850.00 1.74 1.64 9.18
600.00 1.32 1.24 7.94
425.00 1.35 1.27 6.67
300.00 1.05 0.99 5.68
212.00 0.86 0.81 4.87
150.00 0.78 0.73 4.14
106.00 0.77 0.72 3.42
-106.00 3.63 3.42 0.00
Total 106.27 100.00

115
Table B.32. Product size distribution after impact breakage of -12.7+9.53 mm of
HPGR product (specific impact energy=0.44 kWh/t)
-12.7+9.53 mm
(HPGR product)
Specific Impact Energy (kWh/t)
0.44
Size (µm) Weight (g) Weight (%) Cumulative
Percent Passing
12700.00 0.00 0.00 100.00
9530.00 1.54 1.14 98.86
6350.00 14.99 11.10 87.75
4700.00 22.76 16.86 70.89
3350.00 24.74 18.33 52.57
2360.00 20.65 15.30 37.27
1700.00 11.54 8.55 28.72
1180.00 8.25 6.11 22.61
850.00 4.88 3.62 18.99
600.00 3.53 2.62 16.38
425.00 3.71 2.75 13.63
300.00 2.91 2.16 11.47
212.00 2.33 1.73 9.75
150.00 2.12 1.57 8.18
106.00 1.89 1.40 6.78
-106.00 9.15 6.78 0.00
Total 134.99 100.00

116
Table B.33. Product size distribution after impact breakage of -12.7+9.53 mm of
HPGR product (specific impact energy=0.88 kWh/t)
-12.7+9.53 mm
(HPGR product)
Specific Impact Energy (kWh/t)
0.88
Size (µm) Weight (g) Weight (%) Cumulative
Percent Passing
12700.00 0.00 0.00 100.00
9530.00 0.00 0.00 100.00
6350.00 2.26 1.87 98.13
4700.00 6.34 5.25 92.87
3350.00 14.91 12.35 80.52
2360.00 23.84 19.75 60.76
1700.00 16.91 14.01 46.75
1180.00 11.36 9.41 37.34
850.00 7.08 5.87 31.47
600.00 5.14 4.26 27.21
425.00 5.08 4.21 23.00
300.00 4.26 3.53 19.47
212.00 3.52 2.92 16.56
150.00 3.02 2.50 14.05
106.00 2.86 2.37 11.68
-106.00 14.10 11.68 0.00
Total 120.68 100.00

117
Table B.34. Product size distribution after impact breakage of -12.7+9.53 mm of
HPGR product (specific impact energy=1.32 kWh/t)
-12.7+9.53 mm
(HPGR product)
Specific Impact Energy (kWh/t)
1.32
Size (µm) Weight (g) Weight (%) Cumulative
Percent Passing
12700.00 0.00 0.00 100.00
9530.00 0.00 0.00 100.00
6350.00 0.00 0.00 100.00
4700.00 1.56 1.24 98.76
3350.00 9.42 7.46 91.30
2360.00 20.29 16.07 75.23
1700.00 19.57 15.50 59.72
1180.00 14.06 11.14 48.59
850.00 8.77 6.95 41.64
600.00 6.53 5.17 36.47
425.00 6.57 5.20 31.26
300.00 5.63 4.46 26.80
212.00 4.71 3.73 23.07
150.00 4.19 3.32 19.75
106.00 4.10 3.25 16.50
-106.00 20.83 16.50 0.00
Total 126.23 100.00

118
Table B.35. Product size distribution after impact breakage of -12.7+9.53 mm of
HPGR product (specific impact energy=1.7 kWh/t)
-12.7+9.53 mm
(HPGR product)
Specific Impact Energy (kWh/t)
1.7
Size (µm) Weight (g) Weight (%) Cumulative
Percent Passing
12700.00 0.00 0.00 100.00
9530.00 0.00 0.00 100.00
6350.00 0.00 0.00 100.00
4700.00 0.67 0.54 99.46
3350.00 5.59 4.48 94.99
2360.00 16.64 13.33 81.66
1700.00 18.75 15.02 66.65
1180.00 15.42 12.35 54.30
850.00 10.10 8.09 46.21
600.00 7.20 5.77 40.44
425.00 6.94 5.56 34.88
300.00 5.76 4.61 30.27
212.00 5.18 4.15 26.12
150.00 4.52 3.62 22.50
106.00 4.43 3.55 18.96
-106.00 23.67 18.96 0.00
Total 124.87 100.00

119
Table B.36. Product size distribution after impact breakage of -12.7+9.53 mm of
HPGR feed (specific impact energy=0.03 kWh/t)
-12.7+9.53 mm
(HPGR feed)
Specific Impact Energy (kWh/t)
0.03
Size (µm) Weight (g) Weight (%) Cumulative
Percent Passing
12700.00 0.00 0.00 100.00
9530.00 131.69 67.55 32.45
6350.00 47.01 24.11 8.34
4700.00 8.39 4.30 4.03
3350.00 2.75 1.41 2.63
2360.00 1.19 0.61 2.01
1700.00 0.70 0.36 1.65
1180.00 0.49 0.25 1.40
850.00 0.39 0.20 1.20
600.00 0.29 0.15 1.05
425.00 0.24 0.12 0.93
300.00 0.27 0.14 0.79
212.00 0.20 0.10 0.69
150.00 0.21 0.11 0.58
106.00 0.18 0.09 0.49
-106.00 0.96 0.49 0.00
Total 194.96 100.00

120
Table B.37. Product size distribution after impact breakage of -12.7+9.53 mm of
HPGR feed (specific impact energy=0.11 kWh/t)
-12.7+9.53 mm
(HPGR feed)
Specific Impact Energy (kWh/t)
0.11
Size (µm) Weight (g) Weight (%) Cumulative
Percent Passing
12700.00 0.00 0.00 100.00
9530.00 91.64 36.78 63.22
6350.00 77.30 31.02 32.20
4700.00 32.45 13.02 19.17
3350.00 20.91 8.39 10.78
2360.00 7.49 3.01 7.77
1700.00 4.01 1.61 6.16
1180.00 2.81 1.13 5.04
850.00 1.87 0.75 4.29
600.00 1.46 0.59 3.70
425.00 1.58 0.63 3.07
300.00 1.12 0.45 2.62
212.00 0.95 0.38 2.24
150.00 0.90 0.36 1.87
106.00 0.90 0.36 1.51
-106.00 3.77 1.51 0.00
Total 249.16 100.00

121
Table B.38. Product size distribution after impact breakage of -12.7+9.53 mm of
HPGR feed (specific impact energy=0.22 kWh/t)
-12.7+9.53 mm
(HPGR feed)
Specific Impact Energy (kWh/t)
0.22
Size (µm) Weight (g) Weight (%) Cumulative
Percent Passing
12700.00 0.00 0.00 100.00
9530.00 17.60 5.27 94.73
6350.00 76.86 23.03 71.69
4700.00 87.34 26.17 45.52
3350.00 56.42 16.91 28.61
2360.00 27.01 8.09 20.51
1700.00 13.29 3.98 16.53
1180.00 9.57 2.87 13.66
850.00 6.41 1.92 11.74
600.00 5.03 1.51 10.23
425.00 5.76 1.73 8.51
300.00 4.75 1.42 7.08
212.00 3.82 1.14 5.94
150.00 3.27 0.98 4.96
106.00 3.32 0.99 3.96
-106.00 13.23 3.96 0.00
Total 333.68 100.00

122
Table B.39. Product size distribution after impact breakage of -12.7+9.53 mm of
HPGR feed (specific impact energy=0.44 kWh/t)
-12.7+9.53 mm
(HPGR feed)
Specific Impact Energy (kWh/t)
0.44
Size (µm) Weight (g) Weight (%) Cumulative
Percent Passing
12700.00 0.00 0.00 100.00
9530.00 1.32 0.36 99.64
6350.00 29.60 8.03 91.61
4700.00 69.57 18.87 72.74
3350.00 70.33 19.08 53.67
2360.00 56.23 15.25 38.41
1700.00 30.33 8.23 30.19
1180.00 21.24 5.76 24.43
850.00 12.77 3.46 20.96
600.00 10.13 2.75 18.21
425.00 11.23 3.05 15.17
300.00 9.32 2.53 12.64
212.00 7.43 2.02 10.62
150.00 6.33 1.72 8.91
106.00 6.09 1.65 7.26
-106.00 26.75 7.26 0.00
Total 368.67 100.00

123
Table B.40. Product size distribution after impact breakage of -12.7+9.53 mm of
HPGR feed (specific impact energy=0.88 kWh/t)
-12.7+9.53 mm
(HPGR feed)
Specific Impact Energy (kWh/t)
0.88
Size (µm) Weight (g) Weight (%) Cumulative
Percent Passing
12700.00 0.00 0.00 100.00
9530.00 0.00 0.00 100.00
6350.00 3.04 0.89 99.11
4700.00 16.07 4.72 94.39
3350.00 44.91 13.19 81.19
2360.00 62.37 18.32 62.87
1700.00 43.41 12.75 50.12
1180.00 32.03 9.41 40.71
850.00 19.21 5.64 35.07
600.00 14.86 4.37 30.70
425.00 16.30 4.79 25.91
300.00 14.08 4.14 21.78
212.00 11.60 3.41 18.37
150.00 9.96 2.93 15.44
106.00 9.50 2.79 12.65
-106.00 43.07 12.65 0.00
Total 340.41 100.00

124
Table B.41. Product size distribution after impact breakage of -12.7+9.53 mm of
HPGR feed (specific impact energy=1.32 kWh/t)
-12.7+9.53 mm
(HPGR feed)
Specific Impact Energy (kWh/t)
1.32
Size (µm) Weight (g) Weight (%) Cumulative
Percent Passing
12700.00 0.00 0.00 100.00
9530.00 0.00 0.00 100.00
6350.00 0.87 0.31 99.69
4700.00 3.27 1.18 98.50
3350.00 16.86 6.10 92.40
2360.00 39.86 14.42 77.98
1700.00 39.99 14.47 63.51
1180.00 31.83 11.52 51.99
850.00 19.74 7.14 44.85
600.00 14.52 5.25 39.59
425.00 16.41 5.94 33.65
300.00 13.70 4.96 28.70
212.00 11.62 4.20 24.49
150.00 9.96 3.60 20.89
106.00 9.65 3.49 17.39
-106.00 48.07 17.39 0.00
Total 276.35 100.00

125
Table B.42. Product size distribution after impact breakage of -12.7+9.53 mm of
HPGR feed (specific impact energy=1.70 kWh/t)
-12.7+9.53 mm
(HPGR feed)
Specific Impact Energy (kWh/t)
1.7
Size (µm) Weight (g) Weight (%) Cumulative
Percent Passing
12700.00 0.00 0.00 100.00
9530.00 0.00 0.00 100.00
6350.00 0.40 0.12 99.88
4700.00 2.89 0.85 99.03
3350.00 19.43 5.73 93.30
2360.00 43.82 12.92 80.37
1700.00 47.09 13.89 66.48
1180.00 38.97 11.49 54.99
850.00 25.40 7.49 47.50
600.00 19.03 5.61 41.89
425.00 20.21 5.96 35.92
300.00 16.57 4.89 31.04
212.00 15.03 4.43 26.60
150.00 12.93 3.81 22.79
106.00 12.62 3.72 19.07
-106.00 64.65 19.07 0.00
Total 339.04 100.00

126
Table B.43. Product size distribution after impact breakage of -19.0+12.7 mm of
HPGR product (specific impact energy=0.03 kWh/t)
-19+12.7 mm
(HPGR product)
Specific Impact Energy (kWh/t)
0.03
Size (µm) Weight (g) Weight (%) Cumulative
Percent Passing
19000.00 0.00 0.00 100.00
12700.00 203.12 60.70 39.30
9530.00 68.25 20.40 18.90
6350.00 40.92 12.23 6.67
4700.00 7.70 2.30 4.37
3350.00 5.36 1.60 2.77
2360.00 1.69 0.51 2.27
1700.00 1.43 0.43 1.84
1180.00 0.96 0.29 1.55
850.00 0.65 0.19 1.36
600.00 0.58 0.17 1.18
425.00 0.64 0.19 0.99
300.00 0.50 0.15 0.84
212.00 0.43 0.13 0.71
150.00 0.40 0.12 0.59
-150.00 1.99 0.59 0.00
Total 334.62 100.00

127
Table B.44. Product size distribution after impact breakage of -19.0+12.7 mm of
HPGR product (specific impact energy=0.11 kWh/t)
-19+12.7 mm
(HPGR product)
Specific Impact Energy (kWh/t)
0.11
Size (µm) Weight (g) Weight (%) Cumulative
Percent Passing
19000.00 0.00 0.00 100.00
12700.00 30.20 24.40 75.60
9530.00 34.96 28.24 47.36
6350.00 28.39 22.94 24.42
4700.00 10.17 8.22 16.21
3350.00 6.41 5.18 11.03
2360.00 3.35 2.71 8.32
1700.00 1.80 1.45 6.87
1180.00 1.37 1.11 5.76
850.00 0.96 0.78 4.98
600.00 0.79 0.64 4.35
425.00 0.84 0.68 3.67
300.00 0.68 0.55 3.12
212.00 0.57 0.46 2.66
150.00 0.50 0.40 2.25
-150.00 2.79 2.25 0.00
Total 123.78 100.00

128
Table B.45. Product size distribution after impact breakage of -19.0+12.7 mm of
HPGR product (specific impact energy=0.22 kWh/t)
-19+12.7 mm
(HPGR product)
Specific Impact Energy (kWh/t)
0.22
Size (µm) Weight (g) Weight (%) Cumulative
Percent Passing
19000.00 0.00 0.00 100.00
12700.00 0.00 0.00 100.00
9530.00 21.75 18.94 81.06
6350.00 34.54 30.08 50.98
4700.00 19.55 17.03 33.95
3350.00 12.13 10.56 23.38
2360.00 7.13 6.21 17.17
1700.00 4.12 3.59 13.59
1180.00 2.73 2.38 11.21
850.00 1.87 1.63 9.58
600.00 1.47 1.28 8.30
425.00 1.48 1.29 7.01
300.00 1.16 1.01 6.00
212.00 0.98 0.85 5.15
150.00 0.88 0.77 4.38
-150.00 5.03 4.38 0.00
Total 114.82 100.00

129
Table B.46. Product size distribution after impact breakage of -19.0+12.7 mm of
HPGR product (specific impact energy=0.44 kWh/t)
-19+12.7 mm
(HPGR product)
Specific Impact Energy (kWh/t)
0.44
Size (µm) Weight (g) Weight (%) Cumulative
Percent Passing
19000.00 0.00 0.00 100.00
12700.00 0.00 0.00 100.00
9530.00 5.11 3.63 96.37
6350.00 28.20 20.01 76.37
4700.00 26.42 18.74 57.62
3350.00 25.68 18.22 39.40
2360.00 12.86 9.12 30.28
1700.00 7.79 5.53 24.75
1180.00 5.72 4.06 20.70
850.00 3.89 2.76 17.94
600.00 3.20 2.27 15.67
425.00 3.29 2.33 13.33
300.00 2.76 1.96 11.37
212.00 2.42 1.72 9.66
150.00 2.08 1.48 8.18
-150.00 11.53 8.18 0.00
Total 140.95 100.00

130
Table B.47. Product size distribution after impact breakage of -19.0+12.7 mm of
HPGR product (specific impact energy=0.88 kWh/t)
-19+12.7 mm
(HPGR product)
Specific Impact Energy (kWh/t)
0.88
Size (µm) Weight (g) Weight (%) Cumulative
Percent Passing
19000.00 0.00 0.00 100.00
12700.00 0.00 0.00 100.00
9530.00 1.87 1.09 98.91
6350.00 12.47 7.29 91.61
4700.00 19.48 11.39 80.22
3350.00 24.83 14.52 65.70
2360.00 28.32 16.56 49.14
1700.00 16.95 9.91 39.23
1180.00 11.89 6.95 32.27
850.00 7.65 4.47 27.80
600.00 5.87 3.43 24.37
425.00 6.21 3.63 20.74
300.00 5.43 3.18 17.56
212.00 4.47 2.61 14.95
150.00 3.78 2.21 12.74
-150.00 21.78 12.74 0.00
Total 171.00 100.00

131
Table B.48. Product size distribution after impact breakage of -19.0+12.7 mm of
HPGR feed (specific impact energy=0.03 kWh/t)
-19+12.7 mm
(HPGR feed)
Specific Impact Energy (kWh/t)
0.03
Size (µm) Weight (g) Weight (%) Cumulative
Percent Passing
19000.00 0.00 0.00 100.00
12700.00 507.27 60.62 39.38
9530.00 142.17 16.99 22.39
6350.00 113.53 13.57 8.82
4700.00 24.53 2.93 5.89
3350.00 16.92 2.02 3.87
2360.00 8.56 1.02 2.84
1700.00 4.27 0.51 2.33
1180.00 3.04 0.36 1.97
850.00 2.12 0.25 1.72
600.00 1.75 0.21 1.51
425.00 2.08 0.25 1.26
300.00 1.62 0.19 1.06
212.00 1.40 0.17 0.90
150.00 1.34 0.16 0.74
-150.00 6.17 0.74 0.00
Total 836.77 100.00

132
Table B.49. Product size distribution after impact breakage of -19.0+12.7 mm of
HPGR feed (specific impact energy=0.11 kWh/t)
-19+12.7 mm
(HPGR feed)
Specific Impact Energy (kWh/t)
0.11
Size (µm) Weight (g) Weight (%) Cumulative
Percent Passing
19000.00 0.00 0.00 100.00
12700.00 170.17 20.92 79.08
9530.00 187.97 23.11 55.96
6350.00 215.89 26.55 29.42
4700.00 78.90 9.70 19.71
3350.00 49.02 6.03 13.69
2360.00 26.73 3.29 10.40
1700.00 14.05 1.73 8.67
1180.00 11.35 1.40 7.28
850.00 7.37 0.91 6.37
600.00 6.40 0.79 5.58
425.00 7.63 0.94 4.64
300.00 6.02 0.74 3.90
212.00 4.91 0.60 3.30
150.00 4.35 0.53 2.77
-150.00 22.49 2.77 0.00
Total 813.25 100.00

133
Table B.50. Product size distribution after impact breakage of -19.0+12.7 mm of
HPGR feed (specific impact energy=0.22 kWh/t)
-19+12.7 mm
(HPGR feed)
Specific Impact Energy (kWh/t)
0.22
Size (µm) Weight (g) Weight (%) Cumulative
Percent Passing
19000.00 0.00 0.00 100.00
12700.00 34.34 4.75 95.25
9530.00 92.01 12.72 82.53
6350.00 235.33 32.53 50.00
4700.00 107.73 14.89 35.11
3350.00 78.94 10.91 24.20
2360.00 43.82 6.06 18.14
1700.00 22.60 3.12 15.01
1180.00 18.08 2.50 12.51
850.00 12.20 1.69 10.83
600.00 10.30 1.42 9.40
425.00 11.37 1.57 7.83
300.00 9.45 1.31 6.53
212.00 7.53 1.04 5.49
150.00 6.44 0.89 4.60
-150.00 33.24 4.60 0.00
Total 723.38 100.00

134
Table B.51. Product size distribution after impact breakage of -19.0+12.7 mm of
HPGR feed (specific impact energy=0.44 kWh/t)
-19+12.7 mm
(HPGR feed)
Specific Impact Energy (kWh/t)
0.44
Size (µm) Weight (g) Weight (%) Cumulative
Percent Passing
19000.00 0.00 0.00 100.00
12700.00 26.43 3.54 96.46
9530.00 33.59 4.50 91.96
6350.00 145.97 19.56 72.40
4700.00 122.14 16.37 56.03
3350.00 108.27 14.51 41.52
2360.00 77.23 10.35 31.17
1700.00 43.71 5.86 25.31
1180.00 32.12 4.30 21.01
850.00 21.21 2.84 18.16
600.00 16.93 2.27 15.90
425.00 19.45 2.61 13.29
300.00 15.99 2.14 11.15
212.00 12.97 1.74 9.41
150.00 11.10 1.49 7.92
-150.00 59.11 7.92 0.00
Total 746.22 100.00

135
Table B.52. Product size distribution after impact breakage of -19.0+12.7 mm of
HPGR feed (specific impact energy=0.88 kWh/t)
-19+12.7 mm
(HPGR feed)
Specific Impact Energy (kWh/t)
0.88
Size (µm) Weight (g) Weight (%) Cumulative
Percent Passing
19000.00 0.00 0.00 100.00
12700.00 0.00 0.00 100.00
9530.00 3.17 0.42 99.58
6350.00 68.07 8.94 90.64
4700.00 89.93 11.81 78.83
3350.00 122.57 16.10 62.73
2360.00 106.71 14.02 48.71
1700.00 64.99 8.54 40.17
1180.00 49.49 6.50 33.67
850.00 33.20 4.36 29.31
600.00 26.77 3.52 25.80
425.00 30.66 4.03 21.77
300.00 25.50 3.35 18.42
212.00 21.03 2.76 15.66
150.00 18.06 2.37 13.28
-150.00 101.13 13.28 0.00
Total 761.28 100.00

136
Table B.53. Product size distribution after impact breakage of -25.4+19.0 mm of
HPGR product (specific impact energy=0.01 kWh/t)
-25.4+19.0 mm
(HPGR product)
Specific Impact Energy (kWh/t)
0.01
Size (µm) Weight (g) Weight (%) Cumulative
Percent Passing
25400.00 0.00 0.00 100.00
19000.00 239.56 73.25 26.75
12700.00 74.34 22.73 4.02
9530.00 6.49 1.98 2.04
6350.00 2.31 0.71 1.34
4700.00 1.06 0.32 1.01
3350.00 0.51 0.16 0.86
2360.00 0.40 0.12 0.73
1700.00 0.27 0.08 0.65
1180.00 0.23 0.07 0.58
850.00 0.20 0.06 0.52
600.00 0.19 0.06 0.46
425.00 0.24 0.07 0.39
300.00 0.18 0.06 0.33
212.00 0.15 0.05 0.29
-212.00 0.94 0.29 0.00
Total 327.06 100.00
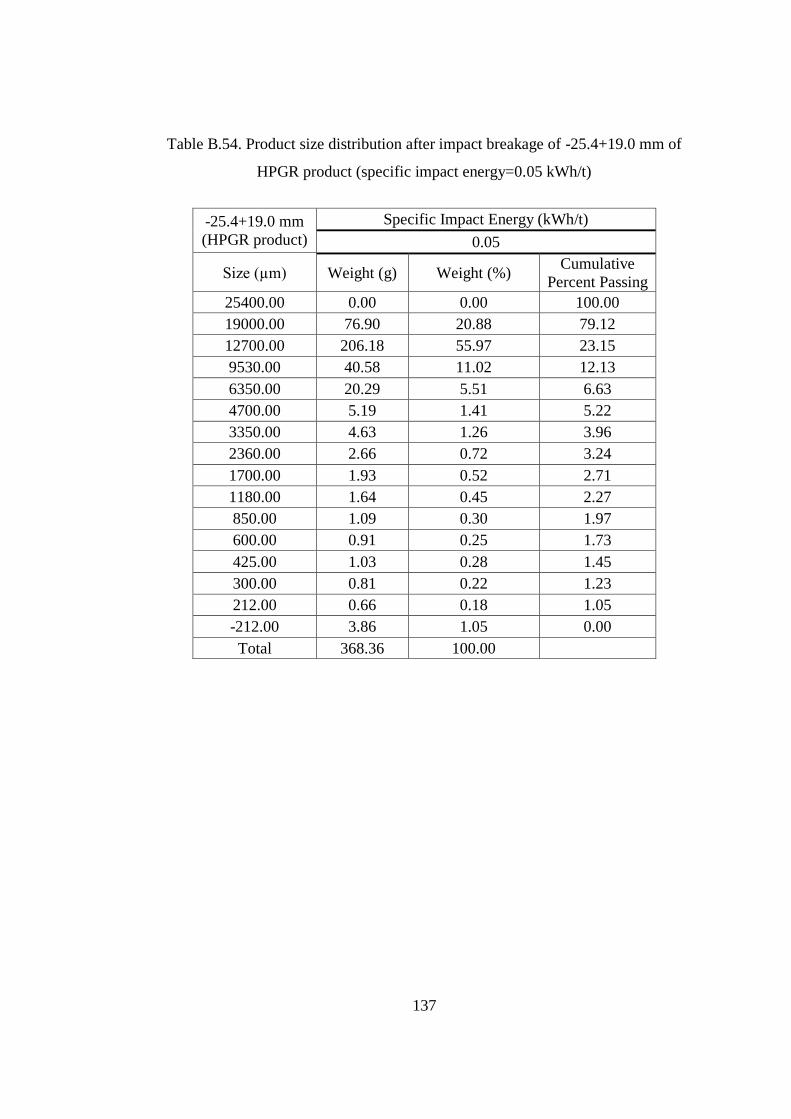
137
Table B.54. Product size distribution after impact breakage of -25.4+19.0 mm of
HPGR product (specific impact energy=0.05 kWh/t)
-25.4+19.0 mm
(HPGR product)
Specific Impact Energy (kWh/t)
0.05
Size (µm) Weight (g) Weight (%) Cumulative
Percent Passing
25400.00 0.00 0.00 100.00
19000.00 76.90 20.88 79.12
12700.00 206.18 55.97 23.15
9530.00 40.58 11.02 12.13
6350.00 20.29 5.51 6.63
4700.00 5.19 1.41 5.22
3350.00 4.63 1.26 3.96
2360.00 2.66 0.72 3.24
1700.00 1.93 0.52 2.71
1180.00 1.64 0.45 2.27
850.00 1.09 0.30 1.97
600.00 0.91 0.25 1.73
425.00 1.03 0.28 1.45
300.00 0.81 0.22 1.23
212.00 0.66 0.18 1.05
-212.00 3.86 1.05 0.00
Total 368.36 100.00

138
Table B.55. Product size distribution after impact breakage of -25.4+19.0 mm of
HPGR product (specific impact energy=0.11 kWh/t)
-25.4+19.0 mm
(HPGR product)
Specific Impact Energy (kWh/t)
0.11
Size (µm) Weight (g) Weight (%) Cumulative
Percent Passing
25400.00 0.00 0.00 100.00
19000.00 12.75 3.93 96.07
12700.00 122.51 37.80 58.27
9530.00 94.68 29.21 29.06
6350.00 50.44 15.56 13.50
4700.00 11.23 3.46 10.03
3350.00 8.53 2.63 7.40
2360.00 4.68 1.44 5.96
1700.00 3.56 1.10 4.86
1180.00 3.02 0.93 3.93
850.00 1.86 0.57 3.35
600.00 1.43 0.44 2.91
425.00 1.60 0.49 2.42
300.00 1.14 0.35 2.07
212.00 0.94 0.29 1.78
-212.00 5.76 1.78 0.00
Total 324.13 100.00

139
Table B.56. Product size distribution after impact breakage of -25.4+19.0 mm of
HPGR product (specific impact energy=0.22 kWh/t)
-25.4+19.0 mm
(HPGR product)
Specific Impact Energy (kWh/t)
0.22
Size (µm) Weight (g) Weight (%) Cumulative
Percent Passing
25400.00 0.00 0.00 100.00
19000.00 0.00 0.00 100.00
12700.00 39.03 25.81 74.19
9530.00 33.01 21.83 52.37
6350.00 34.79 23.00 29.36
4700.00 10.89 7.20 22.16
3350.00 10.00 6.61 15.55
2360.00 5.89 3.89 11.66
1700.00 3.40 2.25 9.41
1180.00 2.89 1.91 7.50
850.00 1.69 1.12 6.38
600.00 1.31 0.87 5.51
425.00 1.23 0.81 4.70
300.00 0.98 0.65 4.05
212.00 0.85 0.56 3.49
-212.00 5.28 3.49 0.00
Total 151.24 100.00

140
Table B.57. Product size distribution after impact breakage of -25.4+19.0 mm of
HPGR product (specific impact energy=0.59 kWh/t)
-25.4+19.0 mm
(HPGR product)
Specific Impact Energy (kWh/t)
0.59
Size (µm) Weight (g) Weight (%) Cumulative
Percent Passing
25400.00 0.00 0.00 100.00
19000.00 0.00 0.00 100.00
12700.00 8.85 4.59 95.41
9530.00 16.75 8.69 86.72
6350.00 34.52 17.91 68.80
4700.00 32.46 16.84 51.96
3350.00 25.22 13.09 38.88
2360.00 19.27 10.00 28.88
1700.00 8.91 4.62 24.25
1180.00 7.49 3.89 20.37
850.00 5.21 2.70 17.66
600.00 4.25 2.21 15.46
425.00 4.36 2.26 13.20
300.00 3.68 1.91 11.29
212.00 3.04 1.58 9.71
-212.00 18.71 9.71 0.00
Total 192.72 100.00
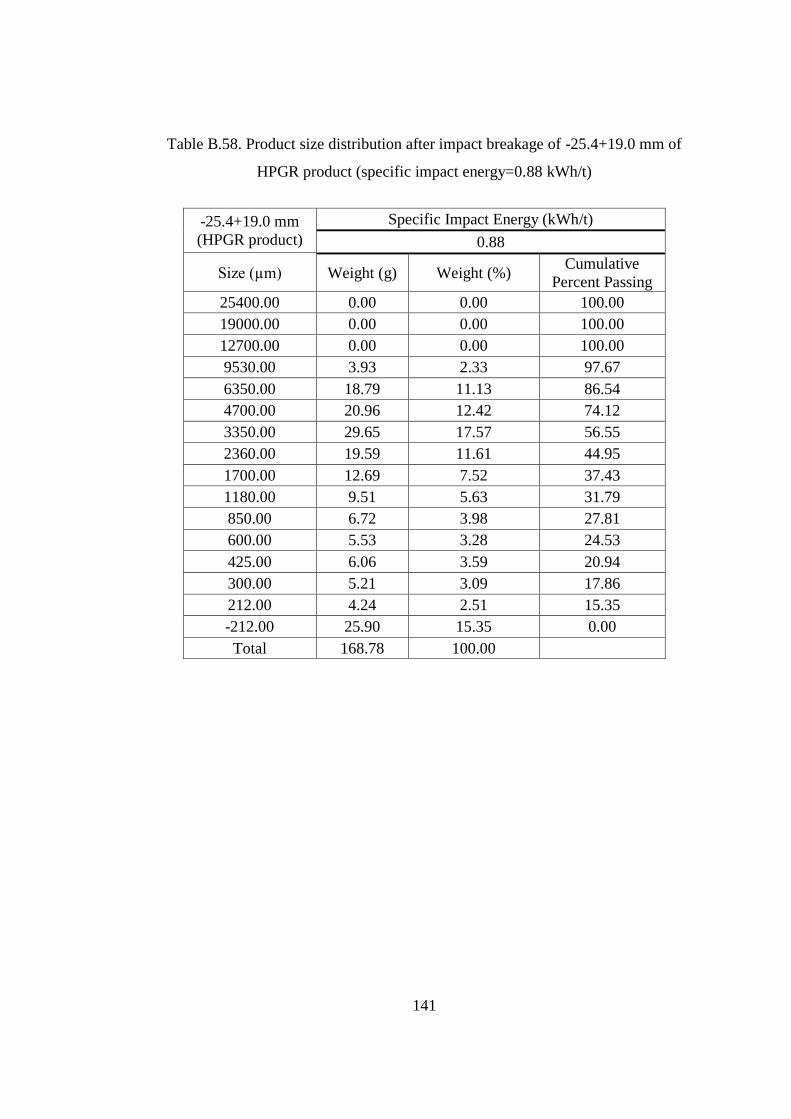
141
Table B.58. Product size distribution after impact breakage of -25.4+19.0 mm of
HPGR product (specific impact energy=0.88 kWh/t)
-25.4+19.0 mm
(HPGR product)
Specific Impact Energy (kWh/t)
0.88
Size (µm) Weight (g) Weight (%) Cumulative
Percent Passing
25400.00 0.00 0.00 100.00
19000.00 0.00 0.00 100.00
12700.00 0.00 0.00 100.00
9530.00 3.93 2.33 97.67
6350.00 18.79 11.13 86.54
4700.00 20.96 12.42 74.12
3350.00 29.65 17.57 56.55
2360.00 19.59 11.61 44.95
1700.00 12.69 7.52 37.43
1180.00 9.51 5.63 31.79
850.00 6.72 3.98 27.81
600.00 5.53 3.28 24.53
425.00 6.06 3.59 20.94
300.00 5.21 3.09 17.86
212.00 4.24 2.51 15.35
-212.00 25.90 15.35 0.00
Total 168.78 100.00

142
Table B.59. Product size distribution after impact breakage of -25.4+19.0 mm of
HPGR feed (specific impact energy=0.01 kWh/t)
-25.4+19.0 mm
(HPGR feed)
Specific Impact Energy (kWh/t)
0.01
Size (µm) Weight (g) Weight (%) Cumulative
Percent Passing
25400.00 0.00 0.00 100.00
19000.00 492.00 75.09 24.91
12700.00 133.25 20.34 4.57
9530.00 16.77 2.56 2.01
6350.00 4.25 0.65 1.36
4700.00 1.36 0.21 1.16
3350.00 1.41 0.22 0.94
2360.00 0.94 0.14 0.80
1700.00 0.64 0.10 0.70
1180.00 0.44 0.07 0.63
850.00 0.35 0.05 0.58
600.00 0.37 0.06 0.52
425.00 0.52 0.08 0.44
300.00 0.43 0.07 0.38
212.00 0.36 0.05 0.32
-212.00 2.11 0.32 0.00
Total 655.20 100.00

143
Table B.60. Product size distribution after impact breakage of -25.4+19.0 mm of
HPGR feed (specific impact energy=0.05 kWh/t)
-25.4+19.0 mm
(HPGR feed)
Specific Impact Energy (kWh/t)
0.05
Size (µm) Weight (g) Weight (%) Cumulative
Percent Passing
25400.00 0.00 0.00 100.00
19000.00 96.09 23.90 76.10
12700.00 157.07 39.06 37.04
9530.00 92.57 23.02 14.02
6350.00 24.08 5.99 8.03
4700.00 7.71 1.92 6.11
3350.00 7.29 1.81 4.30
2360.00 3.45 0.86 3.44
1700.00 2.27 0.56 2.87
1180.00 1.97 0.49 2.39
850.00 1.30 0.32 2.06
600.00 1.07 0.27 1.80
425.00 1.18 0.29 1.50
300.00 0.92 0.23 1.27
212.00 0.79 0.20 1.08
-212.00 4.33 1.08 0.00
Total 402.09 100.00

144
Table B.61. Product size distribution after impact breakage of -25.4+19.0 mm of
HPGR feed (specific impact energy=0.11 kWh/t)
-25.4+19.0 mm
(HPGR feed)
Specific Impact Energy (kWh/t)
0.11
Size (µm) Weight (g) Weight (%) Cumulative
Percent Passing
25400.00 0.00 0.00 100.00
19000.00 80.14 20.94 79.06
12700.00 84.21 22.00 57.06
9530.00 90.91 23.75 33.30
6350.00 52.88 13.82 19.48
4700.00 22.58 5.90 13.58
3350.00 13.16 3.44 10.15
2360.00 7.99 2.09 8.06
1700.00 4.93 1.29 6.77
1180.00 4.10 1.07 5.70
850.00 2.72 0.71 4.99
600.00 2.31 0.60 4.38
425.00 2.64 0.69 3.69
300.00 2.20 0.57 3.12
212.00 1.95 0.51 2.61
-212.00 9.99 2.61 0.00
Total 382.71 100.00

145
Table B.62. Product size distribution after impact breakage of -25.4+19.0 mm of
HPGR feed (specific impact energy=0.22 kWh/t)
-25.4+19.0 mm
(HPGR feed)
Specific Impact Energy (kWh/t)
0.22
Size (µm) Weight (g) Weight (%) Cumulative
Percent Passing
25400.00 0.00 0.00 100.00
19000.00 17.01 5.63 94.37
12700.00 22.05 7.30 87.08
9530.00 84.53 27.97 59.11
6350.00 71.55 23.67 35.43
4700.00 27.16 8.99 26.44
3350.00 20.49 6.78 19.66
2360.00 13.16 4.35 15.31
1700.00 7.45 2.47 12.84
1180.00 5.92 1.96 10.89
850.00 4.54 1.50 9.38
600.00 3.43 1.13 8.25
425.00 4.16 1.38 6.87
300.00 3.32 1.10 5.77
212.00 2.71 0.90 4.88
-212.00 14.74 4.88 0.00
Total 302.22 100.00

146
Table B.63. Product size distribution after impact breakage of -25.4+19.0 mm of
HPGR feed (specific impact energy=0.59 kWh/t)
-25.4+19.0 mm
(HPGR feed)
Specific Impact Energy (kWh/t)
0.59
Size (µm) Weight (g) Weight (%) Cumulative
Percent Passing
25400.00 0.00 0.00 100.00
19000.00 0.00 0.00 100.00
12700.00 9.92 2.96 97.04
9530.00 22.53 6.72 90.31
6350.00 52.19 15.58 74.74
4700.00 55.88 16.68 58.06
3350.00 48.73 14.54 43.51
2360.00 33.70 10.06 33.45
1700.00 19.43 5.80 27.65
1180.00 14.63 4.37 23.29
850.00 10.22 3.05 20.24
600.00 8.53 2.55 17.69
425.00 8.98 2.68 15.01
300.00 7.45 2.22 12.79
212.00 6.51 1.94 10.84
-212.00 36.33 10.84 0.00
Total 335.03 100.00

147
Table B.64. Product size distribution after impact breakage of -25.4+19.0 mm of
HPGR feed (specific impact energy=0.88 kWh/t)
-25.4+19.0 mm
(HPGR feed)
Specific Impact Energy (kWh/t)
0.88
Size (µm) Weight (g) Weight (%) Cumulative
Percent Passing
25400.00 0.00 0.00 100.00
19000.00 0.00 0.00 100.00
12700.00 4.48 1.34 98.66
9530.00 10.34 3.09 95.58
6350.00 41.32 12.34 83.24
4700.00 47.26 14.11 69.13
3350.00 48.62 14.52 54.61
2360.00 40.07 11.96 42.65
1700.00 21.56 6.44 36.21
1180.00 17.20 5.14 31.08
850.00 12.41 3.71 27.37
600.00 10.38 3.10 24.27
425.00 12.76 3.81 20.46
300.00 10.52 3.14 17.32
212.00 8.91 2.66 14.66
-212.00 49.11 14.66 0.00
Total 334.94 100.00

148
Table B.65. t10 and d50 of HPGR product
HPGR product
Size Fraction Specific Impact Energy
(kWh/t)
Median Product Size, d50
(micron)
t10
(%)
-25.4+19 mm
0.88 2791 43.19
0.59 4843 27.80
0.22 9203 11.12
0.11 11923 5.70
0.05 16346 3.12
0.01 21805 0.71
-19+12.7 mm
0.88 2411 37.38
0.44 4135 23.68
0.22 6255 12.95
0.11 9827 6.57
0.03 14081 1.89
-12.7+9.53
mm
1.70 1005 52.45
1.32 1246 47.01
0.88 1853 36.00
0.44 3184 21.78
0.22 5470 10.45
0.11 7218 5.32
0.03 9978 1.47
-9.53+6.35
mm
4.35 499 62.00
2.21 627 55.70
0.92 1408 34.80
0.55 1894 26.17
0.22 4124 8.49
0.10 5313 5.43

149
Table B.65 (continued)
HPGR product
Size Fraction Specific Impact
Energy (kWh/t)
Median Product Size, d50
(micron)
t10
(%)
-6.35+4.7 mm
1.74 547 50.09
0.88 1080 32.02
0.45 2062 18.71
0.23 2745 11.37
-4.7+3.35 mm
3.32 279 59.37
2.18 422 48.40
1.09 871 28.97
0.54 1439 18.35
Table B.66. t10 and d50 of HPGR feed
HPGR feed
Size Fraction Specific Impact
Energy (kWh/t)
Median Product Size, d50
(micron)
t10
(%)
-25.4+19 mm
0.88 2968 7.40
0.59 3952 5.56
0.22 8307 2.64
0.11 11837 1.86
0.05 15021 1.46
0.01 21977 1.00
-19+12.7 mm
0.88 2451 6.34
0.44 4319 3.60
0.22 6350 2.45
0.11 8816 1.76
0.03 14073 1.10

150
Table B.66 (continued)
HPGR feed
Size Fraction Specific Impact Energy
(kWh/t)
Median Product Size, d50
(micron)
t10
(%)
-12.7+9.53 mm
1.70 960 11.46
1.32 1088 10.11
0.88 1693 6.50
0.44 3112 3.54
0.22 4982 2.21
0.11 8275 1.33
0.03 10641 1.03
-9.53+6.35 mm
4.35 492 15.82
2.21 562 13.84
0.92 1380 5.64
0.55 2370 3.28
0.22 4669 1.67
0.10 5459 1.42
-6.35+4.7 mm
1.74 499 10.95
0.88 1144 4.78
0.45 2418 2.26
0.23 3049 1.79
-4.7+3.35 mm
3.32 322 12.32
2.18 460 8.63
1.09 891 4.45
0.54 1969 2.02

151
APPENDIX C
BLANK SIEVE ANALYSIS OF MONOSIZE MATERIAL USED IN BATCH
GRINDING OF HPGR PRODUCT AND HPGR FEED
Table C.1. Size distribution of -3.35+2.36 mm HPGR product used for ball milling
(dB =19.05 mm, ɸBALL=0.35)
Size (µm) Weight (g) Weight (%) Cum. Percent Passing
3350 0.00 0.00 100.00
2360 695.40 96.58 3.42
1700 18.05 2.51 0.91
1180 1.53 0.21 0.70
850 0.54 0.08 0.51
600 0.51 0.07 0.42
425 0.45 0.06 0.40
300 0.40 0.06 0.36
212 0.36 0.05 0.32
150 0.31 0.04 0.31
106 0.28 0.04 0.31
-106 2.16 0.30 0.00
720.00

152
Table C.2. Size distribution of -3.35+2.36 mm HPGR product used for ball milling
(dB =25.4 mm, ɸBALL=0.35)
Size (µm) Weight (g) Weight (%) Cum. Percent Passing
3350 0.00 0.00 100.00
2360.00 701.81 97.47 2.53
1700.00 10.61 1.47 1.05
1180.00 1.50 0.21 0.84
850.00 0.84 0.12 0.73
600.00 0.62 0.09 0.64
425.00 0.60 0.08 0.56
300.00 0.45 0.06 0.50
212.00 0.36 0.05 0.45
150.00 0.33 0.05 0.40
106.00 0.34 0.05 0.35
-106.00 2.54 0.35 0.00
720.00
Table C.3. Size distribution of -3.35+2.36 mm HPGR product used for ball milling
(dB =31.75 mm, ɸBALL=0.35)
Size (µm) Weight (g) Weight (%) Cum. Percent Passing
3350.00 0.00 0.00 100.00
2360.00 703.51 97.71 2.29
1700.00 9.56 1.33 0.96
1180.00 1.63 0.23 0.74
850.00 0.69 0.10 0.64
600.00 0.49 0.07 0.57
425.00 0.52 0.07 0.50
300.00 0.38 0.05 0.45
212.00 0.34 0.05 0.40
150.00 0.31 0.04 0.36
106.00 0.33 0.05 0.31
-106.00 2.24 0.31 0.00
720.00

153
Table C.4. Size distribution of -3.35+2.36 mm HPGR feed used for ball milling
(dB=19.05 mm, ɸBALL=0.35)
Size (µm) Weight (g) Weight (%) Cum. Percent Passing
3350 0.00 0.00 100.00
2360.00 701.90 97.49 2.51
1700.00 11.71 1.63 0.89
1180.00 0.62 0.09 0.80
850.00 0.28 0.04 0.76
600.00 0.26 0.04 0.73
425.00 0.34 0.05 0.68
300.00 0.28 0.04 0.64
212.00 0.28 0.04 0.60
150.00 0.28 0.04 0.56
106.00 0.46 0.06 0.50
-106.00 3.57 0.50 0.00
Total 720 100.00
Table C.5. Size distribution of -3.35+2.36 mm HPGR feed used for ball milling
(dB=25.4 mm, ɸBALL=0.35)
Size (µm) Weight (g) Weight (%) Cum. Percent Passing
3350 0.00 0.00 100.00
2360.00 705.69 98.01 1.99
1700.00 10.58 1.47 0.52
1180.00 0.38 0.05 0.47
850.00 0.18 0.02 0.44
600.00 0.20 0.03 0.41
425.00 0.24 0.03 0.38
300.00 0.16 0.02 0.36
212.00 0.16 0.02 0.34
150.00 0.22 0.03 0.31
106.00 0.32 0.04 0.26
-106.00 1.90 0.26 0.00
Total 720.00

154
Table C.6. Size distribution of -3.35+2.36 mm HPGR feed used for ball milling
(dB=31.75 mm, ɸBALL=0.35)
Size (µm) Weight (g) Weight (%) Cum. Percent Passing
3350 0.00 0.00 100.00
2360.00 705.57 98.00 2.00
1700.00 9.33 1.30 0.71
1180.00 0.45 0.06 0.64
850.00 0.18 0.02 0.62
600.00 0.20 0.03 0.59
425.00 0.24 0.03 0.56
300.00 0.22 0.03 0.53
212.00 0.18 0.02 0.50
150.00 0.26 0.04 0.47
106.00 0.41 0.06 0.41
-106.00 2.96 0.41 0.00
Total 720
Table C.7. Size distribution of -2.36+1.7 mm HPGR product used for ball milling
(dB =19.05 mm, ɸBALL=0.35)
Size (µm) Weight (g) Weight (%) Cum. Percent Passing
2360.00 0.00 0.00 100.00
1700.00 604.03 95.42 4.58
1180.00 23.84 3.77 0.81
850.00 1.06 0.17 0.64
600.00 0.66 0.10 0.54
425.00 0.60 0.09 0.44
300.00 0.39 0.06 0.38
212.00 0.25 0.04 0.34
150.00 0.19 0.03 0.31
106.00 0.31 0.05 0.26
-106.00 1.66 0.26 0.00
Total 633.00

155
Table C.8. Size distribution of -2.36+1.7 mm HPGR product used for ball milling
(dB =25.4 mm, ɸBALL=0.35)
Size (µm) Weight (g) Weight (%) Cum. Percent Passing
2360.00 0.00 0.00 100.00
1700.00 603.08 95.27 4.73
1180.00 23.07 3.64 1.08
850.00 1.28 0.20 0.88
600.00 0.77 0.12 0.76
425.00 0.67 0.11 0.65
300.00 0.45 0.07 0.58
212.00 0.41 0.06 0.52
150.00 0.32 0.05 0.47
106.00 0.41 0.06 0.40
-106.00 2.54 0.40 0.00
Total 633.00
Table C.9. Size distribution of -2.36+1.7 mm HPGR product used for ball milling
(dB=31.75 mm, ɸBALL=0.35)
Size (µm) Weight (g) Weight (%) Cum. Percent Passing
2360.00 0.00 0.00 100.00
1700.00 606.43 95.80 4.20
1180.00 21.59 3.41 0.79
850.00 0.90 0.14 0.64
600.00 0.55 0.09 0.56
425.00 0.47 0.07 0.48
300.00 0.30 0.05 0.43
212.00 0.30 0.05 0.39
150.00 0.26 0.04 0.35
106.00 0.30 0.05 0.30
-106.00 1.91 0.30 0.00
Total 633.00

156
Table C.10. Size distribution of -2.36+1.7 mm HPGR feed used for ball milling
(dB=19.05 mm, ɸBALL=0.35)
Size (µm) Weight (g) Weight (%) Cum. Percent Passing
2360.00 0.00 0.00 100.00
1700.00 603.58 95.35 4.65
1180.00 23.90 3.78 0.87
850.00 0.66 0.10 0.77
600.00 0.40 0.06 0.71
425.00 0.34 0.05 0.65
300.00 0.26 0.04 0.61
212.00 0.24 0.04 0.57
150.00 0.28 0.04 0.53
106.00 0.44 0.07 0.46
-106.00 2.90 0.46 0.00
Total 633.00
Table C.11. Size distribution of -2.36+1.7 mm HPGR feed used for ball milling
(dB=25.4 mm, ɸBALL=0.35)
Size (µm) Weight (g) Weight (%) Cum. Percent Passing
2360.00 0.00 0.00 100.00
1700.00 607.50 95.97 4.03
1180.00 21.56 3.41 0.62
850.00 0.49 0.08 0.55
600.00 0.31 0.05 0.50
425.00 0.31 0.05 0.45
300.00 0.21 0.03 0.41
212.00 0.19 0.03 0.38
150.00 0.23 0.04 0.35
106.00 0.33 0.05 0.29
-106.00 1.86 0.29 0.00
Total 633.00

157
Table C.12. Size distribution of -2.36+1.7 mm HPGR feed used for ball milling
(dB=31.75 mm, ɸBALL=0.35)
Size (µm) Weight (g) Retained % Cum. Passing %
2360 0.00 0.00 100.00
1700.00 614.32 97.05 2.95
1180.00 16.77 2.65 0.30
850.00 0.21 0.03 0.27
600.00 0.17 0.03 0.24
425.00 0.17 0.03 0.21
300.00 0.08 0.01 0.20
212.00 0.08 0.01 0.19
150.00 0.08 0.01 0.17
106.00 0.13 0.02 0.15
-106.00 0.98 0.15 0.00
Total 633.00
Table C.13. Size distribution of –1.7+1.18 mm HPGR product used for ball milling
(dB=19.05 mm, ɸBALL=0.35)
Size (µm) Weight (g) Weight (%) Cum. Percent Passing
1700.00 0.00 0.00 100.00
1180.00 616.69 97.42 2.58
850.00 11.90 1.88 0.70
600.00 0.69 0.11 0.59
425.00 0.51 0.08 0.51
300.00 0.29 0.05 0.46
212.00 0.29 0.05 0.41
150.00 0.23 0.04 0.38
106.00 0.25 0.04 0.34
-106.00 2.13 0.34 0.00
Total 633.00

158
Table C.14. Size distribution of –1.7+1.18 mm HPGR product used for ball milling
(dB=25.4 mm, ɸBALL=0.35)
Size (µm) Weight (g) Weight (%) Cum. Percent Passing
1700.00 0.00 0.00 100.00
1180.00 604.89 95.56 4.44
850.00 20.44 3.23 1.21
600.00 1.12 0.18 1.03
425.00 0.96 0.15 0.88
300.00 0.68 0.11 0.77
212.00 0.52 0.08 0.69
150.00 0.48 0.08 0.62
106.00 0.48 0.08 0.54
-106.00 3.41 0.54 0.00
Total 633.00
Table C.15. Size distribution of –1.7+1.18 mm HPGR product used for ball milling
(dB=31.75 mm, ɸBALL=0.35)
Size (µm) Weight (g) Weight (%) Cum. Percent Passing
1700.00 0.00 0.00 100.00
1180.00 615.39 97.22 2.78
850.00 10.73 1.69 1.09
600.00 1.09 0.17 0.92
425.00 0.82 0.13 0.79
300.00 0.53 0.08 0.70
212.00 0.43 0.07 0.63
150.00 0.35 0.06 0.58
106.00 0.43 0.07 0.51
-106.00 3.24 0.51 0.00
Total 633

159
Table C.16. Size distribution of –1.7+1.18 mm HPGR feed used for ball milling
(dB=19.05 mm, ɸBALL=0.35)
Size (µm) Weight (g) Weight (%) Cum. Percent Passing
1700.00 0.00 0.00 100.00
1180.00 622.98 98.42 1.58
850.00 7.34 1.16 0.42
600.00 0.20 0.03 0.39
425.00 0.24 0.04 0.35
300.00 0.16 0.03 0.33
212.00 0.16 0.03 0.30
150.00 0.12 0.02 0.28
106.00 0.20 0.03 0.25
-106.00 1.58 0.25 0.00
Total 633.00
Table C.17. Size distribution of –1.7+1.18 mm HPGR feed used for ball milling
(dB=25.4 mm, ɸBALL=0.35)
Size (µm) Weight (g) Weight (%) Cum. Percent Passing
1700.00 0.00 0.00 100.00
1180.00 622.40 98.33 1.67
850.00 7.80 1.23 0.44
600.00 0.40 0.06 0.38
425.00 0.25 0.04 0.34
300.00 0.18 0.03 0.31
212.00 0.14 0.02 0.29
150.00 0.18 0.03 0.26
106.00 0.18 0.03 0.23
-106.00 1.47 0.23 0.00
Total 633.00

160
Table C.18. Size distribution of –1.7+1.18 mm HPGR feed used for ball milling
(dB=31.75 mm, ɸBALL=0.35)
Size (µm) Weight (g) Weight (%) Cum. Percent Passing
1700.00 0.00 0.00 100.00
1180.00 623.45 98.49 1.51
850.00 6.71 1.06 0.45
600.00 0.39 0.06 0.39
425.00 0.24 0.04 0.35
300.00 0.12 0.02 0.33
212.00 0.12 0.02 0.31
150.00 0.16 0.02 0.29
106.00 0.20 0.03 0.26
-106.00 1.62 0.26 0.00
Total 633.00

161
APPENDIX D
BATCH GRINDING TEST DATA
Table D.1. Product size distribution after batch grinding of -3.35+2.36 mm of
HPGR product (dB =19.05 mm, ɸBALL=0.35)
-3.35+2.36 mm (HPGR product) - 19.05 mm ball
Size (µm)
0.5 min 1 min
Weight
(g)
Weight
(%)
Cum.
Percent
Passing
Weight
(g)
Weight
(%)
Cum.
Percent
Passing
3350 0 0.00 100.00 0.00 0.00 100.00
2360 596.66 82.87 17.13 550.23 76.42 23.58
1700 62.87 8.73 8.40 76.87 10.68 12.90
1180 18.25 2.53 5.86 26.07 3.62 9.28
850 8.69 1.21 4.66 11.97 1.66 7.62
600 5.07 0.70 3.95 7.35 1.02 6.60
425 3.98 0.55 3.40 6.30 0.88 5.72
300 3.12 0.43 2.97 4.62 0.64 5.08
212 2.43 0.34 2.63 3.85 0.54 4.55
150 1.99 0.28 2.35 3.74 0.52 4.03
106 1.99 0.28 2.08 4.17 0.58 3.45
-106 14.95 2.08 0.00 24.82 3.45 0.00
Total 720.00
720.00

162
Table D.1 (continued)
Size
(µm)
2 min 4 min
Weight
(g)
Weight
(%)
Cum. Percent
Passing
Weight
(g)
Weight
(%)
Cum.
Percent
Passing
3350 0.00 0.00 100.00 0.00 0.00 100.00
2360 492.39 68.39 31.61 435.66 60.51 39.49
1700 84.82 11.78 19.83 98.51 13.68 25.81
1180 32.80 4.56 15.28 36.56 5.08 20.73
850 15.26 2.12 13.16 16.76 2.33 18.40
600 9.14 1.27 11.89 9.90 1.37 17.03
425 8.35 1.16 10.73 8.84 1.23 15.80
300 6.21 0.86 9.87 7.01 0.97 14.83
212 5.66 0.79 9.08 6.84 0.95 13.88
150 5.71 0.79 8.29 8.11 1.13 12.75
106 7.13 0.99 7.30 10.57 1.47 11.28
-106 52.53 7.30 0.00 81.23 11.28 0.00
Total 720.00
720.00
Size
(µm)
8 min
Weight
(g)
Weight
(%)
Cum. Percent
Passing
3350 0.00 0.00 100.00
2360 369.26 51.29 48.71
1700 95.93 13.32 35.39
1180 36.02 5.00 30.39
850 15.50 2.15 28.24
600 9.30 1.29 26.94
425 7.84 1.09 25.85
300 6.36 0.88 24.97
212 6.98 0.97 24.00
150 9.16 1.27 22.73
106 15.31 2.13 20.60
-106 148.35 20.60 0.00
Total 720.00

163
Table D.2. Product size distribution after batch grinding of -3.35+2.36 mm of
HPGR product (dB =25.4 mm, ɸBALL=0.35)
-3.35+2.36 mm (HPGR product) - 25.4 mm ball
Size
(µm)
0.5 min 1 min
Weight
(g)
Weight
(%)
Cum. Percent
Passing
Weight
(g)
Weight
(%)
Cum.
Percent
Passing
3350 0.00 0.00 100.00 0.00 0.00 100.00
2360 585.48 81.32 18.68 533.35 74.08 25.92
1700 62.98 8.75 9.94 80.73 11.21 14.71
1180 22.66 3.15 6.79 32.68 4.54 10.17
850 9.73 1.35 5.44 14.41 2.00 8.17
600 6.06 0.84 4.60 8.59 1.19 6.98
425 5.24 0.73 3.87 7.45 1.03 5.94
300 3.61 0.50 3.37 5.33 0.74 5.20
212 2.93 0.41 2.96 4.49 0.62 4.58
150 2.79 0.39 2.57 4.18 0.58 4.00
106 2.77 0.38 2.19 4.65 0.65 3.35
-106 15.76 2.19 0.00 24.15 3.35 0.00
Total 720.00
720.00
Size
(µm)
2 min 4 min
Weight
(g)
Weight
(%)
Cum. Percent
Passing
Weight
(g)
Weight
(%)
Cum.
Percent
Passing
3350 0.00 0.00 100.00 0.00 0.00 100.00
2360 459.11 63.77 36.23 381.63 53.00 47.00
1700 96.19 13.36 22.88 109.57 15.22 31.78
1180 41.12 5.71 17.16 48.56 6.74 25.03
850 19.68 2.73 14.43 23.15 3.22 21.82
600 12.16 1.69 12.74 14.55 2.02 19.80
425 11.45 1.59 11.15 13.87 1.93 17.87
300 8.56 1.19 9.96 11.25 1.56 16.31
212 7.75 1.08 8.89 11.43 1.59 14.72
150 7.91 1.10 7.79 11.94 1.66 13.06
106 8.66 1.20 6.59 13.92 1.93 11.13
-106 47.42 6.59 0.00 80.13 11.13 0.00
Total 720.00
720.00

164
Table D.2 (continued)
8 min
Size (µm) Weight (g) Weight (%) Cum. Percent Passing
3350 0.00 0.00 100.00
2360 287.96 39.99 60.01
1700 105.16 14.61 45.40
1180 51.75 7.19 38.21
850 24.06 3.34 34.87
600 15.65 2.17 32.70
425 15.33 2.13 30.57
300 13.74 1.91 28.66
212 16.18 2.25 26.41
150 18.28 2.54 23.87
106 25.80 3.58 20.29
-106 146.08 20.29 0.00
Total 720.00

165
Table D.3. Product size distribution after batch grinding of -3.35+2.36 mm of
HPGR product (dB =31.75 mm, ɸBALL=0.35)
-3.35+2.36 mm (HPGR product) - 31.75 mm
Size
(µm)
0.50 min 1 min
Weight
(g)
Weight
(%)
Cum. Percent
Passing
Weight
(g)
Weight
(%)
Cum.
Percent
Passing
3350 0.00 0.00 100.00 0.00 0.00 100.00
2360 572.18 79.47 20.53 512.85 71.23 28.77
1700 72.61 10.08 10.45 93.86 13.04 15.74
1180 26.03 3.61 6.83 36.90 5.13 10.61
850 11.01 1.53 5.30 16.25 2.26 8.35
600 6.34 0.88 4.42 9.69 1.35 7.01
425 5.16 0.72 3.70 8.26 1.15 5.86
300 3.70 0.51 3.19 5.79 0.80 5.06
212 2.85 0.40 2.79 4.58 0.64 4.42
150 2.58 0.36 2.44 4.20 0.58 3.84
106 2.71 0.38 2.06 4.48 0.62 3.22
-106 14.83 2.06 0.00 23.16 3.22 0.00
Total 720.00 720.00
Size
(µm)
2 min 4 min
Weight
(g)
Weight
(%)
Cum. Percent
Passing
Weight
(g)
Weight
(%)
Cum.
Percent
Passing
3350 0.00 0.00 100.00 0.00 0.00 100.00
2360 421.27 58.51 41.49 306.89 42.62 57.38
1700 114.62 15.92 25.57 127.37 17.69 39.69
1180 51.58 7.16 18.41 65.90 9.15 30.53
850 24.72 3.43 14.97 33.02 4.59 25.95
600 15.12 2.10 12.87 21.99 3.05 22.89
425 13.32 1.85 11.02 21.04 2.92 19.97
300 9.78 1.36 9.67 16.83 2.34 17.63
212 8.48 1.18 8.49 15.09 2.10 15.54
150 7.97 1.11 7.38 14.63 2.03 13.50
106 8.56 1.19 6.19 16.67 2.32 11.19
-106 44.57 6.19 0.00 80.55 11.19 0.00
Total 720.00
720.00

166
Table D.3 (continued)
8 min
Size (µm) Weight (g) Weight (%) Cum. Percent Passing
3350 0.00 0.00 100.00
2360 197.02 27.36 72.64
1700 107.72 14.96 57.67
1180 68.93 9.57 48.10
850 39.41 5.47 42.63
600 28.37 3.94 38.69
425 28.97 4.02 34.66
300 25.66 3.56 31.10
212 24.97 3.47 27.63
150 26.09 3.62 24.01
106 29.81 4.14 19.87
-106 143.05 19.87 0.00
Total 720.00

167
Table D.4. Product size distribution after batch grinding of -3.35+2.36 mm of
HPGR feed (dB =19.05 mm, ɸBALL=0.35)
-3.35+2.36 mm (HPGR feed) - 19.05 mm ball size
Size
(µm)
0.5 min 1 min
Weight
(g)
Weight
(%)
Cum. Percent
Passing
Weight
(g)
Weight
(%)
Cum.
Percent
Passing
3350 0.00 0.00 100.00 0.00 0.00 100.00
2360 632.17 87.80 12.20 589.17 81.83 18.17
1700 45.29 6.29 5.91 60.27 8.37 9.80
1180 10.96 1.52 4.39 17.07 2.37 7.43
850 4.51 0.63 3.76 7.38 1.03 6.40
600 3.25 0.45 3.31 5.06 0.70 5.70
425 3.19 0.44 2.86 5.32 0.74 4.96
300 2.28 0.32 2.55 3.97 0.55 4.41
212 1.78 0.25 2.30 3.09 0.43 3.98
150 1.76 0.24 2.06 3.13 0.43 3.55
106 2.20 0.30 1.75 3.67 0.51 3.04
-106 12.62 1.75 0.00 21.87 3.04 0.00
Total 720.00 720.00
Size
(µm)
2 min 4 min
Weight
(g)
Weight
(%)
Cum. Percent
Passing
Weight
(g)
Weight
(%)
Cum.
Percent
Passing
3350 0.00 0.00 100.00 0.00 0.00 100.00
2360 533.47 74.09 25.91 390.76 54.27 45.73
1700 78.62 10.92 14.99 96.26 13.37 32.36
1180 22.18 3.08 11.91 27.04 3.76 28.60
850 9.72 1.35 10.56 11.60 1.61 26.99
600 7.12 0.99 9.57 7.57 1.05 25.94
425 7.52 1.04 8.52 7.49 1.04 24.90
300 5.89 0.82 7.71 6.83 0.95 23.95
212 5.00 0.69 7.01 8.02 1.11 22.84
150 5.06 0.70 6.31 10.13 1.41 21.43
106 6.07 0.84 5.47 16.14 2.24 19.19
-106 39.36 5.47 0.00 138.17 19.19 0.00
Total 720.00
720.00

168
Table D.4 (continued)
8 min
Size (µm) Weight (g) Weight (%) Cum. Percent Passing
3350 0.00 0.00 100.00
2360 390.76 54.27 45.73
1700 96.26 13.37 32.36
1180 27.04 3.76 28.60
850 11.60 1.61 26.99
600 7.57 1.05 25.94
425 7.49 1.04 24.90
300 6.83 0.95 23.95
212 8.02 1.11 22.84
150 10.13 1.41 21.43
106 16.14 2.24 19.19
-106 138.17 19.19 0.00
Total 720.00
Table D.5. Product size distribution after batch grinding of -3.35+2.36 mm of
HPGR feed (dB =25.4 mm, ɸBALL=0.35)
-3.35+2.36 mm (HPGR Feed) - 25.4 mm ball size
Size
(µm)
0.5 min 1 min
Weight
(g)
Weight
(%)
Cum. Percent
Passing
Weight
(g)
Weight
(%)
Cum.
Percent
Passing
3350 0.00 0.00 100.00 0.00 0.00 100.00
2360 623.38 86.58 13.42 574.09 79.73 20.27
1700 48.42 6.72 6.69 65.73 “9.13 11.14
1180 12.77 1.77 4.92 19.52 2.71 8.43
850 5.58 0.77 4.15 9.15 1.27 7.15
600 3.88 0.54 3.61 6.24 0.87 6.29
425 3.72 0.52 3.09 6.29 0.87 5.41
300 2.59 0.36 2.73 4.65 0.65 4.77
212 2.06 0.29 2.44 3.75 0.52 4.25
150 2.00 0.28 2.17 3.67 0.51 3.74
106 2.42 0.34 1.83 4.29 0.60 3.14
-106 13.18 1.83 0.00 22.62 3.14 0.00
Total 720.00
720.00

169
Table D.5 (continued)
Size
(µm)
2 min 4 min
Weight
(g)
Weight
(%)
Cum. Percent
Passing
Weight
(g)
Weight
(%)
Cum.
Percent
Passing
3350 0.00 0.00 100.00 0.00 0.00 100.00
2360 503.45 69.92 30.08 425.69 59.12 40.88
1700 86.22 11.97 18.10 100.11 13.90 26.97
1180 29.35 4.08 14.03 36.34 5.05 21.92
850 13.67 1.90 12.13 16.86 2.34 19.58
600 9.48 1.32 10.81 12.13 1.69 17.90
425 9.83 1.37 9.44 12.70 1.76 16.13
300 7.49 1.04 8.41 10.84 1.51 14.63
212 6.47 0.90 7.51 10.42 1.45 13.18
150 6.40 0.89 6.62 10.71 1.49 11.69
106 7.91 1.10 5.52 14.06 1.95 9.74
-106 39.73 5.52 0.00 70.13 9.74 0.00
Total 720.00
720.00
Size
(µm)
8 min
Weight
(g)
Weight
(%)
Cum. Percent
Passing
3350 0.00 0.00 100.00
2360 337.44 46.87 53.13
1700 103.09 14.32 38.81
1180 37.27 5.18 33.64
850 17.99 2.50 31.14
600 11.66 1.62 29.52
425 12.96 1.80 27.72
300 12.86 1.79 25.93
212 15.34 2.13 23.80
150 17.61 2.45 21.36
106 23.75 3.30 18.06
-106 130.02 18.06 0.00
Total 720.00

170
Table D.6. Product size distribution after batch grinding of -3.35+2.36 mm of
HPGR feed (dB =31.75 mm, ɸBALL=0.35)
-3.35+.2.36 mm (HPGR feed) - 31.75 mm ball size
Size
(µm)
0.5 min 1 min
Weight
(g)
Weight
(%)
Cum. Percent
Passing
Weight
(g)
Weight
(%)
Cum.
Percent
Passing
3350 0.00 0.00 100.00 0.00 0.00 100.00
2360 610.09 84.74 15.26 547.10 75.99 24.01
1700 52.80 7.33 7.93 73.62 10.22 13.79
1180 16.66 2.31 5.62 26.95 3.74 10.05
850 6.99 0.97 4.65 12.04 1.67 7.81
600 4.57 0.63 4.01 7.64 1.06 6.75
425 4.35 0.60 3.41 7.66 1.06 5.69
300 3.00 0.42 2.99 5.67 0.79 4.90
212 2.40 0.33 2.66 4.62 0.64 4.26
150 2.28 0.32 2.34 4.40 0.61 3.65
106 2.70 0.38 1.97 5.13 0.71 2.94
-106 14.16 1.97 0.00 25.17 3.50 0.00
Total 720.00
720.00
Size
(micron)
2 min 4 min
Weight
(g)
Weight
(%)
Cum. Percent
Passing
Weight
(g)
Weight
(%)
Cum.
Percent
Passing
3350 0.00 0.00 100.00 0.00 0.00 100.00
2360 451.72 62.74 37.26 347.02 48.20 51.80
1700 101.04 14.03 23.23 117.79 16.36 35.44
1180 38.47 5.34 17.89 50.86 7.06 28.38
850 19.43 2.70 15.19 26.39 3.66 24.72
600 13.35 1.85 13.33 18.50 2.57 22.15
425 13.50 1.88 11.46 20.33 2.82 19.32
300 10.30 1.43 10.03 16.48 2.29 17.03
212 8.50 1.18 8.85 14.87 2.07 14.97
150 8.39 1.17 7.68 14.02 1.95 13.02
106 9.32 1.30 6.39 16.26 2.26 10.76
-106 45.97 6.39 0.00 77.48 10.76 0.00
Total 720.00
720.00

171
Table D.6 (continued)
8 min
Size (µm) Weight (g) Weight (%) Cum. Percent Passing
3350 0.00 0.00 100.00
2360 231.39 32.14 67.86
1700 109.51 15.21 52.65
1180 57.95 8.05 44.60
850 31.54 4.38 40.22
600 22.61 3.14 37.08
425 26.31 3.65 33.43
300 24.70 3.43 30.00
212 25.01 3.47 26.53
150 24.60 3.42 23.11
106 29.83 4.14 18.97
-106 136.55 18.97 0.00
Total 720.00
Table D.7. Product size distribution after batch grinding of -2.36+1.7 mm of HPGR
product (dB =19.05 mm, ɸBALL=0.35)
-2.36+1.7 mm (HPGR product) - 19.05 mm ball size
Size
(µm)
0.25 min 0.5 min
Weight
(g)
Weight
(%)
Cum. Percent
Passing
Weight
(g)
Weight
(%)
Cum.
Percent
Passing
2360 0.00 0.00 100.00 0.00 0.00 100.00
1700 526.97 83.25 16.75 485.92 76.76 23.24
1180 66.04 10.43 6.32 83.18 13.14 10.09
850 13.11 2.07 4.25 19.26 3.04 7.05
600 6.40 1.01 3.24 9.60 1.52 5.54
425 4.63 0.73 2.51 7.21 1.14 4.40
300 2.49 0.39 2.11 4.22 0.67 3.73
212 1.92 0.30 1.81 3.35 0.53 3.20
150 1.58 0.25 1.56 2.97 0.47 2.73
106 1.54 0.24 1.31 2.73 0.43 2.30
-106 8.32 1.31 0.00 14.56 2.30 0.00
Total 633.00
633.00

172
Table D.7 (continued)
Size
(µm)
1 min 2 min
Weight
(g)
Weight
(%)
Cum. Percent
Passing
Weight
(g)
Weight
(%)
Cum.
Percent
Passing
2360 0.00 0.00 100.00 0.00 0.00 100.00
1700 434.93 68.71 31.29 373.89 59.07 40.93
1180 107.22 16.94 14.35 116.42 18.39 22.54
850 25.84 4.08 10.27 34.10 5.39 17.16
600 12.69 2.00 8.26 17.81 2.81 14.34
425 9.74 1.54 6.73 13.75 2.17 12.17
300 5.72 0.90 5.82 8.72 1.38 10.79
212 5.07 0.80 5.02 8.04 1.27 9.52
150 4.41 0.70 4.33 7.47 1.18 8.34
106 4.36 0.69 3.64 8.22 1.30 7.04
-106 23.02 3.64 0.00 44.58 7.04 0.00
Total 633.00
633.00
Size
(µm)
4 min 8 min
Weight
(g)
Weight
(%)
Cum. Percent
Passing
Weight
(g)
Weight
(%)
Cum.
Percent
Passing
2360 0.00 0.00 100.00 0.00 0.00 100.00
1700 317.48 50.15 49.85 250.03 39.50 60.50
1180 115.83 18.30 31.55 111.39 17.60 42.90
850 37.60 5.94 25.61 37.49 5.92 36.98
600 20.30 3.21 22.40 19.88 3.14 33.84
425 16.03 2.53 19.87 15.88 2.51 31.33
300 10.86 1.72 18.15 11.02 1.74 29.59
212 10.44 1.65 16.50 11.64 1.84 27.75
150 10.86 1.72 14.79 13.31 2.10 25.65
106 13.32 2.10 12.68 18.74 2.96 22.69
-106 80.28 12.68 0.00 143.63 22.69 0.00
Total 633.00
633.00

173
Table D.8. Product size distribution after batch grinding of -2.36+1.7 mm of HPGR
product (dB =25.4 mm, ɸBALL=0.35)
-2.36+1.7 mm (HPGR product) - 25.4 mm ball size
Size
(µm)
0.25 min 0.5 min
Weight
(g)
Weight
(%)
Cum. Percent
Passing
Weight
(g)
Weight
(%)
Cum.
Percent
Passing
2360 0 0 100 0.00 0.00 100.00
1700.0
0 529.09 83.58 16.42 485.49 76.70 23.30
1180.0
0 63.15 9.98 6.44 81.37 12.85 10.45
850.00 13.48 2.13 4.31 21.46 3.39 7.06
600.00 6.53 1.03 3.28 10.26 1.62 5.44
425.00 4.55 0.72 2.56 7.47 1.18 4.26
300.00 2.50 0.40 2.16 4.25 0.67 3.59
212.00 1.98 0.31 1.85 3.38 0.53 3.05
150.00 1.64 0.26 1.59 2.81 0.44 2.61
106.00 1.60 0.25 1.34 2.83 0.45 2.16
-
106.00 8.47 1.34 0.00 13.68 2.16 0.00
Total 633.00
633.00
Size
(µm)
1 min 2 min
Weight
(g)
Weight
(%)
Cum. Percent
Passing
Weight
(g)
Weight
(%)
Cum.
Percent
Passing
2360 0.00 0.00 100.00 0.00 0.00 100.00
1700 433.89 68.54 31.46 363.97 57.50 42.50
1180 99.78 15.76 15.69 115.96 18.32 24.18
850 29.84 4.71 10.98 40.11 6.34 17.85
600 14.83 2.34 8.64 21.10 3.33 14.51
425 11.30 1.78 6.85 16.35 2.58 11.93
300 6.54 1.03 5.82 10.33 1.63 10.30
212 5.42 0.86 4.96 8.93 1.41 8.89
150 4.66 0.74 4.23 8.11 1.28 7.61
106 4.74 0.75 3.48 8.01 1.27 6.34
-106 22.01 3.48 0.00 40.13 6.34 0.00
Total 633.00
633.00

174
Table D.8 (continued)
Size
(µm)
4 min 8 min
Weight
(g)
Weight
(%)
Cum.
Percent
Passing
Weight (g) Weight
(%)
Cum.
Percent
Passing
2360 0.00 0.00 100.00 0.00 0.00 100.00
1700 277.89 43.90 56.10 181.74 28.71 71.29
1180 127.20 20.09 36.01 118.18 18.67 52.62
850 49.20 7.77 28.23 53.09 8.39 44.23
600 27.99 4.42 23.81 33.28 5.26 38.97
425 22.67 3.58 20.23 28.40 4.49 34.49
300 15.45 2.44 17.79 21.09 3.33 31.16
212 14.36 2.27 15.52 21.85 3.45 27.71
150 13.51 2.13 13.39 22.21 3.51 24.20
106 14.99 2.37 11.02 25.89 4.09 20.11
-106 69.75 11.02 0.00 127.27 20.11 0.00
Total 633.00
633.00
Table D.9. Product size distribution after batch grinding of -2.36+1.7 mm of HPGR
product (dB =31.75 mm, ɸBALL=0.35)
-2.36+1.7 mm (HPGR product) - 31.75 mm ball size
Size
(µm)
0.25 min 0.5 min
Weight
(g)
Weight
(%)
Cum. Percent
Passing
Weight
(g)
Weight
(%)
Cum.
Percent
Passing
2360 0.00 0 100 0.00 0.00 100.00
1700.00 529.89 83.71 16.29 474.17 74.91 25.09
1180.00 60.12 9.50 6.79 87.13 13.76 11.33
850.00 14.78 2.34 4.46 24.03 3.80 7.53
600.00 6.46 1.02 3.44 11.43 1.81 5.73
425.00 4.79 0.76 2.68 7.90 1.25 4.48
300.00 2.55 0.40 2.28 4.43 0.70 3.78
212.00 2.09 0.33 1.94 3.51 0.55 3.22
150.00 1.72 0.27 1.67 2.95 0.47 2.76
106.00 1.64 0.26 1.41 2.93 0.46 2.29
-106.00 8.96 1.41 0.00 14.52 2.29 0.00
Total 633.00 633.00

175
Table D.9 (continued)
Size
(µm)
1 min 2 min
Weight
(g)
Weight
(%)
Cum. Percent
Passing
Weigh
t (g)
Weight
(%)
Cum.
Percent
Passing
2360 0.00 0.00 100.00 0.00 0.00 100.00
1700 403.82 63.80 36.20 321.82 50.84 49.16
1180 117.56 18.57 17.63 140.65 22.22 26.94
850 35.51 5.61 12.02 51.64 8.16 18.78
600 17.39 2.75 9.27 26.72 4.22 14.56
425 12.81 2.02 7.25 19.85 3.14 11.42
300 7.07 1.12 6.13 11.43 1.81 9.62
212 5.58 0.88 5.25 9.09 1.44 8.18
150 5.20 0.82 4.43 8.12 1.28 6.90
106 4.90 0.77 3.66 7.96 1.26 5.64
-106 23.14 3.66 0.00 35.71 5.64 0.00
Total 633.00
633.00
Size
(µm)
4 min 8 min
Weight
(g)
Weight
(%)
Cum. Percent
Passing
Weigh
t (g)
Weight
(%)
Cum.
Percent
Passing
2360 0.00 0.00 100.00 0.00 0.00 100.00
1700 210.54 33.26 66.74 96.38 15.23 84.77
1180 152.05 24.02 42.72 107.24 16.94 67.83
850 71.17 11.24 31.48 77.91 12.31 55.52
600 40.23 6.36 25.12 54.59 8.62 46.90
425 31.77 5.02 20.10 49.94 7.89 39.01
300 19.75 3.12 16.98 35.15 5.55 33.46
212 16.79 2.65 14.33 30.48 4.82 28.64
150 13.89 2.19 12.13 27.57 4.36 24.29
106 13.95 2.20 9.93 29.07 4.59 19.70
-106 62.86 9.93 0.00 124.67 19.70 0.00
Total 633.00
633.00

176
Table D.10. Product size distribution after batch grinding of -2.36+1.7 mm of
HPGR feed (dB =19.05 mm, ɸBALL=0.35)
-2.36+1.7 mm (HPGR feed) - 19.05 mm ball size
Size
(µm)
0.25 min 0.5 min
Weight
(g)
Weight
(%)
Cum. Percent
Passing
Weight
(g)
Weight
(%)
Cum.
Percent
Passing
2360 0.00 0.00 100.00 0.00 0.00 100.00
1700 554.98 87.68 12.32 518.65 81.94 18.06
1180 49.20 7.77 4.55 69.19 10.93 7.13
850 7.88 1.24 3.31 12.50 1.97 5.16
600 3.81 0.60 2.71 6.37 1.01 4.15
425 3.20 0.51 2.20 5.31 0.84 3.32
300 1.87 0.30 1.90 3.02 0.48 2.84
212 1.41 0.22 1.68 2.22 0.35 2.49
150 1.45 0.23 1.45 2.12 0.34 2.15
106 1.49 0.24 1.22 2.38 0.38 1.77
-106 7.70 1.22 0.00 11.23 1.77 0.00
Total 633.00
633.00
Size
(µm)
1 min 2 min
Weight
(g)
Weight
(%)
Cum. Percent
Passing
Weight
(g)
Weight
(%)
Cum.
Percent
Passing
2360 0.00 0.00 100.00 0.00 0.00 100.00
1700 474.51 74.96 25.04 413.92 65.39 34.61
1180 83.41 13.18 11.86 100.50 15.88 18.73
850 19.05 3.01 8.85 25.41 4.01 14.72
600 10.43 1.65 7.20 14.48 2.29 12.43
425 8.72 1.38 5.83 13.11 2.07 10.36
300 5.19 0.82 5.01 8.25 1.30 9.06
212 3.94 0.62 4.38 6.52 1.03 8.03
150 3.68 0.58 3.80 6.35 1.00 7.02
106 4.32 0.68 3.12 7.33 1.16 5.86
-106 19.76 3.12 0.00 37.12 5.86 0.00
Total 633.00
633.00

177
Table D.10 (continued)
Size
(µm)
4 min 8 min
Weight
(g)
Weight
(%)
Cum. Percent
Passing
Weight
(g)
Weight
(%)
Cum. Percent
Passing
2360 0.00 0.00 100.00 0.00 0.00 100.00
1700 350.45 55.36 44.64 266.69 42.13 57.87
1180 105.63 16.69 27.95 107.68 17.01 40.86
850 29.61 4.68 23.27 30.71 4.85 36.01
600 17.18 2.71 20.56 17.78 2.81 33.20
425 16.16 2.55 18.01 16.43 2.60 30.60
300 11.22 1.77 16.23 12.61 1.99 28.61
212 9.90 1.56 14.67 12.88 2.03 26.58
150 10.18 1.61 13.06 14.74 2.33 24.25
106 12.26 1.94 11.12 19.26 3.04 21.20
-106 70.41 11.12 0.00 134.22 21.20 0.00
Total 633.00
633.00
Table D.11. Product size distribution after batch grinding of -2.36+1.7 mm of
HPGR feed (dB =25.4 mm, ɸBALL=0.35)
-2.36+1.7 mm (HPGR feed) - 25.4 mm ball size
Size
(µm)
0.25 min 0.50 min
Weight
(g)
Weight
(%)
Cum. Percent
Passing
Weight
(g)
Weight
(%)
Cum.
Percent
Passing
2360 0.00 0.00 100.00 0.00 0.00 100.00
1700 552.61 87.30 12.70 520.09 82.16 17.84
1180 50.00 7.90 4.80 57.27 9.05 8.79
850 8.71 1.38 3.42 14.12 2.23 6.56
600 4.37 0.69 2.73 10.82 1.71 4.85
425 3.61 0.57 2.16 6.39 1.01 3.84
300 2.06 0.33 1.84 3.51 0.55 3.29
212 1.57 0.25 1.59 2.68 0.42 2.86
150 1.55 0.24 1.35 2.80 0.44 2.42
106 1.35 0.21 1.13 3.17 0.50 1.92
-106 7.17 1.13 0.00 12.16 1.92 0.00
Total 633.00
633.00

178
Table D.11 (continued)
Size
(µm)
1 min 2 min
Weight
(g)
Weight
(%)
Cum. Percent
Passing
Weight
(g)
Weight
(%)
Cum.
Percent
Passing
2360 0.00 0.00 100.00 0.00 0.00 100.00
1700 457.95 72.35 27.65 386.75 61.10 38.90
1180 83.46 13.18 14.47 105.95 16.74 22.16
850 22.35 3.53 9.73 31.09 4.91 17.25
600 12.13 1.92 7.81 17.64 2.79 13.87
425 10.97 1.73 6.08 15.60 2.46 11.40
300 6.09 0.96 5.12 9.86 1.56 9.85
212 4.65 0.73 4.38 7.94 1.25 8.59
150 4.81 0.76 3.62 8.06 1.27 7.32
106 5.21 0.82 2.80 8.70 1.37 5.94
-106 25.39 4.01 0.00 41.42 6.54 0.00
Total 633.00
633.00
Size
(µm)
4 min 8 min
Weight
(g)
Weight
(%)
Cum. Percent
Passing
Weight
(g)
Weight
(%)
Cum.
Percent
Passing
2360 0.00 0.00 100.00 0.00 0.00 100.00
1700 300.32 47.44 52.56 207.88 32.84 67.16
1180 117.40 18.55 34.01 106.02 16.75 50.41
850 39.97 6.31 27.69 43.21 6.83 43.58
600 23.46 3.71 23.99 27.86 4.40 39.18
425 23.01 3.64 20.35 28.58 4.51 34.67
300 15.68 2.48 17.87 22.24 3.51 31.15
212 13.68 2.16 15.71 21.82 3.45 27.71
150 14.13 2.23 13.48 24.07 3.80 23.90
106 15.07 2.38 11.10 24.41 3.86 20.05
-106 70.27 11.10 0.00 126.91 20.05 0.00
Total 633.00
633.00

179
Table D.12. Product size distribution after batch grinding of -2.36+1.7 mm of
HPGR feed (dB =31.75 mm, ɸBALL=0.35)
-2.36+1.7 mm (HPGR feed) - 31.75 mm ball size
Size
(µm)
0.25 min 0.5 min
Weight
(g)
Weight
(%)
Cum. Percent
Passing
Weight
(g)
Weight
(%)
Cum.
Percent
Passing
2360 0.00 0.00 100.00 0.00 0.00 100.00
1700 555.18 87.71 12.29 522.34 82.52 17.48
1180 44.49 7.03 5.26 56.34 8.90 8.58
850 10.83 1.71 3.55 18.04 2.85 5.73
600 5.31 0.84 2.71 8.14 1.29 4.45
425 3.94 0.62 2.09 6.33 1.00 3.45
300 2.28 0.36 1.73 3.74 0.59 2.86
212 1.66 0.26 1.47 2.67 0.42 2.43
150 1.45 0.23 1.24 2.55 0.40 2.03
106 1.45 0.23 1.01 2.51 0.40 1.64
-106 6.39 1.01 0.00 10.36 1.64 0.00
Total 633.00
633.00
Size
(µm)
1 min 2 min
Weight
(g)
Weight
(%)
Cum. Percent
Passing
Weight
(g)
Weight
(%)
Cum.
Percent
Passing
2360 0.00 0.00 100.00 0.00 0.00 100.00
1700 462.18 73.01 26.99 365.26 57.70 42.30
1180 82.77 13.08 13.91 111.22 17.57 24.73
850 27.24 4.30 9.61 41.69 6.59 18.14
600 13.91 2.20 7.41 23.40 3.70 14.44
425 10.65 1.68 5.73 19.37 3.06 11.38
300 6.25 0.99 4.74 12.11 1.91 9.47
212 4.67 0.74 4.00 9.29 1.47 8.00
150 4.10 0.65 3.35 8.30 1.31 6.69
106 4.06 0.64 2.71 8.21 1.30 5.39
-106 17.17 2.71 0.00 34.14 5.39 0.00
Total 633.00
633.00

180
Table D.12 (continued)
Size
(µm)
4 min 8 min
Weight
(g)
Weight
(%)
Cum. Percent
Passing
Weight
(g)
Weight
(%)
Cum.
Percent
Passing
2360 0.00 0.00 100.00 0.00 0.00 100.00
1700 255.74 40.40 59.60 133.11 21.03 78.97
1180 125.04 19.75 39.85 112.75 17.81 61.16
850 58.27 9.20 30.64 68.12 10.76 50.40
600 34.86 5.51 25.13 48.88 7.72 42.68
425 30.85 4.87 20.26 46.12 7.29 35.39
300 20.49 3.24 17.02 33.90 5.35 30.04
212 16.32 2.58 14.44 27.66 4.37 25.67
150 15.02 2.37 12.07 26.26 4.15 21.52
106 15.43 2.44 9.63 25.64 4.05 17.47
-106 60.98 9.63 0.00 110.56 17.47 0.00
Total 633.00
633.00

181
Table D.13. Product size distribution after batch grinding of -1.7+1.18 mm of
HPGR product (dB =19.05 mm, ɸBALL=0.35)
-1.7+1.18 mm (HPGR product) - 19.05 mm ball size
Size
(µm)
0.25 min 0.5 min
Weight
(g)
Weight
(%)
Cum. Percent
Passing
Weight
(g)
Weight
(%)
Cum.
Percent
Passing
1700.0
0 0.00 0.00 100.00 0.00 0.00 100.00
1180.0
0 535.97 84.67 15.33 491.12 77.59 22.41
850.00 55.88 8.83 6.50 79.19 12.51 9.90
600.00 14.03 2.22 4.29 22.18 3.50 6.40
425.00 8.46 1.34 2.95 12.37 1.95 4.44
300.00 3.75 0.59 2.36 5.80 0.92 3.53
212.00 2.59 0.41 1.95 3.97 0.63 2.90
150.00 1.97 0.31 1.64 3.11 0.49 2.41
106.00 1.82 0.29 1.35 2.80 0.44 1.97
-
106.00 8.54 1.35 0.00 12.45 1.97 0.00
Total 633.00
633.00
Size
(µm)
1 min 2 min
Weight
(g)
Weight
(%)
Cum. Percent
Passing
Weight
(g)
Weight
(%)
Cum.
Percent
Passing
1700.0
0 0.00 0.00 100.00 0.00 0.00 100.00
1180.0
0 440.53 69.59 30.41 369.73 58.41 41.59
850.00 95.05 15.02 15.39 109.88 17.36 24.23
600.00 30.93 4.89 10.50 41.70 6.59 17.64
425.00 18.31 2.89 7.61 26.89 4.25 13.40
300.00 9.05 1.43 6.18 14.41 2.28 11.12
212.00 6.76 1.07 5.11 11.03 1.74 9.38
150.00 5.45 0.86 4.25 9.46 1.49 7.88
106.00 4.88 0.77 3.48 9.06 1.43 6.45
-
106.00 22.04 3.48 0.00 40.85 6.45 0.00
Total 633.00
633.00

182
Table D.13 (continued)
Size
(µm)
4 min 8 min
Weight
(g)
Weight
(%)
Cum. Percent
Passing
Weight
(g)
Weight
(%)
Cum.
Percent
Passing
1700 0.00 0.00 100.00 0.00 0.00 100.00
1180 278.94 44.07 55.93 188.53 29.78 70.22
850 120.82 19.09 36.85 104.10 16.45 53.77
600 53.61 8.47 28.38 55.55 8.78 44.99
425 35.78 5.65 22.72 41.86 6.61 38.38
300 21.15 3.34 19.38 26.79 4.23 34.15
212 16.83 2.66 16.72 24.16 3.82 30.33
150 15.27 2.41 14.31 23.57 3.72 26.61
106 15.63 2.47 11.84 25.97 4.10 22.51
-106 74.96 11.84 0.00 142.46 22.51 0.00
Total 633.00
633.00
Table D.14. Product size distribution after batch grinding of -1.7+1.18 mm of
HPGR product (dB =25.4 mm, ɸBALL=0.35)
-1.7+1.18 mm (HPGR product) - 25.4 mm ball size
Size
(µm)
0.25 min 0.5 min
Weight
(g)
Weight
(%)
Cum. Percent
Passing
Weight
(g)
Weight
(%)
Cum.
Percent
Passing
1700 0.00 0.00 100.00 0.00 0.00 100.00
1180 532.60 84.14 15.86 492.15 77.75 22.25
850 59.26 9.36 6.50 72.51 11.45 10.80
600 14.34 2.27 4.23 23.53 3.72 7.08
425 7.70 1.22 3.02 13.52 2.14 4.94
300 3.51 0.55 2.46 6.13 0.97 3.98
212 2.45 0.39 2.08 4.37 0.69 3.28
150 1.92 0.30 1.77 3.31 0.52 2.76
106 1.81 0.29 1.48 3.15 0.50 2.27
-106 9.40 1.48 0.00 14.34 2.27 0.00
Total 633.00
633.00

183
Table D.14 (continued)
Size
(µm)
1 min 2 min
Weight
(g)
Weight
(%)
Cum. Percent
Passing
Weight
(g)
Weight
(%)
Cum.
Percent
Passing
1700 0.00 0.00 100.00 0.00 0.00 100.00
1180 423.97 66.98 33.02 346.06 54.67 45.33
850 90.99 14.37 18.65 109.71 17.33 28.00
600 34.67 5.48 13.17 49.37 7.80 20.20
425 22.17 3.50 9.67 32.95 5.21 14.99
300 11.47 1.81 7.86 17.30 2.73 12.26
212 8.35 1.32 6.54 12.66 2.00 10.26
150 7.10 1.12 5.42 10.81 1.71 8.55
106 6.72 1.06 4.35 10.12 1.60 6.95
-106 27.56 4.35 0.00 44.00 6.95 0.00
Total 633.00
633.00
Size
(µm)
4 min 8 min
Weight
(g)
Weight
(%)
Cum. Percent
Passing
Weight
(g)
Weight
(%)
Cum.
Percent
Passing
1700 0.00 0.00 100.00 0.00 0.00 100.00
1180 244.77 38.67 61.33 129.16 20.40 79.60
850 128.13 20.24 41.09 106.79 16.87 62.73
600 63.14 9.97 31.12 72.21 11.41 51.32
425 45.33 7.16 23.96 61.12 9.65 41.66
300 26.69 4.22 19.74 40.28 6.36 35.30
212 19.78 3.12 16.61 33.04 5.22 30.08
150 17.34 2.74 13.87 30.67 4.84 25.24
106 18.28 2.89 10.99 31.19 4.93 20.31
-106 69.55 10.99 0.00 128.55 20.31 0.00
Total 633.00
633.00

184
Table D.15. Product size distribution after batch grinding of -1.7+1.18 mm of
HPGR product (dB =31.75 mm, ɸBALL=0.35)
-1.7+1.18 mm (HPGR product) - 31.75 mm
Size
(µm)
0.25 min 0.5 min
Weight
(g)
Weight
(%)
Cum. Percent
Passing
Weight
(g)
Weight
(%)
Cum.
Percent
Passing
1700 0.00 0.00 100.00 0.00 0.00 100.00
1180 548.35 86.63 13.37 492.71 77.84 22.16
850 45.85 7.24 6.13 72.47 11.45 10.71
600 13.05 2.06 4.07 24.41 3.86 6.86
425 7.41 1.17 2.90 13.45 2.12 4.73
300 3.55 0.56 2.34 6.28 0.99 3.74
212 2.09 0.33 2.01 4.22 0.67 3.07
150 2.05 0.32 1.68 3.26 0.51 2.56
106 1.81 0.29 1.40 2.95 0.47 2.09
-106 8.83 1.40 0.00 13.25 2.09 0.00
Total 633.00
633.00
Size
(µm)
1 min 2 min
Weight
(g)
Weight
(%)
Cum. Percent
Passing
Weight
(g)
Weight
(%)
Cum.
Percent
Passing
1700 0.00 0.00 100.00 0.00 0.00 100.00
1180 437.17 69.06 30.94 328.91 51.96 48.04
850 90.05 14.23 16.71 120.22 18.99 29.05
600 35.44 5.60 11.11 56.88 8.99 20.06
425 21.02 3.32 7.79 35.28 5.57 14.49
300 10.20 1.61 6.18 18.18 2.87 11.62
212 6.98 1.10 5.08 13.14 2.08 9.54
150 5.70 0.90 4.18 10.61 1.68 7.86
106 5.25 0.83 3.35 9.72 1.54 6.33
-106 21.19 3.35 0.00 40.05 6.33 0.00
Total 633.00
633.00

185
Table D.15 (continued)
Size
(µm)
4 min 8 min
Weight
(g)
Weight
(%)
Cum. Percent
Passing
Weight
(g)
Weight
(%)
Cum.
Percent
Passing
1700 0.00 0.00 100.00 0.00 0.00 100.00
1180 198.90 31.42 68.58 81.15 12.82 87.18
850 135.55 21.41 47.16 101.97 16.11 71.07
600 82.60 13.05 34.12 92.13 14.56 56.52
425 57.41 9.07 25.05 82.09 12.97 43.55
300 30.37 4.80 20.25 49.87 7.88 35.67
212 22.85 3.61 16.64 39.75 6.28 29.39
150 18.66 2.95 13.69 32.47 5.13 24.26
106 17.24 2.72 10.97 30.86 4.88 19.39
-106 69.42 10.97 0.00 122.71 19.39 0.00
Total 633.00
633.00
Table D.16. Product size distribution after batch grinding of -1.7+1.18 mm of
HPGR feed (dB =19.05 mm, ɸBALL=0.35)
-1.7+1.18 mm (HPGR feed) - 19.05 mm ball size
Size
(µm)
0.25 min 0.5 min
Weight
(g)
Weight
(%)
Cum. Percent
Passing
Weight
(g)
Weight
(%)
Cum.
Percent
Passing
1700 0.00 0.00 100.00 0.00 0.00 100.00
1180 571.13 90.23 9.77 536.35 84.73 15.27
850 31.08 4.91 4.86 46.80 7.39 7.88
600 9.61 1.52 3.35 15.10 2.39 5.49
425 5.70 0.90 2.45 9.61 1.52 3.97
300 2.69 0.42 2.02 4.51 0.71 3.26
212 1.91 0.30 1.72 3.10 0.49 2.77
150 1.59 0.25 1.47 2.82 0.45 2.32
106 1.75 0.28 1.19 3.02 0.48 1.85
-106 7.54 1.19 0.00 11.69 1.85 0.00
Total 633.00
633.00

186
Table D.16 (continued)
Size
(µm)
1 min 2 min
Weight
(g)
Weight
(%)
Cum. Percent
Passing
Weight
(g)
Weight
(%)
Cum.
Percent
Passing
1700 0.00 0.00 100.00 0.00 0.00 100.00
1180 481.33 76.04 23.96 404.89 63.96 36.04
850 66.61 10.52 13.44 87.83 13.88 22.16
600 24.11 3.81 9.63 35.34 5.58 16.58
425 16.37 2.59 7.04 25.66 4.05 12.52
300 8.39 1.32 5.72 13.73 2.17 10.36
212 5.74 0.91 4.81 9.81 1.55 8.81
150 4.81 0.76 4.05 8.39 1.32 7.48
106 5.14 0.81 3.24 9.10 1.44 6.04
-106 20.50 3.24 0.00 38.26 6.04 0.00
Total 633.00
633.00
Size
(µm)
4 min 8 min
Weight
(g)
Weight
(%)
Cum. Percent
Passing
Weight
(g)
Weight
(%)
Cum.
Percent
Passing
1700 0.00 0.00 100.00 0.00 0.00 100.00
1180 316.62 50.02 49.98 218.73 34.55 65.45
850 97.23 15.36 34.62 93.55 14.78 50.67
600 44.61 7.05 27.57 49.24 7.78 42.89
425 35.48 5.60 21.97 41.41 6.54 36.35
300 21.23 3.35 18.62 27.64 4.37 31.98
212 15.90 2.51 16.10 23.55 3.72 28.26
150 14.58 2.30 13.80 22.12 3.49 24.76
106 15.86 2.51 11.29 25.78 4.07 20.69
-106 71.49 11.29 0.00 130.98 20.69 0.00
Total 633.00
633.00

187
Table D.17. Product size distribution after batch grinding of -1.7+1.18 mm of
HPGR feed (dB =25.4 mm, ɸBALL=0.35)
-1.7+1.18 mm (HPGR feed) - 25.4 mm ball size
Size
(µm)
0.25 min 0.5 min
Weight
(g)
Weight
(%)
Cum. Percent
Passing
Weight
(g)
Weight
(%)
Cum.
Percent
Passing
1700 0.00 0.00 100.00 0.00 0.00 100.00
1180 570.28 90.09 9.91 532.92 84.19 15.81
850 30.70 4.85 5.06 51.37 8.12 7.69
600 9.76 1.54 3.52 16.45 2.60 5.10
425 6.05 0.96 2.56 9.84 1.55 3.54
300 3.15 0.50 2.06 4.62 0.73 2.81
212 2.07 0.33 1.74 3.03 0.48 2.33
150 1.79 0.28 1.45 2.55 0.40 1.93
106 1.71 0.27 1.18 2.31 0.36 1.57
-106 7.49 1.18 0.00 9.92 1.57 0.00
Total 633.00
633.00
Size
(µm)
1 min 2 min
Weight
(g)
Weight
(%)
Cum. Percent
Passing
Weight
(g)
Weight
(%)
Cum.
Percent
Passing
1700 0.00 0.00 100.00 0.00 0.00 100.00
1180 474.92 75.03 24.97 389.96 61.60 38.40
850 75.82 11.98 13.00 97.22 15.36 23.04
600 25.97 4.10 8.89 42.75 6.75 16.28
425 16.32 2.58 6.31 28.26 4.46 11.82
300 8.37 1.32 4.99 15.14 2.39 9.43
212 5.63 0.89 4.10 10.25 1.62 7.81
150 4.55 0.72 3.38 8.48 1.34 6.47
106 4.44 0.70 2.68 8.44 1.33 5.13
-106 16.98 2.68 0.00 32.50 5.13 0.00
Total 633.00
633.00

188
Table D.17 (continued)
Size
(µm)
4 min 8 min
Weight
(g)
Weight
(%)
Cum. Percent
Passing
Weight
(g)
Weight
(%)
Cum.
Percent
Passing
1700 0.00 0.00 100.00 0.00 0.00 100.00
1180 285.41 45.09 54.91 163.70 25.86 74.14
850 117.54 18.57 36.34 113.54 17.94 56.20
600 61.48 9.71 26.63 70.41 11.12 45.08
425 42.54 6.72 19.91 60.41 9.54 35.54
300 24.96 3.94 15.97 39.11 6.18 29.36
212 17.37 2.74 13.22 30.28 4.78 24.57
150 14.80 2.34 10.89 26.45 4.18 20.39
106 14.80 2.34 8.55 27.43 4.33 16.06
-106 54.10 8.55 0.00 101.67 16.06 0.00
Total 633.00
633.00
Table D.18. Product size distribution after batch grinding of -1.7+1.18 mm of
HPGR feed (dB =31.75 mm, ɸBALL=0.35)
-1.7+1.18 mm (HPGR feed) - 31.75 mm ball size
Size
(µm)
0.25 min 0.5 min
Weight
(g)
Weight
(%)
Cum. Percent
Passing
Weight
(g)
Weight
(%)
Cum.
Percent
Passing
1700 0.00 0.00 100.00 0.00 0.00 100.00
1180 576.76 91.12 8.88 534.85 84.49 15.51
850 27.83 4.40 4.49 46.91 7.41 8.09
600 9.07 1.43 3.05 17.22 2.72 5.37
425 5.48 0.87 2.19 9.74 1.54 3.84
300 2.53 0.40 1.79 4.75 0.75 3.08
212 1.88 0.30 1.49 3.39 0.54 2.55
150 1.63 0.26 1.23 2.88 0.46 2.09
106 1.59 0.25 0.98 2.88 0.46 1.64
-106 6.21 0.98 0.00 10.36 1.64 0.00
Total 633.00
633.00

189
Table D.18 (continued)
Size
(µm)
1 min 2 min
Weight
(g)
Weight
(%)
Cum.
Percent
Passing
Weight
(g)
Weight
(%)
Cum.
Percent
Passing
1700 0.00 0.00 100.00 0.00 0.00 100.00
1180 468.31 73.98 26.02 370.84 58.58 41.42
850 74.51 11.77 14.25 100.71 15.91 25.51
600 29.72 4.70 9.55 51.63 8.16 17.35
425 18.28 2.89 6.66 31.32 4.95 12.40
300 8.48 1.34 5.32 15.76 2.49 9.91
212 5.94 0.94 4.38 10.96 1.73 8.18
150 4.82 0.76 3.62 9.12 1.44 6.74
106 4.70 0.74 2.88 8.84 1.40 5.34
-106 18.24 2.88 0.00 33.83 5.34 0.00
Total 633.00
633.00
Size
(µm)
4 min 8 min
Weight
(g)
Weight
(%)
Cum.
Percent
Passing
Weight
(g)
Weight
(%)
Cum.
Percent
Passing
1700 0.00 0.00 0.00 0.00 0.00 0.00
1180 226.86 35.84 35.84 89.74 14.18 14.18
850 127.11 20.08 55.92 99.78 15.76 29.94
600 76.84 12.14 68.06 92.00 14.53 44.47
425 55.03 8.69 76.75 82.60 13.05 57.52
300 28.59 4.52 81.27 50.04 7.90 65.43
212 20.70 3.27 84.54 37.92 5.99 71.42
150 16.65 2.63 87.17 30.48 4.82 76.23
106 17.29 2.73 89.90 30.23 4.78 81.01
-106 63.95 10.10 100.00 120.22 18.99 100.00
Total 633.00
633.00


![Index [ ] · PDF fileAndreaMosaic 3.34 - Copyright © 1997-2013 Andrea Denzler Page 11 of 41 Size Parameters The size parameters specify how big your mosaic will be and how big](https://static.documents.pub/doc/80x56/5a7997d97f8b9a197e8d1764/index-334-copyright-1997-2013-andrea-denzler-page-11-of-41-size-parameters.jpg)


