

Solar-Thermal Feasibility Study Farm #5 Boutique Winery
Mirko Slivar ● Stantec Consulting Ltd.
Suite 300 – 175 2nd Avenue, Kamloops, B.C.

2
Prepared for:
Prepared by:
Stantec Consulting Ltd. Suite 300 – 175 2nd Avenue Kamloops, B.C. V2C 5W1
Contact: Mirko Slivar, P.Eng., CEM Tel: 250-852-5923
Project #112120757
July 17, 2012

3
TABLE OF CONTENTS
LIST OF FIGURES AND TABLES .............................................................................................. 4
1 EXECUTIVE SUMMARY ..................................................................................................... 5
2 SITE INFORMATION ........................................................................................................ 6
2.1 FARM OPERATION .......................................................................................................... 6 2.2 LOCATION .................................................................................................................... 6 2.3 EQUIPMENT .................................................................................................................. 6 2.4 UTILITY INFORMATION ................................................................................................... 6
3 THERMAL LOAD CALCULATIONS ...................................................................................... 8
3.1 HOT WATER .................................................................................................................. 8 3.2 CHILLED WATER ............................................................................................................ 8 3.3 HEATED AIR .................................................................................................................. 8
4 SOLAR-THERMAL SYSTEM SELECTION ........................................................................... 10
4.1 SOLAR HOT WATER ....................................................................................................... 10
5 SOLAR-THERMAL SYSTEM SIZING ................................................................................. 12
5.1 SOLAR HOT WATER ....................................................................................................... 12 5.1.1 MANUAL METHOD ............................................................................................................ 12 5.1.2 RETSCREEN METHOD ........................................................................................................ 14 5.1.3 NOTE ON MANUAL VERSUS RETSCREEN RESULTS .......................................................................... 15
6 FINANCIAL ANALYSIS ................................................................................................... 16
6.1 SCENARIO #1: MINIMUM PRICE OF FUEL REQUIREMENT .................................................... 16 6.2 SCENARIO #2: CAPITAL FUNDING REQUIREMENT ............................................................. 17 6.3 SCENARIO #3: RENEWABLE HEAT INCENTIVE REQUIREMENT ............................................. 17
APPENDIX A – DETAILED CALCULATION OF HOT WATER USAGE ......................................... 19
APPENDIX B – MANUAL CALCULATIONS OF SOLAR POTENTIAL .......................................... 21
APPENDIX C – RETSCREEN RESULTS FOR SOLAR HOT WATER ............................................ 23
APPENDIX D – FINANCIAL ANALYSIS DATA ........................................................................ 24
4
LIST OF FIGURES AND TABLES
Figure 1. Energy Demand Profile of Natural Gas Use for Farm #5 .................................................. 7
Figure 2. Schematic of Closed-Loop Solar Hot Water System for Farm #5 ..................................... 11
Figure 3. Monthly Radiation - Incident and Usable for Farm #5 .................................................... 12
Figure 4. Hot Water Demand Versus Solar Hot Water Output for Farm #5 ..................................... 13
Table 1. RETScreen Solar Hot Water Inputs for Farm #5 ............................................................. 14
Table 2. Comparison Between Manual and RETScreen Results for Farm #5 .................................... 15
Table 3. Scenario #1: Minimum Price of Fuel Requirement for Farm #5 ........................................ 17
Table 4. Scenario #2: Capital Funding Requirement for Farm #5 ................................................. 17
Table 5. Scenario #3: Renewable Heat Incentive Requirement for Farm #5 ................................... 18
Table 6. Summary of Monthly Radiation - Incident and Usable for Farm #5 ................................... 21
Table 7. Detailed Monthly Radiation Data for Farm #5 ................................................................ 22
Table 8. RETScreen Solar Hot Water Model for Farm #5 ............................................................. 23
Table 9. Financial Analysis Data for Farm #5............................................................................. 24

FARM # 5 SOLAR-THERMAL FEASIBILITY STUDY
Stantec Consulting Ltd. 5
1 EXECUTIVE SUMMARY
B.C.'s agricultural sector consumes significant quantities of energy. Renewable energy from the sun present agricultural operators with an opportunity to decrease their utility costs, become more energy independent and reduce the environmental impacts of their operations.
This study looked at the potential of using solar-thermal systems (namely hot water, chilled water and heated air) for heating and cooling at a boutique winery, located in the Okanagan Valley.
The winery produces over 50,000 cases of wine annually and operates a wine shop and a full-service restaurant that seats about 114 guests and is open daily for lunch and dinner.
There is a potential for using solar-thermal hot water, chilled water and heated air at this winery only if the restaurant is taken into consideration.
While the winemaking process uses some hot water for barrel washing, most of the hot water demand at this operation is for the restaurant. The restaurant uses about 9,080 litres of water at 60 C per day, which is heated by an 80 per cent efficient natural gas boiler. Installing a 54-collector solar hot water system at an estimated cost of $225,000 will reduce the restaurant's annual energy use for hot water from about 960 GJ to 557 GJ for an annual saving of about $3,600.
Due to the low cost of natural gas this study concludes that to make the proposed solar hot water system financially viable, one of the following conditions must be met:
1) The price of natural gas would need to increase from $8.87/GJ to $21.50/GJ based on a 10 per cent return on investment; or
2) A one-time capital cost rebate of $100,200 (equivalent to $800 per square metre of solar collector or 45 per cent of total installed cost) is needed based on a 5 per cent return on investment; or
3) A renewable heat incentive of $0.032/kWh of heat energy produced over a 25-year period is needed based on a 10 per cent return on investment.
The chilled water demand at this operation is for the winemaking process. Jacketed fermentation tanks are used to control the temperature of the wine during primary and secondary fermentation. These tanks flow a liquid (in this case glycol) around the outside of the tank to control the temperature of the wine inside of the tank. During fermentation the wine is cooled to maintain a final temperature of 10 to 20 C, or –2 C depending on the style of wine being made. This equates to a chilled glycol temperature demand of –3 to –10 C. Solar chilled water systems are limited to delivering down to a temperature of 7 C; therefore this type of system is not suitable for this operation.
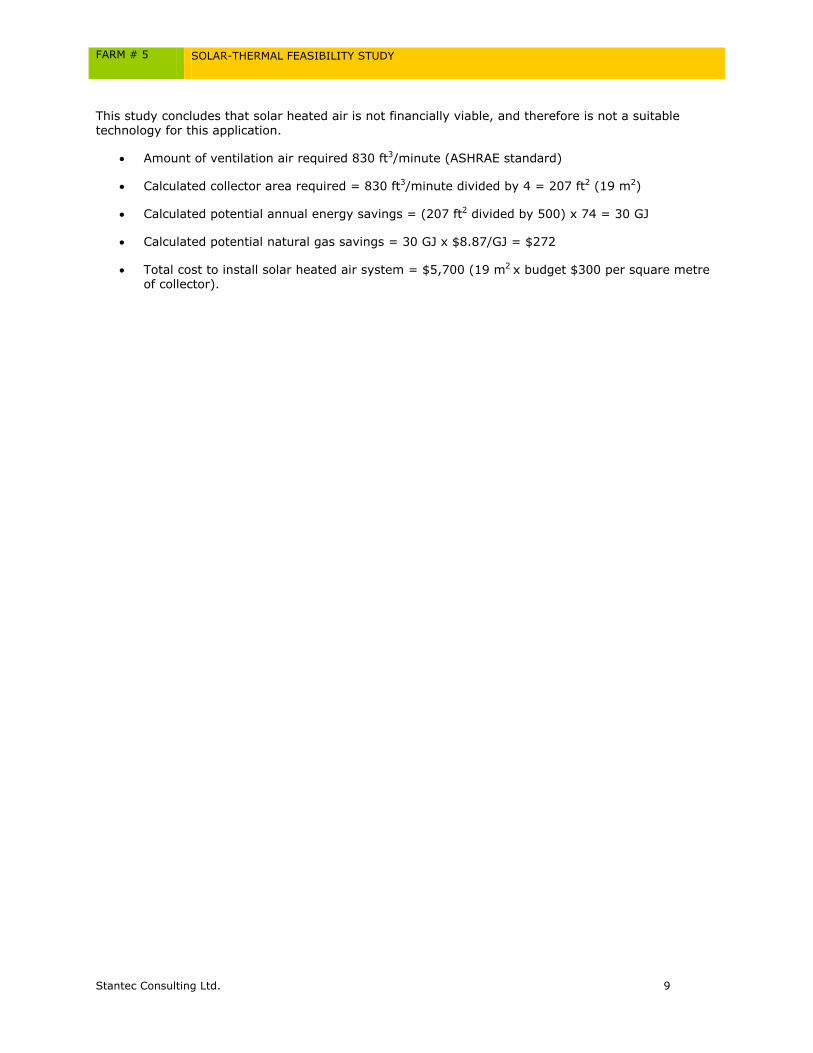
There is no demand for preheating of ventilation air for the winemaking process or its buildings. However, there is demand for ventilation air for the restaurant's kitchen, and this demand is year-round. Based on a high level assessment of the restaurant operation considering the amount of ventilation air required (830 cubic feet per minute), installing a 19 square metre solar heated air system at an estimated cost of $5,700 will save the operation about $272 per year. This works out to a simple payback of 21 years. This study concludes that solar heated air is not financially viable, and therefore is not a suitable technology for this application.
Budget estimates provided in this study are generalized costs. The above findings are based on current figures and current industry practices and as such can change with time, with location and with physical on-site findings. Hence, these findings may prove to be more or less viable upon a detailed engineering design and competitive pricing.
This paper is part of the Benchmarking of Solar-Thermal Technologies in B.C.'s Agricultural and Agri-Food Operations (a.k.a. main feasibility study) and should be referenced as such. Other agricultural and agri-food operators can use this paper to determine the suitability of using solar-thermal systems at their own operations.

FARM # 5 SOLAR-THERMAL FEASIBILITY STUDY
Stantec Consulting Ltd. 6
2 SITE INFORMATION
In the Okanagan, grape harvest usually starts late September and finishes by mid-November.
At the beginning of the winemaking process a bit of heat is required to start the fermentation process and after that cooling is required. September to November the grapes are harvested, crushed and placed in fermentation tanks. To start the fermentation the –2 C crush is heated up to a final temperature of 10 to 15 C. During fermentation the wine is cooled to maintain a final temperature of 10 to 20 C, or –2 C depending on the style of wine being made. After primary fermentation the wine is transferred to secondary fermentation storage for maturation (November to February) and maintained at desired temperatures (15 to 20 C), and then bottled according to various production schedules. The winemaking building is unheated. During fermentation, unheated ventilation air is used to rid the building of carbon dioxide produced during fermentation.
2.1 FARM OPERATION
The winery produces over 50,000 cases of wine annually and operates a wine shop and full-service restaurant that seats about 114 guests and is open daily (11:30 a.m. to 9:00 p.m.) for lunch and dinner. The restaurant is closed for three weeks in January.
2.2 LOCATION
West Kelowna, B.C.
Latitude 48.5 degrees and longitude 119.5 degrees.
The winery, located in the Okanagan Valley, is situated on a south-facing slope above Okanagan Lake and has good southern exposure to capture the sun with no shading issues from buildings, trees or mountains. There are four closely spaced flat roofed buildings on the property that house the winemaking operation, wine storage, wine store, restaurant and offices. There is limited space available on the roofs to mount collectors due to existing air handling equipment. Ground mounted collectors are not an option, as roadways front the buildings on two sides and the vineyard takes up the other sides.
2.3 EQUIPMENT
Two 80 per cent efficient natural gas boilers supply hot water at 60 to 66 C (for winery and restaurant).
Two hot water storage tanks (65-inches long by 27-inches in diameter).
Fifty-one jacketed fermentation tanks with glycol heating and cooling.
Natural gas forced air furnace for space heating of restaurant, wine shop and offices.
Gas cooking equipment.
2.4 UTILITY INFORMATION
In 2011, the winery used about 860,000 kWh of electricity at a total cost of about $62,600. This electrical consumption was used to operate winery equipment, fermentation cooling equipment, restaurant equipment, air conditioning equipment, lights, ventilation and other electrical equipment. In addition, the winery used about 5,020 GJ of natural gas at a total cost of about $16,600. This natural gas consumption was used for hot water, space heating and cooking in restaurant. The operation does not use propane.
FARM # 5 SOLAR-THERMAL FEASIBILITY STUDY
Stantec Consulting Ltd. 7
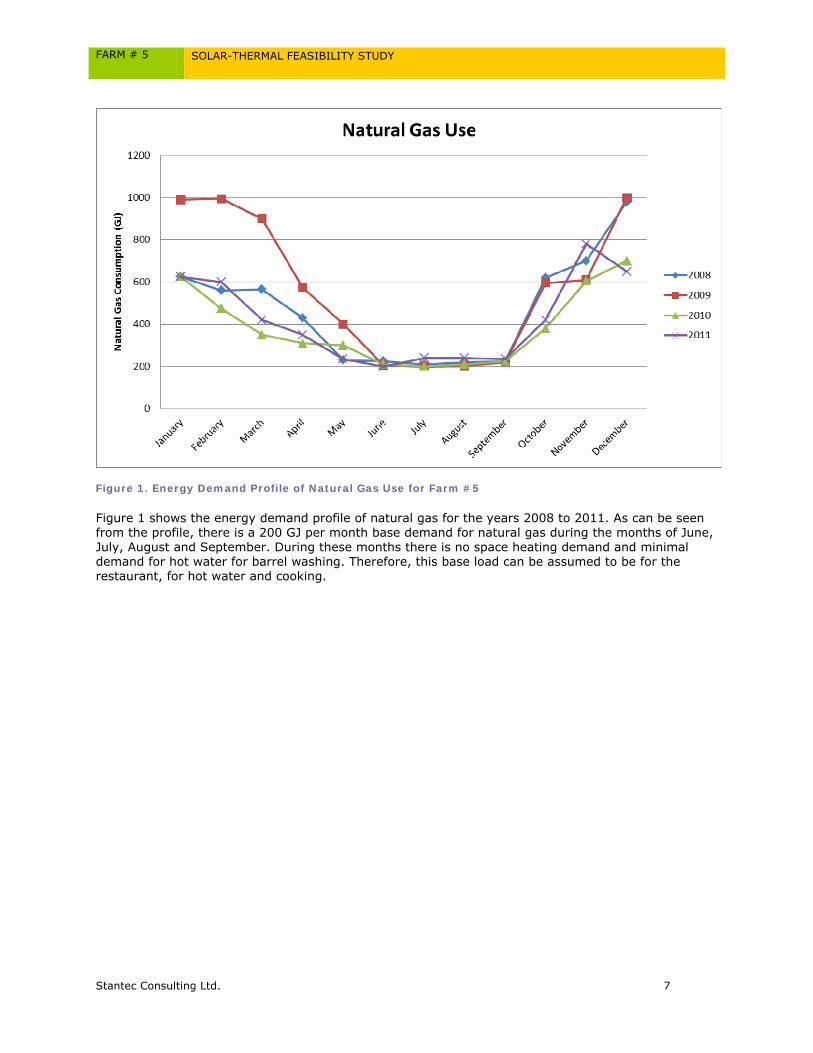
Figure 1. Energy Demand Profile of Natural Gas Use for Farm #5
Figure 1 shows the energy demand profile of natural gas for the years 2008 to 2011. As can be seen from the profile, there is a 200 GJ per month base demand for natural gas during the months of June, July, August and September. During these months there is no space heating demand and minimal demand for hot water for barrel washing. Therefore, this base load can be assumed to be for the restaurant, for hot water and cooking.

FARM # 5 SOLAR-THERMAL FEASIBILITY STUDY
Stantec Consulting Ltd. 8
3 THERMAL LOAD CALCULATIONS
There is a potential for using solar-thermal hot water, chilled water and heated air at this winery only if the restaurant is taken into consideration. While the winemaking process uses some hot water for barrel washing, most of the hot water demand at this operation is for the restaurant. There is a demand for chilled water for the winemaking process. Furthermore, while there is no demand for preheated ventilation air for any of the winemaking buildings, there is a demand for preheated ventilation air for the restaurant's kitchen.
3.1 HOT WATER
In order to design a solar hot water system the winery will need to know its daily hot water usage in litres per day. In this example, the operator does not know his hot water usage, so it was calculated using the natural gas utility bill and the equation:
Q = 500 x gpm x ∆T
Where:
Q is the heat energy (Btu/h).
gpm is the flow rate (US-gallon/minute).
∆T is the temperature rise (F).
We are given:
Monthly natural gas consumption 200 GJ (used in restaurant for hot water and cooking).
Winery operation uses an 80 per cent efficient natural gas boiler to make hot water.
Hot water usage 10 hours per day.
Hot water temperature 60 C.
Incoming supply water temperature 4 C.
Calculated:
Winery restaurant uses about 9,080 litres of water at 60 C per day. For a step-by-step calculation see Appendix A.
3.2 CHILLED WATER
The chilled water demand at this operation is for the winemaking process. Jacketed fermentation tanks are used to control the temperature of the wine during primary and secondary fermentation. These tanks flow a liquid (in this case glycol) around the outside of the tank to control the temperature of the wine inside of the tank. During fermentation the wine is cooled to maintain a final temperature of 10 to 20 C, or –2 C depending on the style of wine being made. This equates to a chilled glycol temperature demand of –3 to –10 C. Solar chilled water systems are limited to delivering down to a temperature of 7 C; therefore this type of system is not suitable for this operation.
3.3 HEATED AIR
There is no demand for preheating of ventilation air for the winemaking process or its buildings. However, there is demand for ventilation air for the restaurant's kitchen, and this demand is year-round. Based on a high level assessment of the restaurant operation considering the amount of ventilation air required (830 cubic feet per minute), installing a 19 square metre solar heated air system at an estimated cost of $5,700 will save the operation about $272 per year. This works out to a simple payback of 21 years.
FARM # 5 SOLAR-THERMAL FEASIBILITY STUDY
Stantec Consulting Ltd. 9
This study concludes that solar heated air is not financially viable, and therefore is not a suitable technology for this application.
Amount of ventilation air required 830 ft3/minute (ASHRAE standard)
Calculated collector area required = 830 ft3/minute divided by 4 = 207 ft2 (19 m2)
Calculated potential annual energy savings = (207 ft2 divided by 500) x 74 = 30 GJ
Calculated potential natural gas savings = 30 GJ x $8.87/GJ = $272
Total cost to install solar heated air system = $5,700 (19 m2 x budget $300 per square metre of collector).
FARM # 5 SOLAR-THERMAL FEASIBILITY STUDY
Stantec Consulting Ltd. 10
4 SOLAR-THERMAL SYSTEM SELECTION
Of the potential solar-thermal systems explored in this study (namely hot water, chilled water and heated air), solar hot water is most suitable for this operation.
4.1 SOLAR HOT WATER
The winery in this study has an ideal application for solar hot water in its restaurant operations because it is open year-round; has a steady hot water demand during daylight hours; and has good southern exposure for collectors with no shading issues from buildings, trees or mountains. Winery operating parameters:
Latitude 48.5 degrees and longitude 119.5 degrees.
Hot water usage of 9,080 litres per day.
Incoming supply water temperature 4 C.
Hot water temperature 60 C.
Year-round use (system requires freeze protection).
Steady demand throughout day between 11:30 a.m. and 9:00 p.m.
Given the above requirements a closed-loop solar hot water system was chosen for this case study. Figure 1 illustrates the operation of a closed-loop system.
When the sun is out the collector heats up and the controller turns on the pump to transfer heat from the collector to the storage tank via the heat transfer fluid. In B.C., all solar hot water systems that operate during the winter require some sort of antifreeze protection. This can be achieved by installing a closed-loop system with a water-propylene glycol solution as the heat transfer fluid.
The expansion tank minimizes pressure changes in the system due to volume change of the heat transfer fluid as the system heats up.
Solar collector performance varies amongst manufacturers and the type of collector. For solar hot water systems collectors are divided into flat plate and evacuated tube. Both types of collectors are suitable for this application. However, there are two advantages to choosing a flat plate collector over an evacuated tube collector:
1) Flat plate collectors cost less than evacuated tube collectors (about $900 per collector and $3,500 per collector respectively); and
2) In cold weather a flat plate collector has the ability to melt snow and continue to operate, whereas an evacuated tube collector will not melt snow and will not operate when covered.
Refer to the main feasibility study for a detailed discussion on how solar hot water systems work.

FARM # 5 SOLAR-THERMAL FEASIBILITY STUDY
Stantec Consulting Ltd. 11
Figure 2. Schematic of Closed-Loop Solar Hot Water System for Farm #5
FARM # 5 SOLAR-THERMAL FEASIBILITY STUDY
Stantec Consulting Ltd. 12
5 SOLAR-THERMAL SYSTEM SIZING
5.1 SOLAR HOT WATER
Sizing of solar hot water system for this case study was done using two methods: manual calculations and then again using RETScreen (a free software program used to review renewable energy projects). It is not anticipated that an agricultural operator will perform manual calculations. This method is included for benchmarking and informational purposes. It is expected agricultural operators will either retain a suitable solar consultant or use a software program such as RETScreen.
5.1.1 MANUAL METHOD
The general procedure for carrying out the manual calculations is:
1) Determine monthly hot water demand (refer to Appendix A).
2) Determine monthly solar radiation available (refer to Appendix B).
3) Calculate amount of usable solar radiation based on operating parameters (refer to Appendix B).
4) Determine the number of solar collectors required.
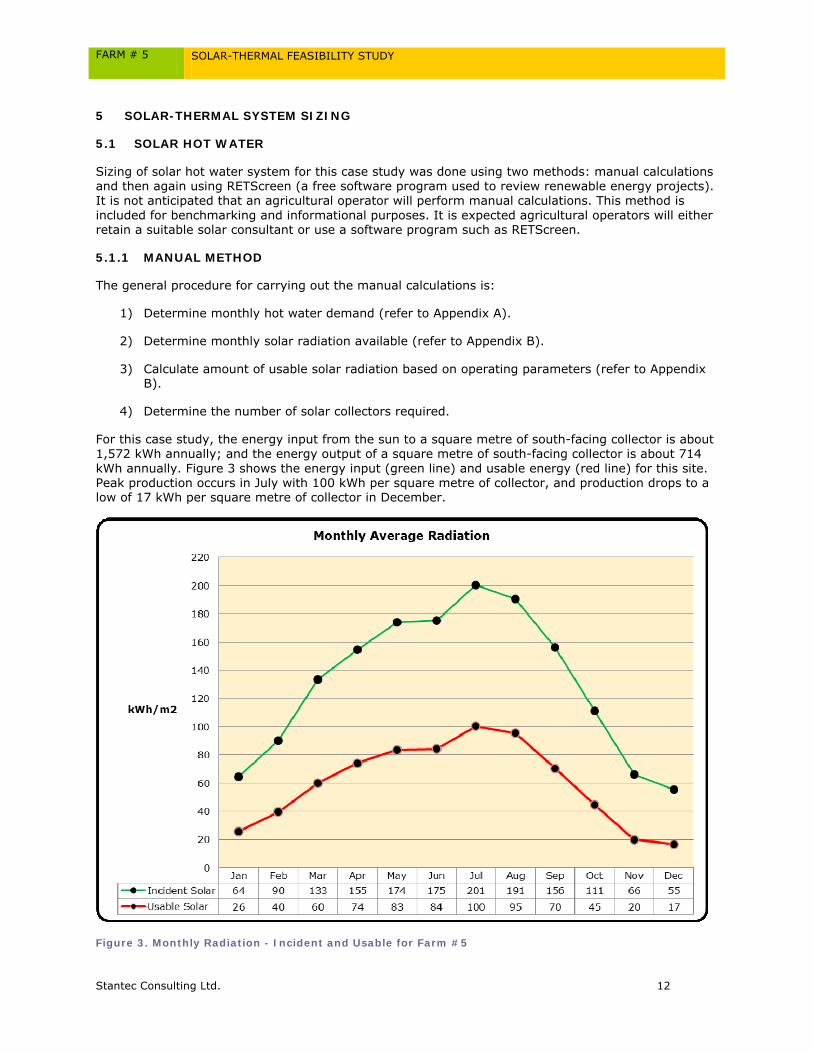
For this case study, the energy input from the sun to a square metre of south-facing collector is about 1,572 kWh annually; and the energy output of a square metre of south-facing collector is about 714 kWh annually. Figure 3 shows the energy input (green line) and usable energy (red line) for this site. Peak production occurs in July with 100 kWh per square metre of collector, and production drops to a low of 17 kWh per square metre of collector in December.
Figure 3. Monthly Radiation - Incident and Usable for Farm #5
FARM # 5 SOLAR-THERMAL FEASIBILITY STUDY
Stantec Consulting Ltd. 13
Generally, solar hot water systems are sized to supply 60 to 70 per cent of the annual hot water demand so that the likelihood of over sizing the system during summer peak solar intensities is minimized. Based on winery's monthly energy demand for hot water of 80 GJ (22,222 kWh) about 84 collectors could be installed as calculated:
Monthly hot water demand = natural gas used x efficiency of hot water boiler = 22,222 kWh x 0.80 = 17,800 kWh/month
Annual hot water demand = 17,800 kWh/month x 12 month/year = 213,600 kWh
Assume a load saving of 65 per cent due to solar = 213,600 kWh x 0.65 = 138,840 kWh
Annual usable solar from collector from Table 6 = 714 kWh/m2
Area of collector required = 138,840 kWh divide by 714 kWh/m2 = 194 m2
Number of collectors = 194 m2 divided by standard collector aperture 2.32 m2 = 84
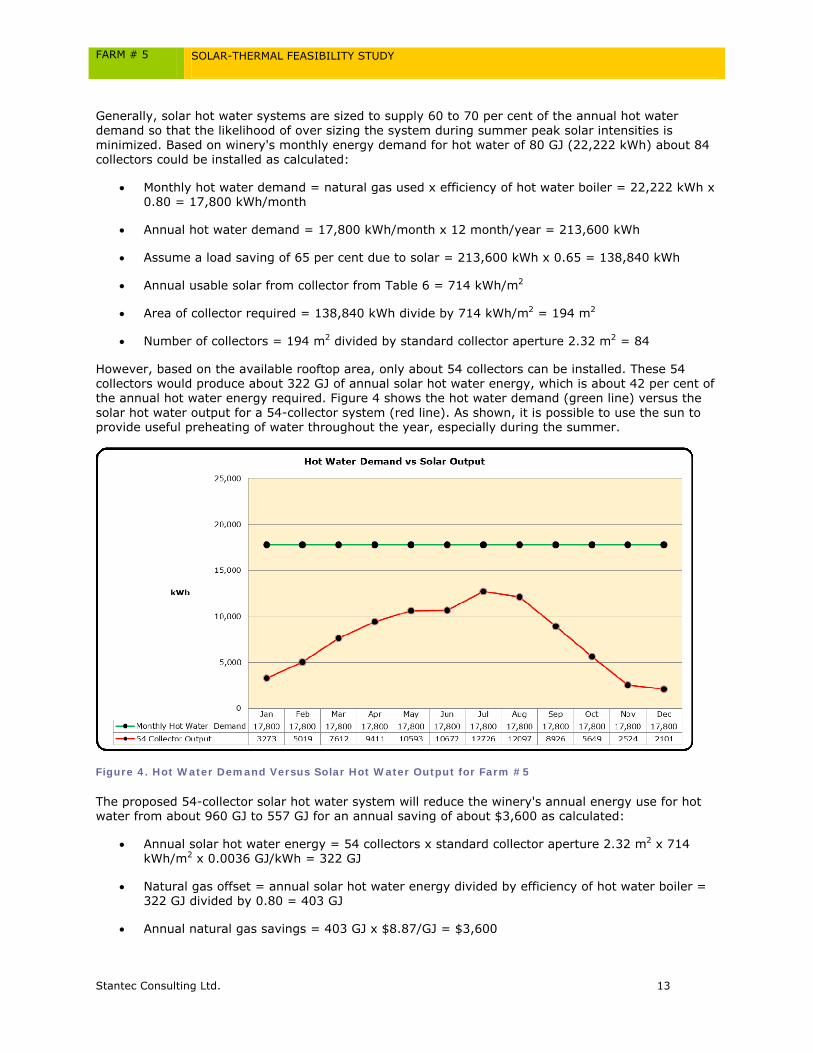
However, based on the available rooftop area, only about 54 collectors can be installed. These 54 collectors would produce about 322 GJ of annual solar hot water energy, which is about 42 per cent of the annual hot water energy required. Figure 4 shows the hot water demand (green line) versus the solar hot water output for a 54-collector system (red line). As shown, it is possible to use the sun to provide useful preheating of water throughout the year, especially during the summer.
Figure 4. Hot Water Demand Versus Solar Hot Water Output for Farm #5
The proposed 54-collector solar hot water system will reduce the winery's annual energy use for hot water from about 960 GJ to 557 GJ for an annual saving of about $3,600 as calculated:
Annual solar hot water energy = 54 collectors x standard collector aperture 2.32 m2 x 714 kWh/m2 x 0.0036 GJ/kWh = 322 GJ
Natural gas offset = annual solar hot water energy divided by efficiency of hot water boiler = 322 GJ divided by 0.80 = 403 GJ
Annual natural gas savings = 403 GJ x $8.87/GJ = $3,600
FARM # 5 SOLAR-THERMAL FEASIBILITY STUDY
Stantec Consulting Ltd. 14
5.1.2 RETSCREEN METHOD
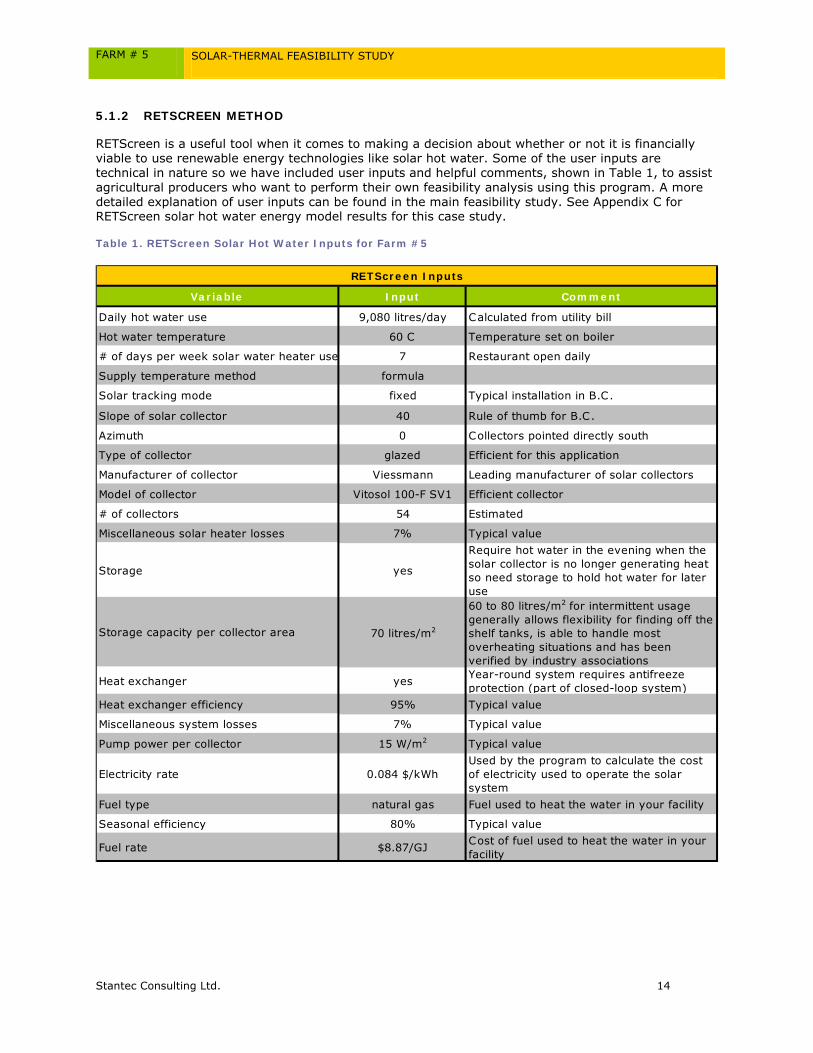
RETScreen is a useful tool when it comes to making a decision about whether or not it is financially viable to use renewable energy technologies like solar hot water. Some of the user inputs are technical in nature so we have included user inputs and helpful comments, shown in Table 1, to assist agricultural producers who want to perform their own feasibility analysis using this program. A more detailed explanation of user inputs can be found in the main feasibility study. See Appendix C for RETScreen solar hot water energy model results for this case study.
Table 1. RETScreen Solar Hot Water Inputs for Farm #5
Variable Input Comment
Daily hot water use 9,080 litres/day Calculated from utility bill
Hot water temperature 60 C Temperature set on boiler
# of days per week solar water heater use 7 Restaurant open daily
Supply temperature method formula
Solar tracking mode fixed Typical installation in B.C.
Slope of solar collector 40 Rule of thumb for B.C.
Azimuth 0 Collectors pointed directly south
Type of collector glazed Efficient for this application
Manufacturer of collector Viessmann Leading manufacturer of solar collectors
Model of collector Vitosol 100-F SV1 Efficient collector
# of collectors 54 Estimated
Miscellaneous solar heater losses 7% Typical value
Storage yes
Require hot water in the evening when the solar collector is no longer generating heat so need storage to hold hot water for later use
Storage capacity per collector area 70 litres/m2
60 to 80 litres/m2 for intermittent usage generally allows flexibility for finding off the shelf tanks, is able to handle most overheating situations and has been verified by industry associations
Heat exchanger yes Year-round system requires antifreeze protection (part of closed-loop system)
Heat exchanger efficiency 95% Typical value
Miscellaneous system losses 7% Typical value
Pump power per collector 15 W/m2 Typical value
Electricity rate 0.084 $/kWhUsed by the program to calculate the cost of electricity used to operate the solar system
Fuel type natural gas Fuel used to heat the water in your facility
Seasonal efficiency 80% Typical value
Fuel rate $8.87/GJ Cost of fuel used to heat the water in your facility
RETScreen Inputs
FARM # 5 SOLAR-THERMAL FEASIBILITY STUDY
Stantec Consulting Ltd. 15
5.1.3 NOTE ON MANUAL VERSUS RETSCREEN RESULTS
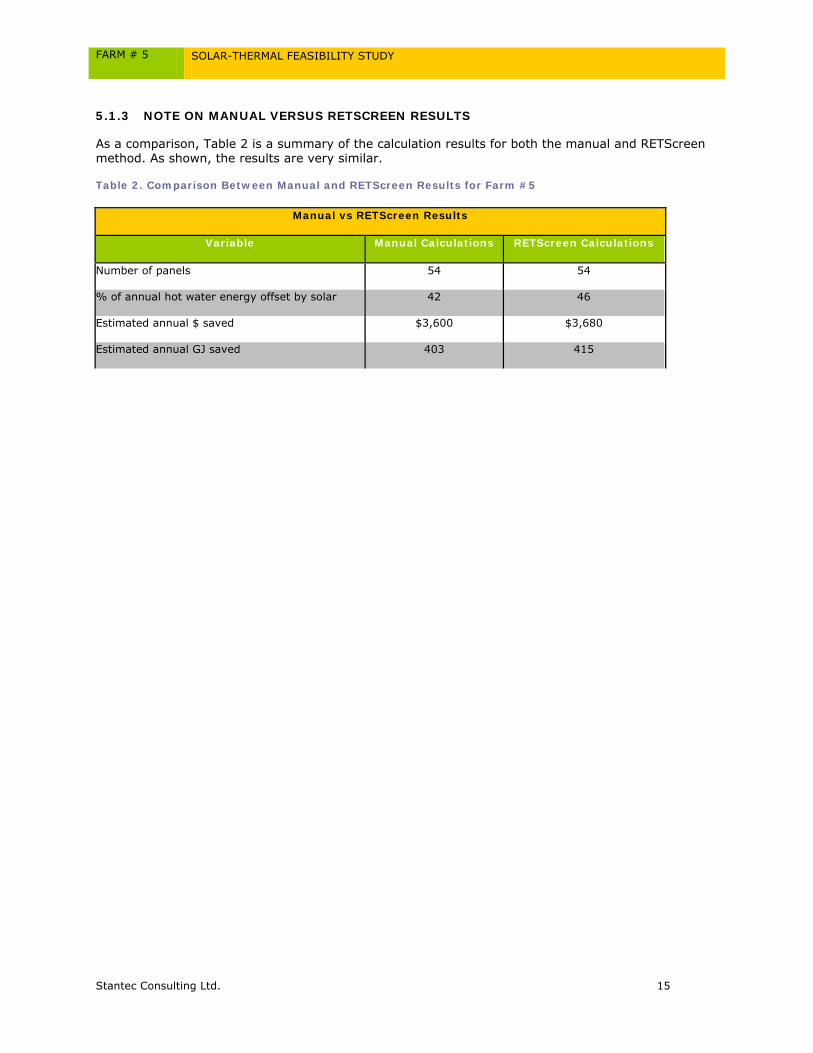
As a comparison, Table 2 is a summary of the calculation results for both the manual and RETScreen method. As shown, the results are very similar.
Table 2. Comparison Between Manual and RETScreen Results for Farm #5
Manual vs RETScreen Results
Variable Manual Calculations RETScreen Calculations
Number of panels 54 54
% of annual hot water energy offset by solar 42 46
Estimated annual $ saved $3,600 $3,680
Estimated annual GJ saved 403 415
FARM # 5 SOLAR-THERMAL FEASIBILITY STUDY
Stantec Consulting Ltd. 16
6 FINANCIAL ANALYSIS
To supply and install a solar hot water system can budget on spending $1,800 per square metre of flat plate collector. This budget cost is an established industry standard from numerous installations and includes materials, labour and permitting for a fully operational system as follows:
Flat plate collectors 35 per cent
Storage tanks 15 per cent
Controls 10 per cent
Miscellaneous (pumps, insulation, mixing valve, mark up and profit) 40 per cent
The above price percentages are for a typical installation and may change depending on each installation’s characteristics.
The financial analysis that follows is based on the installation of a 54-collector solar hot water system at a total cost of $225,000 (54 collectors x standard collector aperture 2.32 square metre x budget $1,800 per square metre of flat plate collector).
To determine the incentive required to make the proposed solar hot water system financially viable three scenarios were investigated:
1) What does the minimum price of fuel have to be?
2) What one-time upfront capital payment does there need to be?
3) What renewable heat incentive does there need to be?
The return on investment for scenarios one and three above was set at 10 per cent and for the capital payment scenario a 5 per cent return on investment was deemed reasonable in relation to operator's reduced capital cost and the associated risks. For this study a Chabot profitability index of 0.3 was used and is defined as the net present value of the sum of the discounted energy bills over n years of operation divided by the initial investment cost (refer to the main feasibility study for a more detailed discussion on financial analysis and the use of the Chabot profitability index.)
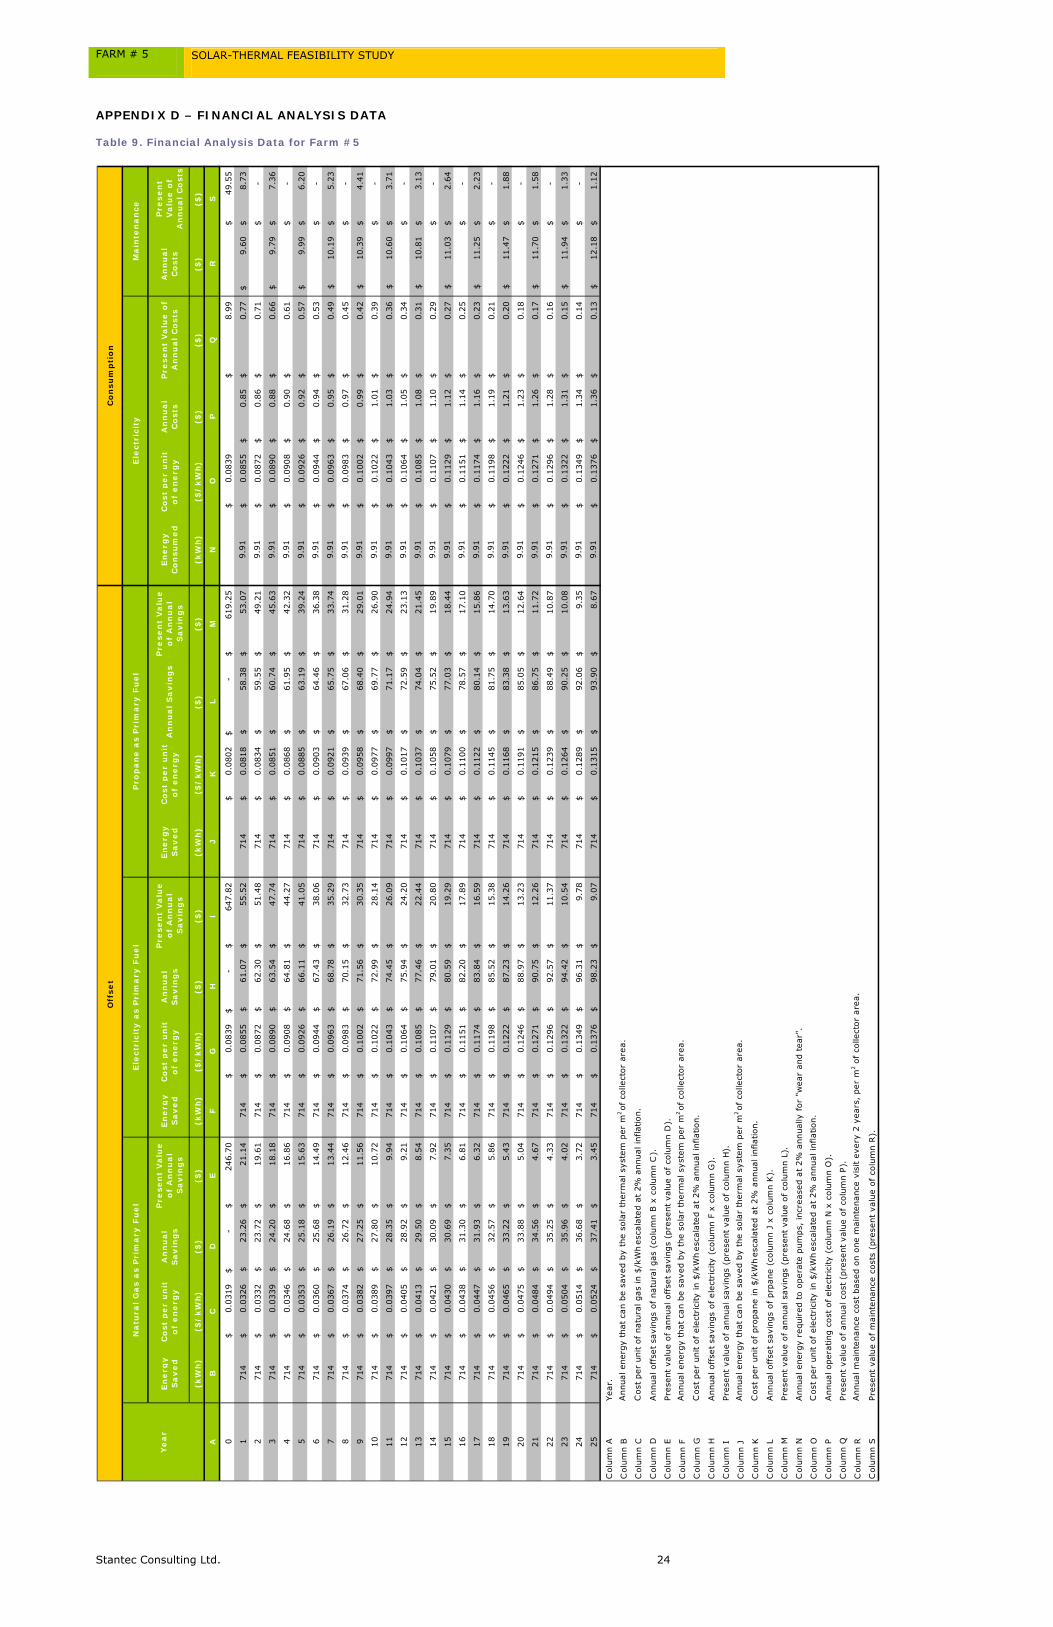
For reference see Appendix D for the calculated net present values over 25 years (analysis period) of the discounted energy bills, cost of maintenance and cost of electricity needed to operate the solar hot water system.
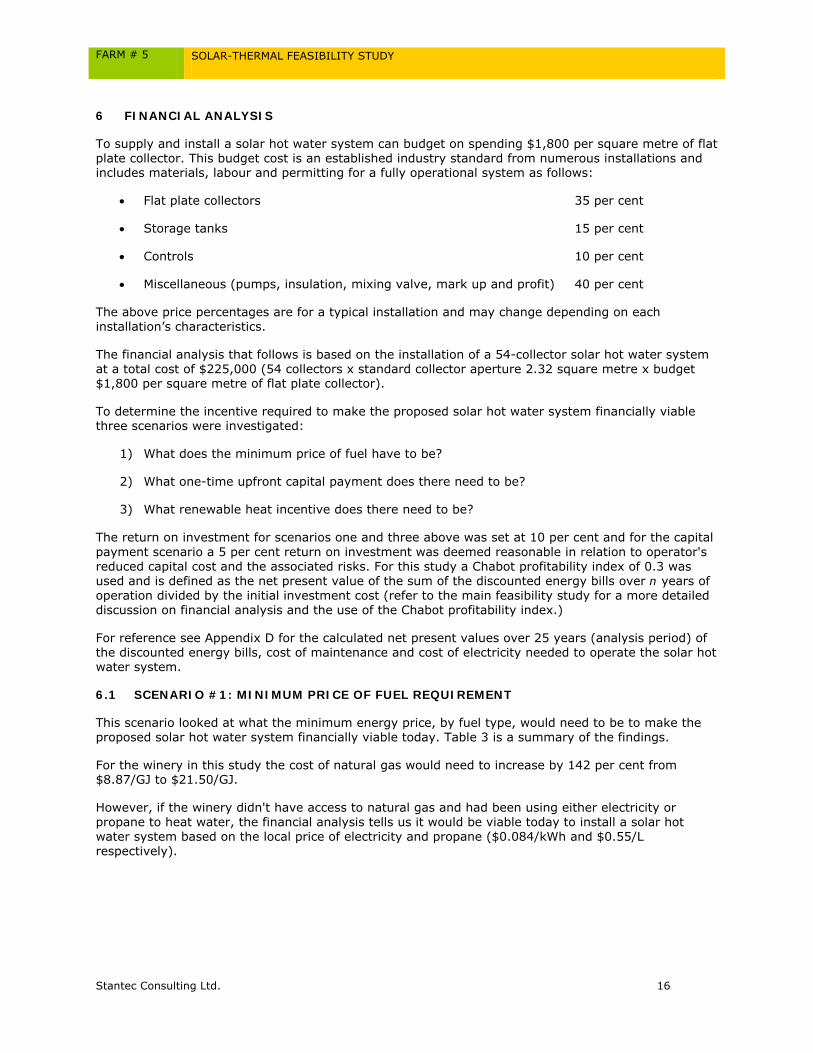
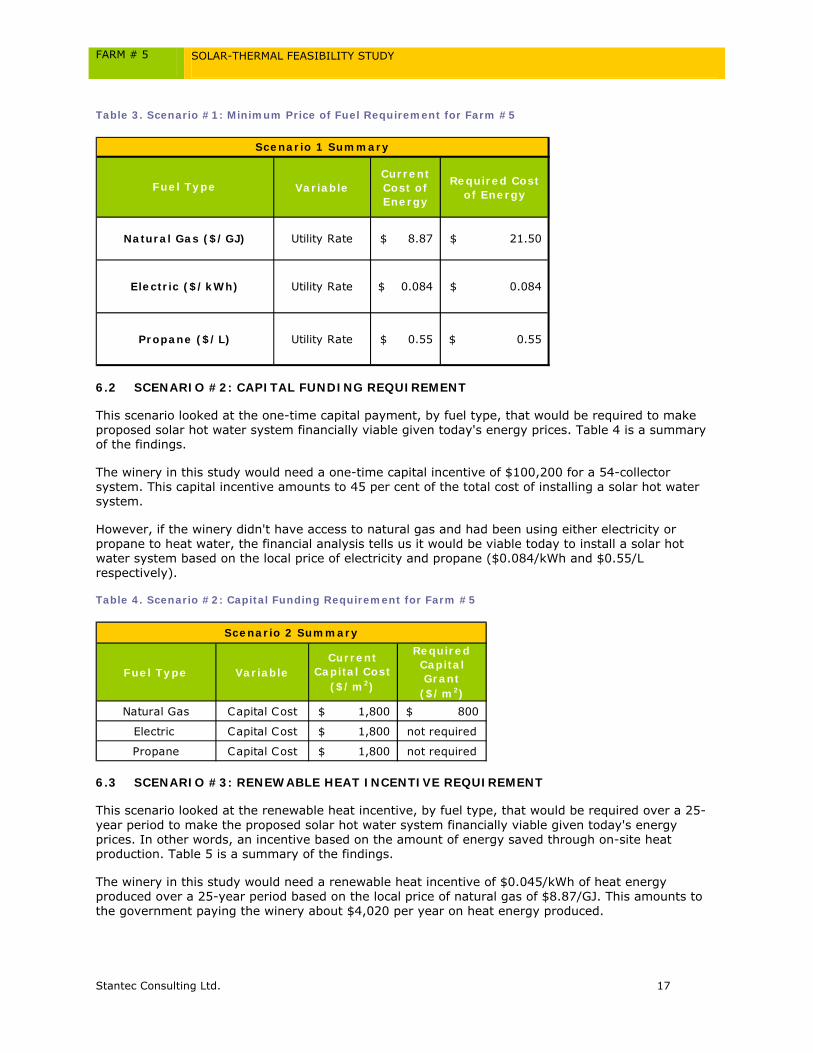
6.1 SCENARIO #1: MINIMUM PRICE OF FUEL REQUIREMENT
This scenario looked at what the minimum energy price, by fuel type, would need to be to make the proposed solar hot water system financially viable today. Table 3 is a summary of the findings.
For the winery in this study the cost of natural gas would need to increase by 142 per cent from $8.87/GJ to $21.50/GJ.
However, if the winery didn't have access to natural gas and had been using either electricity or propane to heat water, the financial analysis tells us it would be viable today to install a solar hot water system based on the local price of electricity and propane ($0.084/kWh and $0.55/L respectively).
FARM # 5 SOLAR-THERMAL FEASIBILITY STUDY
Stantec Consulting Ltd. 17
Table 3. Scenario #1: Minimum Price of Fuel Requirement for Farm #5
VariableCurrent Cost of Energy
Required Cost of Energy
Utility Rate 8.87$ 21.50$
Utility Rate 0.084$ 0.084$
Utility Rate 0.55$ 0.55$
Electric ($/kWh)
Propane ($/L)
Fuel Type
Natural Gas ($/GJ)
Scenario 1 Summary
6.2 SCENARIO #2: CAPITAL FUNDING REQUIREMENT
This scenario looked at the one-time capital payment, by fuel type, that would be required to make proposed solar hot water system financially viable given today's energy prices. Table 4 is a summary of the findings.
The winery in this study would need a one-time capital incentive of $100,200 for a 54-collector system. This capital incentive amounts to 45 per cent of the total cost of installing a solar hot water system.
However, if the winery didn't have access to natural gas and had been using either electricity or propane to heat water, the financial analysis tells us it would be viable today to install a solar hot water system based on the local price of electricity and propane ($0.084/kWh and $0.55/L respectively).
Table 4. Scenario #2: Capital Funding Requirement for Farm #5
Fuel Type VariableCurrent
Capital Cost ($/m2)
Required Capital Grant
($/m2)Natural Gas Capital Cost 1,800$ 800$
Electric Capital Cost 1,800$ not required
Propane Capital Cost 1,800$ not required
Scenario 2 Summary
6.3 SCENARIO #3: RENEWABLE HEAT INCENTIVE REQUIREMENT
This scenario looked at the renewable heat incentive, by fuel type, that would be required over a 25-year period to make the proposed solar hot water system financially viable given today's energy prices. In other words, an incentive based on the amount of energy saved through on-site heat production. Table 5 is a summary of the findings.
The winery in this study would need a renewable heat incentive of $0.045/kWh of heat energy produced over a 25-year period based on the local price of natural gas of $8.87/GJ. This amounts to the government paying the winery about $4,020 per year on heat energy produced.

FARM # 5 SOLAR-THERMAL FEASIBILITY STUDY
Stantec Consulting Ltd. 18
However, if the winery didn't have access to natural gas and had been using either electricity or propane to heat water, the financial analysis tells us it would be viable today to install a solar hot water system based on the local price of electricity and propane ($0.084/kWh and $0.55/L respectively).
Table 5. Scenario #3: Renewable Heat Incentive Requirement for Farm #5
Current Cost of Energy
Current Cost of Energy
($/kWh)
Required Incentive on Fuel Saved
Equivalent Incentive on Fuel Saved
($/kWh)
8.871$ 0.032$ 12.63$ 0.045
0.084$ 0.084$ not required not required
0.550$ 0.080$ not required not required
Renewable heat incentive
Propane ($/L) Renewable heat incentive
Scenario 3 Summary
Fuel Type Variable
Renewable heat incentiveNatural Gas ($/GJ)
Electric ($/kWh)
FARM # 5 SOLAR-THERMAL FEASIBILITY STUDY
Stantec Consulting Ltd. 19
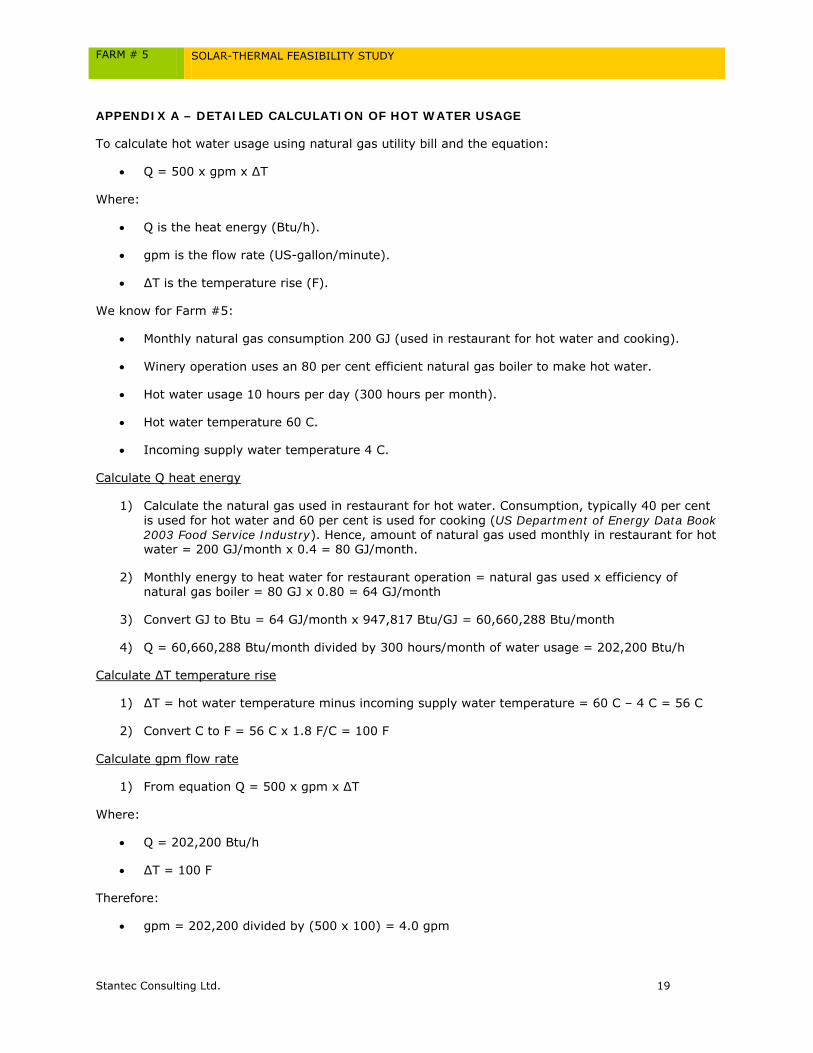
APPENDIX A – DETAILED CALCULATION OF HOT WATER USAGE
To calculate hot water usage using natural gas utility bill and the equation:
Q = 500 x gpm x ∆T
Where:
Q is the heat energy (Btu/h).
gpm is the flow rate (US-gallon/minute).
∆T is the temperature rise (F).
We know for Farm #5:
Monthly natural gas consumption 200 GJ (used in restaurant for hot water and cooking).
Winery operation uses an 80 per cent efficient natural gas boiler to make hot water.
Hot water usage 10 hours per day (300 hours per month).
Hot water temperature 60 C.
Incoming supply water temperature 4 C.
Calculate Q heat energy
1) Calculate the natural gas used in restaurant for hot water. Consumption, typically 40 per cent is used for hot water and 60 per cent is used for cooking (US Department of Energy Data Book 2003 Food Service Industry). Hence, amount of natural gas used monthly in restaurant for hot water = 200 GJ/month x 0.4 = 80 GJ/month.
2) Monthly energy to heat water for restaurant operation = natural gas used x efficiency of natural gas boiler = 80 GJ x 0.80 = 64 GJ/month
3) Convert GJ to Btu = 64 GJ/month x 947,817 Btu/GJ = 60,660,288 Btu/month
4) Q = 60,660,288 Btu/month divided by 300 hours/month of water usage = 202,200 Btu/h
Calculate ∆T temperature rise
1) ∆T = hot water temperature minus incoming supply water temperature = 60 C – 4 C = 56 C
2) Convert C to F = 56 C x 1.8 F/C = 100 F
Calculate gpm flow rate
1) From equation Q = 500 x gpm x ∆T
Where:
Q = 202,200 Btu/h
∆T = 100 F
Therefore:
gpm = 202,200 divided by (500 x 100) = 4.0 gpm

FARM # 5 SOLAR-THERMAL FEASIBILITY STUDY
Stantec Consulting Ltd. 20
Calculate daily hot water usage
1) Daily hot water usage = 4.0 gpm x 600 minutes = 2,400 US-gallons
2) Convert US-gallons to litres = 2,400 US-gallons x 3.78 litres/US-gallon = 9,072 litres
Restaurant uses about 9,080 litres of 60 C water a day.

FARM # 5 SOLAR-THERMAL FEASIBILITY STUDY
Stantec Consulting Ltd. 21
APPENDIX B – MANUAL CALCULATIONS OF SOLAR POTENTIAL
Table 6. Summary of Monthly Radiation - Incident and Usable for Farm #5
kWh/m2-day kWh/m2-month kWh/m2-month %
A B C D E
Jan 2.08 64 26 40
Feb 3.21 90 40 44
Mar 4.30 133 60 45
Apr 5.15 155 74 48
May 5.61 174 83 48
Jun 5.84 175 84 48
Jul 6.47 201 100 50
Aug 6.15 191 95 50
Sep 5.21 156 70 45
Oct 3.59 111 45 40
Nov 2.21 66 20 30
Dec 1.78 55 17 30
1572 714 45
5.7 2.6 45
Farm #5
MonthIncident Solar Usable Solar
KWh/m2-yr:
GJ/m2-yr:
Column A: Month Column B: The daily averaged solar radiation incident on an equator-pointed 34° tilted surface (relative to the horizontal) (NASA data) Column C: The monthly averaged solar radiation incident on an equator-pointed 34° tilted surface (relative to the horizontal) (column B x # of days in month) Column D: The monthly averaged solar radiation captured and usable on an equator-pointed 34° tilted surface (relative to the horizontal) Column E: The percentage of incident solar radiation captured and usable
For this site, the energy input from the sun to a square metre of south-facing collector is about 1,572 kWh annually; and the energy output of a square metre of south-facing collector is about 714 kWh annually. The average annual operating efficiency of the collector (Viessmann flat plate model Vitosol 100-F SV1) is about 45 per cent. Results would be similar for other brands of flat plate collectors.

FARM # 5 SOLAR-THERMAL FEASIBILITY STUDY
Stantec Consulting Ltd. 22
Table 7. Detailed Monthly Radiation Data for Farm #5
The monthly solar potential is site specific and is calculated using NASA solar radiation incident data, NRCan weather data and operating performance for Viessmann flat plate collector (model Vitosol 100-F SV1). Results would be similar for other brands of flat plate collectors.
Co
lle
cto
r O
pti
cal
Eff
icie
ncy
Co
lle
cto
r H
ea
t Lo
ss F
act
or
Av
era
ge
D
ay
tim
e A
ir
Te
mp
.In
cid
en
t S
ola
rC
oll
ect
or
Inle
t W
ate
r T
em
p.
T
Cri
tica
l In
ten
sity
Fa
cto
rS
yst
em
E
ffic
ien
cyD
ail
y S
yst
em
O
utp
ut
Mo
nth
ly S
yst
em
O
utp
ut
Eff
icie
ncy
W/
m2-C
Ck
Wh
/m
2 -d
ay
CC
W/
m2
Eff
icie
ncy
kW
h/
m2 -
da
yk
Wh
/m
2-m
on
th
AB
CD
EF
GH
IJ
KL
Jan
0.69
44.
452
-0.5
2.08
2020
.526
3.0
0.13
0.40
0.83
26
Feb
0.69
44.
452
1.0
3.21
2827
.034
6.4
0.11
0.44
1.41
40
Mar
0.69
44.
452
8.2
4.30
4233
.843
3.7
0.10
0.45
1.94
60
Apr
0.69
44.
452
13.3
5.15
5137
.748
3.7
0.09
0.48
2.47
74
May
0.69
44.
452
18.1
5.61
5637
.948
6.3
0.09
0.48
2.69
83
Jun
0.69
44.
452
21.6
5.84
6240
.451
8.3
0.09
0.48
2.80
84
Jul
0.69
44.
452
25.0
6.47
6439
.050
0.4
0.08
0.50
3.24
100
Aug
0.69
44.
452
25.0
6.15
6439
.050
0.4
0.08
0.50
3.08
95
Sep
0.69
44.
452
19.4
5.21
6242
.654
6.6
0.10
0.45
2.34
70
Oct
0.69
44.
452
11.6
3.59
4836
.446
7.0
0.13
0.40
1.44
45
Nov
0.69
44.
452
4.0
2.21
3733
.042
3.4
0.19
0.30
0.66
20
Dec
0.69
44.
452
-0.8
1.78
2626
.834
3.8
0.19
0.30
0.53
17
Col
umn
B:
Opt
ical
eff
icie
ncy
is t
he f
ract
ion
of s
olar
rad
iatio
n w
hich
pas
ses
thro
ugh
the
outs
ide
colle
ctor
gla
ss a
nd r
each
es t
he a
bsor
ber
and
is a
ctua
lly a
bsor
bed
for
a V
iess
man
n fla
t pl
ate
colle
ctor
Col
umn
C:
Col
lect
or h
eat
loss
fac
tor
is a
pro
pert
y of
the
col
lect
or c
hose
n
Col
umd
D:
Ave
rage
mon
thly
day
time
tem
pera
ture
(N
RC
an d
ata)
Col
umn
E: T
he d
aily
ave
rage
d so
lar
radi
atio
n in
cide
nt o
n an
equ
ator
-poi
nted
34°
tilt
ed s
urfa
ce (
rela
tive
to t
he h
oriz
onta
l) (
NA
SA
dat
a)
Col
umn
F: A
ppro
xim
ate
aver
age
fluid
tem
pera
ture
ent
erin
g th
e co
llect
or (
calc
ulat
ed v
alue
)
Col
umn
G:
Tem
pera
ture
diff
eren
ce b
etw
een
fluid
ent
erin
g co
llect
or a
nd a
vera
ge d
aytim
e te
mpe
ratu
re (
colu
mn
F -
colu
mn
D)
Col
umn
H:
The
criti
cal i
nten
sity
is in
dica
tive
of t
he le
ngth
of
time
in e
ach
day
duri
ng w
hich
the
col
lect
or p
rodu
ces
ener
gy (
calc
ulat
ed v
alue
)
Col
umn
I: T
his
fact
or is
an
exte
nsio
n of
col
umn
H a
nd in
volv
es t
he c
ritic
al in
tens
ity a
nd t
he p
erio
d of
col
lect
or o
pera
tion
(cal
cula
ted
valu
e)
Col
umn
J:
The
perc
enta
ge o
f in
cide
nt s
olar
rad
iatio
n ca
ptur
ed a
nd u
sabl
e (c
alcu
late
d va
lue)
Col
umn
K:
The
daily
ave
rage
d so
lar
radi
atio
n ca
ptur
ed a
nd u
sabl
e on
an
equa
tor-
poin
ted
34°
tilte
d su
rfac
e (r
elat
ive
to t
he h
oriz
onta
l) (
colu
mn
E x
colu
mn
J)
Col
umn
L: T
he m
onth
ly a
vera
ged
sola
r ra
diat
ion
capt
ured
and
usa
ble
on a
n eq
uato
r-po
inte
d 34
° til
ted
surf
ace
(rel
ativ
e to
the
hor
izon
tal)
Col
umn
A:
Mon
th
Fa
rm #
5
Mo
nth

FARM # 5 SOLAR-THERMAL FEASIBILITY STUDY
Stantec Consulting Ltd. 23
APPENDIX C – RETSCREEN RESULTS FOR SOLAR HOT WATER
Table 8. RETScreen Solar Hot Water Model for Farm #5
Technology
Load characteristicsApplication Swimming pool
Hot water
Unit Base case Proposed case
Load type OtherDaily hot water use L/d 9,080 9,080Temperature °C 60 60Operating days per week d 7 7
Percent of month used Month
Supply temperature method FormulaWater temperature - minimum °C 4.3Water temperature - maximum °C 12.1
Unit Base case Proposed case Energy savedIncremental initial costs
Heating MWh 200.9 200.9 0%
Resource assessmentSolar tracking mode FixedSlope ˚ 40.0Azimuth ˚ 0.0
Show dataDaily solar radiation - horizontal
Daily solar radiation - tilted
Solar water heaterTypeManufacturerModelGross area per solar collector m² 2.49Aperture area per solar collector m² 2.34Fr (tau alpha) coefficient 0.78Fr UL coefficient (W/m²)/°C 4.43Temperature coefficient for Fr UL (W/m²)/°C² 0.000Number of collectors 54 54Solar collector area m² 134.68Capacity kW 88.26Miscellaneous losses % 7.0%
Balance of system & miscellaneousStorage YesStorage capacity / solar collector area L/m² 70Storage capacity L 8,826.3Heat exchanger yes/no YesHeat exchanger efficiency % 95.0%Miscellaneous losses % 7.0%Pump power / solar collector area W/m² 15.00Electricity rate $/kWh 0.084
SummaryElectricity - pump MWh 4.3Heating delivered MWh 92.3Solar fraction % 46%
Heating system Project verification Base case Proposed case Energy saved
Fuel type Natural gas - GJ Natural gas - GJSeasonal efficiency 80% 80%Fuel consumption - annual GJ 904.1 489.0 GJFuel rate $/GJ 8.871 8.871 $/GJFuel cost $ 8,020 4,338
GlazedViessmann
Vitosol 100-F SV1
Solar water heater
FARM # 5 SOLAR-THERMAL FEASIBILITY STUDY
Stantec Consulting Ltd. 24
APPENDIX D – FINANCIAL ANALYSIS DATA
Table 9. Financial Analysis Data for Farm #5
En
erg
y
Sa
ve
d
Co
st p
er
un
it
of
en
erg
yA
nn
ua
l S
av
ing
s
Pre
sen
t V
alu
e
of
An
nu
al
Sa
vin
gs
En
er g
y
S
av
ed
C
ost
pe
r u
nit
o
f e
ne
rgy
An
nu
al
Sa
vin
gs
Pre
sen
t V
alu
e
of
An
nu
al
Sa
vin
gs
En
erg
y
Sa
ve
d
Co
st p
er
un
it
of
en
erg
yA
nn
ua
l S
av
ing
sP
rese
nt
Va
lue
o
f A
nn
ua
l S
av
ing
s
En
erg
y
Co
nsu
me
dC
ost
pe
r u
nit
o
f e
ne
rgy
An
nu
al
C
ost
sP
rese
nt
Va
lue
of
An
nu
al
Co
sts
An
nu
al
C
ost
s
Pre
sen
t V
alu
e o
f A
nn
ua
l C
ost
s
(kW
h)
($/
kW
h)
($)
($)
(kW
h)
($/
kW
h)
($)
($)
(kW
h)
($/
kW
h)
($)
($)
(kW
h)
($/
kW
h)
($)
($)
($)
($)
AB
CD
EF
GH
IJ
KL
MN
OP
QR
S
00.
0319
$
-
$
24
6.70
$
0.
0839
$
-
$
64
7.82
$
0.
0802
$
-
$
619.
25$
0.08
39$
8.99
$
49.5
5$
171
40.
0326
$
23
.26
$
21
.14
$
71
40.
0855
$
61
.07
$
55
.52
$
71
40.
0818
$
58
.38
$
53.0
7$
9.91
0.08
55$
0.85
$
0.77
$
9.60
$
8.73
$
271
40.
0332
$
23
.72
$
19
.61
$
71
40.
0872
$
62
.30
$
51
.48
$
71
40.
0834
$
59
.55
$
49.2
1$
9.91
0.08
72$
0.86
$
0.71
$
-$
371
40.
0339
$
24
.20
$
18
.18
$
71
40.
0890
$
63
.54
$
47
.74
$
71
40.
0851
$
60
.74
$
45.6
3$
9.91
0.08
90$
0.88
$
0.66
$
9.79
$
7.36
$
471
40.
0346
$
24
.68
$
16
.86
$
71
40.
0908
$
64
.81
$
44
.27
$
71
40.
0868
$
61
.95
$
42.3
2$
9.91
0.09
08$
0.90
$
0.61
$
-$
571
40.
0353
$
25
.18
$
15
.63
$
71
40.
0926
$
66
.11
$
41
.05
$
71
40.
0885
$
63
.19
$
39.2
4$
9.91
0.09
26$
0.92
$
0.57
$
9.99
$
6.20
$
671
40.
0360
$
25
.68
$
14
.49
$
71
40.
0944
$
67
.43
$
38
.06
$
71
40.
0903
$
64
.46
$
36.3
8$
9.91
0.09
44$
0.94
$
0.53
$
-$
771
40.
0367
$
26
.19
$
13
.44
$
71
40.
0963
$
68
.78
$
35
.29
$
71
40.
0921
$
65
.75
$
33.7
4$
9.91
0.09
63$
0.95
$
0.49
$
10.1
9$
5.23
$
871
40.
0374
$
26
.72
$
12
.46
$
71
40.
0983
$
70
.15
$
32
.73
$
71
40.
0939
$
67
.06
$
31.2
8$
9.91
0.09
83$
0.97
$
0.45
$
-$
971
40.
0382
$
27
.25
$
11
.56
$
71
40.
1002
$
71
.56
$
30
.35
$
71
40.
0958
$
68
.40
$
29.0
1$
9.91
0.10
02$
0.99
$
0.42
$
10.3
9$
4.41
$
1071
40.
0389
$
27
.80
$
10
.72
$
71
40.
1022
$
72
.99
$
28
.14
$
71
40.
0977
$
69
.77
$
26.9
0$
9.91
0.10
22$
1.01
$
0.39
$
-$
1171
40.
0397
$
28
.35
$
9.
94$
71
40.
1043
$
74
.45
$
26
.09
$
71
40.
0997
$
71
.17
$
24.9
4$
9.91
0.10
43$
1.03
$
0.36
$
10.6
0$
3.71
$
1271
40.
0405
$
28
.92
$
9.
21$
71
40.
1064
$
75
.94
$
24
.20
$
71
40.
1017
$
72
.59
$
23.1
3$
9.91
0.10
64$
1.05
$
0.34
$
-$
1371
40.
0413
$
29
.50
$
8.
54$
71
40.
1085
$
77
.46
$
22
.44
$
71
40.
1037
$
74
.04
$
21.4
5$
9.91
0.10
85$
1.08
$
0.31
$
10.8
1$
3.13
$
1471
40.
0421
$
30
.09
$
7.
92$
71
40.
1107
$
79
.01
$
20
.80
$
71
40.
1058
$
75
.52
$
19.8
9$
9.91
0.11
07$
1.10
$
0.29
$
-$
1571
40.
0430
$
30
.69
$
7.
35$
71
40.
1129
$
80
.59
$
19
.29
$
71
40.
1079
$
77
.03
$
18.4
4$
9.91
0.11
29$
1.12
$
0.27
$
11.0
3$
2.64
$
1671
40.
0438
$
31
.30
$
6.
81$
71
40.
1151
$
82
.20
$
17
.89
$
71
40.
1100
$
78
.57
$
17.1
0$
9.91
0.11
51$
1.14
$
0.25
$
-$
1771
40.
0447
$
31
.93
$
6.
32$
71
40.
1174
$
83
.84
$
16
.59
$
71
40.
1122
$
80
.14
$
15.8
6$
9.91
0.11
74$
1.16
$
0.23
$
11.2
5$
2.23
$
1871
40.
0456
$
32
.57
$
5.
86$
71
40.
1198
$
85
.52
$
15
.38
$
71
40.
1145
$
81
.75
$
14.7
0$
9.91
0.11
98$
1.19
$
0.21
$
-$
1971
40.
0465
$
33
.22
$
5.
43$
71
40.
1222
$
87
.23
$
14
.26
$
71
40.
1168
$
83
.38
$
13.6
3$
9.91
0.12
22$
1.21
$
0.20
$
11.4
7$
1.88
$
2071
40.
0475
$
33
.88
$
5.
04$
71
40.
1246
$
88
.97
$
13
.23
$
71
40.
1191
$
85
.05
$
12.6
4$
9.91
0.12
46$
1.23
$
0.18
$
-$
2171
40.
0484
$
34
.56
$
4.
67$
71
40.
1271
$
90
.75
$
12
.26
$
71
40.
1215
$
86
.75
$
11.7
2$
9.91
0.12
71$
1.26
$
0.17
$
11.7
0$
1.58
$
2271
40.
0494
$
35
.25
$
4.
33$
71
40.
1296
$
92
.57
$
11
.37
$
71
40.
1239
$
88
.49
$
10.8
7$
9.91
0.12
96$
1.28
$
0.16
$
-$
2371
40.
0504
$
35
.96
$
4.
02$
71
40.
1322
$
94
.42
$
10
.54
$
71
40.
1264
$
90
.25
$
10.0
8$
9.91
0.13
22$
1.31
$
0.15
$
11.9
4$
1.33
$
2471
40.
0514
$
36
.68
$
3.
72$
71
40.
1349
$
96
.31
$
9.
78$
71
40.
1289
$
92
.06
$
9.35
$
9.91
0.13
49$
1.34
$
0.14
$
-$
2571
40.
0524
$
37
.41
$
3.
45$
71
40.
1376
$
98
.23
$
9.
07$
71
40.
1315
$
93
.90
$
8.67
$
9.91
0.13
76$
1.36
$
0.13
$
12.1
8$
1.12
$
Col
umn
AYe
ar.
Col
umn
BA
nnua
l ene
rgy
that
can
be
save
d by
the
sol
ar t
herm
al s
yste
m p
er m
2 of
col
lect
or a
rea.
Col
umn
CC
ost
per
unit
of n
atur
al g
as in
$/k
Wh
esca
late
d at
2%
ann
ual i
nfla
tion.
Col
umn
DA
nnua
l off
set
savi
ngs
of n
atur
al g
as (
colu
mn
B x
col
umn
C).
Col
umn
EPr
esen
t va
lue
of a
nnua
l off
set
savi
ngs
(pre
sent
val
ue o
f co
lum
n D
).
Col
umn
FA
nnua
l ene
rgy
that
can
be
save
d by
the
sol
ar t
herm
al s
yste
m p
er m
2 of
col
lect
or a
rea.
Col
umn
GC
ost
per
unit
of e
lect
rici
ty in
$/k
Wh
esca
late
d at
2%
ann
ual i
nfla
tion.
Col
umn
HA
nnua
l off
set
savi
ngs
of e
lect
rici
ty (
colu
mn
F x
colu
mn
G).
Col
umn
IPr
esen
t va
lue
of a
nnua
l sav
ings
(pr
esen
t va
lue
of c
olum
n H
).
Col
umn
JA
nnua
l ene
rgy
that
can
be
save
d by
the
sol
ar t
herm
al s
yste
m p
er m
2 of
col
lect
or a
rea.
Col
umn
KC
ost
per
unit
of p
ropa
ne in
$/k
Wh
esca
late
d at
2%
ann
ual i
nfla
tion.
Col
umn
LA
nnua
l off
set
savi
ngs
of p
rpan
e (c
olum
n J
x co
lum
n K
).
Col
umn
MPr
esen
t va
lue
of a
nnua
l sav
ings
(pr
esen
t va
lue
of c
olum
n L)
.
Col
umn
NA
nnua
l ene
rgy
requ
ired
to
oper
ate
pum
ps,
incr
ease
d at
2%
ann
ually
for
"w
ear
and
tear
".
Col
umn
OC
ost
per
unit
of e
lect
rici
ty in
$/k
Wh
esca
late
d at
2%
ann
ual i
nfla
tion.
Col
umn
PA
nnua
l ope
ratin
g co
st o
f el
ectr
icity
(co
lum
n N
x c
olum
n O
).
Col
umn
QPr
esen
t va
lue
of a
nnua
l cos
t (p
rese
nt v
alue
of
colu
mn
P).
Col
umn
RA
nnua
l mai
nten
ance
cos
t ba
sed
on o
ne m
aint
enan
ce v
isit
ever
y 2
year
s, p
er m
2 of
col
lect
or a
rea.
Col
umn
SPr
esen
t va
lue
of m
aint
enan
ce c
osts
(pr
esen
t va
lue
of c
olum
n R
).
Off
set
Co
nsu
mp
tio
n
Ye
ar
Na
tura
l G
as
as
Pri
ma
ry F
ue
lE
lect
rici
ty a
s P
rim
ary
Fu
el
Pro
pa
ne
as
Pri
ma
ry F
ue
lE
lect
rici
tyM
ain
ten
an
ce


