
GEOFIZIKA VOL. 29 2012
Original scientific paper UDC 551.435.85
Source identification and apportionment of pollution sources to groundwater quality
in major cities in Southwest, Nigeria
Adewale Matthew Taiwo
University of Birmingham, School of Geography, Earth and Environmental Sciences, Division of Environmental Health Risk Management, Birmingham, UK
Received 19 November 2011, in final form 17 March 2012
Groundwater in form of hand-dug wells and boreholes serves as the main source of drinking water to the people of south-western Nigeria. Contamination of this resource has been linked to many ambiguous pollution sources. The aim of this paper is to identify and apportion sources of pollution to groundwater in five major cities in south-western Nigeria using Principal Components Analysis (PCA). Studies on physico-chemical parameters of groundwater from Abeokuta, Ifo, Sango, Ibadan and lagos were adopted from published literatures, and evaluated using a SPSS statistical package. PCA revealed factor ranges between four and eight. Sources identified were bedrock weathering/sea water, nutrient, solids, urban/traffic runoff, industry, hardness, faecal pollution, soil leaching, nutrient, salt-water intrusion and leachate.
Keywords: groundwater, factor, PCA, pollution, loading, southwest Nigeria
1. Introduction
Distribution of drinking through pipes by State Water Corporations is below demands in Nigerian cities and in many parts of the world. large numbers of people depended absolutely on groundwater resource from hand-dug wells and boreholes. Recent epileptic supply of electricity had caused a further shortage in daily water production by water authorities. Therefore, the pressure on ground-water exploitation had increased (Gbadebo and Taiwo, 2011). The high cost of construction and maintenance of boreholes (which is believed to be potable) had left their affordability to the rich only (Ojo, 2002) leaving the majority of poor masses at the mercy of shallow hand-dug wells. These wells are often managed in an un-hygienic manner (Orebiyi et al., 2010, Taiwo et al., 2011). Access to potable water is still a major concern in all the developing nation of the world (Taiwo, 2011) as millions of people died of water-borne diseases annually (lefort, 2006). Groundwater contaminations from southwestern Nigeria have been re-

158 A. M. TAIWO: SOURCE IDENTIfICATION AND APPORTIONMENT Of POllUTION SOURCES ...
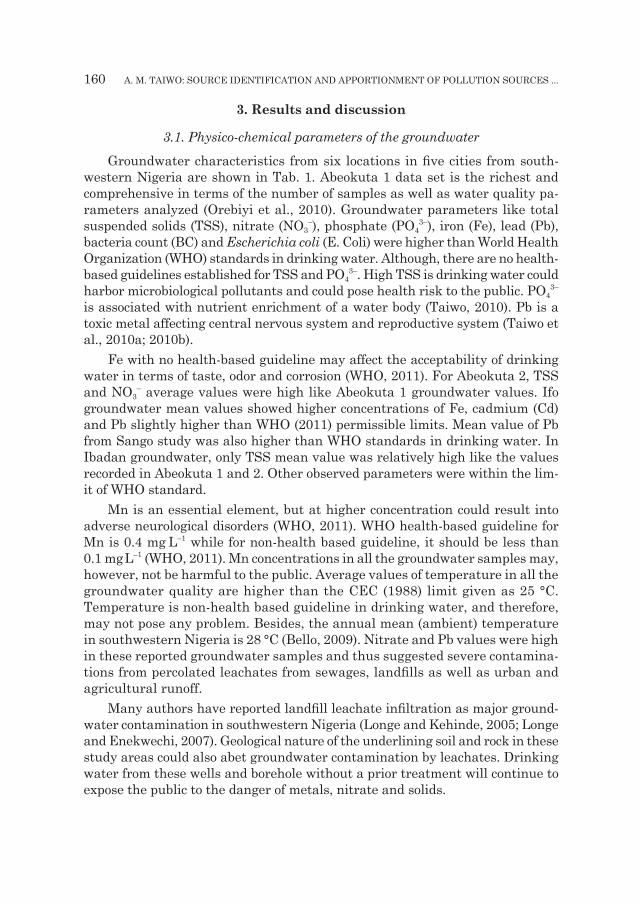
ported by many researchers with details on their physical, chemical and micro-biological characteristics (Yusuf et al., 2007; Orebiyi et al., 2010; Eni et al., 2011; Gbadebo and Taiwo, 2011). High concentrations of metals and nitrates have been observed in these groundwater samples (Gbadebo et al., 2010; Ayedun et al., 2011; Taiwo et al., 2011). Presence of elevated amounts of metals in drinking water is detrimental to human health (florea and Busselberg, 2006) while nitrate toxicity is dangerous to infants below six months with the risk of methemoglobinemia (McCasland et al., 2007). Potential sources to groundwater pollution in these study areas had been identified to include septic tank, pit latrine, cess pits (Eni et al.,
Figure 1. Geological map of Nigeria (Adelana et al., 2008).

GEOfIzIKA, VOl. 29, NO. 2, 2012, 157–174 159
2011), dumpsite (longe and Balogun, 2010), run-off (Taiwo et al., 2011), industrial (Gbadebo and Taiwo, 2011) and agriculture (Taiwo, 2010) among others. How ever, none of these researchers has applied multivariate analysis such as principal component analysis (PCA) for source apportionment of groundwater pollutants.
The knowledge of source identification and apportionment using a multi-variate statistical tool like PCA is not peculiar to air pollution only (Watson et al., 2002; Harrison et al., 2003; Yin et al., 2010). It has also been applied to sur-face and groundwater studies (Simeonov et al., 2003; Singh et al., 2005; zhang et al., 2009; Huang et al., 2010; zhang et al., 2011). The essence of applying source apportionment to water pollution is to develop optimal pollution-control strategies by relevant authorities (Pekey et al., 2004). The main objective of this paper is to apportion pollution sources to groundwater in major cities in south-western Nigeria using PCA.
1.1. Geological setting of the study areas
Geological map of Nigeria is presented in fig. 1. Details of the geological setting of southern Nigeria had been discussed extensively by Jones and Hockey (1964). Briefly, south-western Nigeria fell under two main geological Formations, which include Basement Complex and Dahomey Basins. These two geological set-tings are subdivided into many components (Abeokuta formation, Alluvium, Ewekoro formation, Ilaro formation and Coastal Plain Sands). The south-western Nigeria’s geology is made up of rocks, which include older granite (consisting peg-matite, granite-gneiss, grandiorite, migmatite and quartz diorite), charnockitic intrusive (made up of pyroxene-diorite and metagabbro) and gneiss complex (con-sisting quartzitite, biotite and biotite hornblende-gneiss mica-schist, amphibolite schist and granulitic gneiss) (Oyedele et al., 2011). The hydrological characteristics of the study areas have been discussed elsewhere in Akoteyon et al. (2010). The major aquifer unit that exists in the Coastal Plain Sands is a water table aquifer made of dirty, white to grayish colored unconsolidated sands with an average thickness of 10 m (longe, 2011).
2. Methodology
Secondary data sets published on groundwater quality in five cities in south-western Nigeria have been used for the source apportionment. The published materials include collection of studies from Abeokuta 1 (urban sites) (Orebiyi et al., 2010), Abeokuta 2 (peri-urban locations) (Taiwo et al., 2011), Ifo (Ayedun et al., 2011), Sango (Gbadebo and Taiwo, 2011), Ibadan (Nkolika and Onianwa, 2011) and lagos (Yusuf, 2007). Three capital cities were included in this data, and this made it more important. Data set was evaluated for descriptive statis-tics (mean and standard deviation) and factor analysis (PCA) using SPSS for windows version 19.0.
160 A. M. TAIWO: SOURCE IDENTIfICATION AND APPORTIONMENT Of POllUTION SOURCES ...
3. Results and discussion
3.1. Physico-chemical parameters of the groundwater
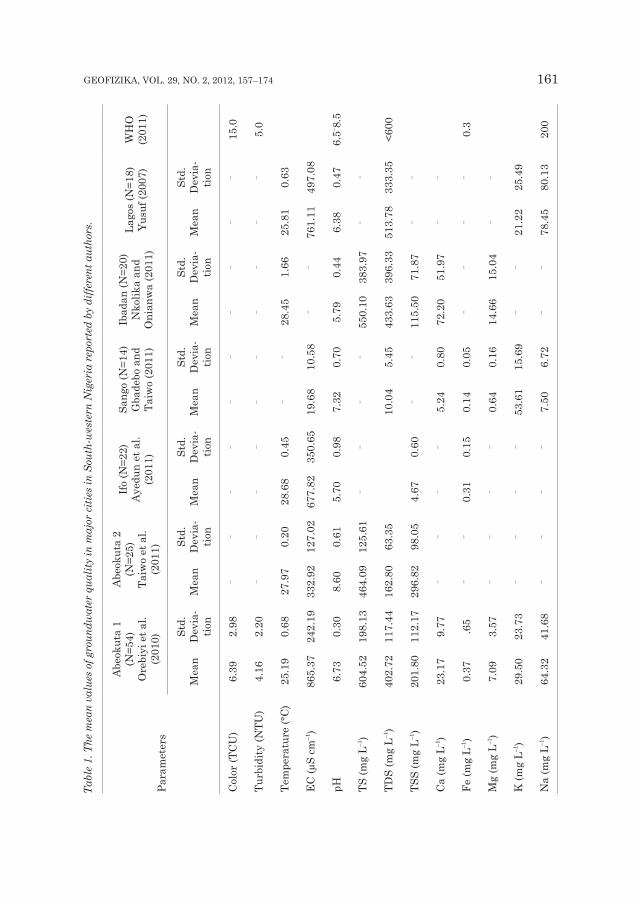
Groundwater characteristics from six locations in five cities from south-western Nigeria are shown in Tab. 1. Abeokuta 1 data set is the richest and comprehensive in terms of the number of samples as well as water quality pa-rameters analyzed (Orebiyi et al., 2010). Groundwater parameters like total suspended solids (TSS), nitrate (NO3
–), phosphate (PO43–), iron (fe), lead (Pb),
bacteria count (BC) and Escherichia coli (E. Coli) were higher than World Health Organization (WHO) standards in drinking water. Although, there are no health-based guidelines established for TSS and PO4
3–. High TSS is drinking water could harbor microbiological pollutants and could pose health risk to the public. PO4
3– is associated with nutrient enrichment of a water body (Taiwo, 2010). Pb is a toxic metal affecting central nervous system and reproductive system (Taiwo et al., 2010a; 2010b).
fe with no health-based guideline may affect the acceptability of drinking water in terms of taste, odor and corrosion (WHO, 2011). for Abeokuta 2, TSS and NO3
– average values were high like Abeokuta 1 groundwater values. Ifo groundwater mean values showed higher concentrations of fe, cadmium (Cd) and Pb slightly higher than WHO (2011) permissible limits. Mean value of Pb from Sango study was also higher than WHO standards in drinking water. In Ibadan groundwater, only TSS mean value was relatively high like the values recorded in Abeokuta 1 and 2. Other observed parameters were within the lim-it of WHO standard.
Mn is an essential element, but at higher concentration could result into adverse neurological disorders (WHO, 2011). WHO health-based guideline for Mn is 0.4 mg l–1 while for non-health based guideline, it should be less than 0.1 mg l–1 (WHO, 2011). Mn concentrations in all the groundwater samples may, however, not be harmful to the public. Average values of temperature in all the groundwater quality are higher than the CEC (1988) limit given as 25 °C. Temperature is non-health based guideline in drinking water, and therefore, may not pose any problem. Besides, the annual mean (ambient) temperature in southwestern Nigeria is 28 °C (Bello, 2009). Nitrate and Pb values were high in these reported groundwater samples and thus suggested severe contamina-tions from percolated leachates from sewages, landfills as well as urban and agricultural runoff.
Many authors have reported landfill leachate infiltration as major ground-water contamination in southwestern Nigeria (longe and Kehinde, 2005; longe and Enekwechi, 2007). Geological nature of the underlining soil and rock in these study areas could also abet groundwater contamination by leachates. Drinking water from these wells and borehole without a prior treatment will continue to expose the public to the danger of metals, nitrate and solids.
GEOfIzIKA, VOl. 29, NO. 2, 2012, 157–174 161Ta
ble 1
. The
mea
n va
lues
of g
roun
dwat
er q
ualit
y in
maj
or ci
ties i
n So
uth-
wes
tern
Nig
eria
repo
rted
by
diffe
rent
aut
hors
.
Para
met
ers
Abeo
kuta
1
(N=5
4)O
rebi
yi e
t al.
(201
0)
Abeo
kuta
2
(N=2
5)Ta
iwo
et a
l. (2
011)
Ifo
(N=2
2)Ay
edun
et a
l. (2
011)
Sang
o (N
=14)
Gba
debo
and
Ta
iwo
(201
1)
Ibad
an (N
=20)
Nko
lika
and
Oni
anw
a (2
011)
Lago
s (N
=18)
Yusu
f (20
07)
WH
O
(201
1)
Mea
nSt
d.
Dev
ia-
tion
Mea
nSt
d.
Dev
ia-
tion
Mea
nSt
d.
Dev
ia-
tion
Mea
nSt
d.
Dev
ia-
tion
Mea
nSt
d.
Dev
ia-
tion
Mea
nSt
d.
Dev
ia-
tion
Colo
r (TC
U)
6.39
2.98
––
––
––
––
––
15.0
Turb
idity
(NTU
)4.
162.
20–
––
––
––
––
–5.
0
Tem
pera
ture
(°C)
25.1
90.
6827
.97
0.20
28.6
80.
45–
–28
.45
1.66
25.8
10.
63
EC (µ
S cm
–1)
865.
3724
2.19
332.
9212
7.02
677.
8235
0.65
19.6
810
.58
––
761.
1149
7.08
pH6.
730.
308.
600.
615.
700.
987.
320.
705.
790.
446.
380.
476.
5– 8.5
TS (m
g l–1
)60
4.52
198.
1346
4.09
125.
61–
––
–55
0.10
383.
97–
–
TDS
(mg
l–1)
402.
7211
7.44
162.
8063
.35
10.0
45.
4543
3.63
396.
3351
3.78
333.
35<6
00
TSS
(mg
l–1)
201.
8011
2.17
296.
8298
.05
4.67
0.60
––
115.
5071
.87
––
Ca (m
g l–1
)23
.17
9.77
––
––
5.24
0.80
72.2
051
.97
––
fe (m
g l–1
)0.
37.6
5–
–0.
310.
150.
140.
05–
––
–0.
3
Mg
(mg
l–1)
7.09
3.57
––
––
0.64
0.16
14.6
615
.04
––
K (m
g l–1
)29
.50
23.7
3–
––
–53
.61
15.6
9–
–21
.22
25.4
9
Na
(mg
l–1)
64.3
241
.68
––
––
7.50
6.72
––
78.4
580
.13
200

162 A. M. TAIWO: SOURCE IDENTIfICATION AND APPORTIONMENT Of POllUTION SOURCES ...
Har
dnes
s (m
g l–1
)30
.26
11.9
010
6.86
46.9
0–
––
–85
.95
54.9
211
0.28
75.9
5
Alka
linity
(mg
l–1)
––
84.2
135
.01
76.8
222
.34
30.6
411
.45
120.
5095
.01
75.3
369
.57
Cl– (m
g l–1
)12
8.51
83.6
855
.47
33.0
2–
–51
.78
13.5
713
4.00
143.
5164
.21
60.6
220
0– 300
NO
3– (mg
l–1)
12.0
27.
5217
.67
10.4
8–
–25
.77
14.4
0–
–0.
420.
4111
.0
SO42
– (m
g l–1
)26
.21
18.1
914
5.32
84.5
2–
–1.
610.
66–
–1.
541.
25<2
50
PO43–
(mg
l–1)
0.21
0.36
0.05
16.6
8–
––
––
–0.
090.
26
NH
4+ (m
g l–1
)–
–0.
110.
18–
––
––
––
–1.
5/35
DO
(mg
l–1)
––
––
––
––
4.68
1.25
––
Pb (m
g l–1
)0.
250.
162
––
0.07
0.07
0.04
0.02
––
0.62
1.27
0.01
Cd (m
g l–1
)–
––
–0.
004
0.00
30.
010.
01–
––
–0.
003
Mn
(mg
l–1)
0.02
0.07
––
––
0.17
0.19
––
0.30
0.98
<0.1
zn (m
g l–1
)0.
120.
25–
–0.
040.
030.
290.
10–
––
–3.
0– 5.0
Cr (m
g l–1
)–
––
––
–0.
010.
01–
––
–0.
05
Cu (m
g l–1
)0.
060.
13–
––
–0.
090.
03–
––
–2.
0
Co (m
g l–1
)–
––
––
–0.
001
0.00
1–
––
–
BC (c
fu 1
00 m
l–1)
88.5
268
.77
––
––
––
––
––
0
E. C
oli (
cfu
ml–1
)10
5.56
27.0
6–
––
––
––
––
–0
Tabl
e 1.
Con
tinue
d.
GEOfIzIKA, VOl. 29, NO. 2, 2012, 157–174 163
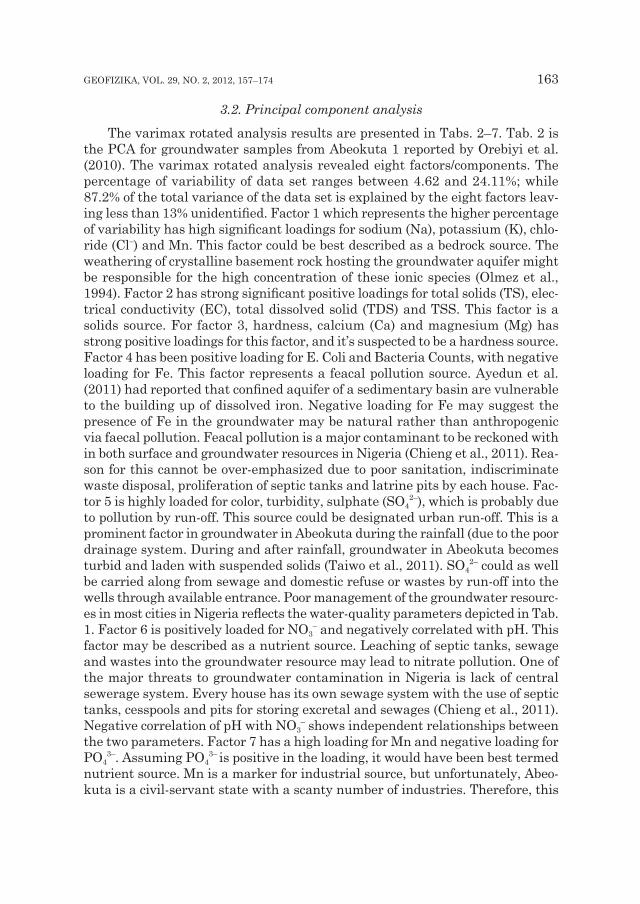
3.2. Principal component analysisThe varimax rotated analysis results are presented in Tabs. 2–7. Tab. 2 is
the PCA for groundwater samples from Abeokuta 1 reported by Orebiyi et al. (2010). The varimax rotated analysis revealed eight factors/components. The percentage of variability of data set ranges between 4.62 and 24.11%; while 87.2% of the total variance of the data set is explained by the eight factors leav-ing less than 13% unidentified. Factor 1 which represents the higher percentage of variability has high significant loadings for sodium (Na), potassium (K), chlo-ride (Cl–) and Mn. This factor could be best described as a bedrock source. The weathering of crystalline basement rock hosting the groundwater aquifer might be responsible for the high concentration of these ionic species (Olmez et al., 1994). Factor 2 has strong significant positive loadings for total solids (TS), elec-trical conductivity (EC), total dissolved solid (TDS) and TSS. This factor is a solids source. for factor 3, hardness, calcium (Ca) and magnesium (Mg) has strong positive loadings for this factor, and it’s suspected to be a hardness source. factor 4 has been positive loading for E. Coli and Bacteria Counts, with negative loading for fe. This factor represents a feacal pollution source. Ayedun et al. (2011) had reported that confined aquifer of a sedimentary basin are vulnerable to the building up of dissolved iron. Negative loading for fe may suggest the presence of fe in the groundwater may be natural rather than anthropogenic via faecal pollution. feacal pollution is a major contaminant to be reckoned with in both surface and groundwater resources in Nigeria (Chieng et al., 2011). Rea-son for this cannot be over-emphasized due to poor sanitation, indiscriminate waste disposal, proliferation of septic tanks and latrine pits by each house. fac-tor 5 is highly loaded for color, turbidity, sulphate (SO4
2–), which is probably due to pollution by run-off. This source could be designated urban run-off. This is a prominent factor in groundwater in Abeokuta during the rainfall (due to the poor drainage system. During and after rainfall, groundwater in Abeokuta becomes turbid and laden with suspended solids (Taiwo et al., 2011). SO4
2– could as well be carried along from sewage and domestic refuse or wastes by run-off into the wells through available entrance. Poor management of the groundwater resourc-es in most cities in Nigeria reflects the water-quality parameters depicted in Tab. 1. factor 6 is positively loaded for NO3
– and negatively correlated with pH. This factor may be described as a nutrient source. leaching of septic tanks, sewage and wastes into the groundwater resource may lead to nitrate pollution. One of the major threats to groundwater contamination in Nigeria is lack of central sewerage system. Every house has its own sewage system with the use of septic tanks, cesspools and pits for storing excretal and sewages (Chieng et al., 2011). Negative correlation of pH with NO3
– shows independent relationships between the two parameters. factor 7 has a high loading for Mn and negative loading for PO4
3–. Assuming PO43– is positive in the loading, it would have been best termed
nutrient source. Mn is a marker for industrial source, but unfortunately, Abeo-kuta is a civil-servant state with a scanty number of industries. Therefore, this

164 A. M. TAIWO: SOURCE IDENTIfICATION AND APPORTIONMENT Of POllUTION SOURCES ...Ta
ble 2
. Abe
okut
a 1
rota
ted
com
pone
nt m
atri
x fr
om d
atas
et o
f Ore
biyi
et a
l. (2
010)
.
Com
pone
nt
fact
or 1
fact
or 2
fact
or 3
fact
or 4
fact
or 5
fact
or 6
fact
or 7
fact
or 8
Com
mun
ali-
ties
Na
0.93
3–0
.174
0.19
00.
031
0.03
3–0
.055
–0.0
370.
034
0.85
4
K0.
887
–0.0
900.
148
–0.1
22–0
.018
–0.1
03–0
.033
–0.0
600.
901
Cl–
0.72
6–0
.209
0.23
4–0
.373
0.14
2–0
.010
–0.2
030.
197
0.88
1
Mn
0.66
5–0
.118
0.05
00.
028
0.23
5–0
.135
0.56
0–0
.093
0.96
8
TS–0
.071
0.97
5–0
.044
0.06
60.
051
0.06
00.
026
0.10
50.
910
EC–0
.203
0.92
7–0
.036
0.01
4–0
.138
–0.0
610.
201
–0.0
480.
979
TDS
–0.1
830.
896
0.01
40.
104
–0.2
28–0
.061
0.23
9–0
.028
0.96
0
TSS
0.08
50.
752
–0.0
980.
000
0.36
60.
184
–0.2
340.
230
0.85
9
zn0.
319
–0.5
29–0
.098
0.42
80.
202
–0.2
350.
082
0.36
20.
918
Har
dnes
s0.
145
–0.0
150.
976
–0.0
650.
003
–0.0
230.
016
0.06
50.
894
Ca0.
141
0.02
10.
943
–0.0
270.
010
0.03
90.
061
0.05
50.
790
Mg
0.12
1–0
.114
0.82
7–0
.154
–0.0
20–0
.191
–0.1
130.
077
0.84
7
fe–0
.043
–0.3
070.
145
–0.8
75–0
.022
0.02
5–0
.007
0.10
20.
944
E. co
li–0
.413
–0.1
71–0
.154
0.68
20.
368
0.29
5–0
.143
0.02
30.
983
BC–0
.413
–0.1
71–0
.154
0.68
20.
368
0.29
5–0
.143
0.02
30.
865
Pb–0
.153
0.00
10.
408
0.53
3–0
.165
0.46
20.
034
0.08
40.
808
Colo
r0.
226
0.02
2–0
.048
0.09
10.
861
0.00
8–0
.117
0.19
10.
738
GEOfIzIKA, VOl. 29, NO. 2, 2012, 157–174 165
Turb
idity
–0.5
26–0
.171
–0.0
950.
031
0.74
9–0
.124
0.09
70.
010
0.76
8
SO42–
0.26
5–0
.009
0.38
00.
251
0.59
70.
288
0.14
3–0
.015
0.72
2
pH0.
093
0.00
10.
264
–0.1
31–0
.065
–0.8
980.
001
–0.0
630.
855
NO
3––0
.550
0.27
00.
208
0.07
70.
060
0.58
30.
187
–0.0
650.
809
PO43–
–0.2
20–0
.220
0.04
60.
094
0.05
4–0
.078
–0.8
200.
038
0.81
8
Cu–0
.067
–0.0
67–0
.100
0.14
0–0
.240
0.07
10.
260
–0.8
000.
931
Tem
p0.
125
0.12
50.
231
0.13
7–0
.080
0.31
70.
405
0.69
50.
931
% o
f Var
ianc
e16
.311
16.3
1113
.668
10.0
777.
814
5.58
95.
396
4.26
3
Cum
ulat
ive
%40
.417
40.4
1754
.085
64.1
6271
.976
77.5
6582
.961
87.2
24
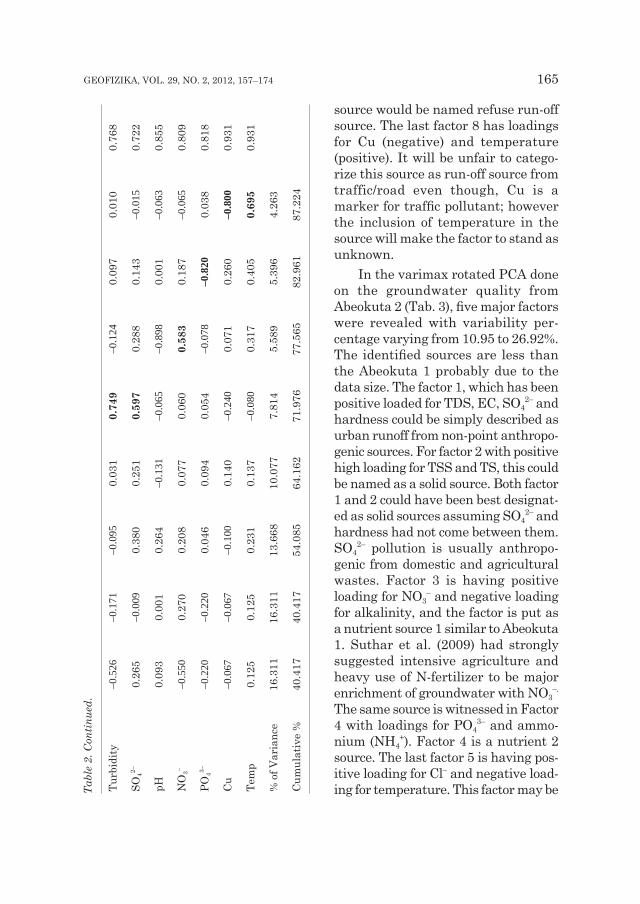
source would be named refuse run-off source. The last factor 8 has loadings for Cu (negative) and temperature (positive). It will be unfair to catego-rize this source as run-off source from traffic/road even though, Cu is a marker for traffic pollutant; however the inclusion of temperature in the source will make the factor to stand as unknown.
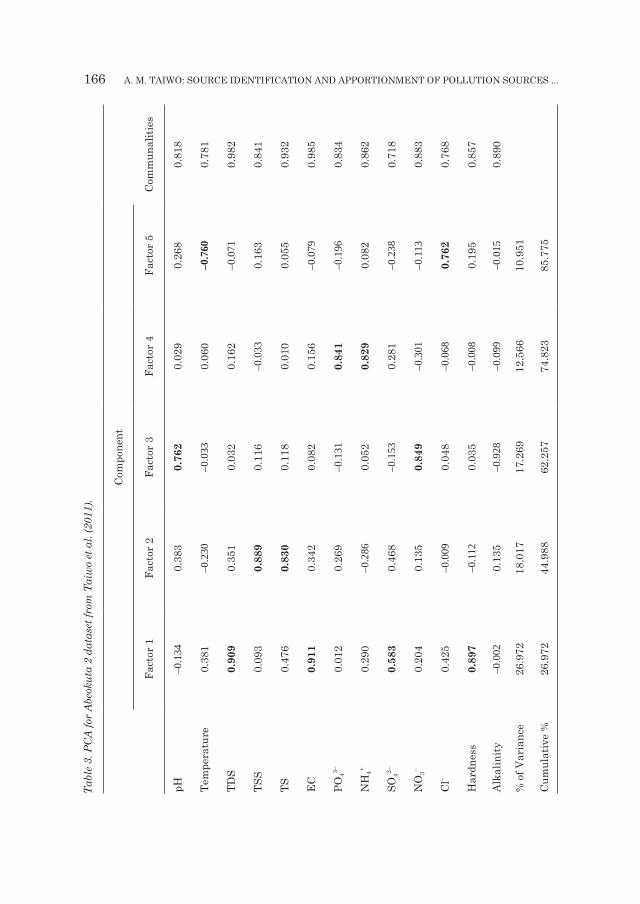
In the varimax rotated PCA done on the groundwater quality from Abeokuta 2 (Tab. 3), five major factors were revealed with variability per-centage varying from 10.95 to 26.92%. The identified sources are less than the Abeokuta 1 probably due to the data size. The factor 1, which has been positive loaded for TDS, EC, SO4
2– and hardness could be simply described as urban runoff from non-point anthropo-genic sources. for factor 2 with positive high loading for TSS and TS, this could be named as a solid source. Both factor 1 and 2 could have been best designat-ed as solid sources assuming SO4
2– and hardness had not come between them. SO4
2– pollution is usually anthropo-genic from domestic and agricultural wastes. factor 3 is having positive loading for NO3
– and negative loading for alkalinity, and the factor is put as a nutrient source 1 similar to Abeokuta 1. Suthar et al. (2009) had strongly suggested intensive agriculture and heavy use of N-fertilizer to be major enrichment of groundwater with NO3
–. The same source is witnessed in factor 4 with loadings for PO4
3– and ammo-nium (NH4
+). factor 4 is a nutrient 2 source. The last factor 5 is having pos-itive loading for Cl– and negative load-ing for temperature. This factor may be Ta
ble
2. C
ontin
ued.
166 A. M. TAIWO: SOURCE IDENTIfICATION AND APPORTIONMENT Of POllUTION SOURCES ...Ta
ble 3
. PC
A fo
r Abe
okut
a 2
data
set f
rom
Tai
wo
et a
l. (2
011)
.
Com
pone
nt
fact
or 1
fact
or 2
fact
or 3
fact
or 4
fact
or 5
Com
mun
aliti
es
pH–0
.134
0.38
30.
762
0.02
90.
268
0.81
8
Tem
pera
ture
0.38
1–0
.230
–0.0
330.
060
–0.7
600.
781
TDS
0.90
90.
351
0.03
20.
162
–0.0
710.
982
TSS
0.09
30.
889
0.11
6–0
.033
0.16
30.
841
TS0.
476
0.83
00.
118
0.01
00.
055
0.93
2
EC0.
911
0.34
20.
082
0.15
6–0
.079
0.98
5
PO43–
0.01
20.
269
–0.1
310.
841
–0.1
960.
834
NH
4+0.
290
–0.2
860.
052
0.82
90.
082
0.86
2
SO42–
0.58
30.
468
–0.1
530.
281
–0.2
380.
718
NO
3–0.
204
0.13
50.
849
–0.3
01–0
.113
0.88
3
Cl–
0.42
5–0
.009
0.04
8–0
.068
0.76
20.
768
Har
dnes
s0.
897
–0.1
120.
035
–0.0
080.
195
0.85
7
Alka
linity
–0.0
020.
135
–0.9
28–0
.099
–0.0
150.
890
% o
f Var
ianc
e26
.972
18.0
1717
.269
12.5
6610
.951
Cum
ulat
ive
%26
.972
44.9
8862
.257
74.8
2385
.775
GEOfIzIKA, VOl. 29, NO. 2, 2012, 157–174 167
a bedrock weathering/anthropogenic pollution source. It will be difficult to ascer-tain the authentic source of chloride in the groundwater since parameters such as Na, K, and Mg that could have consolidated the suggested bedrock source are missing in the study conducted by the author (Taiwo et al., 2011). There is a pos-sibility of groundwater Cl– pollution occurring from contaminations from sewage percolation, runoff containing chloride salts, landfill leachates, septic tank, animal feed and industrial effluents (Taiwo et al., 2011).
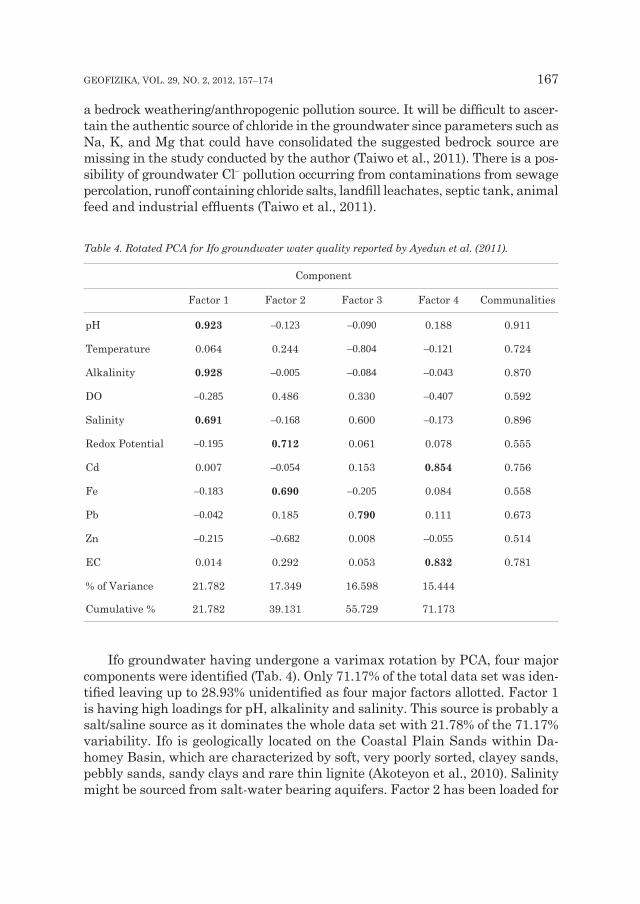
Table 4. Rotated PCA for Ifo groundwater water quality reported by Ayedun et al. (2011).
Component
factor 1 factor 2 factor 3 factor 4 Communalities
pH 0.923 –0.123 –0.090 0.188 0.911
Temperature 0.064 0.244 –0.804 –0.121 0.724
Alkalinity 0.928 –0.005 –0.084 –0.043 0.870
DO –0.285 0.486 0.330 –0.407 0.592
Salinity 0.691 –0.168 0.600 –0.173 0.896
Redox Potential –0.195 0.712 0.061 0.078 0.555
Cd 0.007 –0.054 0.153 0.854 0.756
fe –0.183 0.690 –0.205 0.084 0.558
Pb –0.042 0.185 0.790 0.111 0.673
zn –0.215 –0.682 0.008 –0.055 0.514
EC 0.014 0.292 0.053 0.832 0.781
% of Variance 21.782 17.349 16.598 15.444
Cumulative % 21.782 39.131 55.729 71.173
Ifo groundwater having undergone a varimax rotation by PCA, four major components were identified (Tab. 4). Only 71.17% of the total data set was iden-tified leaving up to 28.93% unidentified as four major factors allotted. Factor 1 is having high loadings for pH, alkalinity and salinity. This source is probably a salt/saline source as it dominates the whole data set with 21.78% of the 71.17% variability. Ifo is geologically located on the Coastal Plain Sands within Da-homey Basin, which are characterized by soft, very poorly sorted, clayey sands, pebbly sands, sandy clays and rare thin lignite (Akoteyon et al., 2010). Salinity might be sourced from salt-water bearing aquifers. factor 2 has been loaded for
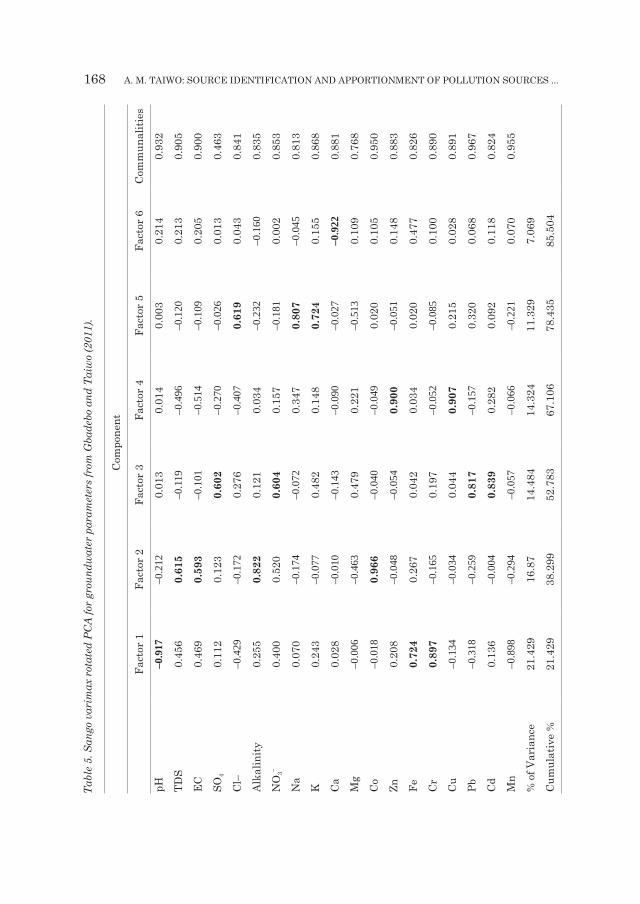
168 A. M. TAIWO: SOURCE IDENTIfICATION AND APPORTIONMENT Of POllUTION SOURCES ...Ta
ble 5
. San
go v
arim
ax ro
tate
d PC
A fo
r gro
undw
ater
par
amet
ers f
rom
Gba
debo
and
Tai
wo
(201
1).
Com
pone
nt
fa
ctor
1fa
ctor
2fa
ctor
3fa
ctor
4fa
ctor
5fa
ctor
6Co
mm
unal
ities
pH–0
.917
–0.2
120.
013
0.01
40.
003
0.21
40.
932
TDS
0.45
60.
615
–0.1
19–0
.496
–0.1
200.
213
0.90
5
EC0.
469
0.59
3–0
.101
–0.5
14–0
.109
0.20
50.
900
SO4
0.11
20.
123
0.60
2–0
.270
–0.0
260.
013
0.46
3
Cl–
–0.4
29–0
.172
0.27
6–0
.407
0.61
90.
043
0.84
1
Alka
linity
0.25
50.
822
0.12
10.
034
–0.2
32–0
.160
0.83
5
NO
3–0.
400
0.52
00.
604
0.15
7–0
.181
0.00
20.
853
Na
0.07
0–0
.174
–0.0
720.
347
0.80
7–0
.045
0.81
3
K0.
243
–0.0
770.
482
0.14
80.
724
0.15
50.
868
Ca0.
028
–0.0
10–0
.143
–0.0
90–0
.027
–0.9
220.
881
Mg
–0.0
06–0
.463
0.47
90.
221
–0.5
130.
109
0.76
8
Co–0
.018
0.96
6–0
.040
–0.0
490.
020
0.10
50.
950
zn0.
208
–0.0
48–0
.054
0.90
0–0
.051
0.14
80.
883
fe0.
724
0.26
70.
042
0.03
40.
020
0.47
70.
826
Cr0.
897
–0.1
650.
197
–0.0
52–0
.085
0.10
00.
890
Cu–0
.134
–0.0
340.
044
0.90
70.
215
0.02
80.
891
Pb–0
.318
–0.2
590.
817
–0.1
570.
320
0.06
80.
967
Cd0.
136
–0.0
040.
839
0.28
20.
092
0.11
80.
824
Mn
–0.8
98–0
.294
–0.0
57–0
.066
–0.2
210.
070
0.95
5
% o
f Var
ianc
e21
.429
16.8
714
.484
14.3
2411
.329
7.06
9
Cum
ulat
ive
%21
.429
38.2
9952
.783
67.1
0678
.435
85.5
04
GEOfIzIKA, VOl. 29, NO. 2, 2012, 157–174 169
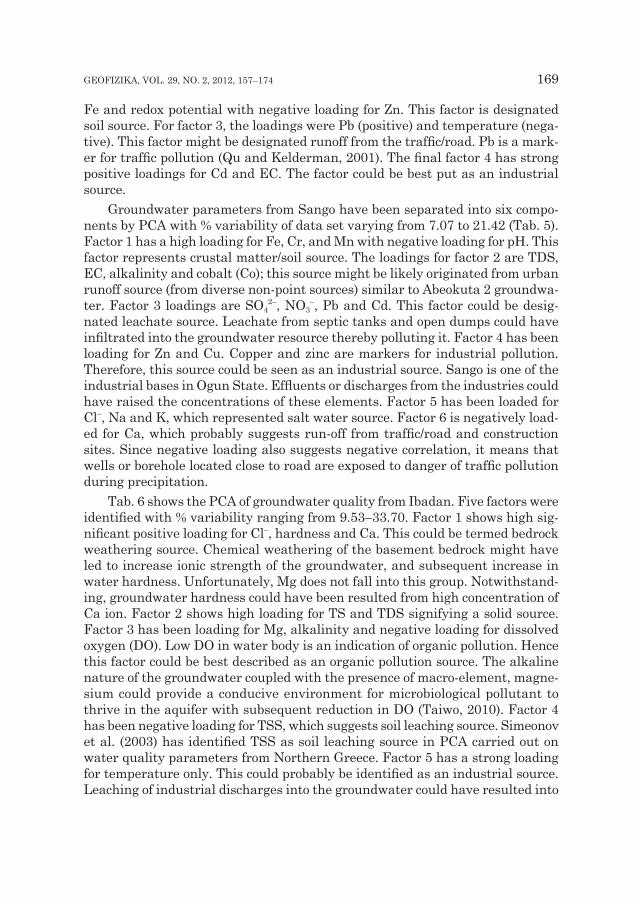
fe and redox potential with negative loading for zn. This factor is designated soil source. for factor 3, the loadings were Pb (positive) and temperature (nega-tive). This factor might be designated runoff from the traffic/road. Pb is a mark-er for traffic pollution (Qu and Kelderman, 2001). The final factor 4 has strong positive loadings for Cd and EC. The factor could be best put as an industrial source.
Groundwater parameters from Sango have been separated into six compo-nents by PCA with % variability of data set varying from 7.07 to 21.42 (Tab. 5). factor 1 has a high loading for fe, Cr, and Mn with negative loading for pH. This factor represents crustal matter/soil source. The loadings for factor 2 are TDS, EC, alkalinity and cobalt (Co); this source might be likely originated from urban runoff source (from diverse non-point sources) similar to Abeokuta 2 groundwa-ter. factor 3 loadings are SO4
2–, NO3–, Pb and Cd. This factor could be desig-
nated leachate source. leachate from septic tanks and open dumps could have infiltrated into the groundwater resource thereby polluting it. Factor 4 has been loading for zn and Cu. Copper and zinc are markers for industrial pollution. Therefore, this source could be seen as an industrial source. Sango is one of the industrial bases in Ogun State. Effluents or discharges from the industries could have raised the concentrations of these elements. factor 5 has been loaded for Cl–, Na and K, which represented salt water source. factor 6 is negatively load-ed for Ca, which probably suggests run-off from traffic/road and construction sites. Since negative loading also suggests negative correlation, it means that wells or borehole located close to road are exposed to danger of traffic pollution during precipitation.
Tab. 6 shows the PCA of groundwater quality from Ibadan. five factors were identified with % variability ranging from 9.53–33.70. Factor 1 shows high sig-nificant positive loading for Cl–, hardness and Ca. This could be termed bedrock weathering source. Chemical weathering of the basement bedrock might have led to increase ionic strength of the groundwater, and subsequent increase in water hardness. Unfortunately, Mg does not fall into this group. Notwithstand-ing, groundwater hardness could have been resulted from high concentration of Ca ion. factor 2 shows high loading for TS and TDS signifying a solid source. factor 3 has been loading for Mg, alkalinity and negative loading for dissolved oxygen (DO). low DO in water body is an indication of organic pollution. Hence this factor could be best described as an organic pollution source. The alkaline nature of the groundwater coupled with the presence of macro-element, magne-sium could provide a conducive environment for microbiological pollutant to thrive in the aquifer with subsequent reduction in DO (Taiwo, 2010). factor 4 has been negative loading for TSS, which suggests soil leaching source. Simeonov et al. (2003) has identified TSS as soil leaching source in PCA carried out on water quality parameters from Northern Greece. factor 5 has a strong loading for temperature only. This could probably be identified as an industrial source. leaching of industrial discharges into the groundwater could have resulted into
170 A. M. TAIWO: SOURCE IDENTIfICATION AND APPORTIONMENT Of POllUTION SOURCES ...
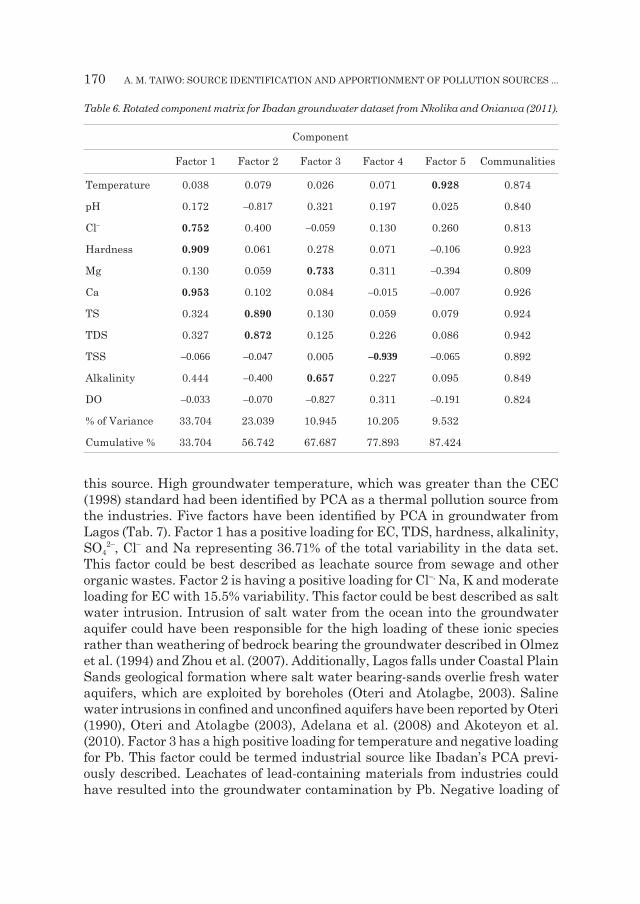
this source. High groundwater temperature, which was greater than the CEC (1998) standard had been identified by PCA as a thermal pollution source from the industries. Five factors have been identified by PCA in groundwater from lagos (Tab. 7). factor 1 has a positive loading for EC, TDS, hardness, alkalinity, SO4
2–, Cl– and Na representing 36.71% of the total variability in the data set. This factor could be best described as leachate source from sewage and other organic wastes. factor 2 is having a positive loading for Cl–, Na, K and moderate loading for EC with 15.5% variability. This factor could be best described as salt water intrusion. Intrusion of salt water from the ocean into the groundwater aquifer could have been responsible for the high loading of these ionic species rather than weathering of bedrock bearing the groundwater described in Olmez et al. (1994) and zhou et al. (2007). Additionally, lagos falls under Coastal Plain Sands geological formation where salt water bearing-sands overlie fresh water aquifers, which are exploited by boreholes (Oteri and Atolagbe, 2003). Saline water intrusions in confined and unconfined aquifers have been reported by Oteri (1990), Oteri and Atolagbe (2003), Adelana et al. (2008) and Akoteyon et al. (2010). factor 3 has a high positive loading for temperature and negative loading for Pb. This factor could be termed industrial source like Ibadan’s PCA previ-ously described. leachates of lead-containing materials from industries could have resulted into the groundwater contamination by Pb. Negative loading of
Table 6. Rotated component matrix for Ibadan groundwater dataset from Nkolika and Onianwa (2011).
Component
factor 1 factor 2 factor 3 factor 4 factor 5 Communalities
Temperature 0.038 0.079 0.026 0.071 0.928 0.874
pH 0.172 –0.817 0.321 0.197 0.025 0.840
Cl– 0.752 0.400 –0.059 0.130 0.260 0.813
Hardness 0.909 0.061 0.278 0.071 –0.106 0.923
Mg 0.130 0.059 0.733 0.311 –0.394 0.809
Ca 0.953 0.102 0.084 –0.015 –0.007 0.926
TS 0.324 0.890 0.130 0.059 0.079 0.924
TDS 0.327 0.872 0.125 0.226 0.086 0.942
TSS –0.066 –0.047 0.005 –0.939 –0.065 0.892
Alkalinity 0.444 –0.400 0.657 0.227 0.095 0.849
DO –0.033 –0.070 –0.827 0.311 –0.191 0.824
% of Variance 33.704 23.039 10.945 10.205 9.532
Cumulative % 33.704 56.742 67.687 77.893 87.424

GEOfIzIKA, VOl. 29, NO. 2, 2012, 157–174 171
Pb, and positive loading for temperature suggests that Pb concentration in the groundwater is not temperature dependent. Temperature influences water chem-istry. The fourth factor with positive loading for pH and alkalinity and negative loading for NO3
– may not be fitted in any factor, and hence termed unknown. The last factor 5 has a negative loading for zn and moderate positive correlation for nitrate, and phosphate could be assigned nutrient source. leaching of nutrients from septic tanks, pit latrines and dumping sites could have been responsible for the factor.
4. Conclusion
It was observed from this review study that physico-chemical parameters reported by various authors in the groundwater from south-western Nigeria showed high concentrations of fe, Mn, Pb and NO3
–. Elevated microbial popula-tions were observed in some of the groundwater samples, signifying faecal pol-
Table 7. Rotated component matrix in Lagos groundwater dataset reported by Yusuf (2007).
Component
factor 1 factor 2 factor 3 factor 4 factor 5 Communalities
pH 0.057 0.143 –0.137 0.896 0.233 0.899
Temperature –0.226 –0.001 0.909 –0.058 –0.085 0.888
EC 0.561 0.552 0.153 0.419 –0.127 0.835
TDS 0.904 0.252 0.109 –0.070 –0.077 0.903
Hardness 0.864 0.151 –0.228 0.160 0.105 0.859
Alkalinity 0.654 0.227 –0.279 0.560 –0.071 0.876
SO42– 0.799 –0.096 –0.069 –0.110 0.338 0.780
NO3– 0.262 0.347 –0.116 –0.624 0.422 0.770
PO43– 0.167 –0.449 0.461 0.357 0.459 0.780
Cl– 0.605 0.739 0.030 –0.011 0.028 0.914
Na 0.558 0.708 –0.097 –0.123 0.155 0.861
K –0.023 0.880 0.255 0.143 0.195 0.899
Pb –0.038 –0.209 –0.797 0.074 0.129 0.702
zn –0.064 –0.175 0.177 –0.052 –0.796 0.702
% of Variance 36.711 15.507 13.051 9.635 8.446
Cumulative % 36.711 52.218 65.269 74.904 83.35
172 A. M. TAIWO: SOURCE IDENTIfICATION AND APPORTIONMENT Of POllUTION SOURCES ...
lution. Using PCA as an apportionment tool, major sources identified were bed-rock weathering/sea water, nutrient, solids, urban/traffic runoff and industry. Urgent attention is required for protection of groundwater resource in this region for its importance as the major source of drinking water.
References
Adelana, S. M. A., Olasehinde, P. I., Bale, R. B., Vrbka, P., Edet, A. E. and Goni, I. B. (2008): An over-view of the geology and hydrogeology of Nigeria, in Applied Groundwater Studies in Africa, IAH Selected Papers on Hydrogeology, edited by Adelana S. and MacDonald, A., CRC Press/Balkema, Taylor & francis Group, The Netherlands, 13, 171–199, Print ISBN: 978-0-415-45273-1, eBook ISBN: 978-0-203-88949-7, DOI: 10.1201/9780203889497.ch11.
Akoteyon, I. S., Ogundele, O. and Soladoye, O. (2010): Characterization by factor analysis of chemical facies of groundwater in the coastal plain sands aquifer of lagos, South Western Nigeria, Int. J. Acad. Res., 2(5), 256–260.
Ayedun, H., Taiwo, A. M., Umar, B. f., Oseni, O. A. and Oderinde, A. A. (2011): Potential groundwater contamination by toxic metals in Ifo, Southwest Nigeria, Indian J. Sci. Technol., 4, 820–823.
Castanho, A. D. A. and Artaxo, P. (2001): Wintertime and summertime Sao Paulo aerosol apportion-ment study, Atmos. Environ., 35, 4889–4902.
CEC (Commission of European Communities) (1988): European Community environmental legislation: 1967–1987. Document number XI/989/87. Directorate-General for Environment, Consumer Protec-tion and Nuclear Safety. Brussels, Belgium, 229 pp.
Eni, D. l., Obiefuna, J. N., Oko, C. and Ekwok, I. (2011): Impact of urbanization on sub-surfacewater quality in Calabar municipality, Nigeria, Int. J. Human. Soc. Sci., 1(10), 167–172.
Erah, P. O., Akujieze, C. N. and Oteze, G. E. (2002): Quality of groundwater in Benin City: A baseline study on inorganic chemicals and microbial contaminants of health importance in boreholes and open wells, Trop. J. Pharm. Res., 1, 75–82.
florea, A-M. and Busselberg, D. (2006): Occurrence, use and potential toxic effects of metals and metal compounds, BioMetals, 19, 419–427.
Gbadebo, A. M., Oyedepo, J. A. and Taiwo, A. M. (2010): Variability of nitrate in groundwater in some parts of Southwestern Nigeria, Pac. J. Sci. Technol., 11, 572–584, http://www.akamaiuniversity.us/PJST.htm
Gbadebo, A. M. and Taiwo, A. M. (2011): Geochemical characterization of phraetic aquifers in area of Sango, Southwestern, Nigeria, World Appl. Sci. J., 12, 815–821.
Harrison, R. M., Tilling, R., Romero, M. S. C., Harrad, S. and Jarvis, K. (2003): A study of trace metals and polycyclic aromatic hydrocarbon in the roadside environment, Atmos. Environ., 37, 2391–2402.
Huang, f., Wang, X., lou, l., zhou, z. and Wu, J. (2010): Spatial variation and source apportionment of water pollution in Qiantang River (China) using statistical techniques, Water Res., 44, 1562–1572.
Jones, A. A. and Hockey, R. A. (1964): The geology of part of southern Nigeria, Geol. Bull., 31, 101 pp.lefort, R. (2006): Down to the last drop. UNESCO Sources. 84, 7 pp.longe, E. O. (2011): Groundwater resources potential in the coastal plain sands aquifers, lagos, Nige-
ria, Res. J. Environ. Earth Sci., 3, 1–7.Longe, E. O. and Balogun, M. R. (2010): Groundwater quality assessment near a municipal landfill,
lagos, Nigeria, Res. J. Appl. Sci. Eng. Te., 2, 39–44.longe, E. O. and Kehinde, M. O. (2005): Investigation of potential groundwater impacts at an unlined
waste disposal site in Agege, lagos, Nigeria, in Proceedings of 3rd Faculty of Engineering Interna-tional Conference, May 23 – 26, 2005, University of lagos, lagos, Nigeria, 21–29.
Longe, E. O. and Enekwechi, L. O. (2007): Investigation of potential groundwater impacts and influence of local hydrogeology on natural attenuation of leachate at municipal landfill, Int. J. Environ. Sci. Technol., 4, 133–140.
GEOfIzIKA, VOl. 29, NO. 2, 2012, 157–174 173
McCasland, M., Trautmann, N. M., Robert, R. J. and Porter, K. S. (2007): Nitrate: Health effects in drinking water, Center for Environmental Research and Natural Resources. Cornell University Cooperative Extension, accessed in March 2012 at http://psep.cce.cornell.edu/facts-slides-self/facts/nit-heef-grw85.aspx
Nkolika, I. C. and Onianwa, P. C. (2011): Preliminary study of the impact of poor waste management on the physic-chemical properties of groundwater in some areas of Ibadan, Res. J. Environ. Sci., 5, 194–199.
Ochieng, G. M., Ojo, O. I., Ogedengbe, K. and Ndambuki, J. M. (2011): Open wells, sanitary features, pollutions and water qualities: Case study of Ibadan slums, Nigeria, Int. J. Phys. Sci., 6, 3062–3073.
Ojo, O. I. (2002): Construction and maintenance of borehole in Anambra State (PTf sponsored project experience), M.Sc. Seminar Report, University of Ibadan, Department of Agricultural Environmen-tal Engineering, Nigeria, 18(3).
Olmez, I., Beal., J. W. and Villaume, J. f. (1994): A new approach to understanding multiple-source groundwater contamination: factor analysis and chemical mass balances, Water Resour., 28, 1095–1101.
Orebiyi, E. O., Awomeso, J. A., Martins, O., Idowu, A. O., Oguntoke, O. and Taiwo, A. M. (2010): As-sessment of pollution hazards of shallow well water in Abeokuta and environs. Am. J. Environ. Sci., 6, 50–56, DOI: 10.3844/ajessp.2011.525.530.
Oteri, A. U. (1990): Delineation of sea water intrusion in a coastal beach ridge of forcado, J. Min. Geol., 26, 225–229.
Oteri, U. and Atolagbe, f. P. (2003): Saltwater intrusion into coastal aquifers in Nigeria, The Second International Conference on Saltwater Intrusion and Coastal Aquifers – Monitoring, Modeling, and Management (SWICA-M 3), March 30–April 2, 2003, Mérida, Yucatán, México, 6 pp, accessed in March 2012 at http://www.olemiss.edu/sciencenet/saltnet/swica2/Oteri_ext.pdf
Oyedele, K. f. Ogagarue D. O and Esse, O. (2011): Groundwater potential evaluation using surface geophysics at Oru-Imope, South-Western Nigeria, Eur. J. Sci. Res., 63, 515–522.
Pekey, H., Karakas, D. and Bakoglu, M. (2004): Source apportionment of trace metals in surface waters of a polluted stream using multivariate statistical analyses, Mar. Pollut. Bull., 49, 809–818.
Qu, W. and Kelderman, P. (2001): Heavy metal contents in the Delft canal sediments and suspended solids of the River Rhine: Multivariate analysis for source tracing, Chemosphere, 45, 919–925.
Simeonov, V., Stratis, J. A., Samara, C., zacharadis, G., Vousta, D. and Anthemidis, A. (2003): Assess-ment of the surface water quality in Northern Greece, Water Res., 37, 4119–4124.
Suthar, S., Bishnoi, P., Singh, S., Mutiyar, P. K., Nema, A. K. and Patil., N. S. (2009): Nitrate con-tamination in groundwater of some rural areas of Rajasthan, India, J. Hazard. Mater., 171, 189–199, DOI: 10.1016/j.jhazmat.2009.05.111.
Singh, K. P., Malik, A. and Sinha, S. (2005): Water quality assessment and appointment of pollution sources of Gomti river (India): A case study, Anal. Chim. Acta, 538, 355–374, DOI: 10.1016/j.aca.2005.02.006.
Taiwo, A. M. (2011): Composting as a sustainable waste management technique in developing coun-tries, J. Environ. Sci. Technol., 4, 93–102, DOI: 10.3923/jest.2011.93.102.
Taiwo, A. M., Adeogun, A. O., Olatunde, K. A. and Adegbite, K. I. (2011): Analysis of groundwater quality of hand-dug wells in peri-urban area of Obantoko, Abeokuta, Nigeria for selected physic-chemical parameters, Pac. J. Sci. Technol., 12, 527–534.
Taiwo, A. M. (2010): Environmental impact of poultry farm operations on Alakata Stream at Isolu in Abeokuta, Nigeria, M.S. Thesis, University of Agriculture, Department of Environmental Man-agement and Toxicology, Abeokuta, Nigeria, 108 pp.
Taiwo, A. M., Ige, S. O. and Babalola, O. O. (2010a): Assessments of possible gonadotoxic effect of lead on experimental male rabbits, Global Veterinaria, 5, 282–286.
Taiwo, A. M., Aluko, E. A. and Babalola, O. O. (2010b): Investigations into the teratogenic potentials of lead in pregnant rabbit, Int. J. Biol. Chem. Sci., 4, 809–814.
Watson, J. G., Judith, T. z., Chow, C., Eric, J. E., fujita, M. and Wilson, W. E. (2002): Receptor modelling application framework for particle source apportionment, Chemosphere, 49, 1093–1136.
174 A. M. TAIWO: SOURCE IDENTIfICATION AND APPORTIONMENT Of POllUTION SOURCES ...
WHO (2011): Guidelines for drinking-water-quality. 4th Edition. World Health Organisation, Geneva, 541 pp.
Yin, J., Harrison, R. M., Chen, Q., Rutter, A. and Schauer, J. J. (2010): Source apportionment of fine particles at urban background and rural sites in the UK atmosphere, Atmos. Environ., 44, 841–851.
Yusuf, K. A. (2007): Evaluation of groundwater quality characteristics in lagos-City, J. Appl. Sci., 7, 1780–1784.
zhang, X., Guo, f., Meng, W. and Wang, X-Q. (2009): Water quality assessment and source identi-fication of Daliao river basin using multivariate statistical method, Environ. Monit. Assess., 152, 105–121.
zhang, X., Wang, Q. and liu, Y. (2011): Application of multivariate statistical techniques in the as-sessment of water quality in the Southwest New Territories and Kowloon, Hong Kong, Environ. Monit. Assess., 173, 17–27.
Zhou, F., Guo, H. and Liu, L. (2007): Quantitative identification and source apportionment of an-thropogenic heavy metals in marine sediment of Hong Kong, Environ. Geol., 53, 295–305.
SAŽETAK
Identifikacija izvora onečišćenja podzemnih voda u većim gradovima jugozapadne NigerijeAdewale Matthew Taiwo
Kao glavni izvor pitke vode stanovnicima jugozapadne Nigerije služi voda iz kopanih ili bušenih bunara. Njihovo onečišćenje potječe iz mnogih nepoznatih izvora. Cilj ovog rada je odrediti izvore onečišćenja podzemnih voda u pet većih gradova u jugozapadnoj Nigeriji metodom (analizom) glavnih komponenti (PCA). fizikalno-kemijski parametri podzemnih voda u gradovima: Abekuta, Ifo, Sango, Ibadan i lagos preuzeti su iz litera-ture, a evoluirani pomoću statističkog paketa SPSS. Vrijednost faktora dobivenih anal-izom glavnih komponenti kreće se u rasponu od četiri do osam. Identificirani izvori onečišćenja su: dekompozicija stijena (pod utjecajem morske vode ili u kombinaciji s morskom vodom), nutrienti, krute tvari, urbano-prometna odvodnja, industrija, tvrdoća (otopljeni minerali), fekalno onečišćenje, ispiranje tla, prodor slane vode i procjedna voda.
Ključne riječi: podzemna voda, faktor, analiza glavnih komponenti, onečišćenje, opterećenje, jugozapadna Nigerija
Corresponding author’s address: Adewale Matthew Taiwo, University of Birmingham, School of Geography, Earth and Environmental Sciences, Division of Environmental Health Risk Management, B15 2TT, Birmingham, UK, e-mail: [email protected]


