

A preliminary base PREP prospectus and an amended and restated preliminary base PREP prospectus containing important informa8on rela8ng to the securi8es described in this document have been filed with the securi8es regulatory authori8es in each of the provinces of Canada. A copy of the amended and restated preliminary base PREP prospectus, and any further amendment, is required to be delivered with this document. The amended and restated preliminary base PREP prospectus is s8ll subject to comple8on. There will not be any sale or any acceptance of an offer to buy the securi8es un8l a receipt for the final base PREP prospectus has been issued. This document does not provide full disclosure of all material facts rela8ng to the securi8es offered. Investors should read the amended and restated preliminary base PREP prospectus, the final base PREP prospectus, the supplemented PREP prospectus and any amendment for disclosure of those facts, especially risk factors rela8ng to the securi8es offered, before making an investment decision.
July 2, 2015
DISCLAIMER
Certain informa8on in this presenta8on is confiden8al and does not provide full disclosure of all material facts rela8ng to Spin Master Corp. (the “Company”), its securi8es, or the proposed ini8al offering of its securi8es. This presenta8on does not cons8tute investment advice or an offer or solicita8on for the purchase or sale of securi8es. An offer or solicita8on for the purchase or sale of securi8es is done only by the prospectus. An investment in the Subordinate Vo8ng Shares is subject to a number of risks. A prospec8ve purchaser should review this document in its en8rety and carefully consider the risk factors described under “Risk Factors” in the amended and restated preliminary base PREP prospectus before purchasing the Subordinate Vo8ng Shares. Closing of the offering is condi8onal upon the Subordinate Vo8ng Shares being approved for lis8ng on the Toronto Stock Exchange.
The securi8es of the Company have not been and will not be registered under the United States Securi8es Act of 1933, as amended (the “U.S. Securi8es Act”) or any state securi8es legisla8on and may not be offered or sold in the United States except in compliance with the registra8on requirements of the U.S. Securi8es Act and applicable state securi8es legisla8on or pursuant to an exemp8on therefrom. The amended and restated preliminary base PREP prospectus and this document each do not cons8tute an offer to sell or a solicita8on of an offer to buy any of the securi8es offered hereby within the United States.
FORWARD-‐LOOKING INFORMATION Certain statements contained in this presenta8on and any accompanying oral statement contains “forward-‐looking informa8on” within the meaning of securi8es laws. Forward-‐looking informa8on may relate to the Company’s future outlook and an8cipated events or results and may include statements regarding the industry trends, financial posi8on, business strategy, growth strategy, opera8ons, financial results, taxes, dividends, plans and objec8ves of the Company, or directors of the Company, as the case may be. Par8cularly, statements regarding future results, performance, achievements, prospects or opportuni8es of the Company are forward-‐looking informa8on. The words “plans”, “expects”, “projected”, “es8mated”, “forecasts”, “an8cipates”, “indica8ve”, “intend”, “guidance”, “outlook”, “poten8al”, “prospects”, “seek”, “strategy”, “targets” or “believes”, or varia8ons of such words and phrases or statements that certain future condi8ons, ac8ons, events or results “will”, “may”, “could”, “would”, “should”, “might” or “can”, or nega8ve versions thereof, “be taken”, “occur”, “con8nue” or “be achieved”, and other similar expressions, iden8fy forward-‐looking informa8on. Forward-‐looking informa8on is necessarily based upon management’s percep8ons of historical trends, current condi8ons and expected future developments, as well as a number of specific factors and assump8ons that, while considered reasonable by management as of the date on which the statements are made in this presenta8on, are inherently subject to significant business, economic and compe88ve uncertain8es and con8ngencies which could result in the forward-‐looking informa8on ul8mately being incorrect. Known and unknown risk factors, many of which are beyond the control of the Company, could cause actual results to differ materially from the forward-‐looking informa8on in this presenta8on, such factors, without limita8on, are discussed in greater detail in the “Risk Factors” sec8on of the amended and restated preliminary base PREP prospectus. There can be no assurance that such statements will prove to be accurate, as actual results and future events could differ materially from those an8cipated in such statements. Forward-‐looking informa8on is provided for the purpose of providing informa8on about management’s expecta8ons and plans rela8ng to the future. The Company disclaims any inten8on or obliga8on to update or revise any forward-‐looking informa8on whether as a result of new informa8on, future events or otherwise, or to explain any material difference between subsequent actual events and such forward-‐looking informa8on, except to the extent required by applicable law. Accordingly, readers should not place undue reliance on forward-‐looking informa8on.
NON-‐IFRS MEASURES In addi8on to using financial measures prescribed by IFRS, references are made in this presenta8on to ‘‘Adjusted EBITDA’’, ‘‘Adjusted Net Income’’, ‘‘EBITDA’’, ‘‘Free Cash Flow’’, ‘‘Gross Product Sales’’, ‘‘Sales Allowances’’ and ‘‘Total Gross Sales’’, which are non-‐IFRS financial measures. Non-‐IFRS financial measures do not have any standardized meaning prescribed by IFRS and are therefore unlikely to be comparable to similar measures presented by other issuers. For further details on these non-‐IFRS financial measures, see “Non-‐IFRS Financial Measures” in the amended and restated preliminary base PREP prospectus.
CERTAIN OTHER MATTERS Any graphs, tables or other informa8on demonstra8ng the historical performance of the Company or any other en8ty contained in this presenta8on are intended only to illustrate past performance of such en88es and are not necessarily indica8ve of future performance of the Company or such en88es. All financial disclosure in this presenta8on is in U.S. dollars, unless otherwise noted. Capitalized terms and abbrevia8ons not otherwise defined herein have the meaning assigned to them in the amended and restated preliminary base PREP prospectus.
2
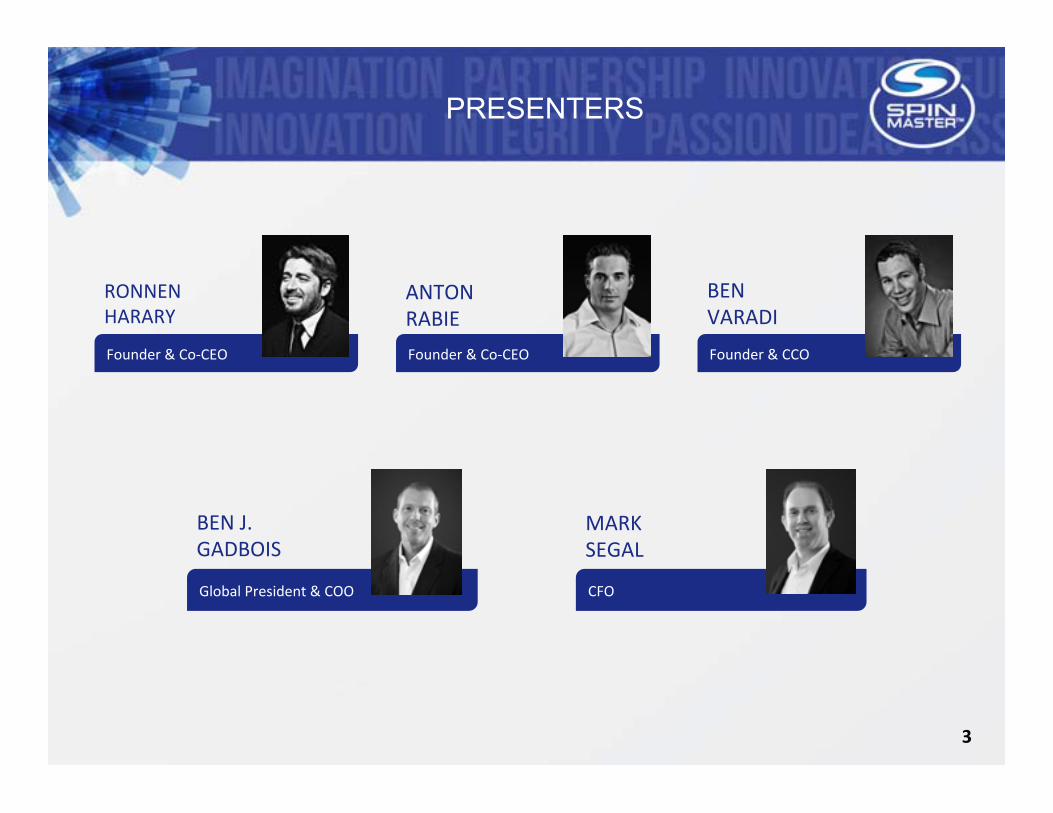
Founder & Co-‐CEO
RONNEN HARARY
PRESENTERS
3
Founder & Co-‐CEO
ANTON RABIE
Global President & COO
BEN J. GADBOIS
CFO
MARK SEGAL
Founder & CCO
BEN VARADI
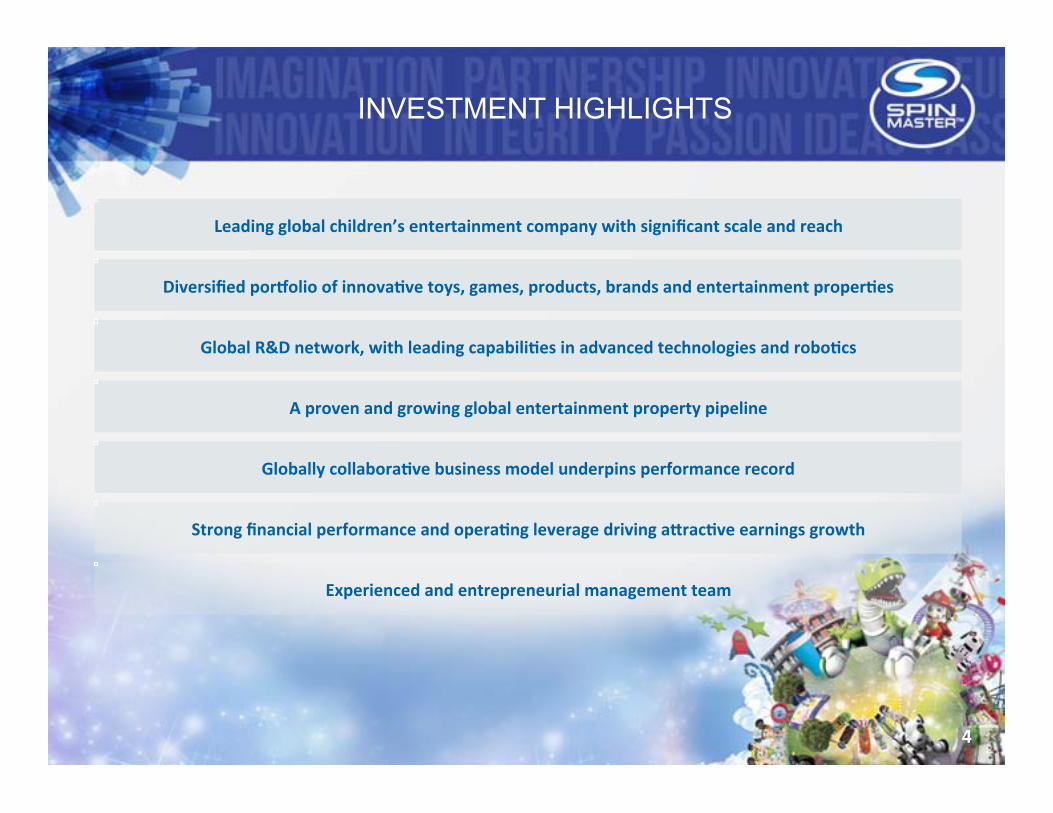
INVESTMENT HIGHLIGHTS
Leading global children’s entertainment company with significant scale and reach
Diversified porAolio of innovaCve toys, games, products, brands and entertainment properCes
Global R&D network, with leading capabiliCes in advanced technologies and roboCcs
A proven and growing global entertainment property pipeline
Globally collaboraCve business model underpins performance record
Strong financial performance and operaCng leverage driving aJracCve earnings growth
Experienced and entrepreneurial management team
4

LEADING CHILDREN’S ENTERTAINMENT COMPANY
5
• Spin Master creates, designs, manufactures and markets a diversified porcolio of innova8ve products, brands and entertainment proper8es
• Business is grouped into four segments
• Approximately US$812 million in Gross Product Sales in 2014
− 2012-‐2014 Gross Product Sales CAGR of 30%
− 10-‐year Gross Product Sales CAGR of 12%
• Adjusted EBITDA of US$112 million in 2014
− 2013-‐2014 Adjusted EBITDA growth of approximately 110%
• 14 global offices and sales in over 60 countries
• Recognized as market leader in innova8on
2014 Gross Product Sales by Business Segment
Remote Control and InteracCve Characters
33%
Boys AcCon and High-‐Tech ConstrucCon
24%
AcCviCes, Games & Puzzles and Fun
Furniture 23%
Pre-‐School and Girls 20%

GLOBAL CHILDREN’S ENTERTAINMENT INDUSTRY
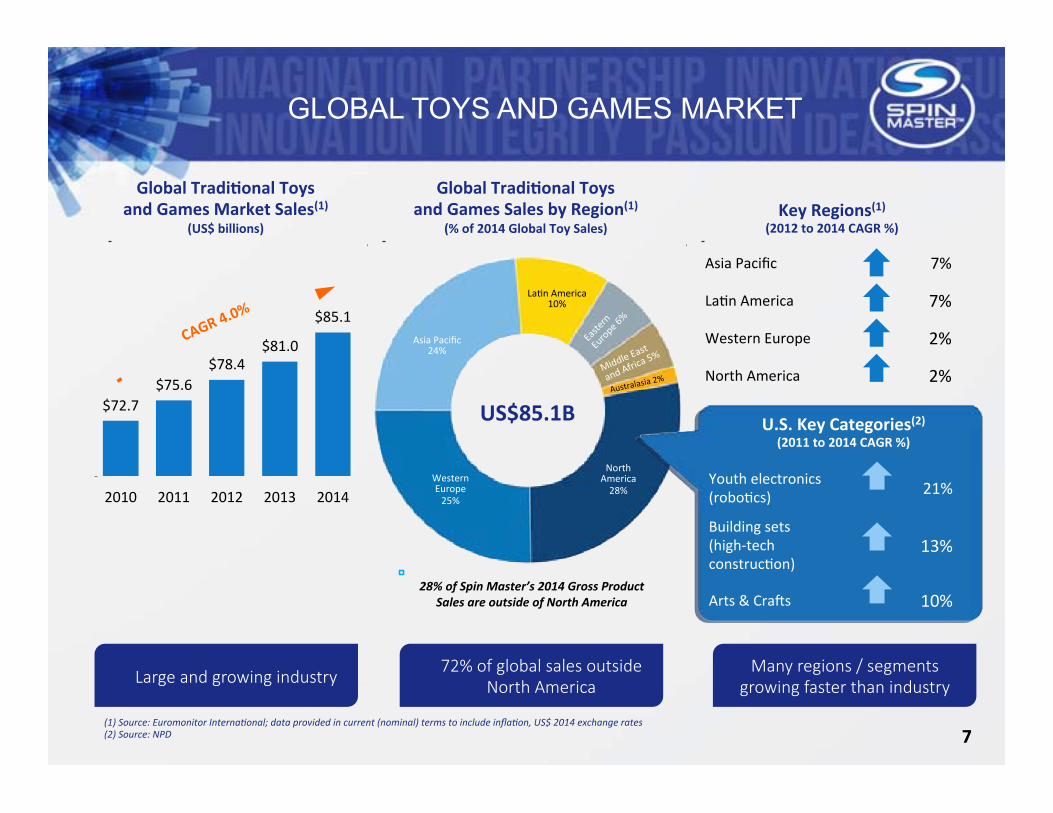
Global TradiConal Toys and Games Sales by Region(1)
(% of 2014 Global Toy Sales)
North America 28%
La8n America 10%
Western Europe 25%
Asia Pacific 24%
US$85.1B Australa
sia 2%
Global TradiConal Toys and Games Market Sales(1)
(US$ billions)
$72.7 $75.6
$78.4 $81.0
$85.1
2010 2011 2012 2013 2014
Key Regions(1) (2012 to 2014 CAGR %)
Asia Pacific 7%
La8n America 7%
Western Europe 2%
North America 2%
7
GLOBAL TOYS AND GAMES MARKET
Large and growing industry 72% of global sales outside
North America Many regions / segments
growing faster than industry
U.S. Key Categories(2) (2011 to 2014 CAGR %)
(1) Source: Euromonitor Interna3onal; data provided in current (nominal) terms to include infla3on, US$ 2014 exchange rates (2) Source: NPD
28% of Spin Master’s 2014 Gross Product Sales are outside of North America
U.S. Key Categories(2) (2011 to 2014 CAGR %)
Youth electronics (robo8cs) 21%
Building sets (high-‐tech construc8on)
13%
Arts & Craos 10%

• As of 2014, 44% of households globally have internet access at home (versus 27% in 2009)(1)
• Convergence of the internet with TVs and smart devices has created many new opportuni8es for media and content distribu8on
− Neclix has 62 million global subscribers across over 50 countries(2)
− YouTube has 1 billion+ users and is localized in 75 countries(3)
MEDIA AND ENTERTAINMENT TRENDS
8
Strong growth in global demand for children’s content
Global DistribuBon of Digital Content
• As a result of technology prolifera8on, demand for entertainment-‐oriented content is increasing, especially for children and family content
− In February 2015, YouTube quoted 200% YoY growth in viewing 8me on its family entertainment channels versus 50% YoY growth for YouTube overall(4)
• Younger children are increasingly using tablets and smartphones to access their favourite content
− U.S. retail sales of mobile games, excluding in-‐app purchases, reached US$1.2 billion in 2014(5)
− The market grew at a 18.2% CAGR in 2011-‐2014
ConsumpBon of Media Content
• Companies with established and / or expanded in-‐house capabili8es to develop their own entertainment content have an advantage
− Entertainment-‐backed toys can be less expensive to produce, have a longer shelf life and offer mul8ple sources of revenue genera8on
− Combining marke8ng, distribu8on and brand management and product design capabili8es with programming and licensing exper8se increases brand control and opportuni8es to increase margins
Original and Owned Entertainment
Content
(1) Interna3onal Telecommunica3on Union (2) Source: NeHlix Q1 2015 10-‐Q Report (3) Source: YouTube website
(4) Source: USA Today ar3cle (YouTube unveils new app for kids) (5) Source: Euromonitor Interna3onal; data provided in current (nominal) terms to include infla3on
SPIN MASTER OVERVIEW

10
EXCEPTIONAL BRAND GROWTH AND DIVERSIFICATION
Spin Master has grown and diversified into 69 product lines

GLOBAL R&D NETWORK WITH CAPABILITIES IN ADVANCED TECHNOLOGIES AND ROBOTICS
• Global R&D opera8ons and network of 3rd party collaborators – Strategically located internal R&D centres – Collabora8ve model that leverages external inventors and designers
• History of introducing technology to revolu8onize tradi8onal toys – Within the Radio / Remote Control subclass, Air Hogs was the #1 selling brand of
flying toys in the United States in 2014(1)
– #1 in the Robo8cs and Interac8ve toys category in 2014(1)
(1) Source: NPD (2) Source: Toy Industry Associa3on, Inc., calculated since 2005 11
(3) Consumer Electronics Show
Technology allows Spin Master to develop differenBated products, bring iconic characters to life and enhance consumer engagement
• Numerous toy and technology industry awards for innova8on across mul8ple categories
– Recognized with 11 Toy of the Year nomina8ons for “Innova8ve Toy of the Year”(2) -‐ more than any other compe8tor
– Zoomer brand recipient of three Toy of the Year awards over last two years(2)
– Meccanoid recipient of 2015 CES(3) “Last Gadget Standing” award

12
GLOBAL R&D NETWORK WITH CAPABILITIES IN ADVANCED TECHNOLOGIES AND ROBOTICS
Case Study: Air Hogs brand Case Study: Zoomer brand
Spin Master's focus on innovaBon has established new business units and maintains a pipeline of creaBve new brand extensions
CumulaCve Gross Product Sales of Air Hogs:
Over US$1 billion
G2 Inven8ons presented Spin Master with a voice ac8vated and sight responsive truck which evolved into a loveable pet dog
The Zoomer brand has won three TOTYs in the last
two years
Two Bri8sh inventors brought to Spin Master a prototype flying vehicle which led to the development of Sky Shark
1998
HELIX X4
VECTRON
SKY STUNT
ZERO GRAVITY
SHARP SHOOTER
ZUPPIES
ZOOMER DINO
JURASSIC WORLD
CHOMPLINGZ
KITTY
Today 2013 Today
SKY SHARK
Zoomer Dog
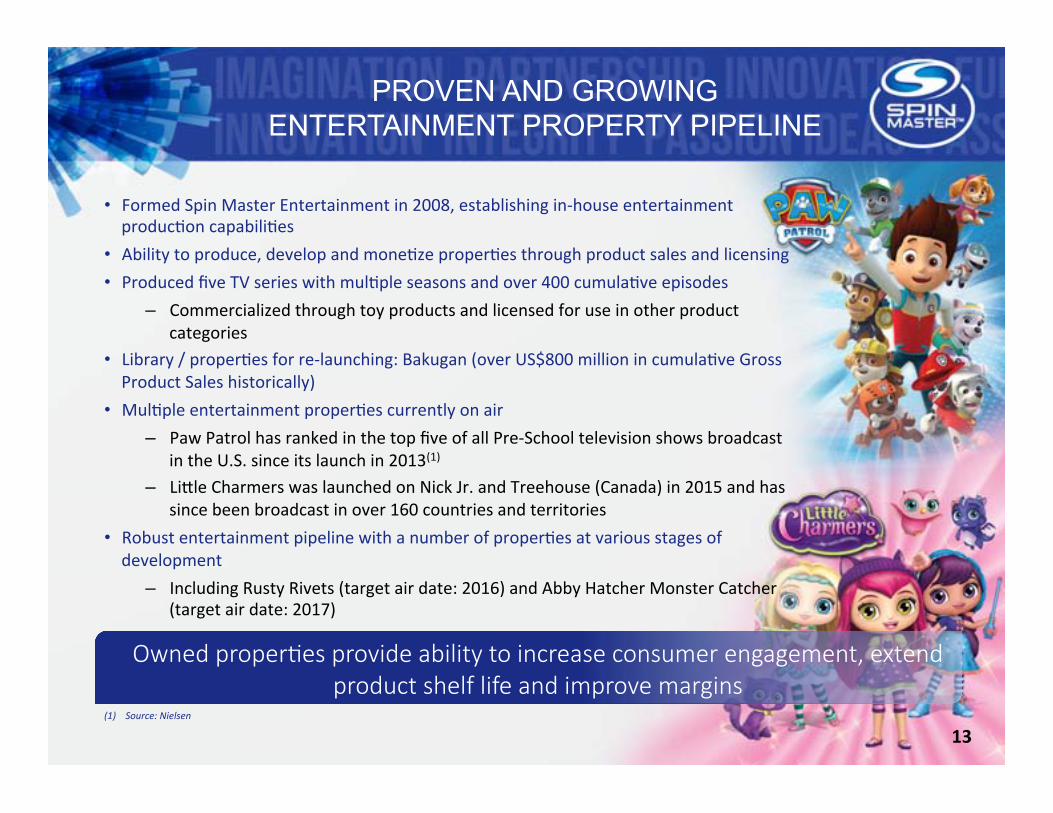
• Formed Spin Master Entertainment in 2008, establishing in-‐house entertainment produc8on capabili8es
• Ability to produce, develop and mone8ze proper8es through product sales and licensing • Produced five TV series with mul8ple seasons and over 400 cumula8ve episodes
– Commercialized through toy products and licensed for use in other product categories
• Library / proper8es for re-‐launching: Bakugan (over US$800 million in cumula8ve Gross Product Sales historically)
• Mul8ple entertainment proper8es currently on air – Paw Patrol has ranked in the top five of all Pre-‐School television shows broadcast
in the U.S. since its launch in 2013(1)
– Liwle Charmers was launched on Nick Jr. and Treehouse (Canada) in 2015 and has since been broadcast in over 160 countries and territories
• Robust entertainment pipeline with a number of proper8es at various stages of development
– Including Rusty Rivets (target air date: 2016) and Abby Hatcher Monster Catcher (target air date: 2017)
PROVEN AND GROWING ENTERTAINMENT PROPERTY PIPELINE
Owned properBes provide ability to increase consumer engagement, extend product shelf life and improve margins
(1) Source: Nielsen
13
14
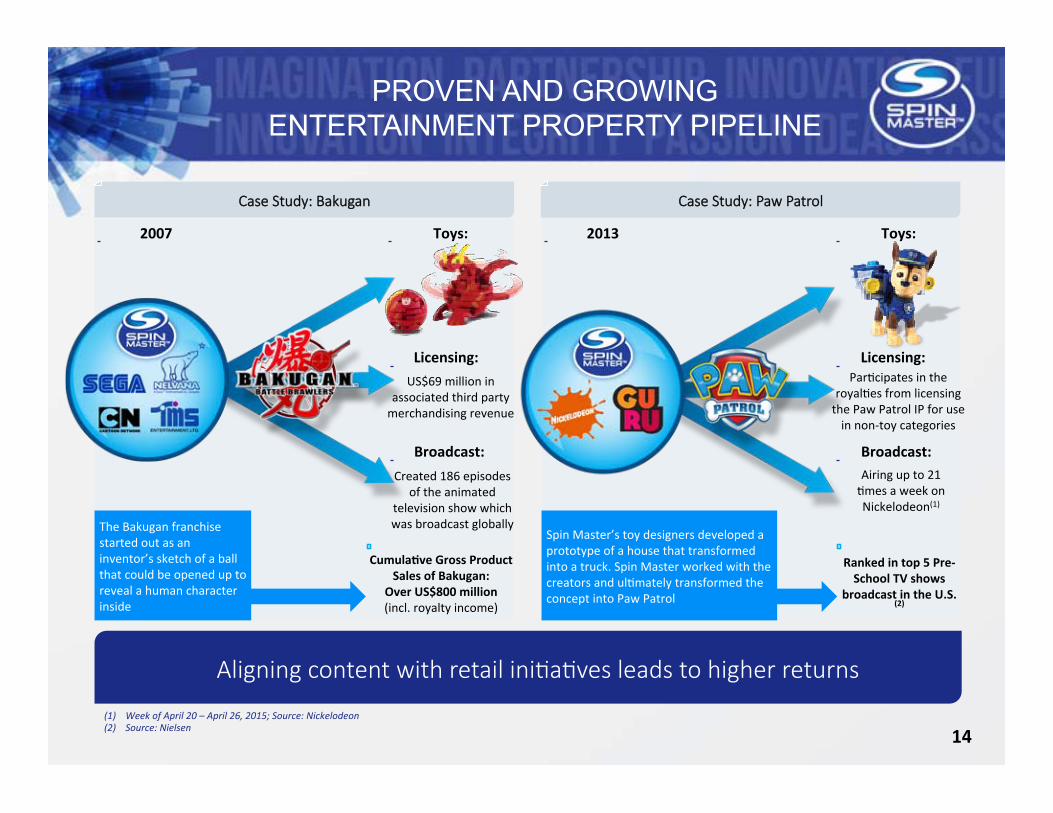
PROVEN AND GROWING ENTERTAINMENT PROPERTY PIPELINE
Case Study: Bakugan Case Study: Paw Patrol
Aligning content with retail iniBaBves leads to higher returns
The Bakugan franchise started out as an inventor’s sketch of a ball that could be opened up to reveal a human character inside
CumulaCve Gross Product Sales of Bakugan:
Over US$800 million (incl. royalty income)
Spin Master’s toy designers developed a prototype of a house that transformed into a truck. Spin Master worked with the creators and ul8mately transformed the concept into Paw Patrol
Ranked in top 5 Pre-‐School TV shows
broadcast in the U.S.(2)
Licensing:
Broadcast:
US$69 million in associated third party merchandising revenue
Created 186 episodes of the animated
television show which was broadcast globally
Airing up to 21 8mes a week on Nickelodeon(1)
2007 2013
Licensing:
Broadcast:
Par8cipates in the royal8es from licensing the Paw Patrol IP for use in non-‐toy categories
(1) Week of April 20 – April 26, 2015; Source: Nickelodeon (2) Source: Nielsen
Toys: Toys:

15
LEVERAGE GLOBAL PLATFORM THROUGH STRATEGIC ACQUISTIONS
Case Study: ImaginaBon Games Case Study: Meccano
Original Games:
Significant returns are achieved as acquired assets generate more value in Spin Master’s hands
Spin Master entered the games & puzzles category in 2010, when it acquired a porcolio of games genera8ng annual sales of ~US$8 million from Imagina8on Games
CumulaCve GBU sales since
acquisiCon: US$286 million
Spin Master acquired Meccano in August 2013, a construc8on play focused company with gross sales of ~€25 million(1) (for the acquired brands)
Spin Master Expansion:
Original Products: 2010 2013
WOULD YOU RATHER?
PERPLEXUS
HEDBANZ
QUELF
BOOM BOOM BALLOON
ELITE HELICOPTER
MECCANO TECH: MECCANOID
MECCANO BUILD AND
PLAY
MECCANO EVOLUTION
ATV
Spin Master Expansion:
(1) For the year ending March 31, 2013
Relaunched the brand; Meccanoid recipient of 2015 CES “Last Gadget
Standing” award

$4 $5 $27 $76 $82 $95
$227 $264
$298 $338
$479 $472 $442
$602 $504
$409
$574
$812
$1
$9
$212 $387
$317
$251
$71
$3
1997 1998 1999 2000 2001 2002 2003 2004 2005 2006 2007 2008 2009 2010 2011 2012 2013 2014
Startup Growth Building the Base Bakugan Growth Refocusing Diversified Growth
CAGRs 10-‐Yr 2-‐Yr
Total Gross Product Sales 12% 30%
Excludes Bakugan and Zoobles 12% 41%
$488
$684
$829
$919
$755
$481
$577 All Other Products Bakugan and Zoobles
16
GROSS PRODUCT SALES GROWTH(1)
Proven long-‐term track record and strong base for future growth
(1) The Company’s revenue recogni3on policy was consistent across the periods presented, despite presen3ng under different accoun3ng frameworks over 3me. While the criteria outlined in the accoun3ng frameworks differed, the applica3on of the criteria under those standards did not lead to any differences in revenue recogni3on
(2) C$318 million Gross Product Sales converted using 1.401 CAD / USD 2003 annual average exchange rate from the Bank of Canada (3) C$344 million Gross Product Sales converted using 1.302 CAD / USD 2004 annual average exchange rate from the Bank of Canada
(2)
(3)
(US$ millions)

Strategic IniCaCves to PosiCon Spin Master for Growth • Founders refined roles and hired a Global President
• Reduced headcount by 35%
• Formed Global Business Units (GBUs) to focus resources
• Refocused European opera8ons for profitable growth
• Redesigned the innova8on pipeline, processes and accountability
• Redesigned global forecas8ng, processes and accountability
• Implemented improved processes and controls for bewer oversight and financial discipline
• Established stronger measurements and clear accountability for GBU performance at all levels of the organiza8on
• Con8nued focus on organic growth through innova8on and entertainment content development in addi8on to acquisi8ons
• Developed market leading capabili8es in interac8ve, robo8c toys
$481 $577
$812
2012 2013 2014 LTM
Gross Product Sales (US$ millions)
($23)
$53
$112 $121
2012 2013 2014 LTM
Adjusted EBITDA (US$ millions)
$842
17
PLATFORM POSITIONED FOR GROWTH
Management has adopted processes to diversify the business and posiBon the Company for sustainable future growth
$144 (16%)
$269 (33%)
2010
2014
# of Product Lines
2010 2014
1 6
10 16
30 34
8 13
49 69
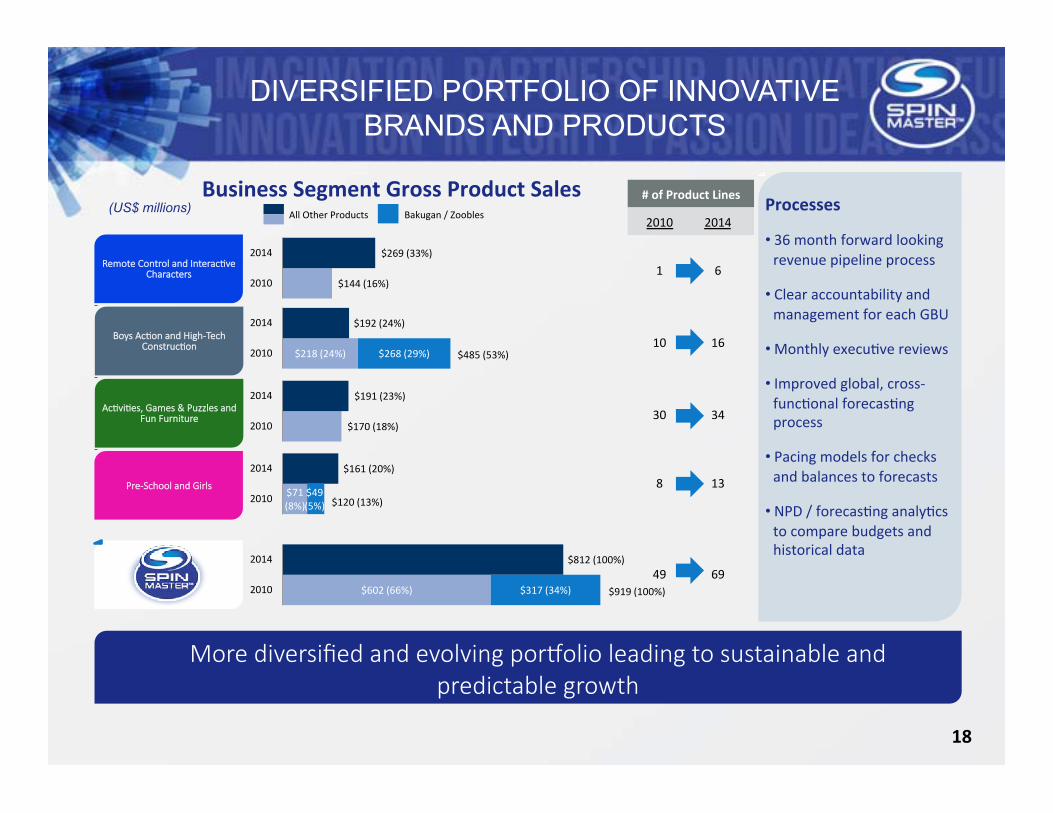
More diversified and evolving porYolio leading to sustainable and predictable growth
18
DIVERSIFIED PORTFOLIO OF INNOVATIVE BRANDS AND PRODUCTS
Processes
• 36 month forward looking revenue pipeline process
• Clear accountability and management for each GBU
• Monthly execu8ve reviews
• Improved global, cross-‐func8onal forecas8ng process
• Pacing models for checks and balances to forecasts
• NPD / forecas8ng analy8cs to compare budgets and historical data
Business Segment Gross Product Sales
AcBviBes, Games & Puzzles and Fun Furniture
Remote Control and InteracBve Characters
Boys AcBon and High-‐Tech ConstrucBon
Pre-‐School and Girls
$218 (24%)
$192 (24%)
$268 (29%)2010
2014
$485 (53%)
$170 (18%)
$191 (23%)
2010
2014
$71(8%)
$161 (20%)
$49(5%)
2010
2014
$120 (13%)
$602 (66%)
$812 (100%)
$317 (34%)2010
2014
$919 (100%)
All Other Products Bakugan / Zoobles (US$ millions)
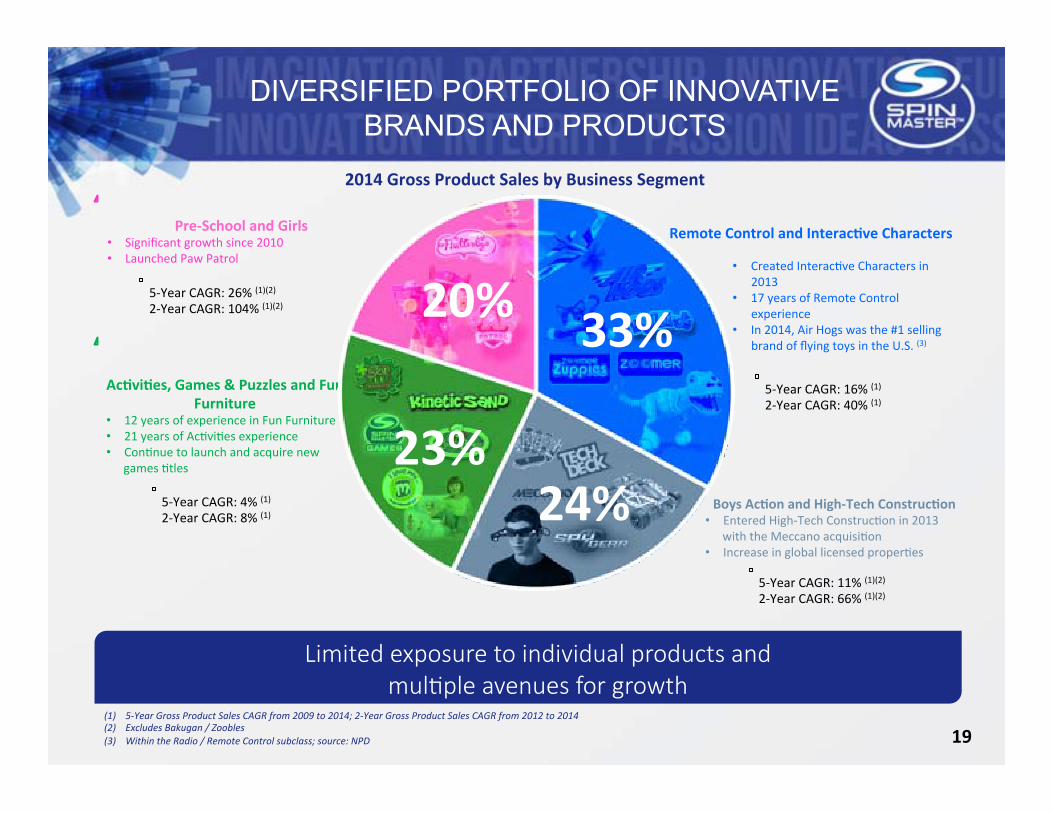
5-‐Year CAGR: 26% (1)(2) 2-‐Year CAGR: 104% (1)(2)
5-‐Year CAGR: 16% (1) 2-‐Year CAGR: 40% (1)
5-‐Year CAGR: 4% (1) 2-‐Year CAGR: 8% (1)
Remote Control and InteracCve Characters
• Created Interac8ve Characters in 2013
• 17 years of Remote Control experience
• In 2014, Air Hogs was the #1 selling brand of flying toys in the U.S. (3)
Boys AcCon and High-‐Tech ConstrucCon • Entered High-‐Tech Construc8on in 2013
with the Meccano acquisi8on • Increase in global licensed proper8es
AcCviCes, Games & Puzzles and Fun Furniture
• 12 years of experience in Fun Furniture • 21 years of Ac8vi8es experience • Con8nue to launch and acquire new
games 8tles
Pre-‐School and Girls • Significant growth since 2010 • Launched Paw Patrol
5-‐Year CAGR: 11% (1)(2) 2-‐Year CAGR: 66% (1)(2)
Limited exposure to individual products and mulBple avenues for growth
2014 Gross Product Sales by Business Segment
19
DIVERSIFIED PORTFOLIO OF INNOVATIVE BRANDS AND PRODUCTS
(1) 5-‐Year Gross Product Sales CAGR from 2009 to 2014; 2-‐Year Gross Product Sales CAGR from 2012 to 2014 (2) Excludes Bakugan / Zoobles (3) Within the Radio / Remote Control subclass; source: NPD
24%
33% 20%
23%

SIGNIFICANT SCALE AND GLOBAL REACH
Spin Master’s global scale is a valuable asset throughout the enBre development cycle
20

GROWTH STRATEGIES

POSITIONED FOR SIGNIFICANT DIVERSIFIED GROWTH
22
Strategies for sustainable growth

23
INNOVATE ACROSS THE PORTFOLIO, EXPANDING CURRENT BUSINESS SEGMENTS
Leveraging compeBBve strengths to drive innovaBon and create a diversified and robust pipeline
InnovaCon Licensing Advanced Technology Entertainment Toys-‐to-‐life
Technology
Opportuni3es for development
Opportuni3es for development
Opportuni3es for development
Opportuni3es for development
Opportuni3es for development
strategies currently employed; under development
AcBviBes, Games &
Puzzles and Fun Furniture
Remote Control and InteracBve Characters
Boys AcBon and High-‐Tech
ConstrucBon
Pre-‐School and Girls

UPCOMING PRODUCT RELEASES
Disciplined process to drive conBnuous innovaBon and predictable growth
24
Select 2014 Product Lines Targeted Expected 2015 Launches(1) Targeted Launches in 2016 & Beyond(2)
• Air Hogs: Star Wars, Fury Jump Jet, Shadow Launcher Car Copter, Helix Video Drone, Rip Force Glider, Helix Ion, Smash Bots
• Digi line extensions: Owl, Penguin, Chicks • Zoomer Kiwy • Zoomer Jurassic Park • Zoomer Chomplingz
• Air Hogs: Batman license • Digi line extensions • Paw Patrol Robo8cs • Zoomer line extensions
• Meccano Tech: Meccanoid • Sick Bricks • Spy Gear Batman • Spy Gear Video Walkie Talkies • Star Wars Yoda + Other
• Angry Birds • Meccano Core re-‐launch • Monster Trucks • The Secret Life of Pets • Star Wars new Interac8ve Character
• Bunchems • Cardinal Games Porcolio • Cool Baker Chocolate Maker • Knits Cool • Pop Stream • Quick Cups • Text Cool • Kine8c Sand Build & Float • Rapidoodle
• Expanding puzzle category • Frozen licensed furniture • Kine8c brand extensions
• Chubby Puppies • Fluwerbye Unicorns • Liwle Charmers • Paw Patrol line extensions • Popples
• Abby Hatcher Monster Catcher • Masha and the Bear • Noddy • The Powerpuff Girls • Rusty Rivets • Teletubbies • Trucktown
AcBviBes, Games &
Puzzles and Fun Furniture
Remote Control and InteracBve Characters
Boys AcBon and High-‐Tech
ConstrucBon
Pre-‐School and Girls
(1) New launches for 2015 in addi3on to carry forward products from 2014 (2) 2016 & Beyond excludes a number of products for compe33ve reasons

UPCOMING LICENSE CONTENT RELEASES
Media Release Date
MOVIES
Toy License Spin Master Segment Property
Pipeline of media content presents strong licensed product sales opportuniBes
25
Jurassic World movie June 2015 Jurassic World-‐themed Dino Remote Control and Interac8ve Characters
Star Wars: Episode VII – The Force Awakens December 2015 Flying Toys
Yoda Remote Control and Interac8ve Characters Boys Ac8on and High-‐Tech Construc8on
Batman v Superman movie March 2016 Toy Vehicles (Remote Control) Batman-‐themed tools and devices (Boys Ac8on)
Remote Control and Interac8ve Characters Boys Ac8on and High-‐Tech Construc8on
Monster Trucks March 2016 Various products Boys Ac8on and High-‐Tech Construc8on
Angry Birds May 2016 Various products Boys Ac8on and High-‐Tech Construc8on
The Secret Life of Pets July 2016 Various products Boys Ac8on and High-‐Tech Construc8on
Peppa Pig 2015 Peppa Pig plush furniture Ac8vi8es, Games & Puzzles and Fun Furniture
Popples 2015 Various products Pre-‐School and Girls
The Powerpuff Girls 2016 Various products Pre-‐School and Girls
Masha and the Bear 2016 Various products Pre-‐School and Girls
Teletubbies TBD Various products Pre-‐School and Girls
Noddy TBD Various products Pre-‐School and Girls
TELEVISION

LIBRARY UPCOMING SLATE
26
DEVELOP EVERGREEN GLOBAL ENTERTAINMENT PROPERTIES
Robust pipeline of owned entertainment content provides a^racBve opportuniBes for revenue and earnings growth
Season 2 Season 1
1-‐2 shows per year
Season 3 Season 2(1) Season 1(1)
TBD TBD Season 1(1)
TBD
Broadcaster: Nickelodeon Nick Jr. Treehouse Nickelodeon TBD -‐
Global Reach: 160 countries 160 countries -‐ -‐ -‐
2015
2016
2017
Strategies
• Leverage current proper8es
• 1-‐2 new proper8es per year
• Re-‐launch Bakugan
• Con8nue to leverage broadcast rela8onships
• Generate new revenue streams
(1) In produc3on; not broadcasted yet

• Selec8vely add sales and marke8ng personnel in current interna8onal sales and marke8ng offices
• Open new company-‐owned sales and marke8ng offices in certain strategic markets
• Build 3rd party distributor networks in markets where Spin Master does not have an established presence
• Focus on increasing business with current distributors
Ability to increase internaBonal sales by leveraging global plaYorm
INCREASE SALES IN DEVELOPED AND EMERGING INTERNATIONAL MARKETS
27
2014 InternaConal Sales
(1) Source: 2014 Global Tradi3onal Toys and Games Sales, Euromonitor (2) Spin Master’s 2014 Gross Product Sales outside of North America
North America, $589M (72%)
Int’l, $223M (28%)(2)
Global Toy Industry(1)
North America, $24B (28%)
Int’l, $61B (72%)
InternaConal Growth Strategies

Proven Track Record Pending AcquisiCon
Leading developer of games & puzzles
Founded in 1948
Over US$50 million in 2014 revenue
28
Well posiBoned with financial flexibility and deep industry relaBonships; proven ability to integrate acquisiBons and drive value
LEVERAGE GLOBAL PLATFORM THROUGH STRATEGIC ACQUISTIONS
• Intellectual proper8es / brands
• Opportunity to innovate • Leverage global infrastructure
• New categories • Interna8onal markets
• Ability to grow and expand margins
AcquisiCon Criteria
(Select Assets)
FINANCIAL REVIEW

$481
$577
$812 $842
$87 $117
2012 2013 2014 LTM Q1 2014 Q1 2015
Gross Product Sales (1) Adjusted EBITDA (1)(2) (US$ millions)
(1) Gross Product Sales and Adjusted EBITDA are non-‐IFRS measures (2) Adjusted EBITDA excludes one 3me or other non-‐recurring items that do not necessarily reflect the Company’s underlying financial performance, including foreign exchange gains or losses,
restructuring costs, write downs, among other items (3) Adjusted EBITDA margin is expressed as a percentage of Revenue
($23)
$53
$112 $121
$1 $10
2012 2013 2014 LTM Q1 2014
Q1 2015
SALES GROWTH AND MARGIN EXPANSION
Strong growth and expanding margins
30
YoY Growth n/a 20.0% 40.7% n/a n/a 34.8% Revenue $418 $508 $716 $745 $78 $107
Adj. EBITDA Margin (3) (5.4%) 10.5% 15.6% 16.2% 1.6% 9.7%
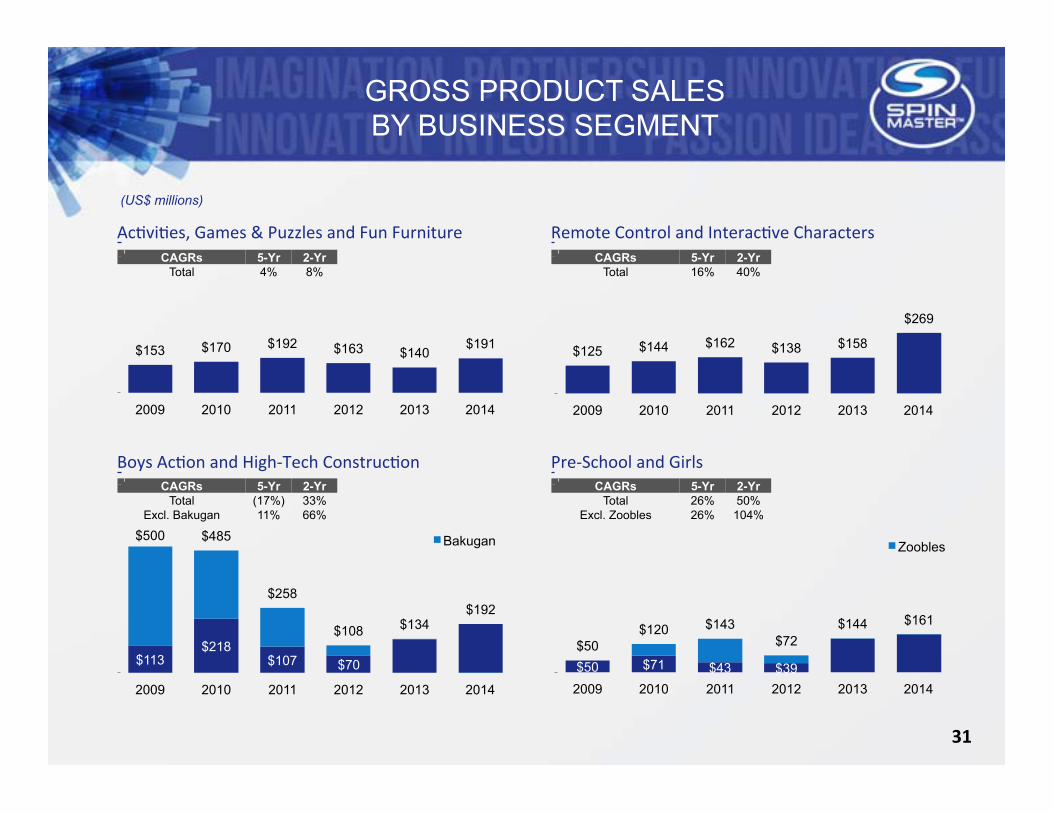
$125 $144 $162 $138 $158
$269
2009 2010 2011 2012 2013 2014
Ac8vi8es, Games & Puzzles and Fun Furniture CAGRs 5-Yr 2-Yr
Total 4% 8%
Remote Control and Interac8ve Characters
Boys Ac8on and High-‐Tech Construc8on Pre-‐School and Girls
CAGRs 5-Yr 2-Yr Total 16% 40%
CAGRs 5-Yr 2-Yr Total (17%) 33%
Excl. Bakugan 11% 66%
CAGRs 5-Yr 2-Yr Total 26% 50%
Excl. Zoobles 26% 104%
$153 $170 $192 $163 $140 $191
2009 2010 2011 2012 2013 2014
$113 $218
$107 $70
$500 $485
$258
$108 $134 $192
2009 2010 2011 2012 2013 2014
Bakugan
$50 $71 $43 $39
$50 $120 $143
$72 $144 $161
2009 2010 2011 2012 2013 2014
Zoobles
(US$ millions)
31
GROSS PRODUCT SALES BY BUSINESS SEGMENT

December fiscal year end 2013 2014
Cash Flow from Operating Activities Before Working Capital $42 $90
Less: Cash Flow from Investing Activities ($15) ($26)
Plus: Cash Used for Brand and Business Acquisitions $2 $1
Free Cash Flow $29 $65
© 2015 Spin Master Ltd. All Rights Reserved.
32
STRONG FREE CASH FLOW
Capital efficient model drives strong free cash flow
(US$ millions)

© 2015 Spin Master Ltd. All Rights Reserved.
December fiscal year end Q1 2015 Pro Forma Q1 2015(1)(2)
Short-term Debt $20 $20
Long-term Debt $1 $81
Preferred Shares $235 -
Total Shareholders’ Equity ($52) $44
Total Capitalization $204 $144
33
(US$ millions)
Financial flexibility to exploit growth opportuniBes
(1) Aher giving effect to the offering and the reorganiza3on, assuming the midpoint of the marke3ng range and a US$ / C$ exchange rate of US$1 = C$1.2392 (2) Does not include debt expected to be incurred upon closing of the Cardinal acquisi3on, expected to close October 2015
STRONG FINANCIAL POSITION

INVESTMENT HIGHLIGHTS
34
Leading global children’s entertainment company with significant scale and reach
Diversified porAolio of innovaCve toys, games, products, brands and entertainment properCes
Global R&D network, with leading capabiliCes in advanced technologies and roboCcs
A proven and growing global entertainment property pipeline
Globally collaboraCve business model underpins performance record
Strong financial performance and operaCng leverage driving aJracCve earnings growth
Experienced and entrepreneurial management team

OFFERING SUMMARY
35
Offering • million Subordinate Vo8ng Shares plus 15% Over-‐Allotment Op8on
Price C$17.00 -‐ C$20.00 per Subordinate Vo8ng Share
Size Approximately C$220 million, before giving effect to the Over-‐Allotment Op8on
Shares Outstanding(1) Approximately 85.2 million Shares and RSUs outstanding prior to the offering
Use of Proceeds(2) US$133 million to repay Principal Shareholder Notes; US$22 million to sewle equity par8cipa8on arrangements; US$8 million to pay taxes on inter-‐company dividends; and for working capital and general corporate purposes
Offering Basis Public offering in Canada, 144A private placement in the U.S.
LisCng TSX: •
Eligibility Eligible for RRSPs, RESPs, RRIFs, RDSPs, TFSAs and DPSPs
Pricing Date Week of July 20, 2015
Closing Date Week of July 27, 2015
(1) Shares and RSUs outstanding prior to the offering shown following the reorganiza3on (2) Use of proceeds based on the midpoint of the marke3ng range and a US$ / C$ exchange rate of US$1 = C$1.2392

In accordance with Sec8on 13.7(4)(b) of Na8onal Instrument 41-‐101 -‐ General Prospectus Requirements, all the informa8on rela8ng to Spin Master Corp.’s comparables and any disclosure rela8ng to the comparables, which is contained in the presenta8on to be provided to poten8al investors, has been removed from this template version for purposes of filing on the System for Electronic Document Analysis and Retrieval (SEDAR).
COMPARABLE COMPANY ANALYSIS
36


