Study Designs for HealthStudy Designs for HealthProfessionalsProfessionals
Ashry Gad Mohamed, Ashry Gad Mohamed, MB.ChB, MPH, DrPHMB.ChB, MPH, DrPH
Professor of EpidemiologyProfessor of EpidemiologyCollege of Medicine & KKUHCollege of Medicine & KKUH

ObjectivesObjectives
At the end of the presentation each participant should be able to:
1-know main designs for biomedical researches.
2-Select the proper design for each research question.
3-list areas of strength and weakness of each design.
4-interpret the parameters of expression of study results.
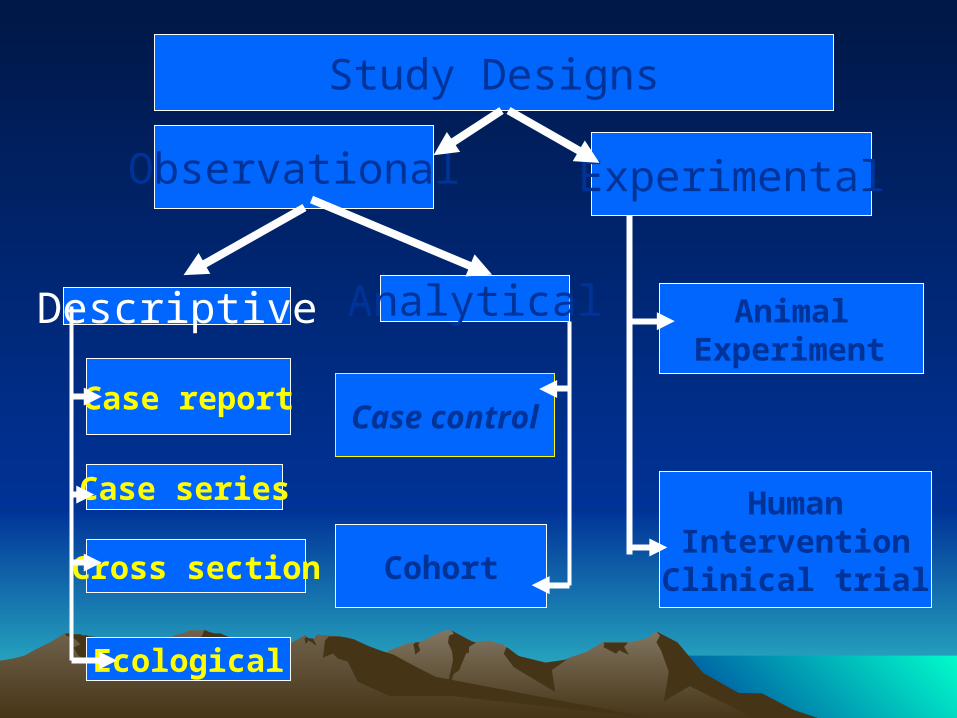
Descriptive Analytical
Case report
Case series
Cross section
Ecological
Case control
Cohort
Observational Experimental
Study Designs
Animal Experiment
HumanInterventionClinical trial

Case ReportCase Report
• Detailed presentation of a single case Generally report a new or unique finding
• Previous unknown disease
• Unexpected link between diseases
• Unexpected new therapeutic effect
• Adverse events

Case SeriesCase Series• Experience of a group of patients with a
similar diagnosis• Cases may be identified from a single
or multiple sources• Generally report on new/unique
condition• May be only realistic design for rare
disorders

Case SeriesCase Series
• Advantages• Useful for hypothesis generation• Informative for very rare diseases with few
established risk factors
• Disadvantages• Cannot study cause and effect
relationships• Cannot assess disease frequency

Cross-sectional StudyCross-sectional Study
• Data collected at a single point in time
• Describes associations
• Prevalence
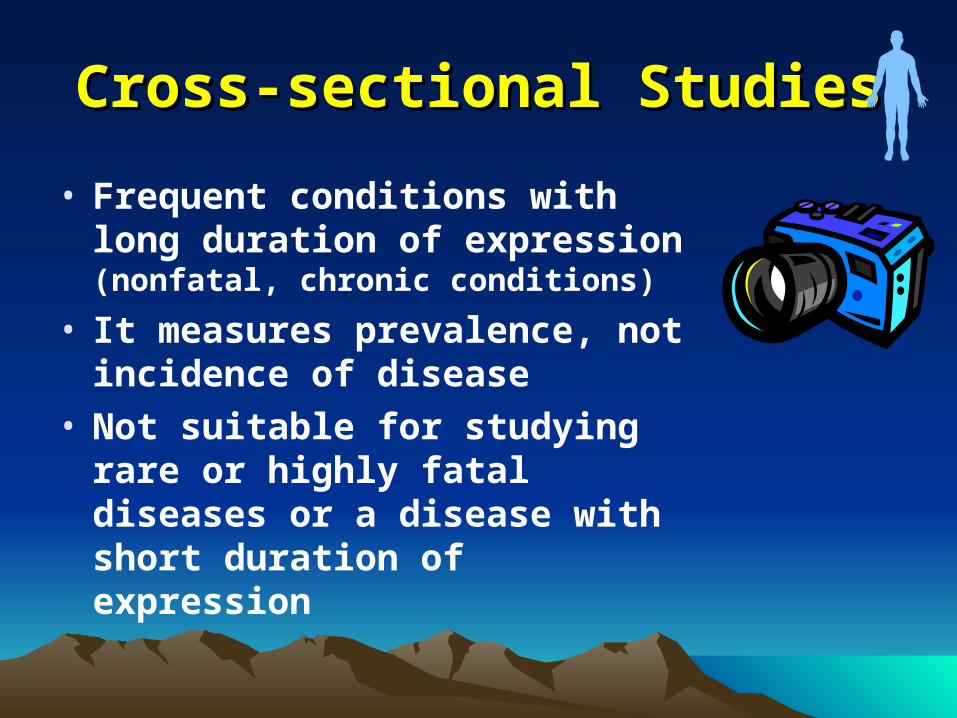
Cross-sectional StudiesCross-sectional Studies
• Frequent conditions with long duration of expression (nonfatal, chronic conditions)
• It measures prevalence, not incidence of disease
• Not suitable for studying rare or highly fatal diseases or a disease with short duration of expression

Prevalence vs. IncidencePrevalence vs. Incidence
• Prevalence
– The total number of cases at a point in time
– Includes both new and old cases
• Incidence– The number of new cases over time

Cross-sectional StudyCross-sectional Study
Sample of Population
Physically active life style
Sedentary life
style
Prevalence of IHD
Prevalence of IHD
Time Frame = Present
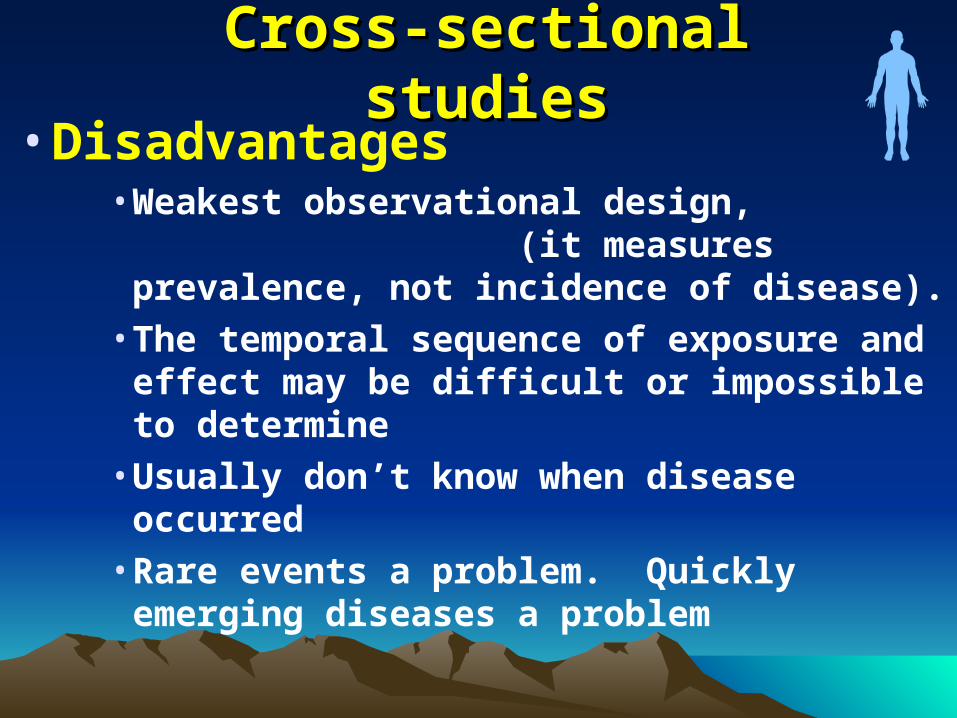
Cross-sectional studiesCross-sectional studies• Disadvantages
• Weakest observational design, (it measures prevalence, not incidence of disease).
• The temporal sequence of exposure and effect may be difficult or impossible to determine
• Usually don’t know when disease occurred• Rare events a problem. Quickly emerging
diseases a problem

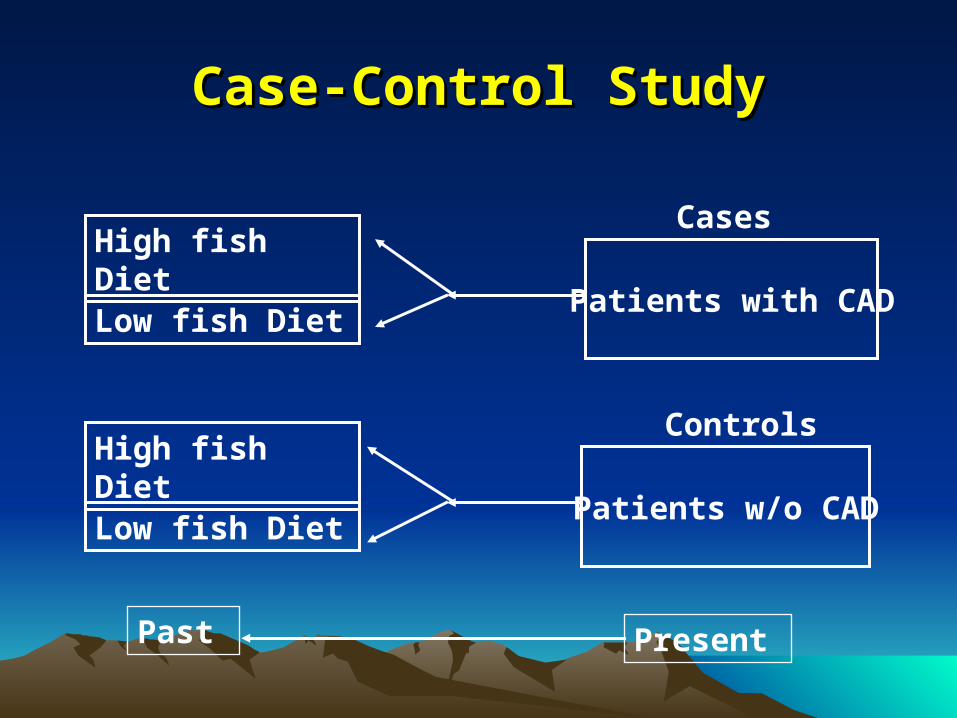
Case-Control StudyCase-Control Study
Patients with CAD
Patients w/o CAD
PresentPast
High fish Diet
High fish Diet
Low fish Diet
Low fish Diet
Cases
Controls

Case-Control Studies: Case-Control Studies: StrengthsStrengths
• Good for rare outcomes: cancer
• Can examine many exposures
• Useful to generate hypothesis
• Fast
• Cheap

Case-Control Studies: Case-Control Studies: WeaknessesWeaknesses
• Cannot measure– Incidence
– Prevalence
– Relative Risk
• Can only study one outcome
• High susceptibility to bias

Analysis of case control studyAnalysis of case control study
• Because population at risk is absent we can not calculate relative risk as it is based on incidence, however it can be estimated by means of odds ratio (OR) which is the ratio of odds of exposure among diseased to the odds of exposure among controls.
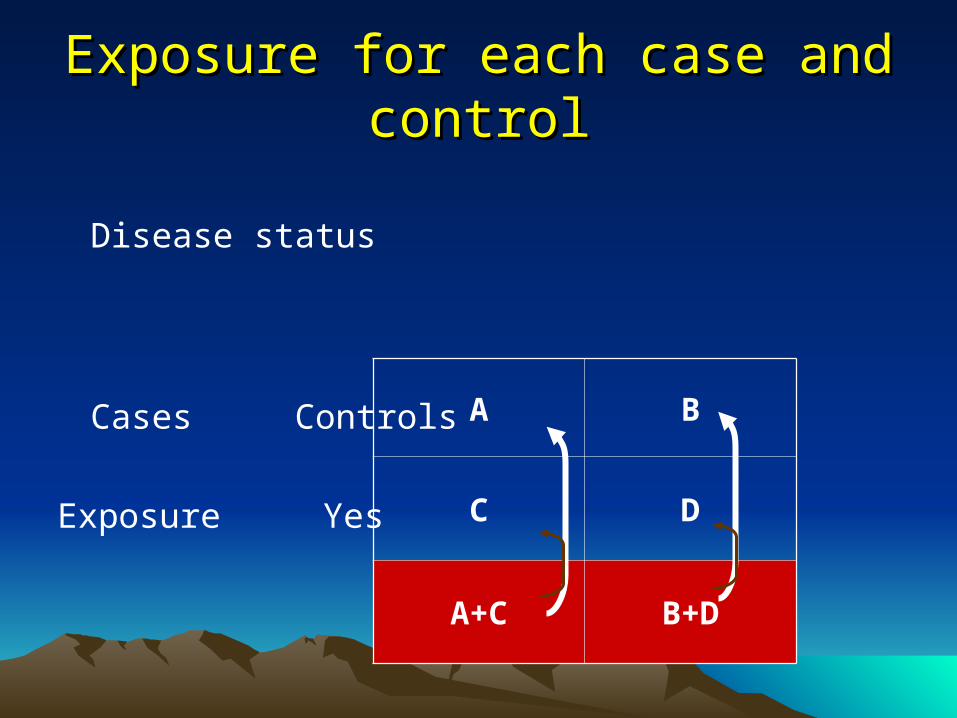
Exposure for each case and controlExposure for each case and control
Disease status
Cases Controls
Exposure Yes
NO
A B
C D
A+C B+D

• Calculating Odds (number exposed number unexposed)
Odds (Cases) = A/C
Odds (controls) = B/D
Odds Ratio = (A/C) / (B/D) = AD/BC

Disease Status
CHD
(Cases)
No CHD
(Controls)
88 224
112 176
200 400
Fish diet
No fish
Total
Odds Ratio=
AD
BC
= 176 X 88
112 X 224
= 0.62
Example


Cohort StudyCohort Study
• Begin with disease-free patients
• Classify patients as exposed/unexposed
• Record outcomes in both groups
• Compare outcomes using relative risk

Cohort Study: StrengthsCohort Study: Strengths
• Provides incidence data
• Establishes time sequence for causality
• Eliminates recall bias
• Allows for accurate measurement of exposure variables

Cohort Study: WeaknessesCohort Study: Weaknesses
• Exposure may change over time
• Disease may have a long pre-clinical
phase
• Attrition of study population

Measuring the effect of risk factorMeasuring the effect of risk factor
Relative RiskRelative Risk = (a/a+b) / (c/c+d) = (a/a+b) / (c/c+d)
Risk factor
Outcome Total
present absent
Present a b a +b
Absent c d c +d
Total a +c b+d N
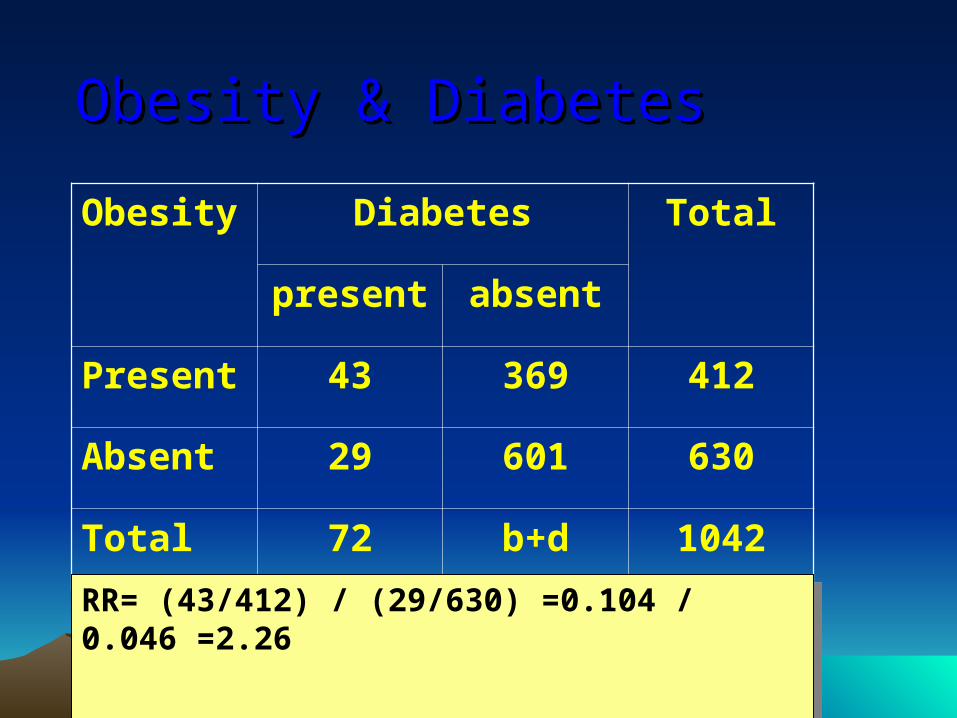
Obesity & DiabetesObesity & Diabetes
Obesity Diabetes Total
present absent
Present 43 369 412
Absent 29 601 630
Total 72 b+d 1042
RR= (43/412) / (29/630) =0.104 / 0.046 =2.26RR= (43/412) / (29/630) =0.104 / 0.046 =2.26

Clinical trialClinical trial

Definition
a planned experiment on humans.
The setting is in health institutions
environment. It usually involves
patients.
Rationale Before a new treatment method is made available to the public it must be studied
and tested for safety and effectiveness.

Clinical trials provide the “gold standard”
of determining the relationship between
garlic and cardiovascular disease
prevention.

Clinical TrialClinical Trial
Study sample
Treatment Group
Control Group
Outcomes
Outcomes
R a n d om i z e
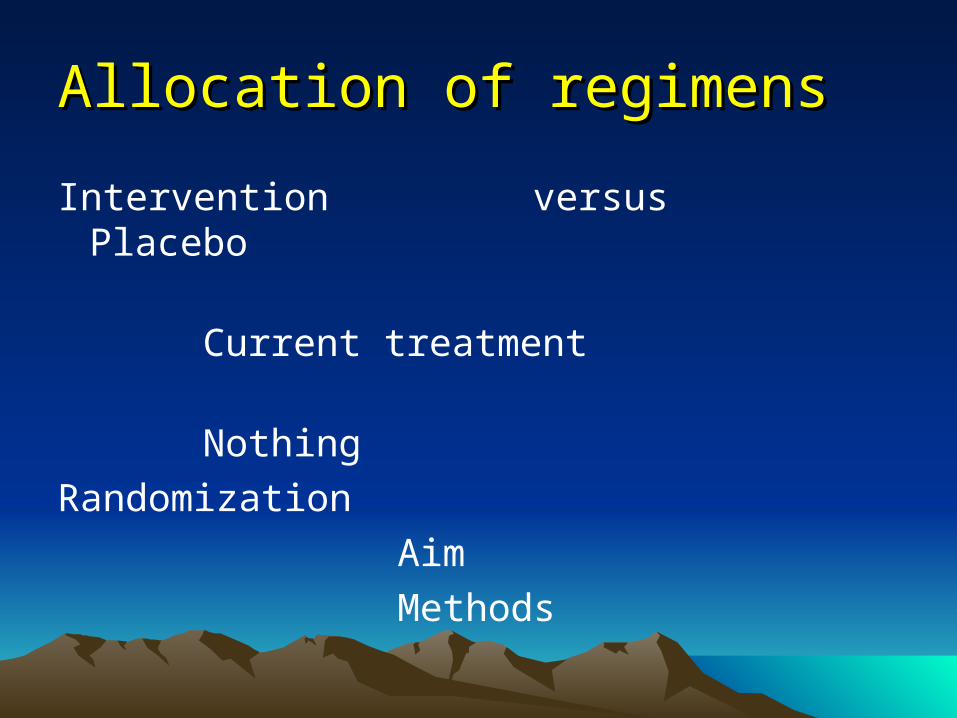
Allocation of regimensAllocation of regimens
Intervention versus Placebo
Current treatment
Nothing
Randomization
Aim
Methods
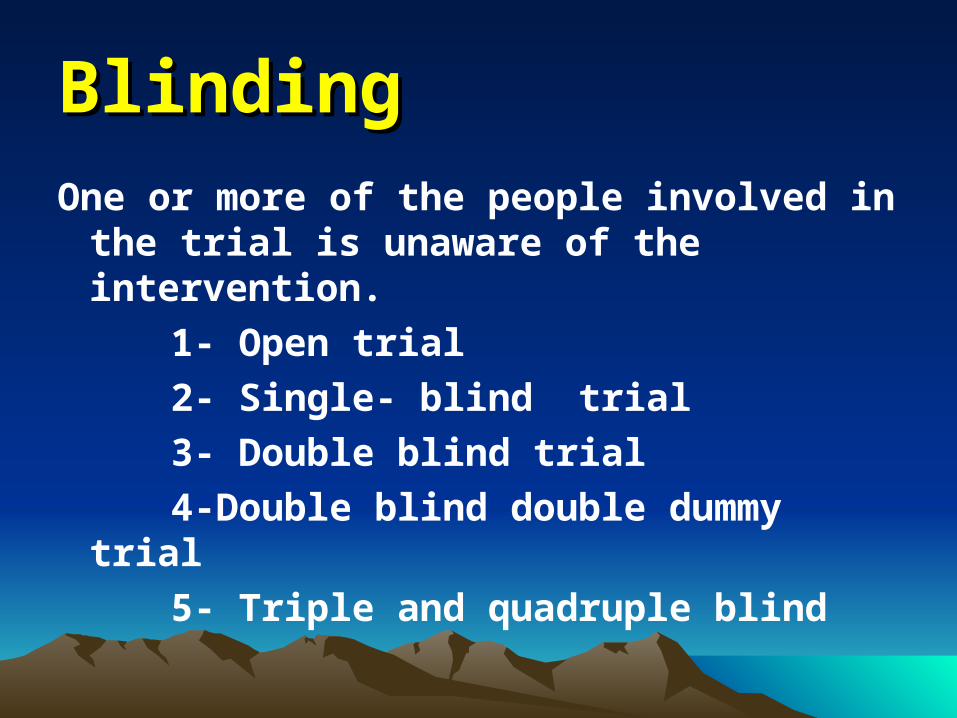
BlindingBlinding
One or more of the people involved in the trial is unaware of the intervention.
1- Open trial
2- Single- blind trial
3- Double blind trial
4-Double blind double dummy trial
5- Triple and quadruple blind

Follow up• Quantity
• Quality
• Compliance

AnalysisAnalysis
60 45
15
Intension to treat analysis.
15/ 60 =0.25 =25%
Protocol analysis.
15/45 = 0.33 =33%

Relative RiskRelative RiskGroup outcome Total
positive Negative
Intervention a b a +b
Control c d c +d

Measures of effect size 1-Relative risk (RR)
–Is the ratio of the risk of a given event in one group of subjects compared to another group
Experimental Event Rate (EER) ----------------------------------------------- Control Event Rate (CER )
EER: The percentage of intervention group who experienced outcome in question. ( a/(a + b))
CER: The percentage of control group who experienced outcome in question. (c /( c + d))
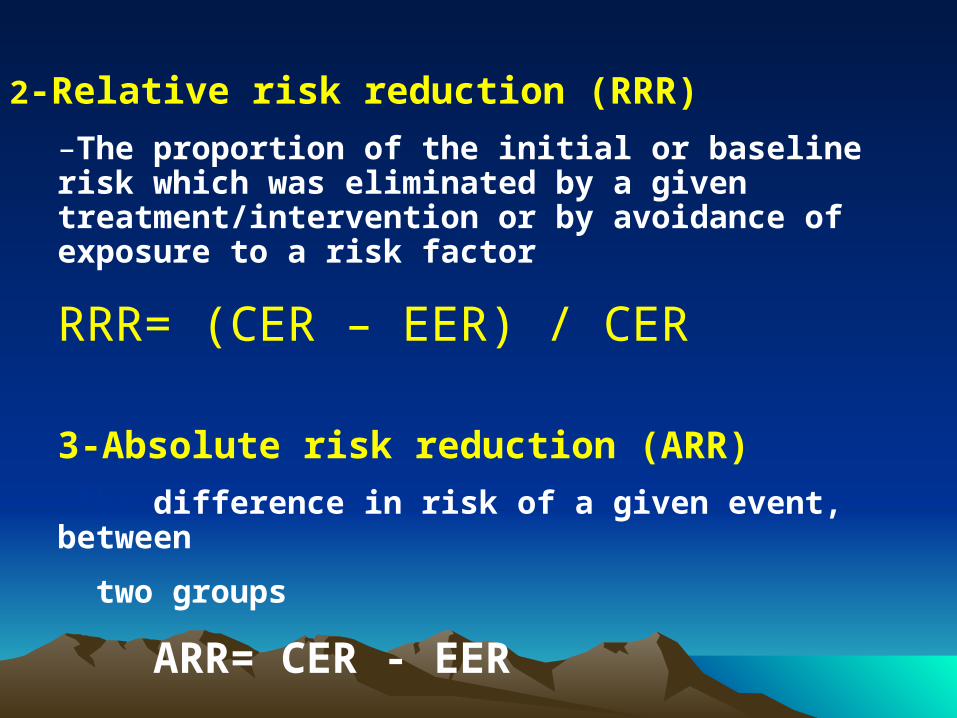
2-Relative risk reduction (RRR)
–The proportion of the initial or baseline risk which was eliminated by a given treatment/intervention or by avoidance of exposure to a risk factor
RRR= (CER – EER) / CER
3-Absolute risk reduction (ARR)
–The difference in risk of a given event, between
two groups
ARR= CER - EER

4-Number Needed to Treat (NNT)
It is defined as the number needed to treat in order to prevent one additional adverse event (e.g. death)
NNT = 1/ ARR
–Its clinical importance depends on Initial probability of the outcome.

RR=(18/64) / (29/65) = 0.281/0.446 =0.63 =63%RR=(18/64) / (29/65) = 0.281/0.446 =0.63 =63%
95% CI= 0.39 – 1.0195% CI= 0.39 – 1.01 Source: N Engl J Med 1992; 326: 1527-1532.Source: N Engl J Med 1992; 326: 1527-1532.
Intervention Outcome Total
Death survival
Ligation 18 46 64
sclerotherapy 29 36 65

22--Absolute Risk Reduction (ARR): Absolute Risk Reduction (ARR): ARR= CER - EERARR= CER - EER =(29/65) – (18/64) ==(29/65) – (18/64) =0.446 – 0.281 = 0.165 = 16.5%0.446 – 0.281 = 0.165 = 16.5% 3-Relative Risk Reduction (RRR) 3-Relative Risk Reduction (RRR)
RRR= (CER – EER) / CERRRR= (CER – EER) / CER =(0.446 – 0.281) / 0.446 =(0.446 – 0.281) / 0.446 =0.165 / 0.446 = 0.37 = 37% =0.165 / 0.446 = 0.37 = 37% i.e. Legation decreases the risk i.e. Legation decreases the risk of death by 37% of death by 37%

4-N4-Number Needed to Treat (NNT):umber Needed to Treat (NNT):
NNT = 1/ ARRNNT = 1/ ARR = 1 / 0.165 = 1 / 0.165 = 6.06 = 6.06 =6 patients =6 patients You have to treat 6 patients by ligation to You have to treat 6 patients by ligation to save one life save one life

Ethical issues
• Informed consent
• Confidentiality
• Stopping rules
Independent monitoring group
Clear existence of benefits
Clear existence of harm

Clinical TrialsClinical Trials
Strengths:– Best measure of causal relationship– Best design for controlling bias– Can measure multiple outcomes
Weaknesses:– High cost– Ethical issues may be a problem– Compliance

What is the best study design?What is the best study design?
• A young patient who had ventricular tachycardia after an sports activity
• Hypersensitivity reactions associated with exposure to naproxen and ibuprofen.

• Thromboembolic Stroke in Young Women and use of oral Contraceptives.
• Exposure to benzene and non-Hodgkin lymphoma.

• SCH 503034, a novel hepatitis C virus protease inhibitor, plus pegylated interferon alpha-2b for genotype 1 nonresponders.
• Risk factors among young women with endometrial cancer.
• The annual incidence and course of neck pain in the general population.
• The prevalence of pressure ulcers in hospitalised patients in The Netherlands.

• Strangulated hernia with ileal perforation due to abdominal trauma in a paediatric patient.
• Valsartan in a Japanese population with hypertension and other cardiovascular disease.

• The effects of rosiglitazone on echocardiographic function and cardiac status in type 2 diabetic patients with functional Class I or II Heart Failure.
• lymphoblastoid interferon-α for chronic hepatitis C.
• Efficacy of interferon-gamma1b in chronic hepatitis C patients with advanced fibrosis or cirrhosis.