
The Impact of Forest Certification on Firm
Financial Performance in Canada and the U.S.
By Kais Bouslah, Bouchra M’Zali, Marie-France Turcotte and Maher Kooli
Les Cahier de la CRSDD – collection recherche No 06- 2009
Kais Bouslah is a Ph.D. candidate (Finance), École des sciences de la gestion (ESG), Université du Québec à Montréal (UQAM). E-mail: [email protected] Bouchra M’Zali is a professor of finance, École des sciences de la gestion (ESG), Université du Québec à Montréal (UQAM). E-mail: [email protected].
Marie-France Turcotte is a professor of strategy and corporate social and environmental responsibility, École des sciences de la gestion (ESG), Université du Québec à Montréal (UQAM). E-mail: [email protected]
Maher Kooli is a professor of finance, École des sciences de la gestion (ESG), Université du Québec à Montréal (UQAM). E-mail: [email protected]
Support for this research from the Social Sciences and Humanities Research Council of Canada is gratefully acknowledged. We would like to thank Guy Charest and Raymond Theoret for their helpful comments.
Les cahiers de la CRSDD Collection recherche • No 06-2009
The Impact of Forest Certification on Firm Financial Performance in Canada and the U.S.
By Kais Bouslah, Bouchra M’Zali, Marie-France Turcotte and Maher Kooli
ISBN 978-2-923324-96-8 Dépôt Légal - Bibliothèque et Archives nationales du Québec, 2009
École des sciences de la gestion Université du Québec à Montréal Case postale 8888, Succursale Centre-Ville Montréal (Québec) H3C 3P8 Canada www.crsdd.uqam.ca
i
Abstract The purpose of this paper is to examine empirically the impact of environmental certification on firm financial performance. The main question is whether there is a “green premium” for certified firms and, if so, for what kind of certification. We analyze the short-run and the long-run stock price performance using an event-study methodology on a sample of Canadian and U.S. firms.
The results of short-run event abnormal returns indicate that forest certification do not have any significant impact on firm financial performance regardless of the certification system carried out by firms. Unlike the short-run results, the long-run post-event abnormal returns suggest that forest certification has, on average, a negative impact on firm financial performance. However, the impact of forest certification on firm financial performance depends on who grants the certification since only industry-led certification [Sustainable Forestry Initiative (SFI), Canadian Standards Association (CSA) and ISO14001] are penalized by financial markets, whereas NGOs-led Forest Stewardship Council (FSC) certification is not.
Key words: Abnormal Returns, Buy-and-Hold Abnormal Returns (BHAR), Cumulative Abnormal Returns (CAR), Environmental Performance, Event Study, Financial Performance, Forest Certification.
ii
Abbreviations AF&PA American Forest and Paper Association ADR American Depositary Receipts AR Abnormal return BHAR Buy-and-hold abnormal return BVC Bureau Veritas Certification CAR Cumulative abnormal return CD Certification announcement date CEP Council on Economic Priorities COC Chain of Custody CSA Canadian Standards Association CSR Corporate social responsibility EP Environmental performance FP Financial performance FSC Forest Stewardship Council ISO International Organization of Standardization KPMG KPMG Forest Certification Services Inc NGO Nongovernmental organizations PEFC Programme for the Endorsement of Forest
Certification Schemes PWC PricewaterhouseCoopers LLP QMI Quality Management Institute SFI Sustainable Forestry Initiative SCS Scientific Certification Systems SGS SGS Systems & Services Certification SIC Standard Industrial Classification SP Social performance SW SmartWood, Rainforest Alliance TRI Toxics Release Inventory UNCED United Nations Conference in Environment and
Development UNEP United Nation Environment Program WWF World Wide Fund of Nature
Table of contents Introduction _______________________________________ 1 Forest certification: definition and typology _____________ 5 Relationship between environmental performance and financial performance ______________________________ 10
Theoretical relationship ____________________________ 10 Empirical relationship ______________________________ 13
Research hypotheses ______________________________ 16 Data _____________________________________________ 19 Methodology ______________________________________ 23
The control firm approach __________________________ 23 Calculation of short-run abnormal returns ______________ 24 Calculation of long-run abnormal returns _______________ 25
Cumulative Abnormal Return (CAR) approach ________ 25 Buy-and-Hold Abnormal Return (BHAR) approach _____ 26
Statistical tests for abnormal stock returns _____________ 27 Methodological issues _____________________________ 29
Results and Analysis _______________________________ 32 Short-run event returns ____________________________ 32 Long-run event returns _____________________________ 36
Conclusion _______________________________________ 47 References _______________________________________ 49
Table of tables Table 1 - Typology of Forest Certification Programs ___________ 7
Table 2 - Typology of possible relationship between social performance and financial performance ____________________ 11
Table 3 - Sample distribution of third-party certification events by year and certification system ____________________________ 21
Table 4 - Sample distribution by industry and size ___________ 22
Table 5 - Cumulative Abnormal Return (CAR) for third- announcement dates __________________________________ 34
Table 6 - Cumulative Abnormal Return (CAR) for third-party certified firms surrounding the certification announcement date _ 38
Table 7 - Buy and Hold Abnormal Return (BHAR) for third-party certified firms over 36 months following the certification announcement month _________________________________ 42
1
Introduction Since the early 1990s, private organizations including transnational and domestic nongovernmental organizations (NGOs) as well as industry associations contributed to the creation of social and environmental standards and certification schemes. These standards have been described as non-state market-driven governance systems (Cashore, 2002), and it has been argued that they embody a new model for global corporate governance in which the civil society, i.e., NGOs, play an important role (Gereffi et al., 2001; Cashore, 2002). Although they are generally presented as a voluntary mechanism, these standards are often adopted by companies as a result of pressures from some or a coalition of stakeholders (Turcotte et al., 2007), such as environmental NGOs, distributors, clients, and investors.
Many individual and institutional investors concerned about the impacts of firms’ activities on environment, community and the society as a whole integrate social and environmental criteria into their financial performance objectives.1 For these investors with ethical, social or environmental concerns, collecting relevant information and assessing firms’ performance in these domains presents several challenges, including the lack of information (Turcotte and M’Zali, 2004). Indeed, the question of how to assess social or environmental performance also raises the question of the sources of information used in this evaluation (Turcotte and M’Zali, 2004). By adopting social or environmental certification, firms might signal their engagements to meet stakeholder’s expectations. Certification systems have the potential to be an informational tool for consumers and investors and therefore, might become a social performance indicator and a proxy for the environmental performance.
Most existing studies on forest certification examine the willingness of consumers to pay a premium for environmentally
1 Social Investment Organization (SIO), Canadian Socially Responsible Investment Review 2006. www.socialinvestment.ca.
The Impact of Forest Certification on Firm Financial Performance in Canada and the U.S.
2
certified wood products (see e.g., Ozanne and Volsky, 1997; Stevens et al., 1998; Anderson and Hansen, 2004) or the impact of certification programs on environmental performance (see e.g., Barla, 20072). In addition to this literature, there is an unresolved debate about the relationship between social performance and financial performance (Preston and O’Bannon, 1997; Griffin and Mahon, 1997; Roman et al., 1999; Margolis and Walsh, 2003; Orlitsky et al., 2003). This relationship has been a long time studied in the academic literature, however with mixed results. On one hand, these studies use different measures of financial, environmental and social performance. On the other hand, most of these studies are cross-sectional studies based on samples of firms from multiple industries, i.e., they implicitly assume that social or environmental issues are the same among industries. Focusing on one industry in Canada and the United States, forest and paper industry, the aim of this study is to analyze the relationship between the financial performance and a signal of the environmental performance: forest certification.
Forest certification programs recognize officially those companies and landowners who voluntarily operate “well managed” or “sustainable” forestland according to predefined criteria (Cashore, 2002, p. 505). Since the Earth Summit on sustainable development (UNCED3, 1992), several forest certification programs were established in Canada and the United States: Forest Stewardship Council (FSC), Canadian Standards Association (CSA) program, Sustainable Forestry Initiative (SFI) and the International Standards Organisation (ISO14001) program. The FSC program is widely supported by environmental groups, and by NGOs (Gereffi et al., 2001; Cashore, 2002). The SFI and CSA programs are considered industry-oriented certification. ISO14001 is generally considered apart from this
2 Barla (2007) finds that ISO14001 certification does not significantly impact environmental performance (as measured by total suspended solids or total quantity of rejected process water) of certified plants in Quebec’s pulp and paper industry over the 1997–2003 period. 3 United Nations Conference in Environment and Development.
K. Bouslah, B. M'Zali, M.-F. Turcotte et M. Kooli
3
traditional separation. As such, we are interested in examining whether certification does significantly impact the firm financial performance and whether or not investors evaluate differently certification programs.
The objectives of this paper is to analyze first the certifications in order to propose a typology, and then to examine the financial impact of certification in the short and long-run. Specifically, our study has three main objectives. The first objective is to identify some criteria to be able to distinguish between forest certifications and to propose a typology. The second objective is the short-run market reaction examination around the dates of forest certifications announcements to every type of forest certification. The last objective is the long-run market reaction examination to every type of forest certification.
Forest certification is used as a signal sent by firms in order to inform financial markets that their divisions, products and/or forests have been certified by a third-party expert team. By analyzing the market reactions to these signals, we are able to see whether or not financial markets react to good environmental performance. Assuming that certified firms have a good environmental performance relative to non certified firms, the main question is whether there is a “green premium” for certified firms. Although, adopting certification does increase costs,4 these might be offset by increased revenues, better reputation and better relationship with stakeholders, and thus providing a
4 Certification programs have several benefits, but also some limitations (Haener and Luckert, 1998). Benefits of certification are: access to new markets and secured position in existing markets, better relationship with stakeholders (credibility and legitimacy), higher sales (premium for certified products) and better reputation (“green reputation”). The major limitations of certification are its direct costs (initial certification, subsequent audit) and indirect costs (management planning, alteration of operations to comply with certification standards and requirements, modification of management practices, training and education of employees, identifying and tracking the chain of custody, finding markets for certified products).
The Impact of Forest Certification on Firm Financial Performance in Canada and the U.S.
4
competitive advantage for certified firms. Based on this argument, certified firms would be rewarded, whereas non certified firms would experience a loss of wealth for their shareholders that may exceed those costs.
The main results are as follows. Based on five criteria, we propose a typology of forest certification which may affect the market perception and reaction: certification led by NGOs and certification led by industry. The results of short-run event abnormal returns indicate that forest certification do not have any significant impact on firm financial performance regardless of the certification system carried out by firms. Unlike the short-run results, the long-run post-event abnormal returns suggest that forest certification has, on average, a negative impact on firm financial performance. However, the impact of forest certification on firm financial performance depends on who grants the certification since only industry-led certification (SFI, CSA and ISO14001) are penalized by financial markets, whereas NGOs-led FSC certification is not.
The paper proceeds as follows. The first section proposes a typology of certification programs used in Canada and the United States. The second section summarizes the relevant literature that investigated the relationship between corporate social/environmental performance and financial performance, as well as the theoretical framework and research hypotheses. Then, we describe the data set and their sources in the third section, and discuss the statistical estimation procedures used in the tests in the fourth section. In the fifth section we present the empirical results and their interpretation. In the final section of the article, we explore some implications for investors and managers, and we make some proposals for future empirical research.
5
Forest certification: definition and typology During the past thirty years, environmental concerns about global forest destruction, the impact of deforestation, clear-cutting, loss of biodiversity and the pollution from pulp and paper mills evolved to a higher level of environmental awareness. To force upward firm-level environmental protection, environmental NGOs of developed countries have used firstly market-based boycott campaigns. Forest certification emerged in the 1990s as an innovative market-based alternative and sometimes to complement corporate campaigns also using other strategies such as boycott (Cashore, 2002). The certification of forest management practices has emerged as one possible policy instrument for helping to attain sustainable forest management and to communicate environmental information to consumers about the forest resources (Stevens et al., 1998). “A trustworthy person who understands proper forest management visits the forests and assesses the work of the people who manage it and certifies to others that things are being done correctly” (Meidinger et al., 2003, p. 4).
According to Meidinger et al. (2003), the key elements of forest certification programs are standard setting and implementation (i.e., verification/audit/monitoring, accreditation of the certifier, labelling). The steps of the verification process differ by certification program, but the process generally involves: preliminary discussion, field verification, verification report and follow-up audits.
There are two basic types of certification in the forest and paper industry: “Forest Management” and “Chain-of-Custody” certifications. The “Chain-of-Custody” certification traces the amount of certified wood in a product from the forest floor to the consumer shelf (Gereffi et al., 2001). Firms meeting the chain-of-custody requirements are allowed to display “label” or “logo” on their certified products.
In 1993, powerful NGOs such as the World Wide Fund of Nature (WWF) and Greenpeace helped create the Forest Stewardship
The Impact of Forest Certification on Firm Financial Performance in Canada and the U.S.
6
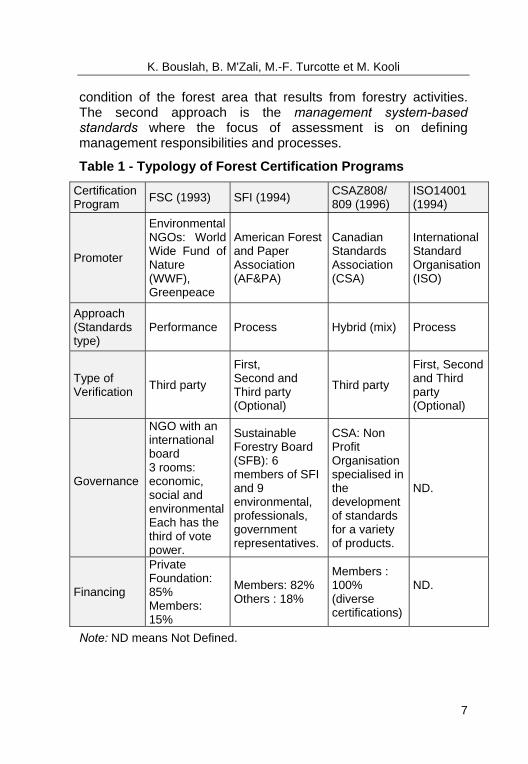
Council (FSC) as an international non-governmental, non profit, multi-stakeholder certification program (Meidinger et al., 2003). The FSC has developed a set of standards (principles) and detailed criteria that are performance-based and broad in scope (economic, social and environmental). Arguing that the FSC standards are onerous and unwieldy, the forestry industry in Canada, the U.S, and Europe quickly matched the FSC by their own certification programs for appropriate forestry practices (Gereffi et al., 2001). In 1994, the American Forest and Paper Association (AF&PA) in the U.S. has developed the Sustainable Forestry Initiative (SFI), partly in response to the growth of the FSC (Meidinger et al., 2003). In Canada, the FSC competitor is the Canadian Standards Association (CSA) program established in 1996. Also, the International Organization for Standardization (ISO) has developed the environmental management standards ISO14001 in 1994. ISO14001 is a global environmental certification available to all industries, including the forestry industry. The FSC, SFI, CSA and ISO14001 are the four certification programs examined in this study. Table I describes their characteristics.
These four certifications differ in terms of which kind of actors initiated them, what standards they promote, what verification process they use, and what governance structure and financing they have. SFI and CSA programs operate under different conception of governance from that of the FSC program (Cashore, 2002). Under the FSC program, environmental and social groups have an important role in the development of standards and firms cannot dominate the rule-making. In contrast, firms and forest landowners have the dominant role in the SFI and CSA programs regarding who makes the rules. For the environmental groups (e.g., WWF, Greenpeace), the FSC is the only credible certification program (Gereffi et al., 2001).
Certifications programs use two fundamental approaches to evaluation (Haener and Luckert, 1998). The first approach is the performance-based standards, also called product or outcome approach, where the focus of assessment is the forest resource itself. This approach focuses on variables that reflect the
K. Bouslah, B. M'Zali, M.-F. Turcotte et M. Kooli
7
condition of the forest area that results from forestry activities. The second approach is the management system-based standards where the focus of assessment is on defining management responsibilities and processes.
Table 1 - Typology of Forest Certification Programs
Certification Program FSC (1993) SFI (1994) CSAZ808/
809 (1996) ISO14001 (1994)
Promoter
Environmental NGOs: World Wide Fund of Nature (WWF), Greenpeace
American Forest and Paper Association (AF&PA)
Canadian Standards Association (CSA)
International Standard Organisation (ISO)
Approach (Standards type)
Performance Process Hybrid (mix) Process
Type of Verification Third party
First, Second and Third party (Optional)
Third party
First, Second and Third party (Optional)
Governance
NGO with an international board 3 rooms: economic, social and environmentalEach has the third of vote power.
Sustainable Forestry Board (SFB): 6 members of SFI and 9 environmental, professionals, government representatives.
CSA: Non Profit Organisation specialised in the development of standards for a variety of products.
ND.
Financing
Private Foundation: 85% Members: 15%
Members: 82% Others : 18%
Members : 100% (diverse certifications)
ND.
Note: ND means Not Defined.
The Impact of Forest Certification on Firm Financial Performance in Canada and the U.S.
8
The firm is evaluated based on objectives, planning, quality control measures, record keeping, training and education of employees. This approach focuses on management practices rather than the actual results of these practices (continuous improvement). Although most programs are a combination of these approaches, the FSC program emphasizes the performance-based approach, SFI program emphasizes the management system-based approach and the CSA program emphasizes both approaches. ISO14001 is only a management system-based approach.
As noted earlier, certification program have two key components: a set of rules, principles or standards and a monitoring or verification mechanism (usually an audit). The credibility of the certification program depends heavily on the type of verification. Verification is important because it provides a validation necessary for legitimacy to occur and to distinguish products to be consumed in the marketplace (Cashore, 2002). Therefore, according to who produces the standards and conducts the monitoring, certification can take three basic forms: 1/ First-party certification is an internal assessment by the firm of its own systems and practices (“self-regulation” since the firm develops its own rules and report on compliance); 2/ Second-party certification is an assessment by a customer or a trade association/organization representing the industry to which the firm belongs; 3/ Third-party certification is an assessment by an independent (neutral/external) organization. The third-party audits are conducted by accredited certifiers (e.g., BVC, KPMG, PWC, QMI, SW, SCS and SGS5). Third-party certifiers in the FSC system are directly accredited by the FSC, whereas in the SFI, CSA and ISO14001, they are accredited by national accreditation
5 Bureau Veritas Certification (BVC), KPMG Forest Certification Services Inc (KPMG), PricewaterhouseCoopers LLP (PWC), Quality Management Institute (QMI), SmartWood, Rainforest Alliance (SW), Scientific Certification Systems (SCS), SGS Systems & Services Certification (SGS).
K. Bouslah, B. M'Zali, M.-F. Turcotte et M. Kooli
9
organizations such as the American National Standards Institute in the U.S.
Third-party certification is required in the FSC and CSA programs, whereas it is optional in the SFI and ISO14001 programs. The inherent conflicts of interest give little credibility to the first and second-party certifications. Environmental NGOs consider that third-party certification is the most credible because the firm voluntarily asks an independent certifier to assess their forest operations and practices according to a set of accepted standards. Third-party certification can be compared to the independent accounting audit that all public firms must undergo each year.
10
Relationship between environmental performance and financial performance
Theoretical relationship
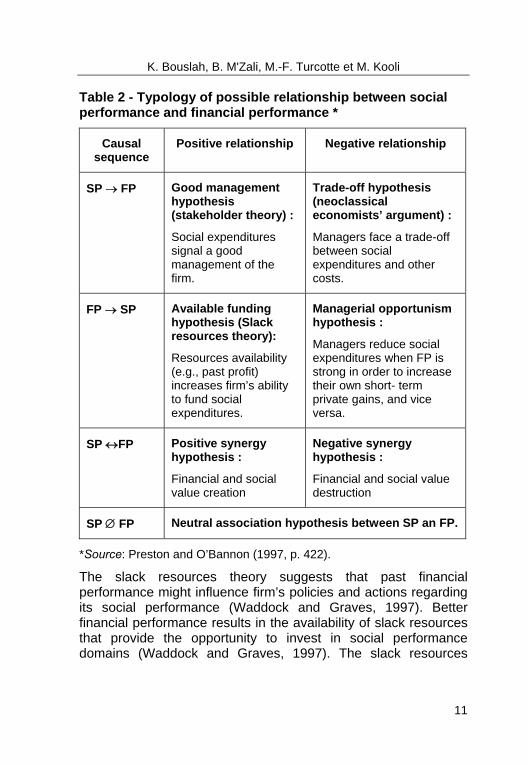
The literature on social responsibility highlights three theoretical arguments that might explain the nature of the relationship between social performance (SP) and financial performance (FP). These arguments support a positive, negative and neutral association between SP and FP. More specifically, the relationship between SP and FP involves two empirical issues (Preston and O’Bannon, 1997): 1/ the sign of the relationship (positive, negative or neutral), 2/ the causal relationship involved.6 The combination of these two issues yields the possible hypotheses that characterize the relationship between SP and FP. Table II summarizes these theoretical hypotheses.
Different theoretical arguments supporting a positive relationship between SP and FP coexist. The stakeholder theory (McGuire et al., 1988; Waddock and Graves, 1997) argues that the value of a firm depends not only on the costs of explicit claims (e.g., stockholders and bondholders) but also on the costs of implicit claims (e.g., product quality, environmental costs). Socially responsible firms would have lower costs of implicit claims than other firms and thus a higher financial performance. The stakeholder theory predicts that a socially responsible firm might, after a certain period of time, improve its FP and reduce its financial and accounting risks (McGuire et al., 1988).
6 For detailed discussion on these two issues, see Preston and O’Bannon (1997), and Moore (Moore, 2001).
K. Bouslah, B. M'Zali, M.-F. Turcotte et M. Kooli
11
Table 2 - Typology of possible relationship between social performance and financial performance *
Causal sequence
Positive relationship Negative relationship
SP → FP Good management hypothesis (stakeholder theory) :
Social expenditures signal a good management of the firm.
Trade-off hypothesis (neoclassical economists’ argument) :
Managers face a trade-off between social expenditures and other costs.
FP → SP Available funding hypothesis (Slack resources theory):
Resources availability (e.g., past profit) increases firm’s ability to fund social expenditures.
Managerial opportunism hypothesis :
Managers reduce social expenditures when FP is strong in order to increase their own short- term private gains, and vice versa.
SP ↔FP Positive synergy hypothesis :
Financial and social value creation
Negative synergy hypothesis :
Financial and social value destruction
SP ∅ FP Neutral association hypothesis between SP an FP.
*Source: Preston and O’Bannon (1997, p. 422).
The slack resources theory suggests that past financial performance might influence firm’s policies and actions regarding its social performance (Waddock and Graves, 1997). Better financial performance results in the availability of slack resources that provide the opportunity to invest in social performance domains (Waddock and Graves, 1997). The slack resources
The Impact of Forest Certification on Firm Financial Performance in Canada and the U.S.
12
theory suggests that financial performance is a good predictor of social performance. In other words, firms with higher past financial performance are more willing to undertake certification and vice versa.
The argument of a negative relationship between SP and FP suggest that managers face a tradeoff between SP and FP (Vance, 1975; Aupperle et al., 1985; Ullmann, 1985). Proponents of this argument have argued that higher social performance results in additional costs that put the firm at a competitive disadvantage and reduce their strategic alternatives compared to other less socially responsible firms (McGuire et al., 1988), because a socially responsible firm is incurring costs that can be avoided or should be assumed by other actors such as government (Waddock and Graves, 1997). The decision to undertake certification when other competitors do not is an example of action that might be a financial burden for environmentally responsible firms. According to this neoclassical economists’ argument, there are costs associated to socially responsible actions (e.g., certification costs) which reduce profits and thus shareholders wealth.
The “managerial opportunism hypothesis” is another possible explanation for a negative relationship between SP and FP (Preston and O’Bannon, 1997). Since managers compensations are related to short-term profit and stock price behaviour, managers may pursue their own objectives (self-interest behaviour). For example, when FP is strong, managers may reduce expenditures in SP domains (e.g., do not undertake the certification) in order to increase their own compensation by increasing short-term profit. When FP is weak, managers may increase expenditures in SP domains in order to justify their disappointing results.
Finally, another theoretical argument suggests that there is simply no relationship between SP and FP. Although the costs of improving SP can be significant, other costs are reduced or revenues are increased (McGuire et al., 1988; Klassen and McLaughlin, 1996). Moreover, measurement problem of SP and
K. Bouslah, B. M'Zali, M.-F. Turcotte et M. Kooli
13
omitted variables may mask any relationship that exists (Waddock and Graves, 1997). Ullmann (1985) argues that there is no reason to expect the existence of a relationship, except by chance, because there are many intervening variables between SP and FP. In the same vein, McWilliams and Siegel (2001) use a supply and demand model of corporate social responsibility (CSR) and assume that managers maximize shareholder wealth. They show conceptually that there is a level of CSR investment which can be determined by a cost-benefit analysis that maximizes profit. Based on their model, they conclude that in equilibrium there should be no relationship between measures of social performance and financial performance.
Social performance (SP) is a multidimensional construct which includes, among other things, environmental performance (EP) (Waddock and Graves, 1997; Carroll, 1999, 2000). Thus, EP is only one element of SP. An important question arises is that whether the theoretical analysis presented above can be applied equally for both SP and EP. In other words, what is the precise quantification of the relationship between SP and one of its components, namely EP? This might be an important topic for future research. In particular, environmental issues have becoming increasingly important in recent years, perhaps more than the other components of SP.
Empirical relationship
Unfortunately, the empirical studies do not help to accept one of those theories. During the past three decades, numerous studies7 have examined the empirical relationship between SP and FP. The results of these studies are mixed and inconclusive, reporting positive (Shane and Spicer, 1983; Cochran and Wood, 1984; Preston and O’Bannon, 1997; Waddock and Graves, 1997), 7 There are basically three types of empirical studies of the relationship between SP and FP. The first set of studies uses correlation and regression analysis, the second set uses the event study methodology, and the third set analyses socially and/or environmental portfolios (or mutual funds) performance.
The Impact of Forest Certification on Firm Financial Performance in Canada and the U.S.
14
negative (Holman et al., 1990, Wright and Ferris, 1997), and neutral association (Aupperle et al., 1985; Teoh et al., 1999; McWilliams and Siegel, 2000) between SP and FP. To date, no definitive consensus exists regarding the empirical relationship between SP and FP. The relation, if any, between SP and FP has not been fully established (Griffin and Mahon, 1997; Preston and O’Bannon, 1997). “Some of the reasons for these contradictory results stem from conceptual, operationalization, and methodological differences in the definitions of social and financial performance.” (Griffin and Mahon, 1997, p. 7)
Three major factors might explain divergences in results of empirical studies of the relationship between SP and FP (Griffin and Mahon, 1997): 1/ a large part of previous evidences are cross-sectional studies based on samples composed of firms from multiple industries, 2/ different measures of financial performance, 3/ the measurement problem of social performance.
At various points in time, numerous reviews of previous studies have been carried out. They are narrative reviews (Ullmann, 1985; Pava and Krausz, 1996), “vote counting” technique8 (Griffin and Mahon, 1997; Roman et al., 1999; Margolis and Walsh, 2003) and meta-analytic reviews (Frooman, 1997; Orlitsky and Benjamin, 2001; Orlitsky et al., 2003). Although previous research on the topic has resulted in contradictory conclusions, the largest number of studies reviewed report a positive association between SP and FP. For example, Roman et al. (1999) reviewed the work of Griffin and Mahon (1997) and conclude that the evidence indicates a positive association between SP and FP. Similarly, Orlitsky et al. (2003) conduct a meta-analysis of 52 studies after correcting for sampling and measurement errors and find a positive correlation between SP and FP.
8 The “vote counting” technique refers to the cumulation of significance levels, or simply, to the tabulation of significant and non significant findings.
K. Bouslah, B. M'Zali, M.-F. Turcotte et M. Kooli
15
Some empirical studies analyzed specifically the relationship between EP and FP.9 Shane and Spicer (1983) find that poor external ratings of pollution performance published by the Council on Economic Priorities (CEP) had a significant negative impact on a firm’s stock price. Similarly, Hamilton (1995) finds significant negative abnormal returns following the announcement of higher level of toxic emissions. Klassen and McLaughlin (1996) found a positive average cumulative abnormal return of 0.82% following positive environmental events for a sample of 96 firms, and a negative average cumulative abnormal return of 1.5% following negative environmental events for a sample of 16 firms. White (1996) examine returns following an environmental disaster (Exxon Valdez) and shows that firms having higher environmental management practices experience higher returns relative to firms having poor environmental management practices. Finally, Stanwick and Stanwick (1998) perform a correlation and regression analysis and show that firm size (annual sales), financial performance (profits/sales) and environmental performance (based on EPA Toxic Release Inventory report) do impact the level of corporate social performance (Fortune reputation index).
In summary, the relationship between SP and FP or EP and FP has been a long time studied, however with mixed results. One fundamental reason for the uncertainty about the nature of this relationship is the problem of measuring SP or EP. Nonetheless, previous results about the specific relationship between EP and FP suggest a positive association between these two constructs. Focusing on one industry and choosing one measure of EP, the certification, we will analyze the relationship between FP and EP.
9 To measure EP, previous empirical studies have often used pollution emission level (TRI), investment level in environmental management system, information produced outside the firm (Council on Economic Priorities or CEP reports) or inside the firm (annuals reports).
16
Research hypotheses The aims of this study is to propose a typology of forest certifications and to verify if any relationship exists in the short and long-run between the financial performance and this signal of “good environmental performance”: the certification announcement. More specifically, the financial impacts of certification announcements are analyzed by types of certification, trying to verify if the market reaction depends on who grants the forest certification. Forest certification could be an uncomplicated decision tool on which investor can focus when evaluating a firm. Jones and Murrel (2001) argue that the literature on cognitive processes in decision-making shows individuals are likely to simplify their evaluative decisions through the use of such uncomplicated decision tools.10 Incremental managerial decisions and actions are not easy to observe and evaluate objectively (Klassen and McLaughlin, 1996). Investors are typically not able to engage in thorough assessments of a firm when forming their impressions, but they can rely on what the firms signal about their values through their EP (Jones and Murrel, 2001). Therefore, one can consider forest certification as a positive environmental event that signals a strong environmental performance and good positioning for future performance.
Although certification can increase operating costs, ignoring it could result in considerable loss of wealth to shareholders that may exceed those costs where it would result in controversy and loss of reputation. If the financial markets recognize the strategic importance of certification and price it, certified firms will experience higher financial performance. In this case, shareholders of non-certified firms are more likely to increase the pressure on their firms for the implementation of certification in order to avoid the market penalties. Alternatively, corporate raiders may benefit from acquiring undervalued firms and certify
10 An uncomplicated decision tool, or heuristic, is a feature related to particular decision that is widely understood, simple, and intuitively appealing (Jones and Murrel, 2001).
K. Bouslah, B. M'Zali, M.-F. Turcotte et M. Kooli
17
them. According to the coexisting theories suggesting positive, negative or neutral relationships between SP and FP, and to the empirical mixed results, we test the following hypothesis:
Hypothesis 1: The forest certification program affects the financial performance of the firm.
Even though a positive relationship is highlighted in some empirical studies analysing the relationship between FP and one specific dimension of SP which is EP, we will conduct two-tailed tests for testing purposes.
Forest certification, might be considered as a one-dimensional measure with respect to a major stakeholder, namely the environment which itself constitutes an important dimension of SP in the forest and paper industry. Any measure should be reliable and valid. In our study, we consider only third-party certification which requires the evaluation of an expert team (e.g., KPMG, PWC, QMI) that have access to all relevant information about the firm. The quality and qualification of these certifiers increase the validity of certification. Moreover, certification is a proxy of particular nature since it is closer to stakeholder’s perceptions and allows distinguishing among stakeholders. However, each certification scheme evaluates firms according to different criteria. As shown earlier, there are different certification programs applied in Canada and in the U.S. which vary widely with respect to several dimensions (e.g., kind of actors originating them, standards type, verification process, governance structure and financing). Thus, one may expect systematic performance differences between NGOs-led and industry-led certification. As such, we are interested in examining whether or not investors evaluate differently certification programs in the short and long-run. The specific hypotheses to be tested are:
Hypothesis 2-a: The short-term impact of forest certification on firm financial performance depends on who grants the certification.
The Impact of Forest Certification on Firm Financial Performance in Canada and the U.S.
18
Hypothesis 2-b: The long-term impact of forest certification on firm financial performance depends on who grants the certification.
19
Data The unit of analysis is the certification event (firm and date) which is characterized by: definition of the event, identification of the announcement date, and identification of firms involved (Campbell et al., 1997). Our study examines certification announcements (FSC, SFI, CSA and ISO14001) awarded by third-party organizations and occurred between January 1998 and May 2005. The announcement of certification is considered as a positive event that signals strong environmental performance to the public. To select third-party certified firms and their announcements dates, several sources have been used: Canadian Sustainable Forestry Certification Coalition,11 Forest Certification Resource Center.12 Certifier organizations and the web sites of certification programs (FSC, CSA, SFI and ISO14001)13 as well as firms identified on the basis of their primary SIC codes reported in Compustat tapes. As indicated by its name, forest certification is applied primarily in the forest products industry (SIC 24) and the paper industry (SIC 26). We also identified other related industries in which forest certification is applied (e.g., printing, publishing, and allied industries: SIC 27). To be included in our sample, firms must meet the following criteria:
• Certified firms must be publicly traded (listed) either on the Toronto Stock Exchange (TSX), NYSE, AMEX or NASDAQ.
• Financial data of certified firms must be available on both CRSP and Compustat.
• Certified forest operations, divisions or products must be located in Canada or in the U.S. Foreign firms that have certified operations in these two countries must be listed in
11 www.certificationcanada.org 12 www.certifiedwood.org 13 Canadian Standard Association (CSA): www.csa.ca; Forest Stewardship Council (FSC): www.fscus.org, www.fscoax.org; International Organization for Standardization: www.iso.org; Sustainable Forestry Initiative (SFI): www.sfiprogram.org.
The Impact of Forest Certification on Firm Financial Performance in Canada and the U.S.
20
Canada or in the U.S. to be included in the sample (e.g., ADRs).
• Certified firms must not have announcements of confounding events in the event window [-10 days, +10 days] such as restructuring, divestitures, new products, dividends and/or earnings announcements, joint ventures, acquisitions, change in a key executive, a major contract, etc. This allows us to isolate the effect of certification events from the effects of other events.
The initial sample includes 333 third-party certification events located in Canada and in the U.S made by 58 public firms. Of these 333 certification events, 85 certification events are excluded for several reasons: e.g., some certified firms are not covered by Compustat database; some certified firms are acquired after being certified, while others merged with other firms; some certified firms have certified operations in Canada or in the U.S, but they are not listed in these two countries. We also excluded 74 certification events because they are accompanied by announcements of confounding events in the event window [-10 days, +10 days]. The resulting sample of 174 certification events includes 12 certification events for which we have only the certification announcement month. Moreover, we do not have daily return data for 2 other certification events. The resulting final sample that can be used to examine the short-run event returns of certified firms includes 160 third-party certification events made by 42 firms. Our final sample includes nine joint certifications: seven certifications SFI/ISO14001 and two certifications SFI/CSA. These observations are used only to test the first hypothesis but removed from our tests of the second hypothesis in order to reduce the bias related to the construction of subsamples. Table III shows the sample distribution of third-party certification events by year and certification system, whereas table IV shows the sample distribution by industry and firm size.
Near 31% of our sample belongs to the forest products industry (SIC code 24), 52% to the paper industry (SIC code 26), 12% to the printing and publishing industry (SIC code 27) and the
K. Bouslah, B. M'Zali, M.-F. Turcotte et M. Kooli
21
remaining 5% (two firms) belongs to other related industries (SIC code 08 and 39).
The same firm can get multiple certifications (FSC, SFI, CSA and/or ISO14001) and can be certified several times by the same certification program (e.g., multiple divisions or forests). To analyze long-run performance, we consider only the initial certification for each firm relative to a particular certification program. Thus, we can only use 68 third-party certification events made by 39 firms in order to examine the long-run performance of certified firms. These 68 certification events include 56 certification events out of the 160 shown in table III plus the 12 certification events for which we have only the certification announcement month. Accounting data are obtained from the Compustat Industrial and Research tapes while return data are obtained from the CRSP master tapes.
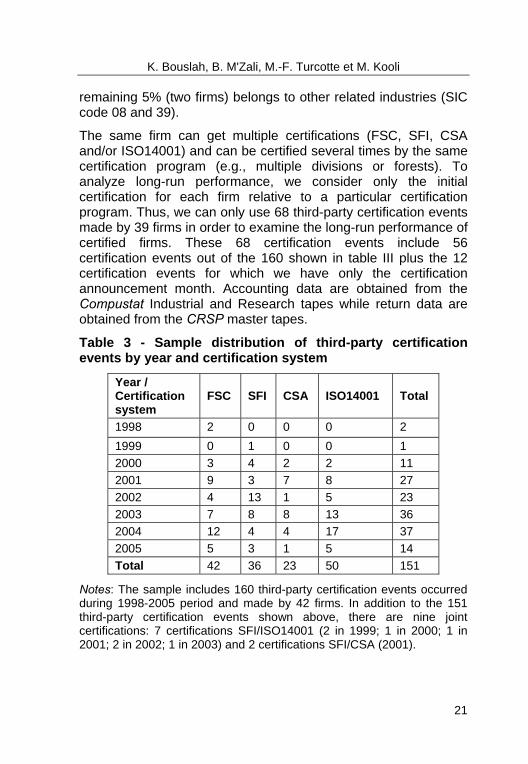
Table 3 - Sample distribution of third-party certification events by year and certification system
Year / Certification system
FSC SFI CSA ISO14001 Total
1998 2 0 0 0 2 1999 0 1 0 0 1 2000 3 4 2 2 11 2001 9 3 7 8 27 2002 4 13 1 5 23 2003 7 8 8 13 36 2004 12 4 4 17 37 2005 5 3 1 5 14 Total 42 36 23 50 151
Notes: The sample includes 160 third-party certification events occurred during 1998-2005 period and made by 42 firms. In addition to the 151 third-party certification events shown above, there are nine joint certifications: 7 certifications SFI/ISO14001 (2 in 1999; 1 in 2000; 1 in 2001; 2 in 2002; 1 in 2003) and 2 certifications SFI/CSA (2001).
The Impact of Forest Certification on Firm Financial Performance in Canada and the U.S.
22
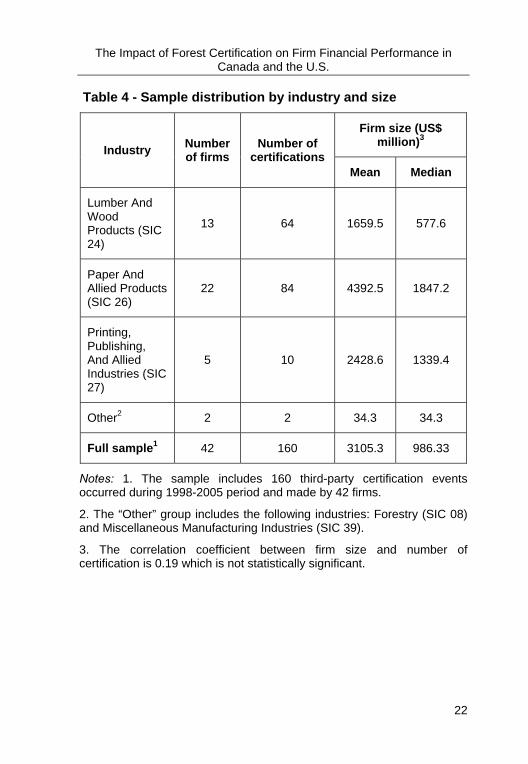
Table 4 - Sample distribution by industry and size
Industry Number of firms
Number of certifications
Firm size (US$ million)3
Mean Median
Lumber And Wood Products (SIC 24)
13 64 1659.5 577.6
Paper And Allied Products (SIC 26)
22 84 4392.5 1847.2
Printing, Publishing, And Allied Industries (SIC 27)
5 10 2428.6 1339.4
Other2 2 2 34.3 34.3
Full sample1 42 160 3105.3 986.33
Notes: 1. The sample includes 160 third-party certification events occurred during 1998-2005 period and made by 42 firms.
2. The “Other” group includes the following industries: Forestry (SIC 08) and Miscellaneous Manufacturing Industries (SIC 39).
3. The correlation coefficient between firm size and number of certification is 0.19 which is not statistically significant.
K. Bouslah, B. M'Zali, M.-F. Turcotte et M. Kooli
23
Methodology
The control firm approach
The control firm approach matches sample firms to control firms on the basis of specified firm characteristics (Barber and Lyon, 1997). In this study, we use the return on a size and industry matched control firm as a proxy for the expected (normal) return for each sample firm when calculating abnormal returns. Our approach matches a sample firm to a control firm of similar size and industry.14 To identify a size and industry matched control firm, we first identify all nonevent firms (i.e., control firms should not have experienced the event) operating in the same industry of the sample firm. From this set of firms we choose the firm with the closest size to that of the sample firm (i.e., firm, or portfolio of firms when possible, with market value of equity between 70% and 130% of the market value of equity of the sample firm). Specifically, we first choose all non certified firms with the same two-digit SIC code from Compustat.15 Among these firms, we select those with size within ± 30% of the size of the sample firm in the fiscal-end year prior to the year of the certification announcement. 14 We also considered, but abandoned, the use of a control firm of similar size, industry, and book-to-market ratio, because this approach considerably reduces the number of sample firms due to the difficulty to find control firms on the basis of these three characteristics simultaneously. Moreover, we argue that controlling for industry effects is crucial, especially when dealing with the relationship between financial performance and social/environmental performance issues. In fact, different industries face different social and environmental issues. That is why we consider industry as the first criteria to select control firms. Following Fama and French (1993), most studies control only for size and book-to-market ratio. However, Lyon et al. (1999) document that controlling for these two firm characteristics alone is not sufficient to yield well-specified test statistics for nonrandom samples, regardless of the approach used. 15 We are able to match all sample firms only if we consider control firms with the same two-digit SIC code.
The Impact of Forest Certification on Firm Financial Performance in Canada and the U.S.
24
Calculation of short-run abnormal returns
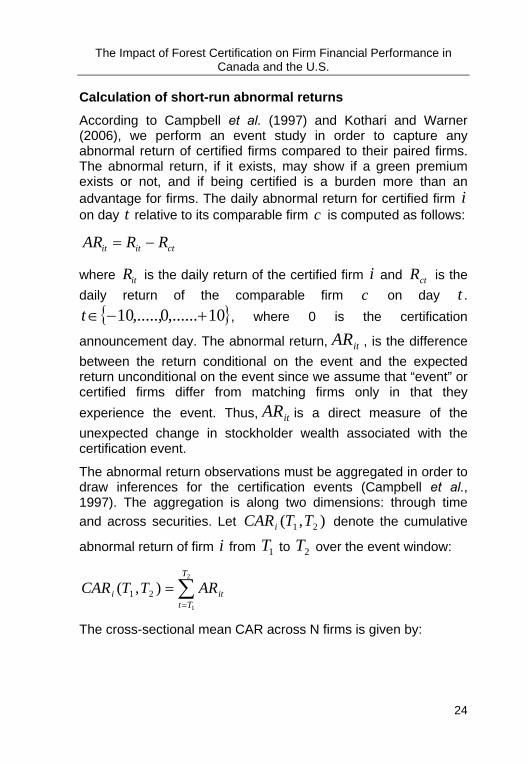
According to Campbell et al. (1997) and Kothari and Warner (2006), we perform an event study in order to capture any abnormal return of certified firms compared to their paired firms. The abnormal return, if it exists, may show if a green premium exists or not, and if being certified is a burden more than an advantage for firms. The daily abnormal return for certified firm i on day t relative to its comparable firm c is computed as follows:
ctitit RRAR −=
where itR is the daily return of the certified firm i and ctR is the daily return of the comparable firm c on day t .
{ }10,......0,.....,10 +−∈t , where 0 is the certification
announcement day. The abnormal return, itAR , is the difference between the return conditional on the event and the expected return unconditional on the event since we assume that “event” or certified firms differ from matching firms only in that they experience the event. Thus, itAR is a direct measure of the unexpected change in stockholder wealth associated with the certification event.
The abnormal return observations must be aggregated in order to draw inferences for the certification events (Campbell et al., 1997). The aggregation is along two dimensions: through time and across securities. Let ),( 21 TTCARi denote the cumulative
abnormal return of firm i from 1T to 2T over the event window:
∑=
=2
1
),( 21
T
Ttiti ARTTCAR
The cross-sectional mean CAR across N firms is given by:
K. Bouslah, B. M'Zali, M.-F. Turcotte et M. Kooli
25
),(1),( 211
21 TTCARN
TTCARN
ii∑
=
=
The mean CAR for any event window can be analyzed separately given estimates of their variances. The mean CAR represents average total effect of the certification event across all sample events over the event window. The specific null hypothesis to be tested is whether the mean cumulative abnormal performance,
),( 21 TTCAR , is equal to zero.
Calculation of long-run abnormal returns
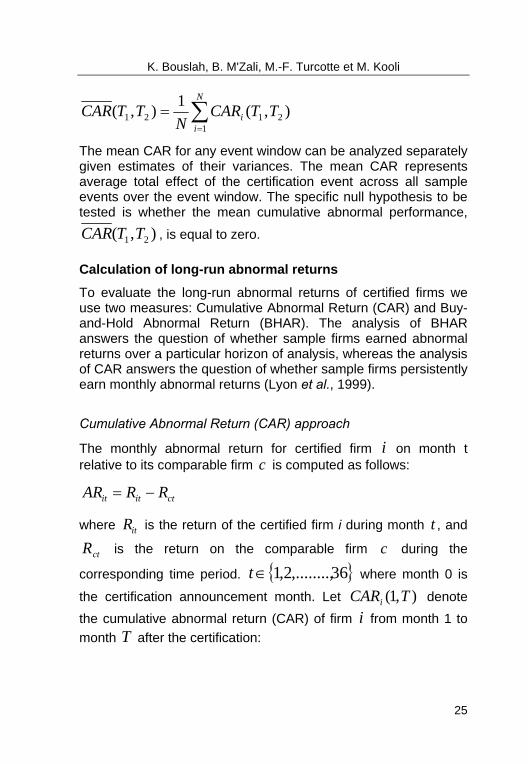
To evaluate the long-run abnormal returns of certified firms we use two measures: Cumulative Abnormal Return (CAR) and Buy-and-Hold Abnormal Return (BHAR). The analysis of BHAR answers the question of whether sample firms earned abnormal returns over a particular horizon of analysis, whereas the analysis of CAR answers the question of whether sample firms persistently earn monthly abnormal returns (Lyon et al., 1999).
Cumulative Abnormal Return (CAR) approach
The monthly abnormal return for certified firm i on month t relative to its comparable firm c is computed as follows:
ctitit RRAR −=
where itR is the return of the certified firm i during month t , and
ctR is the return on the comparable firm c during the
corresponding time period. { }36,........,2,1∈t where month 0 is
the certification announcement month. Let ),1( TCARi denote the cumulative abnormal return (CAR) of firm i from month 1 to month T after the certification:
The Impact of Forest Certification on Firm Financial Performance in Canada and the U.S.
26
∑=
=T
titi ARTCAR
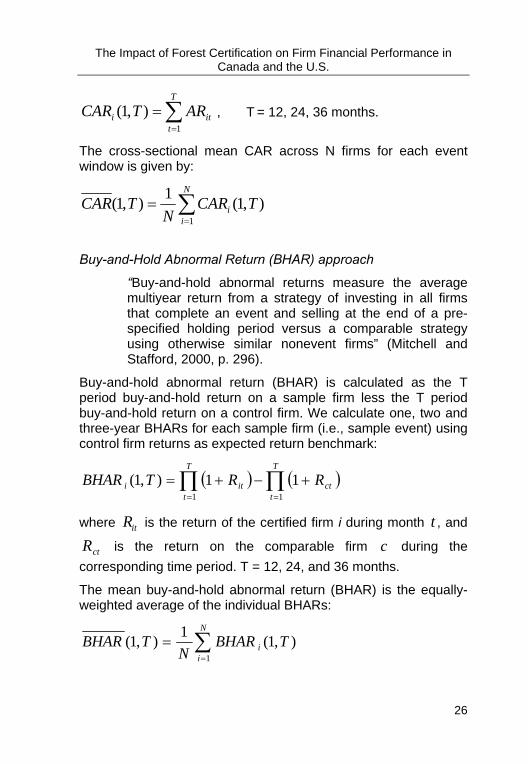
1),1( , T = 12, 24, 36 months.
The cross-sectional mean CAR across N firms for each event window is given by:
),1(1),1(1
TCARN
TCARN
ii∑
=
=
Buy-and-Hold Abnormal Return (BHAR) approach
“Buy-and-hold abnormal returns measure the average multiyear return from a strategy of investing in all firms that complete an event and selling at the end of a pre-specified holding period versus a comparable strategy using otherwise similar nonevent firms” (Mitchell and Stafford, 2000, p. 296).
Buy-and-hold abnormal return (BHAR) is calculated as the T period buy-and-hold return on a sample firm less the T period buy-and-hold return on a control firm. We calculate one, two and three-year BHARs for each sample firm (i.e., sample event) using control firm returns as expected return benchmark:
( ) ( )∏∏==
+−+=T
tct
T
titi RRTBHAR
11
11),1(
where itR is the return of the certified firm i during month t , and
ctR is the return on the comparable firm c during the corresponding time period. T = 12, 24, and 36 months.
The mean buy-and-hold abnormal return (BHAR) is the equally-weighted average of the individual BHARs:
∑=
=N
ii TBHAR
NTBHAR
1),1(1),1(
K. Bouslah, B. M'Zali, M.-F. Turcotte et M. Kooli
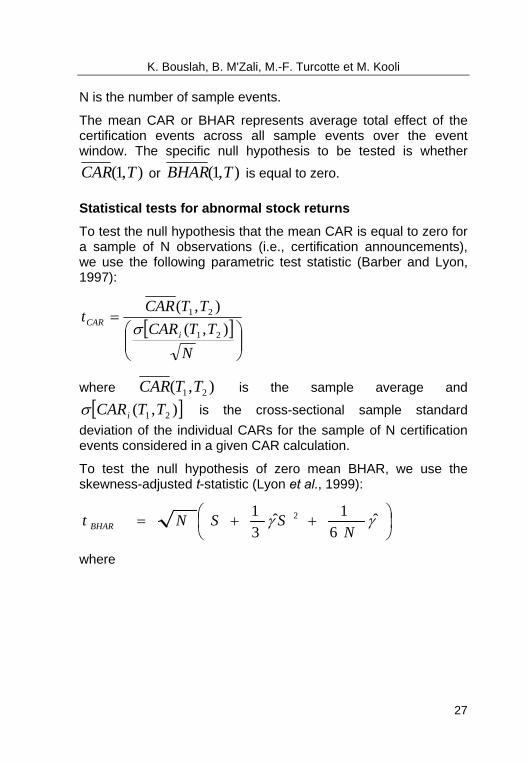
27
N is the number of sample events.
The mean CAR or BHAR represents average total effect of the certification events across all sample events over the event window. The specific null hypothesis to be tested is whether
),1( TCAR or ),1( TBHAR is equal to zero.
Statistical tests for abnormal stock returns
To test the null hypothesis that the mean CAR is equal to zero for a sample of N observations (i.e., certification announcements), we use the following parametric test statistic (Barber and Lyon, 1997):
[ ]⎟⎟⎠
⎞⎜⎜⎝
⎛=
NTTCAR
TTCARt
iCAR ),(
),(
21
21
σ
where ),( 21 TTCAR is the sample average and
[ ]),( 21 TTCARiσ is the cross-sectional sample standard deviation of the individual CARs for the sample of N certification events considered in a given CAR calculation.
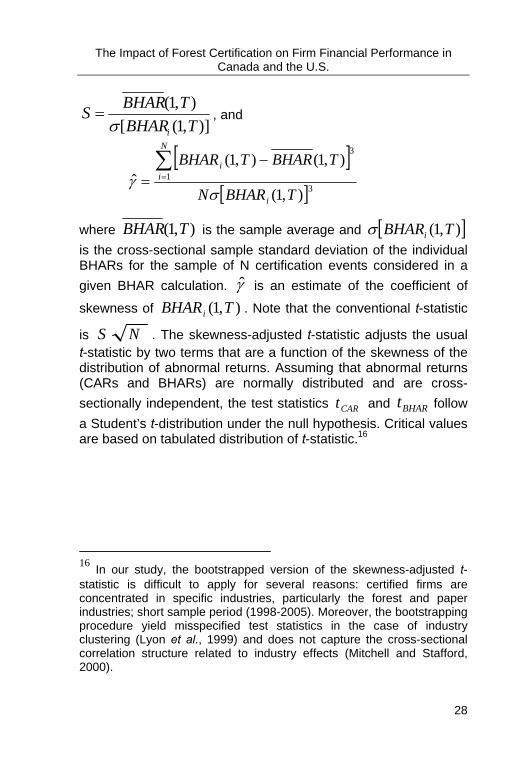
To test the null hypothesis of zero mean BHAR, we use the skewness-adjusted t-statistic (Lyon et al., 1999):
⎟⎠⎞
⎜⎝⎛ ++= γγ ˆ
61ˆ
31 2
NSSNt BHAR
where
The Impact of Forest Certification on Firm Financial Performance in Canada and the U.S.
28
)],1([),1(TBHAR
TBHARSiσ
= , and
[ ]
[ ]31
3
),1(
),1(),1(ˆ
TBHARN
TBHARTBHAR
i
N
ii
σγ
∑=
−=
where ),1( TBHAR is the sample average and [ ]),1( TBHARiσ is the cross-sectional sample standard deviation of the individual BHARs for the sample of N certification events considered in a given BHAR calculation. γ̂ is an estimate of the coefficient of
skewness of ),1( TBHARi . Note that the conventional t-statistic
is NS . The skewness-adjusted t-statistic adjusts the usual t-statistic by two terms that are a function of the skewness of the distribution of abnormal returns. Assuming that abnormal returns (CARs and BHARs) are normally distributed and are cross-sectionally independent, the test statistics CARt and BHARt follow a Student’s t-distribution under the null hypothesis. Critical values are based on tabulated distribution of t-statistic.16
16 In our study, the bootstrapped version of the skewness-adjusted t-statistic is difficult to apply for several reasons: certified firms are concentrated in specific industries, particularly the forest and paper industries; short sample period (1998-2005). Moreover, the bootstrapping procedure yield misspecified test statistics in the case of industry clustering (Lyon et al., 1999) and does not capture the cross-sectional correlation structure related to industry effects (Mitchell and Stafford, 2000).
K. Bouslah, B. M'Zali, M.-F. Turcotte et M. Kooli
29
Methodological issues17
The analysis of long-run abnormal returns is treacherous (Lyon et al., 1999, p. 165). Barber and Lyon (1997) advocate the use of BHAR over CAR, because CAR is a biased predictor of BHAR and this problem can lead to incorrect inferences if researchers restrict attention to CAR only. They refer to this problem as the measurement bias. However, Fama (1998) argues that theoretical and statistical considerations alike suggest that CAR should be used, rather than BHAR because it poses fewer statistical problems. Generally, misspecification of test statistics for long-run abnormal returns are caused by the new listing bias (survivor bias), the rebalancing of benchmark bias, the skewness bias, the cross-sectional dependence (i.e., cross-correlations of individual-firm abnormal returns), and a bad model of asset pricing (Lyon et al., 1999). Fortunately, the control firm approach eliminates the new listing, the rebalancing, and the skewness biases (Barber and Lyon, 1997, p. 354). CAR is more affected by the new listing bias, whereas BHAR is more affected by the rebalancing and skewness biases (Barber and Lyon, 1997). The skewness bias is 17 We do not claim that the methodology used in this article is perfect and not susceptible to some bias that might arise from other sources not controlled. The debate about the appropriate measure of long-run abnormal stock returns and associated test statistics has not yet fully resolved (see, for example, Barber and Lyon, 1997; Kothari and Warner, 1997, 2006; Fama, 1998; Lyon et al., 1999; Brav et al., 2000, Mitchell and Stafford, 2000; Loughran and Ritter, 2000). For example, Fama (1998) and Mitchell and Stafford (2000) argue against the BHAR approach and advocate CAR or calendar-time portfolio approach, whereas Barber and Lyon (1997) and Lyon et al. (1999) advocate the BHAR approach. Calendar-time portfolio approach (e.g., Jensen-alpha from the Fama and French (1993) three-factor model) eliminates the problem of cross-sectional dependence among sample firms but, this approach often yield misspecified test statistics in nonrandom samples, e.g., when sample is drawn from a single industry (Lyon et al., 1999). In this article, we do not use the calendar-time portfolio approach because size and book-to-market factors are not available for the Canadian market. The construction of these factors is beyond the scope of this article.
The Impact of Forest Certification on Firm Financial Performance in Canada and the U.S.
30
less severe for CAR than for BHAR because the monthly returns of sample firms are summed rather than compounded (Barber and Lyon, 1997; Fama, 1998). The extent of skewness bias in the test statistic is expected to decline with sample size (Kothari and Warner, 2006). Skewness bias is a concern for small samples (Kothari and Warner, 2006). That is why we use the skewness-adjusted t-statistic to test the null hypothesis of zero mean BHAR.
Cross-sectional dependence is likely to be a problem when return calculations involve overlapping periods or there is severe industry clustering (Lyon et al., 1999). This problem is more severe in the BHAR approach (Mitchell and Stafford, 2000). Assessing the statistical significance of the mean BHAR has been particularly difficult because long-horizon abnormal returns depart from normality and tend to be cross-correlated (Kothari and Warner, 2006). The two main sources of cross-sectional correlations of the individual event firm abnormal returns are (Lyon et al., 1999; Mitchell and Stafford, 2000): 1/ calendar clustering: overlapping observations, in calendar time, of similar firms such as those in the same industry (e.g., sample firms that complete certification events in the same month). 2/ overlapping return calculations: overlapping periods of return calculation for the same firm (e.g., multiple certification events by the same firm within 3-year period). This is the most severe form of cross-sectional dependence. The only ready solution to this source of bias is to purge the sample of observations of overlapping returns (Lyon et al., 1999). Therefore, to mitigate the problem of cross-sectional correlations of the individual event firm abnormal returns in our sample, we repeat the analysis after excluding multiple certification events on the same firm that occur within any 3-year period of the initial certification. In other words, after the first certification event, we ignore additional certification events until after the 3-year event window.
Another major difficulty when assessing long-run abnormal returns is the bad model problem. Event study tests are joint tests of whether abnormal returns are zero (i.e., market efficiency) and of whether the assumed model of expected (normal) returns is correct (Kothari and Warner, 2006). In this article, we implicitly
K. Bouslah, B. M'Zali, M.-F. Turcotte et M. Kooli
31
assume an expected return model in which the matched characteristics (size and industry) perfectly proxy for the expected return on a security. To minimize the errors in risk adjustment, the benchmark is a portfolio of firms rather than a single firm, when possible.
In addition to all these difficulties, there is another concern associated with small samples: extreme observations (outliers). With small samples, it is crucial to assess whether the results are driven by outliers (McWilliams and Siegel, 1997). A negative (positive) mean BHAR or CAR can be driven by unusually large negative (positive) abnormal returns for a few sample firms. To identify outliers, we calculate the interval [ ]σσ 3;3 +− meanmean for a given CAR or BHAR calculation. If some CAR or BHAR observations lie outside this interval, we repeat the analysis without these outliers. If the results are different (i.e., results are affected by these outliers), we report the results without outliers. Moreover, it is important to report the median values, because they are less affected by outliers. McWilliams and Siegel (1997) argue that one important control for outliers is to report nonparametric test statistics. We use the nonparametric Wilcoxon signed-rank test statistic to test the null hypothesis that the median abnormal return (CAR or BHAR) estimate is equal to zero. In all results, we also report the proportion of positive CAR or BHAR. The mean (median) values for CAR and BHAR estimates that are significant at the 1%, 5% or 10% levels are referred to hereafter as being highly significant, significant or marginally significant, respectively.
32
Results and Analysis
Short-run event returns
Our purpose is to examine the stock price response to the certification announcement. Specifically, we examine four event windows. First, the pre-announcement period (days –10 through –1 relative to the certification announcement day) which may capture any abnormal performance (price run-up) prior to the certification announcement date. Second, the post-announcement period (day +1 through +10) which may capture any abnormal performance after the announcement date. Third, we examine the period around the announcement date (day -1 through +1) in order to capture the market’s response to the certification announcements. Fourth, we examine the overall event window (day -10 through +10). Recall that the certification announcement date (CD) is the day 0.
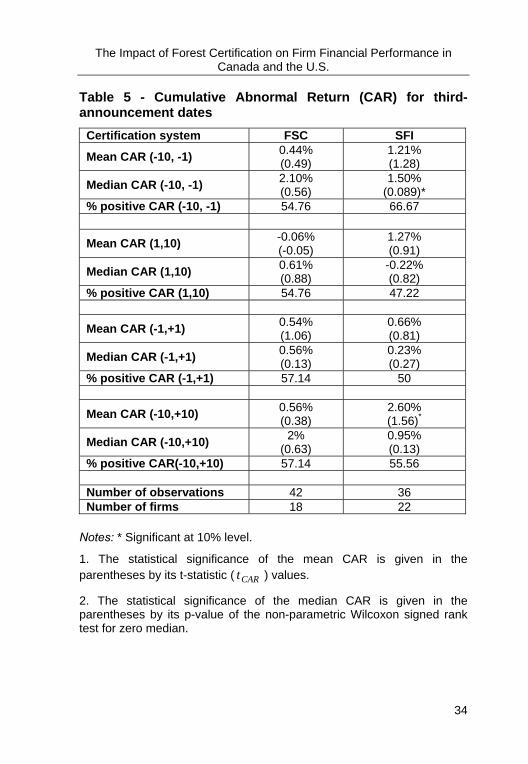
Table V reports the average and median values of the cumulative abnormal return (CAR) for these four event windows. The mean (median) CAR estimates for the pre-announcement window [CD-10, CD-1] of 0.59% (0.26%) are not significant (t-statistic of 0.98; p-value of 0.54), and suggests that the certification announcement is not anticipated by the market. The mean CAR estimate for the announcement window [CD-1, CD+1] of 0.47% is marginally significant (t-statistic of 1.56) suggesting that the certifications announcements contain some new information. However, the corresponding median CAR estimate of 0.09% is not significant (p-value of 0.1). A closer examination of the data reveals the existence of five outliers (extreme observations) that lie outside the interval )](3)([ CARCARMean σ×± . After removing these outliers, the mean (median) three-day CAR estimates become 0.19% (0.07%) and not significant. The mean (median) CAR estimates for the post-announcement window [CD+1, CD+10] of 0.31% (0.82%) and the overall event window [CD-10, CD+10] of 0.98% (0.25%) are not significant.
Although positive, as expected, the mean (median) CAR estimates reported in Table V provide little support to our first
K. Bouslah, B. M'Zali, M.-F. Turcotte et M. Kooli
33
hypothesis (H1) which suggests that strong environmental performance (i.e., forest certification) affects the financial performance of the firm. Overall, the evidence indicates that forest certification announcements do not convey new information to the market.
This result can be easily understood if we consider the certification process itself. In fact, the certification announcement is the output of a process that can take more or less times depending on the nature of the certification (forest, division, product, process). Therefore, market participants may anticipate the impact of certification on future cash flows and firm performance well before the announcement date. However, we do not find support to this explanation since certified firms do not show any abnormal performance over 36 months before the certifications announcements month.18
18 We compute the cumulative abnormal return (CAR) over 36 months before the certification announcement month in order to examine whether certifications have been anticipated by market participants before the certification events. The mean (median) one-year, two-year, and three year CAR estimates before the certification announcement month are 5.82% (5.04%), 4.04% (0.87%), and -7.01% (-13.1%), respectively. Only, the mean one-year CAR estimate before the certification announcement month is marginally significant.
The Impact of Forest Certification on Firm Financial Performance in Canada and the U.S.
34
Table 5 - Cumulative Abnormal Return (CAR) for third- announcement dates
Certification system FSC SFI
Mean CAR (-10, -1) 0.44% (0.49)
1.21% (1.28)
Median CAR (-10, -1) 2.10% (0.56)
1.50% (0.089)*
% positive CAR (-10, -1) 54.76 66.67
Mean CAR (1,10) -0.06% (-0.05)
1.27% (0.91)
Median CAR (1,10) 0.61% (0.88)
-0.22% (0.82)
% positive CAR (1,10) 54.76 47.22
Mean CAR (-1,+1) 0.54% (1.06)
0.66% (0.81)
Median CAR (-1,+1) 0.56% (0.13)
0.23% (0.27)
% positive CAR (-1,+1) 57.14 50
Mean CAR (-10,+10) 0.56% (0.38)
2.60% (1.56)*
Median CAR (-10,+10) 2% (0.63)
0.95% (0.13)
% positive CAR(-10,+10) 57.14 55.56 Number of observations 42 36 Number of firms 18 22
Notes: * Significant at 10% level.
1. The statistical significance of the mean CAR is given in the parentheses by its t-statistic ( CARt ) values.
2. The statistical significance of the median CAR is given in the parentheses by its p-value of the non-parametric Wilcoxon signed rank test for zero median.
K. Bouslah, B. M'Zali, M.-F. Turcotte et M. Kooli
35
party certified firms surrounding the certification
CSA ISO14001 All certifications-1.03% (-0.80)
0.07% (0.06)
0.59% (0.98)
0.12% (0.56)
-1.41% (0.3)
0.26% (0.54)
56.52 40 53.13
-1.16% (-0.83)
0.53% (0.70)
0.31% (0.58)
-1.17% (0.36)
1.28% (0.42)
0.82% (0.69)
43.48 58 53.13
0.93% (1.11)
0.12% (0.23)
0.47% (1.56)*
1.22% (0.37)
-0.18% (0.76)
0.09% (0.10)
60.87 46 51.25
-1.81% (-1.30)
0.39% (0.28)
0.98% (1.25)
-2.80% (0.21)
-1.41% (0.79)
0.25% (0.32)
39.13 44 51.25
23 50 160 7 19 42
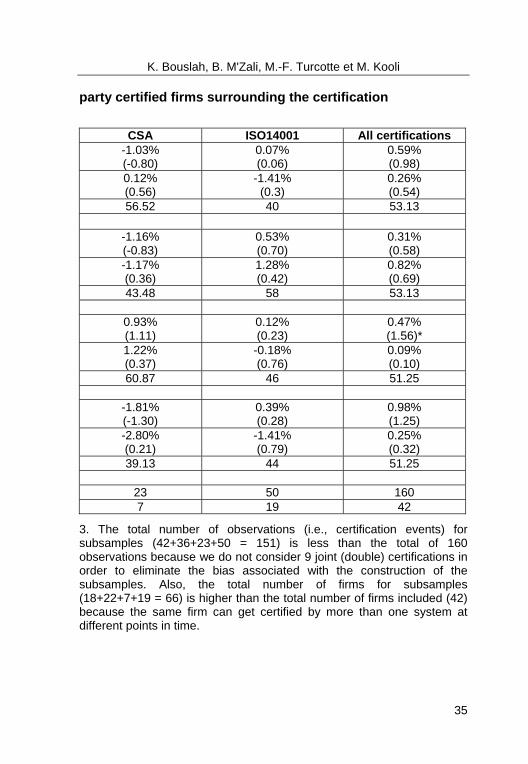
3. The total number of observations (i.e., certification events) for subsamples (42+36+23+50 = 151) is less than the total of 160 observations because we do not consider 9 joint (double) certifications in order to eliminate the bias associated with the construction of the subsamples. Also, the total number of firms for subsamples (18+22+7+19 = 66) is higher than the total number of firms included (42) because the same firm can get certified by more than one system at different points in time.
The Impact of Forest Certification on Firm Financial Performance in Canada and the U.S.
36
Table V also reports the average and median values of the cumulative abnormal return (CAR) surrounding the certification announcement by certification system. Only the mean CAR estimate for the overall announcement window [CD-10, CD+10] of 2.60% and the median CAR estimate for the pre-announcement window [CD-10, CD-1] of 1.5% experienced by firms certified SFI are marginally significant (t-statistic of 1.56 and p-value of 0.089, respectively). Except these results, the average and median values of the cumulative abnormal return (CAR) for the four event windows considered are not statistically significant regardless of the certification system. For example, the mean CAR estimates realized by firms certified FSC, SFI, CSA and ISO14001 for the announcement window [CD-1, CD+1] are 0.54%, 0.66%, 0.93% and 0.12%, respectively. The corresponding median values show a similar trend (i.e., positive values) except for ISO14001 certification (median value of -0.18%) since only 46% of ISO14001 certified firms have experienced positive CAR. The results reported in table V do not support our second hypothesis (H2) suggesting that the impact of forest certification on firm financial performance depends on who grants the certification. In summary, the results of short-run event returns indicate that forest certification do not have any significant impact on firm financial performance regardless of the certification system carried out by firms.
Long-run event returns
In this section, we examine the long-run event abnormal returns by analysing the post-announcement period using two approaches: cumulative abnormal return (CAR) and buy-and-hold abnormal return (BHAR). Table VI provides a summary of the results of cumulative abnormal return (CAR) over 36 months following the certification announcement month.
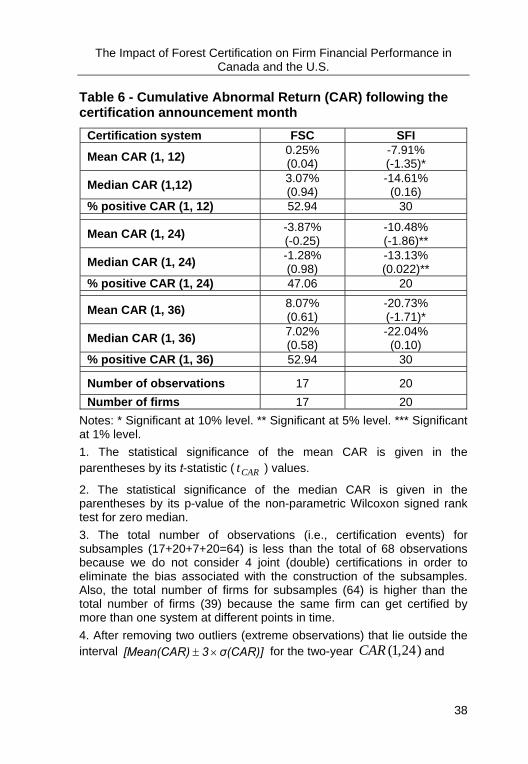
At 12 months after the certification, the mean CAR estimate is negative (-4.46%) but not significant (t-statistic: -1.28). The corresponding median value is also negative (-11.25%) but marginally significant (p-value: 0.085). At 24 months after the certification, the mean CAR estimate of -11.02% is significantly
K. Bouslah, B. M'Zali, M.-F. Turcotte et M. Kooli
37
negative (t-statistic: -2.22). At 36 months after the certification, the mean CAR estimate is also negative (-16.14%) and highly significant (t-statistic: -2.68). The corresponding median values show a similar trend.
These results support our first hypothesis highlighting a negative relationship between FP and EP measured by certification. Our results suggest that forest certification has, on average, a negative impact on firm financial performance. Forest certification would not be profitable or more precisely the expected benefits of certification relative to its associated costs have not been realized (i.e., recognized by the market).
The Impact of Forest Certification on Firm Financial Performance in Canada and the U.S.
38
Table 6 - Cumulative Abnormal Return (CAR) following the certification announcement month
Certification system FSC SFI
Mean CAR (1, 12) 0.25% (0.04)
-7.91% (-1.35)*
Median CAR (1,12) 3.07% (0.94)
-14.61% (0.16)
% positive CAR (1, 12) 52.94 30
Mean CAR (1, 24) -3.87% (-0.25)
-10.48% (-1.86)**
Median CAR (1, 24) -1.28% (0.98)
-13.13% (0.022)**
% positive CAR (1, 24) 47.06 20
Mean CAR (1, 36) 8.07% (0.61)
-20.73% (-1.71)*
Median CAR (1, 36) 7.02% (0.58)
-22.04% (0.10)
% positive CAR (1, 36) 52.94 30
Number of observations 17 20 Number of firms 17 20
Notes: * Significant at 10% level. ** Significant at 5% level. *** Significant at 1% level. 1. The statistical significance of the mean CAR is given in the parentheses by its t-statistic ( CARt ) values.
2. The statistical significance of the median CAR is given in the parentheses by its p-value of the non-parametric Wilcoxon signed rank test for zero median. 3. The total number of observations (i.e., certification events) for subsamples (17+20+7+20=64) is less than the total of 68 observations because we do not consider 4 joint (double) certifications in order to eliminate the bias associated with the construction of the subsamples. Also, the total number of firms for subsamples (64) is higher than the total number of firms (39) because the same firm can get certified by more than one system at different points in time. 4. After removing two outliers (extreme observations) that lie outside the interval σ(CAR)]3[Mean(CAR) ×± for the two-year )24,1(CAR and
K. Bouslah, B. M'Zali, M.-F. Turcotte et M. Kooli
39
for third-party certified firms over 36 months
CSA ISO14001 All certifications-12.03% (-1.41)
-1.20% (-0.14)
-4.46% (-1.28)
-6.34% (0.15)
-6.06% (0.68)
-11.25% (0.085)*
28.57 50 41.18
-16.10% (-1.68)*
-17.46% (-2.09)**
-11.02% (-2.22)**
-6.51% (0.29)
-25.73% (0.052)*
-10.83% (0.0069)***
42.86 30 32.35
-37.88% (-2.60)**
-25.99% (-2.64)***
-16.14% (-2.68)***
-47.46% (0.078)*
-27.81% (0.022)**
-12.43% (0.0099)***
28.57 25 33.82
7 20 68 7 20 39
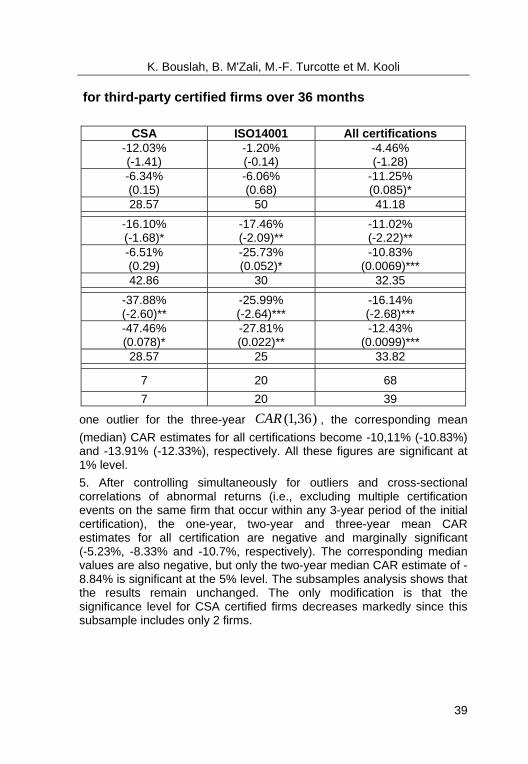
one outlier for the three-year )36,1(CAR , the corresponding mean (median) CAR estimates for all certifications become -10,11% (-10.83%) and -13.91% (-12.33%), respectively. All these figures are significant at 1% level. 5. After controlling simultaneously for outliers and cross-sectional correlations of abnormal returns (i.e., excluding multiple certification events on the same firm that occur within any 3-year period of the initial certification), the one-year, two-year and three-year mean CAR estimates for all certification are negative and marginally significant (-5.23%, -8.33% and -10.7%, respectively). The corresponding median values are also negative, but only the two-year median CAR estimate of -8.84% is significant at the 5% level. The subsamples analysis shows that the results remain unchanged. The only modification is that the significance level for CSA certified firms decreases markedly since this subsample includes only 2 firms.
The Impact of Forest Certification on Firm Financial Performance in Canada and the U.S.
40
Table VI also reports the results of cumulative abnormal return (CAR) over 36 months following the certifications announcements month for each certification program separately. At 36 months after the certification, the mean (median) CAR estimates of 8.07% (7.02%) earned by FSC certified firms are not significant. Similarly, the positive one-year mean (median) CAR estimates of 0.25% (3.07%) and the negative two-year mean (median) CAR estimates of – 3.87% (-1.28%) earned by FSC certified firms following the certification are not significant.
Unlike FSC certified firms, SFI, CSA and ISO14001 certified firms have experienced only negative mean (median) CAR estimates which are significant in many cases. The one-year, two-year and three-year mean CAR estimates experienced by SFI certified firms are -7.91%, -10.48% and -20.73%, respectively. The one-year and three-year mean CAR estimates earned by SFI certified firms are marginally significant, whereas the two-year mean (median) CAR estimates are significant at the 5% level.
Similarly, CSA certified firms have experienced significantly negative mean CAR estimate over 36 months following the certification (-37.88%). The two-year mean CAR estimate of -16.1% experienced by CSA certified firms is marginally significant, whereas the one-year mean CAR estimate of -12.03% is not significant.
The one-year mean CAR estimate of -1.2% earned by ISO14001 certified firms is not significant. For a longer period after certification (24 and 36 months), ISO14001 certified firms also have experienced significantly negative mean CAR estimates (-17.46% and -25.99%, respectively). The corresponding median values show a similar trend.
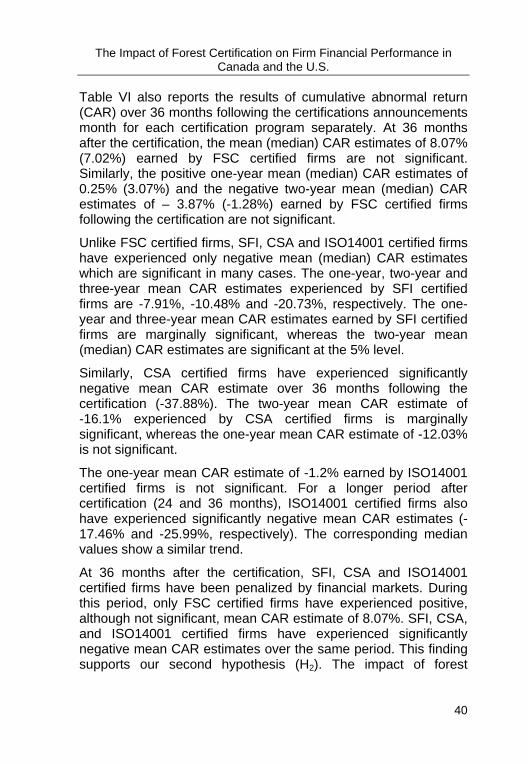
At 36 months after the certification, SFI, CSA and ISO14001 certified firms have been penalized by financial markets. During this period, only FSC certified firms have experienced positive, although not significant, mean CAR estimate of 8.07%. SFI, CSA, and ISO14001 certified firms have experienced significantly negative mean CAR estimates over the same period. This finding supports our second hypothesis (H2). The impact of forest
K. Bouslah, B. M'Zali, M.-F. Turcotte et M. Kooli
41
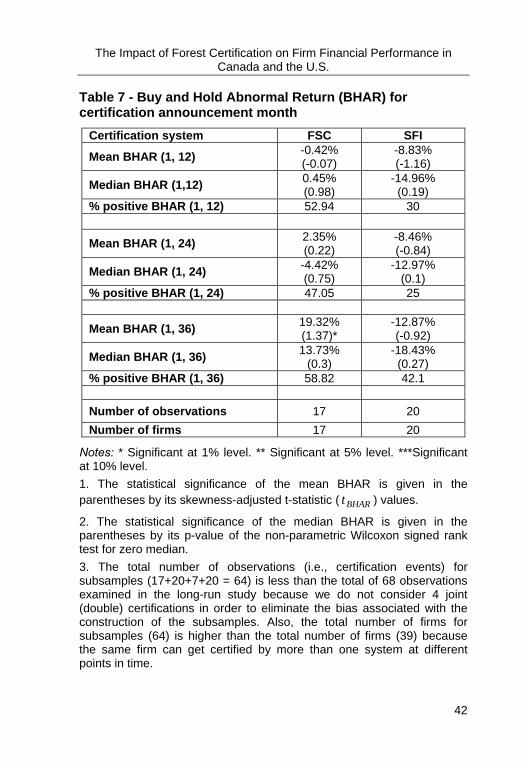
certification on firm financial performance, as measured by CAR, depends on who grants the certification since only industry-led certification (SFI, CSA and ISO14001) are penalized by financial markets. The NGOs-led FSC certification is not penalized. This result suggests that the adoption of the FSC certification (favourite of environmental groups) is the more profitable as compared to the adoption of certification related to the industry or to the firms (SFI, CSA and ISO14001). In the rest of this section, we examine whether or not our two hypotheses continue to hold if we use an alternative financial performance measure, namely the buy-and-hold abnormal return (BHAR). Table VII provides a summary of the results of buy-and-hold abnormal return (BHAR) over 36 months following the certification announcement month.
The Impact of Forest Certification on Firm Financial Performance in Canada and the U.S.
42
Table 7 - Buy and Hold Abnormal Return (BHAR) for certification announcement month
Certification system FSC SFI
Mean BHAR (1, 12) -0.42% (-0.07)
-8.83% (-1.16)
Median BHAR (1,12) 0.45% (0.98)
-14.96% (0.19)
% positive BHAR (1, 12) 52.94 30
Mean BHAR (1, 24) 2.35% (0.22)
-8.46% (-0.84)
Median BHAR (1, 24) -4.42% (0.75)
-12.97% (0.1)
% positive BHAR (1, 24) 47.05 25
Mean BHAR (1, 36) 19.32% (1.37)*
-12.87% (-0.92)
Median BHAR (1, 36) 13.73% (0.3)
-18.43% (0.27)
% positive BHAR (1, 36) 58.82 42.1 Number of observations 17 20 Number of firms 17 20
Notes: * Significant at 1% level. ** Significant at 5% level. ***Significant at 10% level. 1. The statistical significance of the mean BHAR is given in the parentheses by its skewness-adjusted t-statistic ( BHARt ) values.
2. The statistical significance of the median BHAR is given in the parentheses by its p-value of the non-parametric Wilcoxon signed rank test for zero median. 3. The total number of observations (i.e., certification events) for subsamples (17+20+7+20 = 64) is less than the total of 68 observations examined in the long-run study because we do not consider 4 joint (double) certifications in order to eliminate the bias associated with the construction of the subsamples. Also, the total number of firms for subsamples (64) is higher than the total number of firms (39) because the same firm can get certified by more than one system at different points in time.
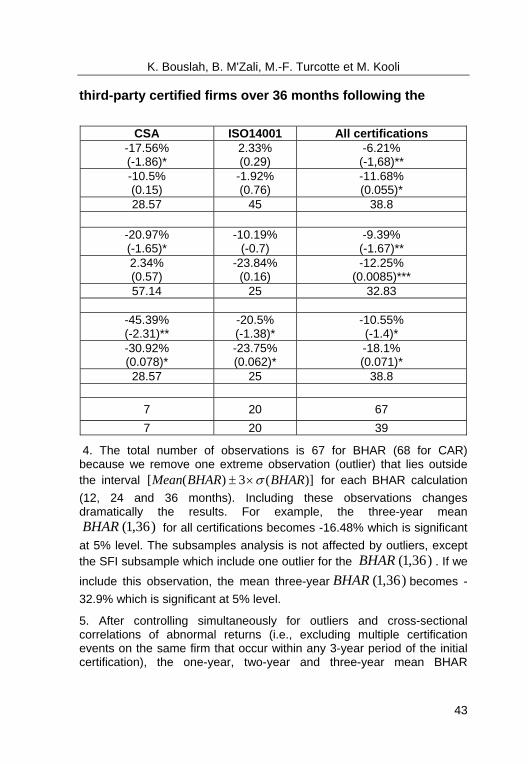
K. Bouslah, B. M'Zali, M.-F. Turcotte et M. Kooli
43
third-party certified firms over 36 months following the
CSA ISO14001 All certifications
-17.56% (-1.86)*
2.33% (0.29)
-6.21% (-1,68)**
-10.5% (0.15)
-1.92% (0.76)
-11.68% (0.055)*
28.57 45 38.8
-20.97% (-1.65)*
-10.19% (-0.7)
-9.39% (-1.67)**
2.34% (0.57)
-23.84% (0.16)
-12.25% (0.0085)***
57.14 25 32.83
-45.39% (-2.31)**
-20.5% (-1.38)*
-10.55% (-1.4)*
-30.92% (0.078)*
-23.75% (0.062)*
-18.1% (0.071)*
28.57 25 38.8
7 20 67 7 20 39
4. The total number of observations is 67 for BHAR (68 for CAR) because we remove one extreme observation (outlier) that lies outside the interval )](3)([ BHARBHARMean σ×± for each BHAR calculation (12, 24 and 36 months). Including these observations changes dramatically the results. For example, the three-year mean
)36,1(BHAR for all certifications becomes -16.48% which is significant at 5% level. The subsamples analysis is not affected by outliers, except the SFI subsample which include one outlier for the )36,1(BHAR . If we
include this observation, the mean three-year )36,1(BHAR becomes -32.9% which is significant at 5% level.
5. After controlling simultaneously for outliers and cross-sectional correlations of abnormal returns (i.e., excluding multiple certification events on the same firm that occur within any 3-year period of the initial certification), the one-year, two-year and three-year mean BHAR
The Impact of Forest Certification on Firm Financial Performance in Canada and the U.S.
44
estimates for all certification are negative (-5.65%, -8.63%, and -7.28%, respectively). Only the one-year mean BHAR estimate is marginally significant. The corresponding median values are also negative, but only the two-year median BHAR estimate of -11.67% is significant at the 5% level. The subsamples analysis shows that the one-year, two-year and three-year mean (median) BHAR estimates experienced by FSC certified firms are all positive, but insignificant. The one-year and two-year mean (median) BHAR estimates experienced by SFI certified firms are -14.52% (-15.15%), and -14.04% (-12.04%), respectively. The one-year mean and the two-year median BHAR estimates earned by SFI certified firms are marginally significant, whereas the two-year mean BHAR estimate is significant at the 5% level. The three-year mean (median) BHAR estimates of -32.3% (-28.88%) experienced by ISO14001 certified firms are significant. The results for CSA certified firms remain unchanged, except that the significance level decreases markedly since this subsample includes only 2 firms.
At 12 and 24 months after the certification, the mean BHAR estimates are significantly negative (-6.21% and -9.39%, respectively). At 36 months after the certification, the mean BHAR estimate is also negative (-10.55%) but marginally significant. The corresponding median values show a similar trend. As when the financial performance is measured using CAR, the results using BHAR support our first hypothesis highlighting a negative relationship between FP and EP measured by certification. Forest certification has, on average, a negative impact on firm financial performance.
Table VII also reports the results of buy-and-hold abnormal return (BHAR) over 36 months following the certifications announcements month for each certification program separately. At 36 months after the certification, the mean BHAR estimate of 19.32% earned by FSC certified firms is marginally significant. Although positive, the corresponding median value of 13.73% is not significant. The negative one-year mean BHAR estimate of -0.42% and the positive two-year mean BHAR estimate of 2.35% earned by FSC certified firms following the certification are not significant.
K. Bouslah, B. M'Zali, M.-F. Turcotte et M. Kooli
45
Similar to the results shown in table VI in which only FSC certification is associated with some positive numbers, the results of table VII show that SFI, CSA and ISO14001 certifications are associated with negative mean BHAR estimates which are significant in some cases. For example, the one-year, two-year and three-year mean BHAR estimates experienced by SFI certified firms are all negative (-8.83%, -8.46% and -12.87%, respectively) but not significant. CSA certified firms have experienced significantly negative mean BHAR estimate over 36 months following the certification (-45.39%). The one-year and two-year mean BHAR estimates of -17.56% and -20.97% earned by CSA certified firms are only marginally significant. ISO14001 certified firms have also experienced negative mean BHAR estimate over 36 months following the certification (-20.5%) which is marginally significant. The one-year and two-year mean BHAR estimates of 2.33% and -10.19% earned by ISO14001 certified firms are not significant.
Overall, the results reported in table VII provide some supports to our second hypothesis (H2). The impact of forest certification on firm financial performance, as measured by BHAR, depends on who grants the certification since only industry-led certification (SFI, CSA, and ISO14001) are penalized by financial markets. 36 months after the certification, SFI, CSA, and ISO14001 certified firms have experienced negative mean (median) BHAR estimates. Over the same period, only FSC certified firms have experienced positive, although not significant, mean (median) BHAR estimates. Again, the NGOs-led FSC certification is not penalized by financial markets. Controlling simultaneously for outliers and cross-sectional correlations of abnormal returns (i.e., excluding multiple certification events on the same firm that occur within any 3-year period of the initial certification) does not alter the substantive results of this article.
The findings regarding the second hypothesis lead us to ask an important question: which certification program should managers choose for their firms? Managers might have several reasons to discriminate between certification programs if they decide to adopt the certification. In their survey on a sample of Canadian
The Impact of Forest Certification on Firm Financial Performance in Canada and the U.S.
46
firms, Takahashi et al. (2003) find that most Canadian firms adopt the FSC certification for their international markets because of its higher credibility at the international level. ISO14001 and CSA certifications are used only for domestic markets. Overall, the results of Takahashi et al. (2003) show that reduction of production costs, increased demand for certified products, the likelihood to attract “environmentally responsible” investors and community pressures are the main raisons for Canadian firms to adopt certification.
47
Conclusion The purpose of this paper is to propose a typology of forest certifications and to examine empirically their impact on firm financial performance in Canada and the U.S. Specifically, we analyzed the market reaction around the dates of the third-party forest certification announcements as well as the impact of forest certification on the longer-run ex-post firm financial performance. The main question is whether there is a “green premium” for certified firms and whether or not this “green premium” depends on who grants the certification. Third-party forest certification is used as a measure (proxy) for environmental performance. Certification is conceived as a signal sent by certified firms to the financial market. Based on an event study methodology, we analyzed the short-run and the long-run stock price performance.
Our typology distinguishes between certification led and financed by the industry and certification led by NGOs and financed by private foundations. Regarding the relationship between EP and FP, our conclusion highlights a difference between the short-run and long-run results. The results of short-run event returns indicate that forest certification does not have any significant impact on firm financial performance regardless of the certification system carried out by firms. In contrast, the long-run post-event abnormal returns suggest that forest certification has, on average, a negative impact on firm financial performance. This finding supports a negative relationship between environmental performance, as measured by certification, and financial performance. Forest certification would not be profitable or more precisely the expected benefits of certification relative to its associated costs have not been realized (i.e., recognized by the market). However, in the long-run the financial impact of forest certification depends on who grants the certification since only industry-led certification (SFI, CSA and ISO14001) are penalized by financial markets. The NGOs-led FSC certification is not penalized. When the financial performance is measured using CAR or BHAR, we get virtually the same result. 36 months after the certification, only FSC certified firms have experienced
The Impact of Forest Certification on Firm Financial Performance in Canada and the U.S.
48
positive mean CAR estimate, although not significant, and a marginally significant positive mean BHAR estimate. Over the same period, SFI, CSA, and ISO14001 certified firms have experienced negative mean CAR and BHAR estimates that are significant in many cases. This evidence suggests that managers should engage their firms in certification recognized and supported by environmental groups and that investors should prefer FSC certified firms.
The findings of this paper suggest possible directions for future research. First, one potential extension of our work is to examine the operating performance of certified firms. Second, future research should examine the impact of FSC, SFI and CSA certifications on environmental performance as Barla (2007) does for ISO14001 certification. In fact, the underperformance of ISO14001 certified firms shown in this study could be partially explained by the findings of Barla (2007) who shows that ISO14001 certification does not significantly impact environmental performance of certified plants in Quebec’s pulp and paper industry. Finally, since certification has appeared in almost every major industry targeted by NGOs (e.g., chemical, mining, apparel and footwear), it is interesting to see whether certifications in these industries are priced by financial markets.
49
References Anderson, R. C., and E. N. Hansen: 2004, ‘Determining Consumer Preferences For Ecolabeled Forest Products: An Experimental Approach’, Journal of Forestry 102(4), 28–32.
Aupperle, K. E., A. B. Carroll and J. D. Hatfield: 1985, ‘An empirical examination of the relationship between corporate social responsibility and profitability’, Academy of Management Journal 28(2), 446-463.
Barber, B.M., and J. D. Lyon: 1997, ‘Detecting long-run abnormal stock returns: the empirical power and specification of test statistics’, Journal of Financial Economics 43(3), 341–372.
Barla, P.: 2007, ‘ISO 14001 certification and environmental performance in Quebec’s pulp and paper industry’, Journal of Environmental Economics and Management 53(3), 291–306.
Brav, A., C. Geczy and P. Gompers: 2000, ‘Is the abnormal return following equity issuance anomalous? ’, Journal of Financial Economics 56(2), 209–249.
Campbell, J. Y., A. W. Lo and A. C. Mackinlay: 1997, The Econometrics of Financial Markets, (Princeton University Press, New Jersey), pp.149-180.
Carroll, A. B.: 1999, ‘Corporate Social Responsibility: Evolution of a Definitional Construct’, Business & Society 38(3), 268-295.
Carroll, A. B.: 2000, ‘A Commentary and an Overview of Key Questions on Corporate Social Performance Measurement’, Business & Society 39(4), 466-478.
Cashore, B.: 2002, ‘Legitimacy and the privatization of Environmental Governance: How Non-State Market-Driven (NSMD) Governance Systems Gain Rule-Making Authority’, Governance 15(4), 503-529.
Cochran, P. L. and R. A. Wood: 1984, ‘Corporate Social Responsibility and Financial Performance’, Academy of Management Journal 27(1), 42-56.
The Impact of Forest Certification on Firm Financial Performance in Canada and the U.S.
50
Fama, E. F.: 1998, ‘Market efficiency, long-term returns, and behavioral finance’, Journal of Financial Economics 49(3), 283-306.
Fama, E. F. and R. K. French: 1993, ‘Common risk factors in the returns on stocks and bonds’, Journal of Financial Economics 33(1), 3-56.
Frooman, J.: 1997, ‘Socially irresponsible and illegal behavior and shareholder wealth: a meta-analysis of event studies’, Business & Society 36(3), 221-249.
Gereffi, G., R. G. Johnson and E. Sasser: 2001, ‘The NGO-industrial complex’, Foreign Policy 125, 56-65.
Griffin, J. J. and J. F. Mahon: 1997, ‘The Corporate Social Performance and Corporate Financial Performance Debate: Twenty-five years of incomparable research’, Business & Society 36(1), 5-31.
Hamilton, J. T.: 1995, ‘Pollution as News: Media and Stock Market Reaction to the Toxics Release Inventory Data’, Journal of Environmental Economics and Management 28(1), 98-113.
Haener, M. K. and M. K. Luckert: 1998, ‘Forest Certification: Economic Issues and Welfare Implications’, Canadian Public Policy 24(s2), 83-94.
Holman, W.R., J. R. New and D. Singer: 1990, ‘The impact of corporate social responsiveness on shareholder wealth’, in L. Preston (eds.), Corporation and Society Research: Studies in Theory and Measurement, (Greenwich, CT), pp. 265-280.
Jones, R. and A. J. Murrel: 2001, ‘Signaling Positive Corporate Social performance’, Business & Society 40(1), 59–78.
Klassen, R. D. and C. P. McLaughlin: 1996, ‘The Impact of Environmental Management on Firm Performance’, Management Science 42(8), 1199-1214.
K. Bouslah, B. M'Zali, M.-F. Turcotte et M. Kooli
51
Kothari, S.P. and J. B. Warner: 2006, ‘Econometrics of Event Studies’, in E. Eckbo (eds.), Handbook of Corporate Finance: Empirical Corporate Finance, (Elsevier, North Holland), pp. 3-32.
Kothari, S.P. and J. B. Warner: 1997, ‘Measuring long-horizon security performance’, Journal of Financial Economics 43(3), 301-339.
Loughran, T. and J. R. Ritter: 2000, ‘Uniformly least powerful tests of market efficiency’, Journal of Financial Economics 55(3), 361-389.
Lyon, J., B. Barber and C. Tsai: 1999, ‘Improved methods for tests of long-run abnormal stock returns’, Journal of Finance 54(1), 165–201.
Margolis, J. D. and J. P. Walsh: 2003, ‘Misery loves companies: rethinking social initiatives by business’, Administrative Science Quarterly 48(2), 268-305.
McGuire, J. B., A. Sundgren and T. Schneeweis: 1988, ‘Corporate Social Responsibility and Firm Financial Performance’, Academy of Management Journal 31(4), 854-872.
McWilliams, A. and D. Siegel: 1997, ‘Event studies in management research: Theoretical and empirical issues’, Academy of Management Journal 40 (3), 626-657.
McWilliams, A. and D. Siegel: 2000, ‘Corporate social responsibility and financial performance: correlation or misspecification?’, Strategic Management Journal 21(5) 603-609.
McWilliams, A. and D. Siegel: 2001, ‘Corporate social responsibility: a theory of the firm perspective’, Academy of Management Review 26(1), 117-127.
Meidinger, E., C. Elliot and G. Oesten: 2003, ‘The Fundamentals of Forest Certification’, in E. Meidinger, C. Elliot and G. Oesten (eds.), Social and Political Dimensions of Forest Certification, (Remagen-Oberwinter, Germany), pp. 3-26.
The Impact of Forest Certification on Firm Financial Performance in Canada and the U.S.
52
Mitchell, M. and E. Stafford: 2000, ‘Managerial decisions and long-term stock price performance’, Journal of Business 73(3), 287–329.
Moore, G.: 2001, ‘Corporate Social and Financial Performance: An Investigation in the U.K. Supermarket Industry’, Journal of Business Ethics 34(3-4), 299-315.
Orlitsky, M. and J. D. Benjamin: 2001, ‘Corporate Social Performance and Firm Risk: A meta-analytic Review’, Business & Society 40(4), 369-396.
Orlitsky, M., F. L. Schmidt and S. L. Rynes: 2003, ‘Corporate social and financial performance: a meta-analysis’, Organization Studies 24(3), 403–441.
Ozanne, L. K. and R. P. Volsky: 1997, ‘Willingness to Pay for Environmentally Certified Wood Products: A Consumer Perspective’, Forest products journal 47(6), 39-48.
Pava, M. L. and J. Krausz: 1996, ‘The Association Between Corporate Social-Responsibility and Financial Performance: The Paradox of Social Cost’, Journal of Business Ethics 15(3), 321-357.
Preston, L. E. and D. P. O’Bannon: 1997, ‘The Corporate Social-Financial Performance Relationship’, Business & Society 36(4), 419-429.
Roman, M. R., S. Hayibor and B. R. Agle: 1999, ‘The Relationship Between Social and Financial Performance: Repainting a Portrait’, Business & Society 38(1), 109-125.
Shane, P. B. and B. H. Spicer: 1983, ‘Market Response to Environmental Information Produced Outside the Firm’, Accounting Review 58(3), 521-538.
Stanwick, P. A. and S. D. Stanwick: 1998, ‘The Relationship Between Corporate Social Performance, and Organizational Size, Financial Performance, and Environmental Performance: An Empirical Examination’, Journal of Business Ethics 17(2), 195-204.
K. Bouslah, B. M'Zali, M.-F. Turcotte et M. Kooli
53
Stevens, J., A. Mubariq and S. Ruddell: 1998, ‘Forest Products Certification: A Survey of Manufacturers’, Forest products journal 48(6), 43-49.
Takahashi, T., G. C. Van Kooten and I. Vertinsky: 2003, ‘Why Might Forest Companies Certify? Results from a Canadian Survey’, International Forestry Review 5(4), 329-337.
Teoh, S.H., I. Welch and C. P. Wazzan: 1999, ‘The Effect of Socially Activist Investment Policies on the Financial Markets: Evidence from the South African Boycott’, Journal of Business 72(1), 35-89.
Turcotte, M-F. and B. M’Zali, 2004: ‘L’industrie financière et les fonds responsables : Tutti frutti et devenir’, in D-G. Tremblay and D. Rolland (eds.), Responsabilité sociale d’entreprise et finance responsable : Quels enjeux ?, Presse de l’université de Québec, Québec, pp. 95-105.
Turcotte, M-F., S. Bellefeuille and F. Hond: 2007, ‘Gildan Inc: Influencing Corporate Governance in the Textile Sector’, Journal of Corporate Citizenship 27, 23-36.
Ullmann, A. A.: 1985, ‘Data in search of a theory: A critical examination of the relationship among social performance, social disclosure and economic performance of US firms’, Academy of Management Review 10, 540-577.
Vance, S.: 1975, ‘Are socially responsible corporations good investment risks?’, Academy of Management Review 64, 18-24.
Waddock, S. A. and S. B. Graves: 1997, ‘The Corporate Social Performance-Financial Performance Link’, Strategic Management Journal 18(4), 303-319.
White, M. A. Investor Response to the Exxon Valdez Oil Spill. Online Scholarship Initiative, Alderman Library, University of Virginia Charlottesville, VA, 1996. http://etext.lib.virginia.edu/osi
Wright, P. and S. P. Ferris: 1997, ‘Agency conflict and corporate strategy: the effect of divestment on corporate value’, Strategic Management Journal 18(1), 77-83.


