

The State of Iowa: Economy and Budget Update
By Randy BauerBudget Director
State of Iowa


Economic pressures continue for all states
• Reduced State Revenues• Corporate Tax Receipts• Personal Tax Receipts• Sales Tax Receipts• Inheritance/Estate Tax Receipts
• Reduced State Revenues• Corporate Tax Receipts• Personal Tax Receipts• Sales Tax Receipts• Inheritance/Estate Tax Receipts
• Higher Expenditures• Medicaid Costs• Homeland Security• Education• Corrections• Employee Salaries• Employee Healthcare
Costs
• Higher Expenditures• Medicaid Costs• Homeland Security• Education• Corrections• Employee Salaries• Employee Healthcare
Costs
StateBudget
States face difficult budgetary choices
• Increase Revenues
• Reduce Expenditures
• Use Reserves

Tax Revenue Decline Much Worse Than Economy Might Suggest
State Tax Rev enue Has Fallen Far More Sharply Relativ e to Ec onomyThan in 1980-82 and 1990-91 Rec es s ions
1978 1980 1982 1984 1986 1988 1990 1992 1994 1996 1998 2000 2002
State F is cal Y ear
Sources : U .S. Bureau of Ec onom ic Analy s is , U .S. Bureau of the C ens us , Signif ic ant Features of Fis cal Federalism -1984 (AC IR ), Fis c al Survey of the States (N GA), R oc kef eller Ins t itute of Gov ernm ent
-8
-6
-4
-2
0
2
4
6
% C
hang
e
R eal GD P per capita, c alendar y ear in whic h f is c al y ear began R eal s tate tax rev enue per capita, adjus ted f or legis lat ion
-7.4
-2.0
-3.0-3.5
-1.8
-0.7
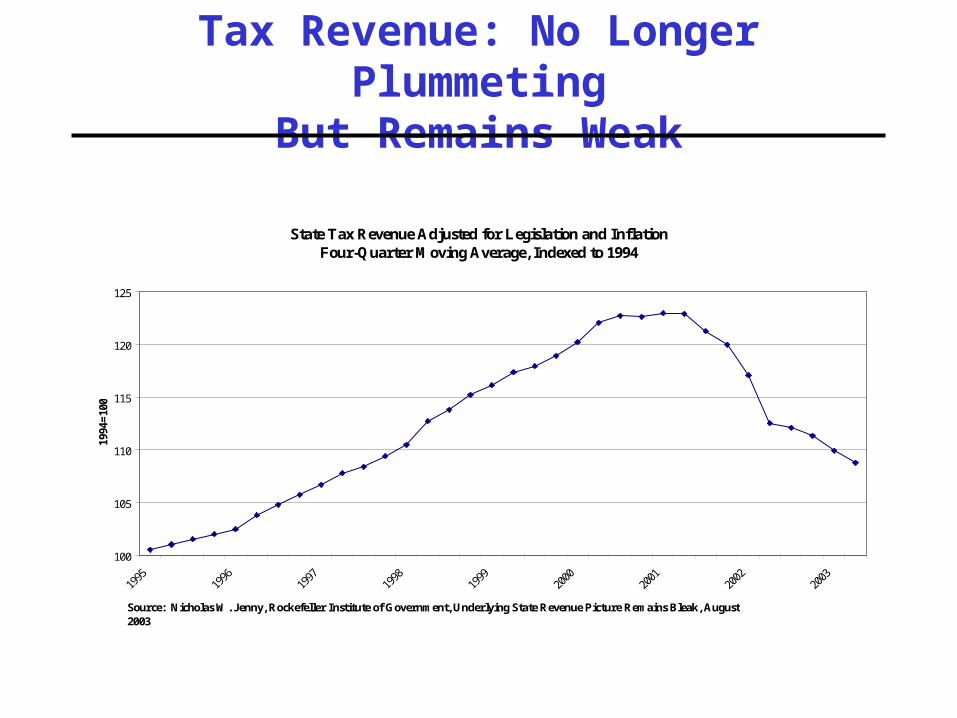
Tax Revenue: No Longer PlummetingBut Remains Weak
State Tax Revenue Adjusted for Legislation and InflationFour-Quarter Moving Average, Indexed to 1994
100
105
110
115
120
125
Source: Nicholas W. Jenny, Rockefeller Institute of Government, Underlying State Revenue Picture Remains Bleak, August 2003
1994
=10
0

Iowa – worst revenue “growth” in 50 years

State Balances are Declining
Source: National Association of State Budget Officers

Source: National Association of State Budget Officers
Only 10 States Have Adequate Balances

States Borrowing Record Amounts
• $224 billion during FY 2003
• Double the amount of two years ago
• “Follow the federal leader” tactics?
• Stall tactic?
• Even this market has limits
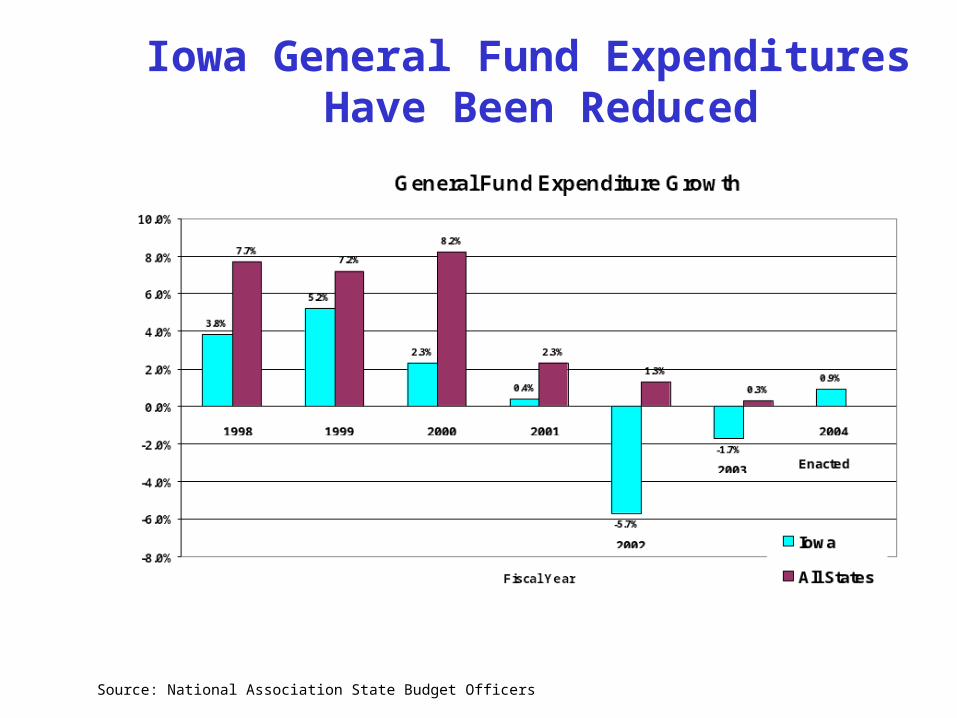
Iowa General Fund Expenditures Have Been Reduced
Source: National Association State Budget Officers

Over 60 percent of the State’s General Fund budget goes toward education
FY2003 General Fund Expenditures
Economic Development,
Ag, Other4%
Property Tax Relief
8%Safe Communities
10%
K-12 Education46%
Higher Education
15%
Health and Family Services
17%
Source: Iowa Department of Management

• Fund balances: drawn down from more than 10% of expenditures in FY 2001 to 1.3% of expenditures at end of FY 2003; 16 states now have balances of <1%
• Special funds: At least 23 states tapped capital, highway, other funds for FY 2003, and 29 for FY 2004; at least 16 have used tobacco settlement money
• Spending cuts: 31 states cut for FY 2004 in some fashion; Medicaid cost containment planned in many states (but how real?)
• Tax increases:– FY 2003: >= 1% in 16+ states, for $6.7 billion, 40% of $ was
cigarette taxes; a few large or broad-based tax increases – KS, IN, MA, NJ, TN – but these were exceptions, not the rule
– FY 2004: more income and sales tax increases, $6.9 billion tax increase in total (see next page)
Source: Donald Boyd, Director, Rockefeller Institute of Government, SUNY
State Responses So Far
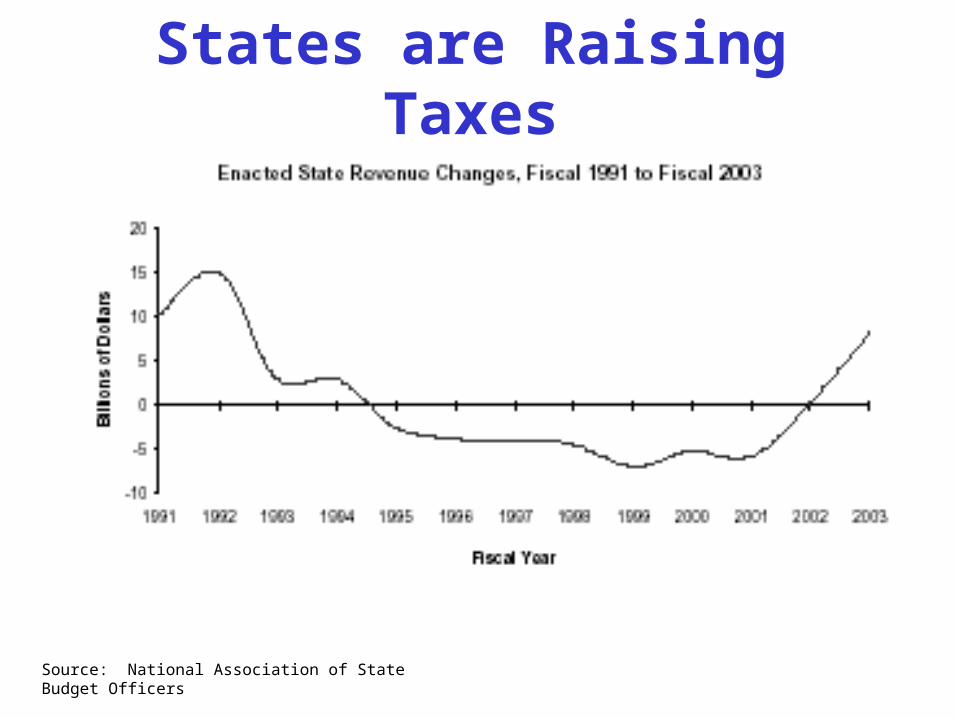
States are Raising Taxes
Source: National Association of State Budget Officers

0.10
0.11
0.12
0.13
0.14
0.15
0.16
1970 1975 1980 1985 1990 1995 2000 2005 2010
The Tax Burden: Rising Expectations?
(Ratio of personal taxes to personal income)
Source: Global Insight
Gimmicks and Tricks• Payment shifts
– Texas delayed $2 billion over 2 years
– Minnesota delayed $700 million
– New Jersey $300 million school aid payment delayed
– Kansas $200 million delayed $170 million advanced deadline for payment of property taxes
• Sit on bills– Illinois $1.5 billion this year ($2 billion last year)
• Asset sales and leasebacks
• Draining trusts and other funds – Florida $1.3 billion

When Will Finances Of State Governments Recover?
• Economy currently at least as weak as state government forecasters expected
• Additional near-term risks for income taxes, related to financial markets
• Will be many years before markets, and associated income, recover to 2000 and 2001 levels
• Continued erosion of states’ sales taxes• Medicaid and K-12 education spending pressures• Many states solved 2003-04 problems in ways that make
2004-05 and 2005-06 much worse
Good times for most states probably at least 2-3 years away
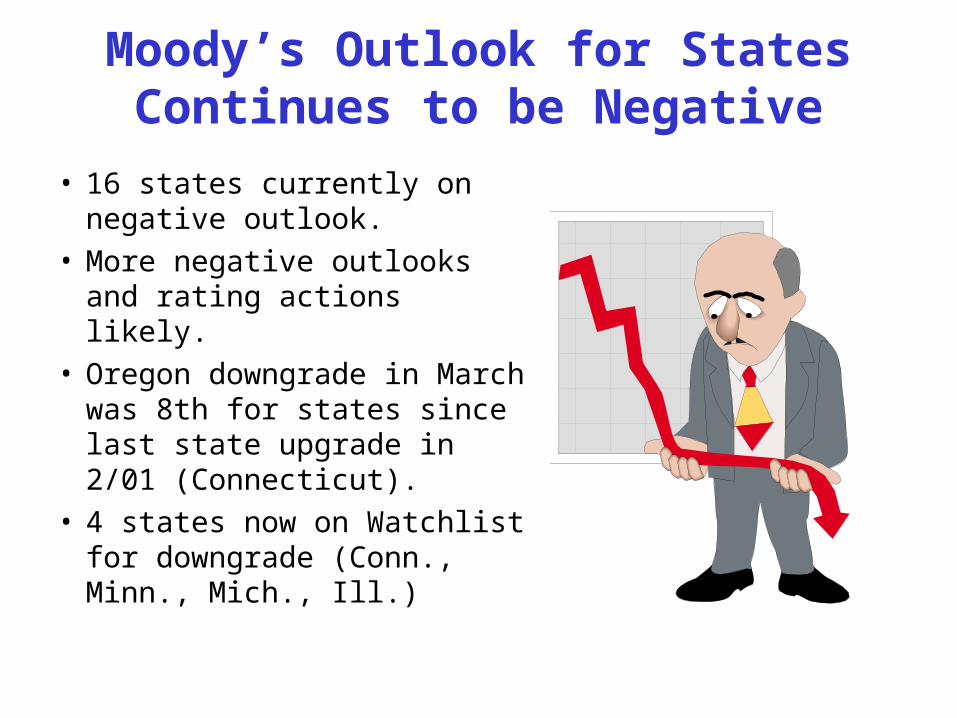
Moody’s Outlook for StatesContinues to be Negative
• 16 states currently on negative outlook.
• More negative outlooks and rating actions likely.
• Oregon downgrade in March was 8th for states since last state upgrade in 2/01 (Connecticut).
• 4 states now on Watchlist for downgrade (Conn., Minn., Mich., Ill.)

All States:Structural Balance Will Be Elusive
• Spending is on a higher growth plane and is outstripping revenue growth.
• Budget problems will persist into FY05:– FY04 have large budget gaps due to
substantial use on non-recurring resources to balance FY03.
• Pace of economic recovery will be key, but modest recovery
forecasts will leave a difficult FY04 and FY05.• Higher rated credits will restore structural balance and
rebuild reserve funds quickly.• Further credit deterioration among states is likely. • Problems beginning to be pushed down to local governments.


