

Rice University
Small Cells and Mobile Clients: a Measurement Study of anOperational Network
by
Sharan Naribole
A Thesis Submittedin Partial Fulfillment of theRequirements for the Degree
Master of Science
Approved, Thesis Committee:
Dr. Edward W. Knightly, ChairProfessor of Electrical and Computer En-gineering
Dr. Behnaam AazhangJ.S. Abercrombie Professor of Electricaland Computer Engineering
Dr. Lin ZhongProfessor of Electrical and Computer En-gineering
Houston, TexasDecember 2014
Abstract
Small Cells and Mobile Clients: a Measurement Study of an Operational Network
by
Sharan Naribole
Small cells address the increasing traffic demands from mobile users
and target improved coverage and capacity and better quality of experi-
ence to users. This thesis presents the first large-scale measurement study
of voice and data service performance of an operational small cell cel-
lular network. Nation-wide fine-grained voice service measurements are
analyzed to gain insight into the nature and implications of handovers
on voice service performance. A new statistical correlation framework to
find the statistical dependency between two events across multiple cells is
proposed. The effectiveness of the proposed framework is demonstrated
using data service quality measurements of a relatively higher traffic de-
mand location. This in-depth study targets a better understanding of the
advantages and trade-offs of deploying small cells in operational networks
and provides a foundation for future studies of mobility management and
development of techniques for improvement of service performance.

Acknowledgements
A great number of people have contributed to the production of this
dissertation. I owe my gratitude to all those people who have made this
dissertation possible and because of whom my Masters experience has
been one that I will cherish forever.
My deepest gratitude is to my advisor, Dr. Edward Knightly. I have
been amazingly fortunate to have an advisor who gave me the freedom to
explore on my own, and at the same time the guidance to recover when
my steps faltered. Dr. Knightly taught me how to question thoughts and
express ideas. His patience and support helped me overcome many crisis
situations and finish this dissertation. I hope that one day I would become
as good an advisor to my students as Dr. Knightly has been to me.
I would also like to express my gratitude to the members of my com-
mittee, Dr. Behnaam Aazhang and Dr. Lin Zhong, for their time and
eort in reviewing my work, and for their invaluable support throughout
my Masters examination.
A special thanks to Adriana Flores for providing invaluable guidance
and inspiration to succeed in my Masters defense. I would like thank the
RNG group members and department friends for reviewing my work and
providing excellent feedback during the practice sessions.
Many friends have helped me stay sane through these two years. Their
support and care helped me overcome setbacks and stay focused on my

iv
graduate study. I greatly value their friendship and I deeply appreciate
their belief in me. I am also grateful to the Indian Students at Rice (ISAR)
organization that helped me adjust to a new country.
Most importantly, none of this would have been possible without the
love and patience of my family. My immediate family to whom this dis-
sertation is dedicated to, has been a constant source of love, concern,
support and strength all these years. I would like to express my heart-felt
gratitude to my family. My extended family has aided and encouraged
me throughout this endeavor. I warmly appreciate the generosity and
understanding of my extended family.
Contents
Abstract ii
Acknowledgements iii
1 Introduction 1
2 Heterogeneous Cellular Networks and Handovers 5
2.1 Cellular Network Architecture . . . . . . . . . . . . . . . . . . . . . . 5
2.2 Handover Procedures . . . . . . . . . . . . . . . . . . . . . . . . . . . 7
2.3 Mobility Management and Handover Challenges . . . . . . . . . . . . 10
3 Voice Service 12
3.1 Data Sets . . . . . . . . . . . . . . . . . . . . . . . . . . . . . . . . . 13
3.2 User Mobility and Handover Analysis . . . . . . . . . . . . . . . . . . 14
3.3 Additional Handovers . . . . . . . . . . . . . . . . . . . . . . . . . . . 19
3.4 Relationship between Handovers and Call Duration . . . . . . . . . . 22
3.5 Impact on Service Performance . . . . . . . . . . . . . . . . . . . . . 24
4 Data Service 28
4.1 Data Set . . . . . . . . . . . . . . . . . . . . . . . . . . . . . . . . . . 29
4.2 Methodology . . . . . . . . . . . . . . . . . . . . . . . . . . . . . . . 29
4.3 Macro Cell - Small Cell Interactions . . . . . . . . . . . . . . . . . . . 35
4.4 Data Retainability . . . . . . . . . . . . . . . . . . . . . . . . . . . . 36
5 Related Work 38

vi
6 Summary 40
References 42

List of Figures
2.1 UMTS Cellular Network Architecture and Radio Bearer Connections 6
2.2 Small cells overlaid by macro cell . . . . . . . . . . . . . . . . . . . . 7
2.3 Handover event illustration for the case of macro cell as serving cell
and small cell as target cell. . . . . . . . . . . . . . . . . . . . . . . . 9
3.1 Cumulative Distribution of the total number of handovers during a call 16
3.2 Cumulative Distribution of the normalized number of handovers of
different types during a mobile call . . . . . . . . . . . . . . . . . . . 17
3.3 Cumulative distribution of the handover percentage type for mobile calls 18
3.4 Cumulative Distribution of the number of unique cells traversed during
a mobile call . . . . . . . . . . . . . . . . . . . . . . . . . . . . . . . . 19
3.5 Mean extra handovers percentage as a variation of number of handovers
in macro only network . . . . . . . . . . . . . . . . . . . . . . . . . . 22
3.6 Comparison of stationary calls and mobile calls for percentile values of
normalized airtime calls. . . . . . . . . . . . . . . . . . . . . . . . . . 23
3.7 Variation of the mean number of handovers with airtime . . . . . . . 24
3.8 Cumulative distribution of Final Cell Time for the different mobility
classes . . . . . . . . . . . . . . . . . . . . . . . . . . . . . . . . . . . 26
4.1 Example of an event series showing time-of-day effects and weekday
versus weekend effect for a duration of one week and the residual sig-
nal after applying robust SVD -based filter. The y-axis is absent for
proprietary reasons. . . . . . . . . . . . . . . . . . . . . . . . . . . . . 31
4.2 Methodology . . . . . . . . . . . . . . . . . . . . . . . . . . . . . . . 34

viii
4.3 Visualization of daily aggregate traffic offload to small cells during the
long period of three months. . . . . . . . . . . . . . . . . . . . . . . . 35
4.4 A snapshot of retainability and small-small handover failure percentage
for one of the small cells. The y-axis is absent for proprietary reasons. 37

List of Tables
3.1 Absolute and Relative Increase in handovers due to small cells. . . . . 21

Chapter 1
Introduction
A key technology to address the rapidly growing demand for mobile data is the
deployment of small cells overlaid by the traditional macro cellular network. Macro
cells provide blanket coverage whereas small cells infuse additional capacity at traffic
hotzones and improve coverage. Due to lower transmission power and reduced height,
the coverage areas of small cells are significantly less than macro cells.
Despite their potential performance benefits, operators are facing new technical
challenges mainly in mobility management [2, 3]. Handovers are needed to maintain
connectivity of a mobile user. The expected number of handovers during a call is
likely to increase with small cell deployment, unless the small cells locations are
chosen carefully to serve mostly static users. Simulation studies [15] have shown a
120% - 140% increase in handovers for a naive small cell deployment setting. From
the network point of view, the increase in handovers leads to an increase in the control
signaling load for eg. to the core network. None of the existing works have analysed
the increase in handovers for a data-driven/ usage based small cell deployment.
Not only is there an increase in number of handovers but also the likelihood of
handover failure due to much smaller coverage area of the small cells. The challenges
of small cells include abrupt cell boundaries [4], increased neighboring cells list [5] and

2
too early handover triggers caused by range expansion [6]. Current cellular standards
contain radio link re-establisment mechanisms to prevent call from getting dropped
even after occurrence of handover failure. However, there is no prior work on actual
call drop analysis for small cell deployments overlaid by macro cells.
Cellular operators have started deploying small cells with a focus on locations with
relatively higher traffic demand, which is mostly non normadic. The network opera-
tions team conducts manual field trials at individual sites for performance evaluation.
A large-scale assessment of small cells is needed.
This paper presents the first large-scale measurement study of voice service perfor-
mance of an operational small cell cellular network. We use a vast data set from the
cellular service provider’s operations that includes performance counters at the cell
towers, anonymized call detail records (CDR) and network topological information.
To study voice services, we utilize nation-wide fine-grained voice service mea-
surements for calls that involve at-least one small cell over their trajectory. The
measurements are collected over 14 days comprising over 500,000 calls and over 1,500
small cells. We analyze the data to gain insight into the nature and implications of
the handovers on the service quality experienced by the users.
The contributions of this thesis are as follows:
Number of Handovers. We expect the number of handovers will increase with
the deployment of small cells. However, we find a significant percentage (84.7%) of
answered calls do not involve any handovers and thus, originate and terminate at the
same small cell.
Extra Handovers. We find that 74.5% of the calls that have one or more han-
dovers with small cell deployment would have no handover in a macro only network.
As expected in a good design, all of these calls have just one extra handover intro-
duced by small cell deployment. We analyze the relationship between the relative

3
percentage increase in handovers due to small cell deployment and the number of
handovers that would take place without small cells. We find that for a user with
high number of handovers in a macro only network, the relative increase in handovers
due to small cells is negligible.
Call Drop Analysis. We define a call involving handovers as a mobile call. We
find the call drop probability is the highest for a mobile call terminating in a small
cell independent of the call duration in comparison to mobile calls terminating in
macro cell and calls terminating in small cells with no handovers. This finding can
be attributed to the abrupt cell boundaries of the small cells.
To study data services, we utilize hourly coarse-grained measurements collected
at small cells and macro cells. The measurements are collected over period of three
months. We focus on a tourist location having a relatively higher traffic demand and
user mobility. To address the demand, the service provider has deployed a relatively
higher number of small cells in the location per unit area. A total of 53 small cells and
5 macro cells were selected for the study. We analyze the traffic offloaded to the small
cells and the impact of potential factors that can disrupt the service quality requested
by the users. We employ retainability as a service performance metric as it reflects
successful termination as issued by the user. For data services, our contributions are
as follows:
Traffic Offload. We find the percentage of traffic offload to small cells to be
as large as 50.4%, a significant fraction of the total traffic load. We find the macro
cell traffic and small cell traffic have a significant positive correlation indicating the
positive impact of small cell deployment in reducing the likelihood of macro cells
entering the state of traffic congestion.
Statistical Correlation Framework. We propose a new statistical correlation
framework to find the spatial statistical dependency between two service quality met-
4
rics across multiple small cells. We demonstrate the effectiveness of our framework
through operational case studies.
The remainder of this thesis is organized as follows. In Chapter 2, we discuss the
handover procedure and challenges introduced by small cell deployment. In Chapter
3 and Chapter 4, we provide detailed performance analysis of voice service and data
service respectively. Chapter 5 reviews related work and the paper is concluded in
Chapter 6.

Chapter 2
Heterogeneous Cellular Networks and Handovers
In Section 2.1, we provide a brief overview of the heterogeneous cellular network ar-
chitecture consisting of both small cells and macro cells. In Section 2.2, we introduce
the handover procedure and the different types of handovers in a heterogeneous cel-
lular network. In Section 2.3, we outline the challenges for managing user mobility
and handovers within small cells and between small cells and macro cells.
2.1 Cellular Network Architecture
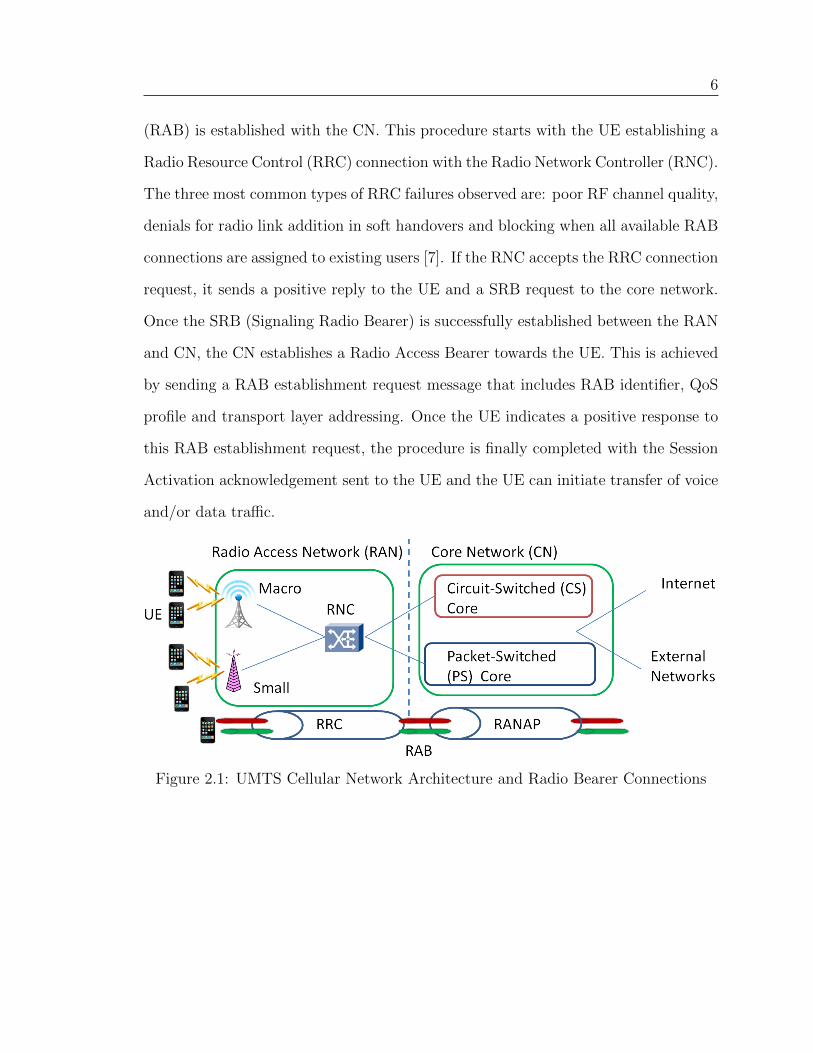
Figure 2.1 shows the UMTS cellular network architecture and the logical connections
established between the different domains of the network. The User Equipment (UE),
Radio Access Network (RAN) and Core Network (CN) form the three domains of
cellular network. The UE or mobile device communicates using the air interface to
the RAN network. The UE can either connect to a small cell or a macro cell depending
on signal strengths, available network capacity and traffic demand. The data traffic
is exchanged between UE and CN in Packet Switched (PS) mode and voice traffic is
exchanged between UE and CN in the Circuit Switched (CS) mode.
The UE can exchange traffic with the network only after a Radio Access Bearer
6
(RAB) is established with the CN. This procedure starts with the UE establishing a
Radio Resource Control (RRC) connection with the Radio Network Controller (RNC).
The three most common types of RRC failures observed are: poor RF channel quality,
denials for radio link addition in soft handovers and blocking when all available RAB
connections are assigned to existing users [7]. If the RNC accepts the RRC connection
request, it sends a positive reply to the UE and a SRB request to the core network.
Once the SRB (Signaling Radio Bearer) is successfully established between the RAN
and CN, the CN establishes a Radio Access Bearer towards the UE. This is achieved
by sending a RAB establishment request message that includes RAB identifier, QoS
profile and transport layer addressing. Once the UE indicates a positive response to
this RAB establishment request, the procedure is finally completed with the Session
Activation acknowledgement sent to the UE and the UE can initiate transfer of voice
and/or data traffic.
Figure 2.1: UMTS Cellular Network Architecture and Radio Bearer Connections
7
2.2 Handover Procedures
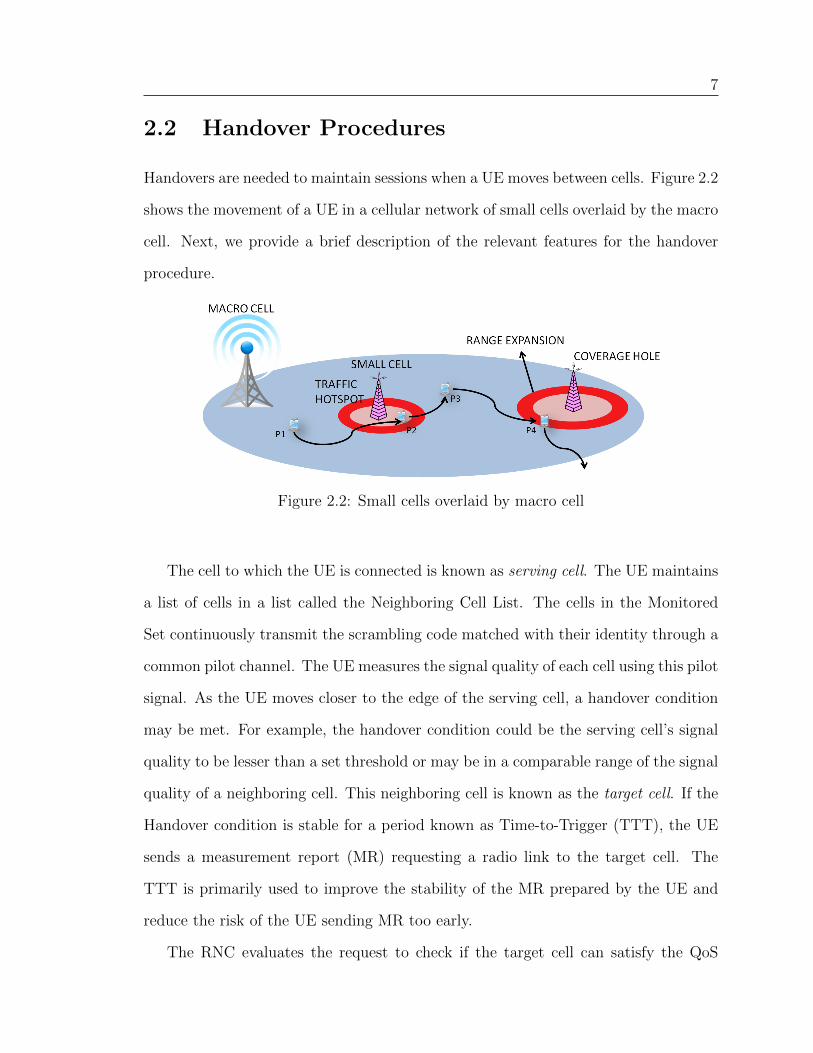
Handovers are needed to maintain sessions when a UE moves between cells. Figure 2.2
shows the movement of a UE in a cellular network of small cells overlaid by the macro
cell. Next, we provide a brief description of the relevant features for the handover
procedure.
Figure 2.2: Small cells overlaid by macro cell
The cell to which the UE is connected is known as serving cell. The UE maintains
a list of cells in a list called the Neighboring Cell List. The cells in the Monitored
Set continuously transmit the scrambling code matched with their identity through a
common pilot channel. The UE measures the signal quality of each cell using this pilot
signal. As the UE moves closer to the edge of the serving cell, a handover condition
may be met. For example, the handover condition could be the serving cell’s signal
quality to be lesser than a set threshold or may be in a comparable range of the signal
quality of a neighboring cell. This neighboring cell is known as the target cell. If the
Handover condition is stable for a period known as Time-to-Trigger (TTT), the UE
sends a measurement report (MR) requesting a radio link to the target cell. The
TTT is primarily used to improve the stability of the MR prepared by the UE and
reduce the risk of the UE sending MR too early.
The RNC evaluates the request to check if the target cell can satisfy the QoS
8
requirement of the UE. If approved, the RNC sends a Handover Command (HC)
to the UE. The condition of the UE unable to receive any signal from serving cell
as it moves farther away is called outage. We define the time interval between the
time instant when the handover condition is met and the time instant when the UE
reaches outage as the handover region between the serving cell and the target cell.
If the HC reception at the UE falls outside the handover region then the call/session
gets dropped. This is known as a handover failure. Thus, for a successful handover,
it is essential for the UE to receive HC within the Handover region.
In a network with small cells deployment, four types of handovers can occur during
a call:
• Macro-to-macro handover : Handover from one sector of a macro cell to another
sector of the same or different macro cell.
• Small-to-Small handover : Handover from one small cell to another small cell.
• Small-to-macro handover : Handover from a small cell to a sector of a macro
cell.
• Macro-to-small handover : Handover from a sector of a macro cell to a small
cell.
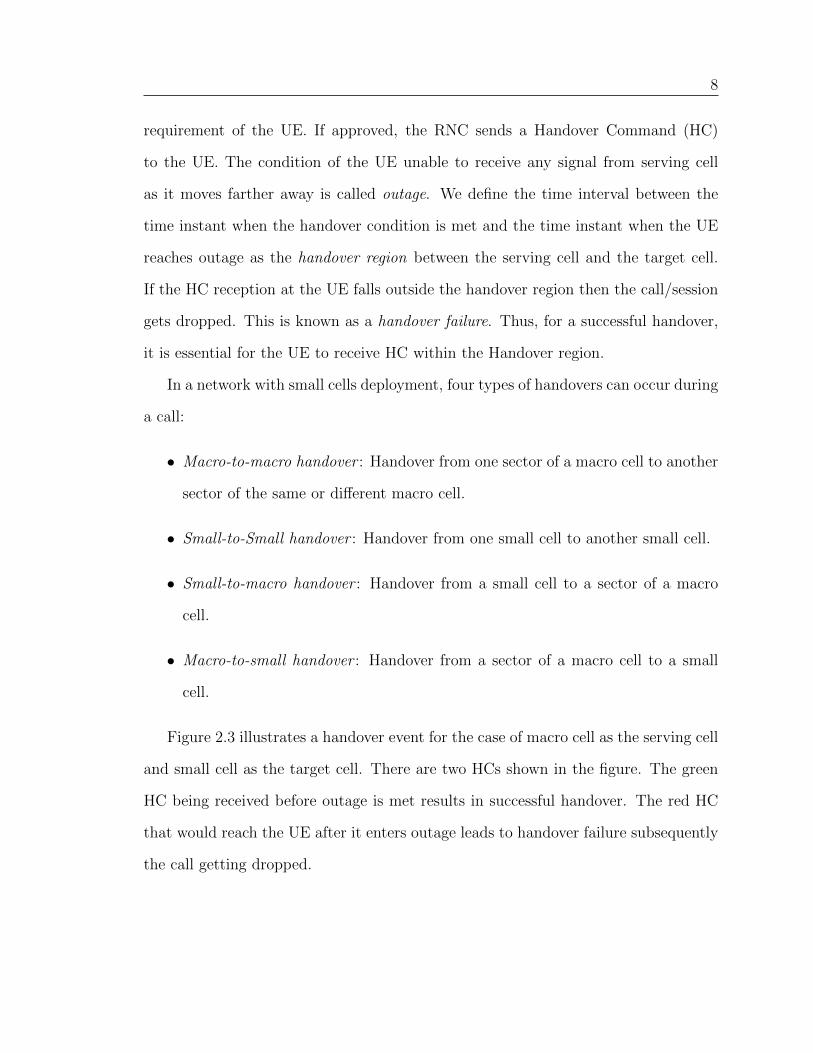
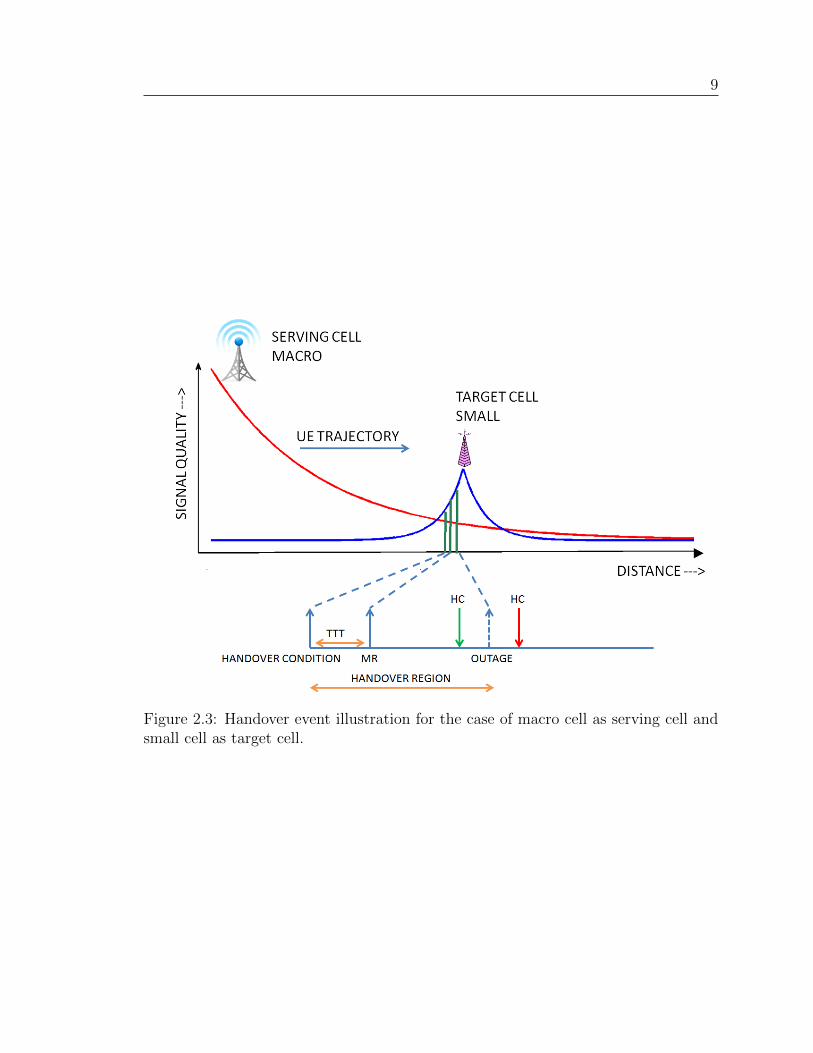
Figure 2.3 illustrates a handover event for the case of macro cell as the serving cell
and small cell as the target cell. There are two HCs shown in the figure. The green
HC being received before outage is met results in successful handover. The red HC
that would reach the UE after it enters outage leads to handover failure subsequently
the call getting dropped.
9
Figure 2.3: Handover event illustration for the case of macro cell as serving cell andsmall cell as target cell.
10
2.3 Mobility Management and Handover Challenges
We now outline the challenges related to mobility management of users and handovers
introduced by small cell deployment:
(i) Abrupt Cell Boundaries : In traditional macro cell networks, the UE typically
uses the same set of handover parameters such as TTT throughout the network. Due
to lower transmit power and smaller height than macro cell, a small cell’s path loss
curve is steeper and smaller as shown in Figure 2.3. However, the handover parameter
setting does not take into account the cell size of the serving cell and target cell
during handovers. Thus, the presence of small cells as either the serving cell or target
cell reduces the handover region compared to a macro-to-macro handover scenario.
According to this hypothesis, the small-to-small handovers have the highest chance
of failing followed by small-to-macro handovers and macro-to-small handovers.
(ii) Velocity : The length of the handover region also depends on the speed of the
UE. The UE speed estimation based on TTT scaling has been already adopted in
LTE technology [4]. Inspite of the UE speed based scaling of TTT, the worst case
scenario of a handover is that of a high-speed moving UE requesting a handover from
one small cell to another small cell.
(iii) Neighboring Cell List : With the small cell deployment, there are more num-
ber of cells in the range of the UE. To reduce call drops, all potential neighbors must
be included in the list. Otherwise, the UE will not measure the signal quality of a
target cell that provides good signal quality and may lead to handover failure. Thus,
there is an additional overhead involved in exchanging larger neighboring cell lists
between the serving cell and the UE and signal measurements reported by the UE to
the serving cell [5]. This additional overhead increases the delay in the UE receiving
handover command and thus increases the likelihood of handover failure. This chal-
lenge is applicable to all types of handover including macro-to-macro handovers due
11
to exchange of longer neighboring cell list information.
(iv) Range Expansion: The range expansion bias brings forward the trigger timing
of the handover entry condition. Consequently, the macro cell users are handed over
to the small cell much earlier. However, if the small cells and macro cells operate on
the same carrier frequency (for example, 1900 MHz), then the users in the expanded
region of small cells suffer from high interference from macro cells. Even with a robust
interference management technique, a high range expansion bias can make the signal
quality of users in the expanded region worse than the signal quality threshold. This
can potentially lead to handover failures due to too early trigger timing.
Chapter 3
Voice Service
In this section, we present our results from analyzing fine-grained voice service mea-
surements using call detail records collected from an operational cellular network
comprising both small as well as macro cells. The call detail records (also referred
to here, as CDRs) are collected over 14 days with deployments of the small/macro
cell across the whole of United States. Unless planned carefully, we expect that the
number of handovers for highly mobile users increases with the increasing number of
small cells deployed within a region. We use real-world data to understand the nature
and implications of the handovers on the service quality experienced by the users.
In Section 3.2, we present the distribution of total number of handovers and
different types of handovers (for example, small-to-small, small-to-macro) observed
using the call trajectories. In Section 3.3, we analyze the distribution of the additional
handovers introduced by small cell deployment relative to the scenario without small
cell deployment. This captures the changes introduced due to small cell deployments
in the regions. The calls that previously had a small number of handovers because of
larger coverage from a macro cell would potentially have a large number of handovers
due to smaller coverage from small cells. We study the relationship between the
number of handovers and call duration in Section 3.4. Longer calls for highly mobile

13
users are expected to have a higher number of handovers. We provide insight into
which type of handovers are dominant in a call of small duration versus call of long
duration. Finally, in Section 3.5, we analyze the impact of small cell deployments on
service performance as experienced by the users.
3.1 Data Sets
Since our objective was to study the deployment implications of small cells, we col-
lected voice CDRs (anonymized) for the calls that involved at-least one small cell over
its trajectory. The call can either originate or terminate at a small cell or a macro
cell. We exclude calls that involve only macro cells in their trajectories. Each CDR
provides detailed information about the voice call: start time of the call, originating
and terminating phone numbers, an ordered list of cells that a call traverses (also, re-
ferred to as the call trajectory), air-time or the duration of the call spent on each cell,
the switch that records the call, cause code for termination of the call, IMEI/IMSI
numbers for the calling number. We explicitly hide the originating and terminating
phone numbers and obtain anonymized CDRs for our analysis. We select the details
as described below.
(i) Start time: The start time of the call is provided in Greenwich Mean Time
(GMT). The granularity of the information is a second.
(ii) Call trajectory : It is an ordered list of cells to which the user (or, UE) was
connected within the duration of the call. This will comprise at-least one small cell
and zero or more macro cells.
(iii) Airtime for each cell : This captures the duration of an answered call at the
granularity of a second for each cell in the call trajectory. The duration for the first
cell captures the ringing time along with the time spent on that cell.
(ii) Cause code for termination of call : Each CDR is labeled with a cause code

14
for termination either it is successful call (call termination originated from the user
and normally terminated by the network), a blocked call (failed attempt and blocked
by the network either due to insufficient radio or core network resources, high inter-
ference), or a dropped call (an ongoing call abnormally terminated by the network
due to radio network issues such as handovers, uplink or downlink interference, or
radio link protocol timer expirations).
We observed an extremely high percentage of calls originating at the small cell as
compared to the macro cell. This highlights an interesting behavior from operational
deployments of small cells that the user equipment (UE) prefers a small cell due to
its better signal strength and coverage.
3.2 User Mobility and Handover Analysis
We use the trajectory of the call to calculate the number of handovers within a call,
the different types of handovers, their distributions and the unique cells traversed.
Our expectation is that the number of handovers will increase with the deployment
of small cells.
3.2.1 Total Number of Handovers
The cellular operator has deployed the small cells in a strategic manner. Locations
with high and relatively non-nomadic traffic demand are identified for the deploy-
ment. The network planning team manually evaluate the performance of individual
locations. Such field trials are dependent of local traffic patterns and wireless channel
characteristics. A large-scale assessment will allow us to study the mobility pattern
of small cell users independent of the local traffic patterns.
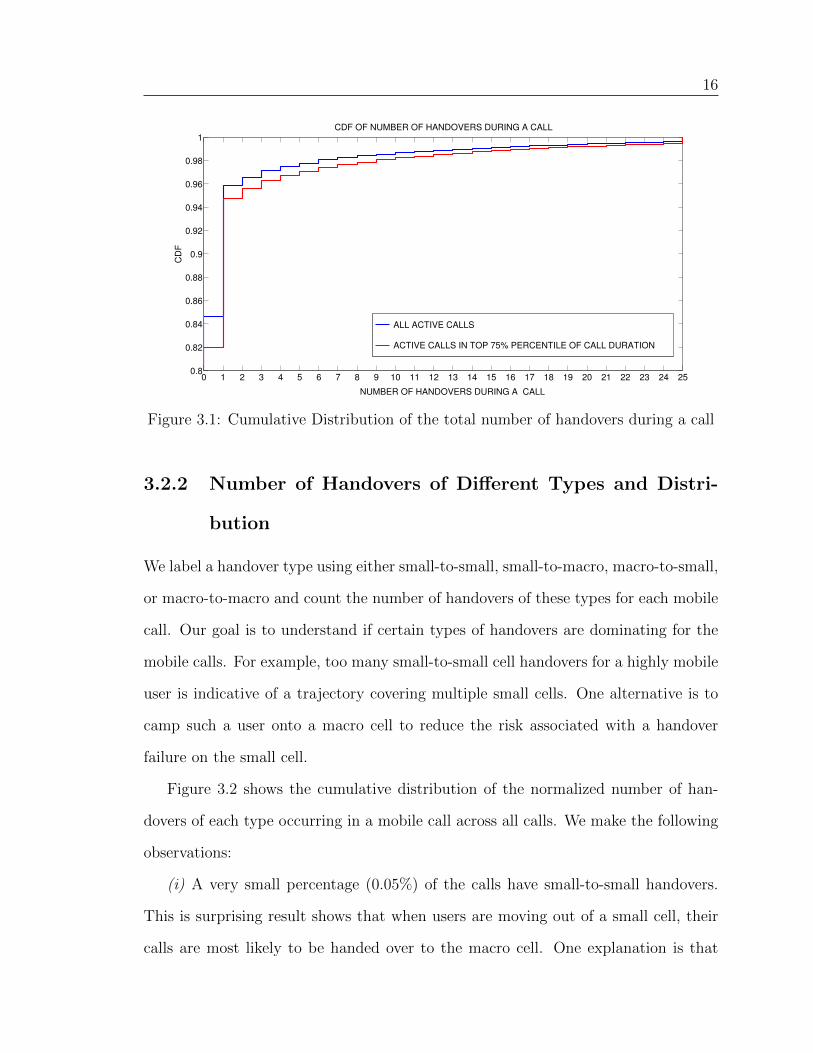
Figure 3.1 shows the cumulative distribution of the total number of handovers

15
occurring in an answered call. Recall that these answered calls involve at-least one
small cell and zero or more macro cells. Interestingly, a significant percentage (84.7%)
of the answered calls do not involve any handovers and thus, originate and terminate
at the same small cell. Thus, a high percentage of calls involving small cells being
handled solely by a single small cell throughout the call duration is a positive indicator
of the capacity and coverage impact of small cell deployment.
It might be the case that majority of the calls are having a very low call duration
leading to this high number of calls with no handovers. If the call duration is low,
then the chances of user facing handover are low. To understand further, we also plot
the cumulative distribution for the calls belonging to the top 75%-ile of call duration.
We observe only a slight decrease in the percentage of calls having no handover. The
decrease is expected as the calls considered for this case have higher call duration
and thus higher likelihood of moving outside the originating cell. We refer to such
users with zero handovers as stationary users. 11.2% of the answered calls comprises
a single handover this could either be a small-to-small, small-to-macro, or macro-to-
small cell handover.
Next, we aim to dig deeper into the mobility pattern of the users based on the calls
during which handovers occurred. We classify the answered calls into the following
categories:
(i) Stationary call : An answered call with zero handovers i.e., a single small cell
is able to handle the call.
(ii) Mobile call : An answered call during which a minimum of one handover
occurs.
16
0 1 2 3 4 5 6 7 8 9 10 11 12 13 14 15 16 17 18 19 20 21 22 23 24 250.8
0.82
0.84
0.86
0.88
0.9
0.92
0.94
0.96
0.98
1
NUMBER OF HANDOVERS DURING A CALL
CD
F
CDF OF NUMBER OF HANDOVERS DURING A CALL
ALL ACTIVE CALLS
ACTIVE CALLS IN TOP 75% PERCENTILE OF CALL DURATION
Figure 3.1: Cumulative Distribution of the total number of handovers during a call
3.2.2 Number of Handovers of Different Types and Distri-
bution
We label a handover type using either small-to-small, small-to-macro, macro-to-small,
or macro-to-macro and count the number of handovers of these types for each mobile
call. Our goal is to understand if certain types of handovers are dominating for the
mobile calls. For example, too many small-to-small cell handovers for a highly mobile
user is indicative of a trajectory covering multiple small cells. One alternative is to
camp such a user onto a macro cell to reduce the risk associated with a handover
failure on the small cell.
Figure 3.2 shows the cumulative distribution of the normalized number of han-
dovers of each type occurring in a mobile call across all calls. We make the following
observations:
(i) A very small percentage (0.05%) of the calls have small-to-small handovers.
This is surprising result shows that when users are moving out of a small cell, their
calls are most likely to be handed over to the macro cell. One explanation is that
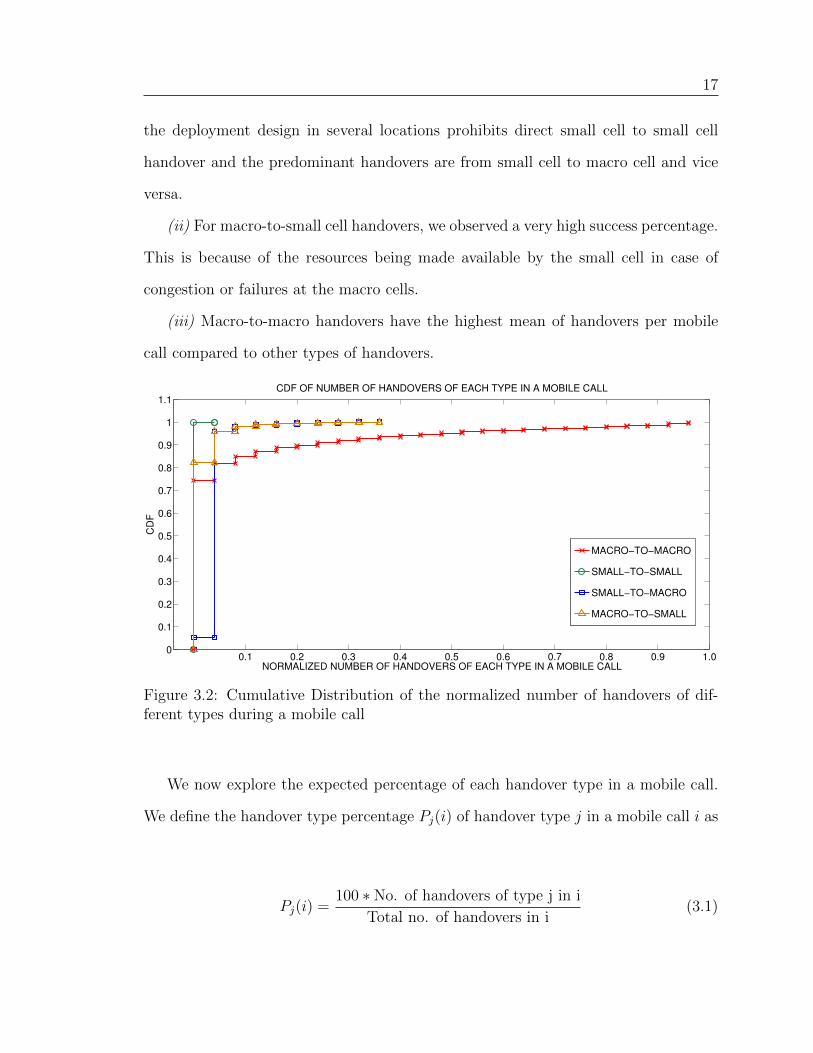
17
the deployment design in several locations prohibits direct small cell to small cell
handover and the predominant handovers are from small cell to macro cell and vice
versa.
(ii) For macro-to-small cell handovers, we observed a very high success percentage.
This is because of the resources being made available by the small cell in case of
congestion or failures at the macro cells.
(iii) Macro-to-macro handovers have the highest mean of handovers per mobile
call compared to other types of handovers.
0.1 0.2 0.3 0.4 0.5 0.6 0.7 0.8 0.9 1.00
0.1
0.2
0.3
0.4
0.5
0.6
0.7
0.8
0.9
1
1.1
NORMALIZED NUMBER OF HANDOVERS OF EACH TYPE IN A MOBILE CALL
CD
F
CDF OF NUMBER OF HANDOVERS OF EACH TYPE IN A MOBILE CALL
MACRO−TO−MACRO
SMALL−TO−SMALL
SMALL−TO−MACRO
MACRO−TO−SMALL
Figure 3.2: Cumulative Distribution of the normalized number of handovers of dif-ferent types during a mobile call
We now explore the expected percentage of each handover type in a mobile call.
We define the handover type percentage Pj(i) of handover type j in a mobile call i as
Pj(i) =100 ∗ No. of handovers of type j in i
Total no. of handovers in i(3.1)
18
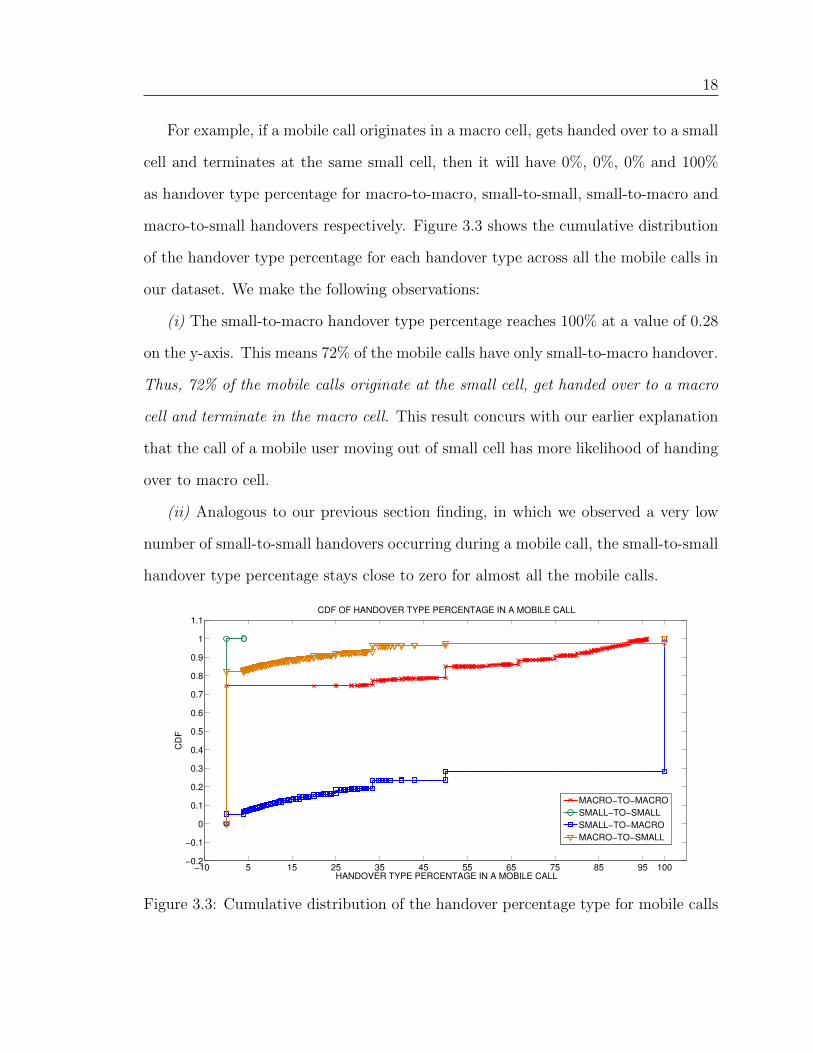
For example, if a mobile call originates in a macro cell, gets handed over to a small
cell and terminates at the same small cell, then it will have 0%, 0%, 0% and 100%
as handover type percentage for macro-to-macro, small-to-small, small-to-macro and
macro-to-small handovers respectively. Figure 3.3 shows the cumulative distribution
of the handover type percentage for each handover type across all the mobile calls in
our dataset. We make the following observations:
(i) The small-to-macro handover type percentage reaches 100% at a value of 0.28
on the y-axis. This means 72% of the mobile calls have only small-to-macro handover.
Thus, 72% of the mobile calls originate at the small cell, get handed over to a macro
cell and terminate in the macro cell. This result concurs with our earlier explanation
that the call of a mobile user moving out of small cell has more likelihood of handing
over to macro cell.
(ii) Analogous to our previous section finding, in which we observed a very low
number of small-to-small handovers occurring during a mobile call, the small-to-small
handover type percentage stays close to zero for almost all the mobile calls.
−10 5 15 25 35 45 55 65 75 85 95 100−0.2
−0.1
0
0.1
0.2
0.3
0.4
0.5
0.6
0.7
0.8
0.9
1
1.1
HANDOVER TYPE PERCENTAGE IN A MOBILE CALL
CD
F
CDF OF HANDOVER TYPE PERCENTAGE IN A MOBILE CALL
MACRO−TO−MACRO
SMALL−TO−SMALL
SMALL−TO−MACRO
MACRO−TO−SMALL
Figure 3.3: Cumulative distribution of the handover percentage type for mobile calls

19
3.2.3 Unique Cells Traversed
Figure 3.4 shows the cumulative distribution of the number of unique small cells and
unique macro cell sectors traversed during a mobile call. 99.54% of the mobile calls
have only one small cell involved during the call. The remaining 0.46% of the mobile
calls have two small cells involved during the call. The deployment design is such
that small cells are deployed in locations where the users are relatively stationary.
Also, the handover protocols may be implemented to prevent highly mobile users
from associating to small cells.
0 1 2 3 4 5 6 7 8 9 10 11 12 13 14 15 16 17 18 19 20 21 22 230
0.1
0.2
0.3
0.4
0.5
0.6
0.7
0.8
0.9
1
1.1
NUMBER OF UNIQUE CELLS TRAVERSED DURING A MOBILE CALL
CD
F
CDF OF NUMBER OF UNIQUE CELLS TRAVERSED DURING A MOBILE CALL
MACRO
SMALL
Figure 3.4: Cumulative Distribution of the number of unique cells traversed during amobile call
3.3 Additional Handovers
In this section, we analyze the additional handovers introduced by small cells during
a mobile call. For this purpose, firstly, we calculate the number of handovers that
would have taken place in a hypothetical macro only network. For example, a mobile
20
call starting in a small cell, moving to a macro cell and ending there would have
had zero handovers in macro only network. In this example, there is one additional
handover due to small cell deployment. Another example, a mobile call with the
following trajectory macro A → small B → macro A would have had zero handovers
in macro only network. In this example, there are two additional handovers.
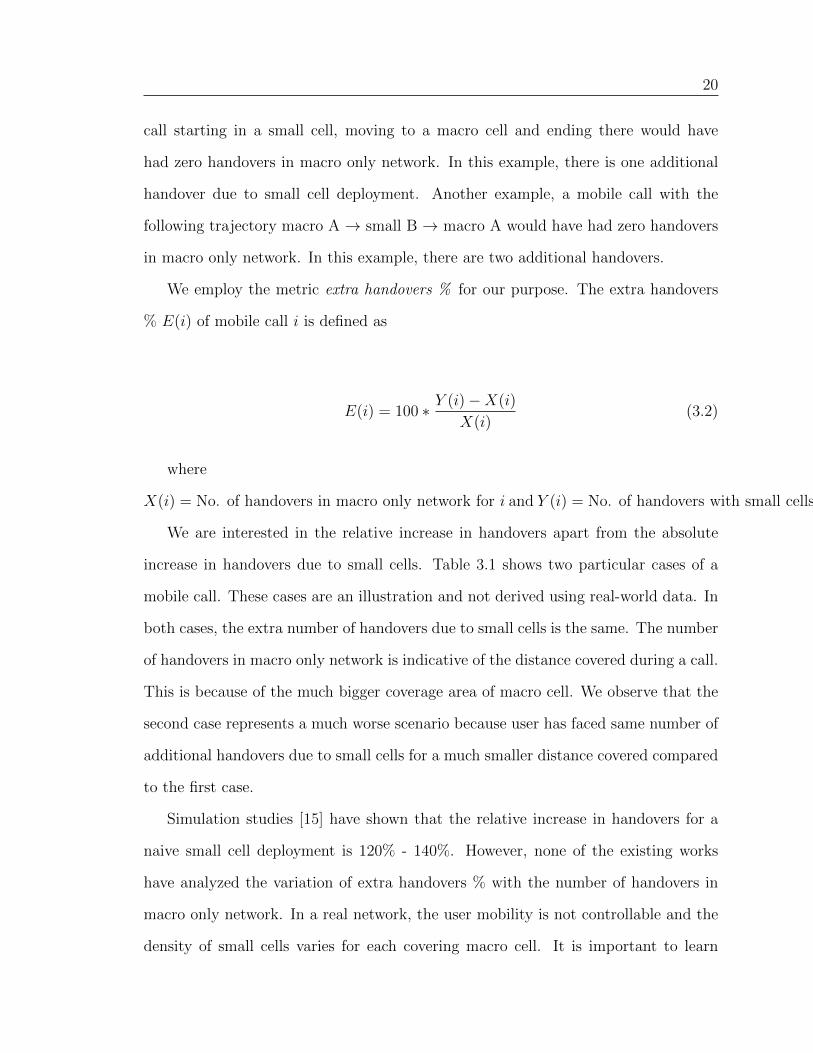
We employ the metric extra handovers % for our purpose. The extra handovers
% E(i) of mobile call i is defined as
E(i) = 100 ∗ Y (i)−X(i)
X(i)(3.2)
where
X(i) = No. of handovers in macro only network for i and Y (i) = No. of handovers with small cells for i
We are interested in the relative increase in handovers apart from the absolute
increase in handovers due to small cells. Table 3.1 shows two particular cases of a
mobile call. These cases are an illustration and not derived using real-world data. In
both cases, the extra number of handovers due to small cells is the same. The number
of handovers in macro only network is indicative of the distance covered during a call.
This is because of the much bigger coverage area of macro cell. We observe that the
second case represents a much worse scenario because user has faced same number of
additional handovers due to small cells for a much smaller distance covered compared
to the first case.
Simulation studies [15] have shown that the relative increase in handovers for a
naive small cell deployment is 120% - 140%. However, none of the existing works
have analyzed the variation of extra handovers % with the number of handovers in
macro only network. In a real network, the user mobility is not controllable and the
density of small cells varies for each covering macro cell. It is important to learn
21
the distribution of the extra handovers % among the mobile calls to understand the
impact of small cell deployment on handovers.
Macro Only Handovers Extra Handovers Extra Handovers %30 30 100%5 30 600%
Table 3.1: Absolute and Relative Increase in handovers due to small cells.The examples are only an illustration and not derived using real-world data.
If there are no handovers in a macro only network for mobile call i, E(i) would
be positive infinity. We find that 74.5% of the mobile calls belonged to this category.
Interestingly, all of these calls had just one extra handover introduced by small cell
deployment. Thus, calls with no handovers in a macro only network have just one
extra handover in a network with small cell deployment.
Figure 3.5 shows the extra handovers percentage as a variation of the number
of handovers in macro only network. The plot also has errorbars with the top bar
representing the maximum value and bottom bar representing the minimum value of
extra handovers % observed in the dataset for a particular number of handovers in
macro only network. We make the following observations:
(i) The graph can be divided into three categories based on the number of han-
dovers in macro only network. The number of handovers in macro only network are
indicative of the distance covered during the call as the coverage area of the macro
cell is in the order of kilometres. Firstly, low mobility represents one to three han-
dovers. The extra handovers percentage goes up to 200% for this category. Secondly,
high mobility represents the number of handovers from 4 to 18 handovers. The extra
handovers percentage goes up to 80% for this category. Lastly, the very high mobility
represents the number of handovers greater than 18. The extra handovers percentage
goes only up to 40% for this category.
(ii) The extra handovers percentage is 200% only for the case of one handover in

22
macro only network. We observe that the mean is around 110 %. This is because of
the low number of calls with extra handovers % of 200%.
(iii) The low extra handovers percentage for very high mobility category shows
the positive impact of the strategic deployment.
0
20
40
60
80
100
120
140
160
180
200
220
NUMBER OF HANDOVERS IN MACRO ONLY NETWORK
EX
TR
A H
AN
DO
VE
RS
PE
RC
EN
TA
GE
MEAN EXTRA HANDOVERS PERCENTAGE VERSUS
NUMBER OF HANDOVERS IN MACRO ONLY NETWORK
Figure 3.5: Mean extra handovers percentage as a variation of number of handoversin macro only network
3.4 Relationship between Handovers and Call Du-
ration
We analyze the call duration (sometimes, also called as the airtime) for the answered
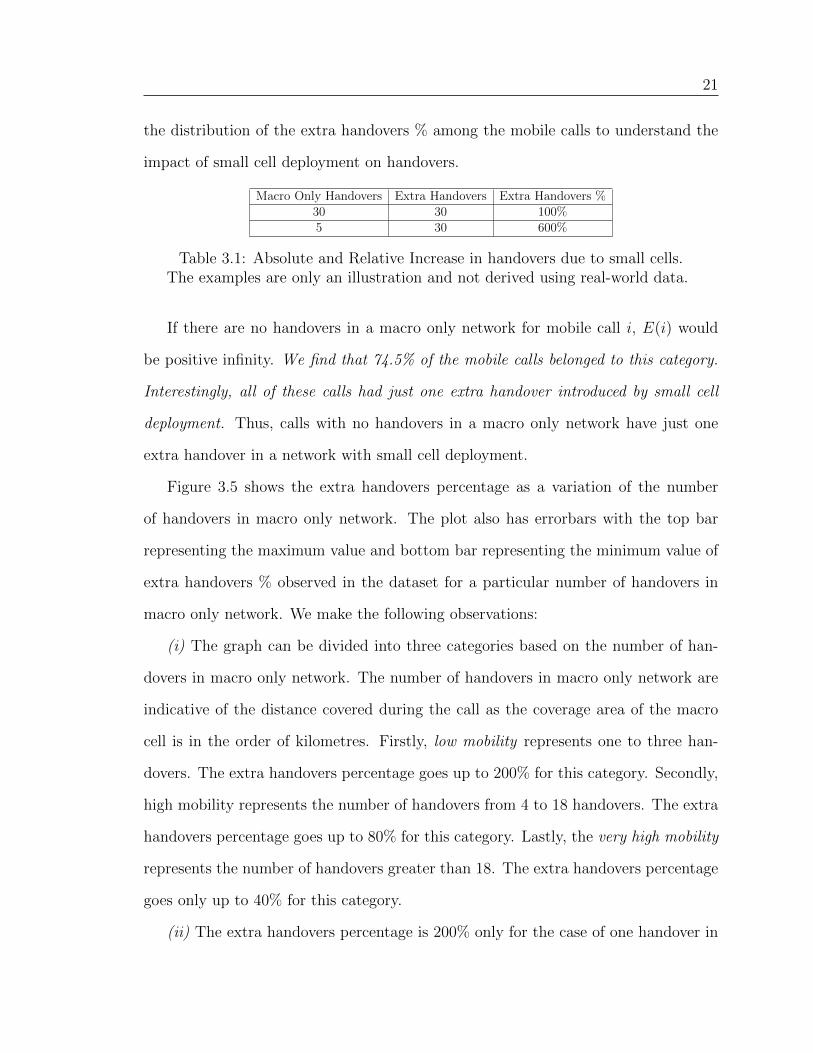
calls. Figure 3.6 shows the comparison of the stationary calls (zero handovers) and
mobile calls (more than zero handovers) for the percentile values of the airtime. The
airtime percentile values for the mobile calls are typically higher than that of stationary
calls and the difference increases with increase in percentile value.
23
0 10 25 50 75 900
0.1
0.2
0.3
0.4
0.5
0.6
0.7
0.8
0.9
1.0
PERCENTILE
NO
RM
ALIZ
ED
AIR
TIM
E
AIRTIME PERCENTILE VALUE
STATIONARY
MOBILE
Figure 3.6: Comparison of stationary calls and mobile calls for percentile values ofnormalized airtime calls.
We expect the longer the airtime of a mobile call, higher is the number of handovers
occurred especially in a dense small cell deployment scenario. We would like to observe
the variation in the number of handovers for a mobile call with the airtime. For this
purpose, we divide the airtime range into suitable intervals. Each mobile call is placed
in the appropriate airtime interval for analysis. The value of the interval is chosen
taking into consideration the distribution of airtime for mobile calls we observed in
the operational data.
Figure 3.7 shows the variation of the mean number of handovers for each type with
the airtime. The x-axis represents the index of the airtime interval. We focus our
analysis on the lower 15 airtime intervals as they cover more than 95% of the mobile
calls. This can be observed from Figure 3.6. For higher airtime indices, we observed
a lower number of mobile calls - this introduces higher variability into the results and
hence we eliminate them from our analysis. We present the following observations:
(i) For the lower airtime index of 1 and 2 which constitutes more than 50% of the
mobile calls, the mean number of small-to-macro handovers is 1 and higher than rest
of the means. This result complements the observations made in Section 3.2.2 that

24
over 70% of the mobile calls have only small-to-macro handover as the only type of
handover during the call.
(ii) As airtime index increases, the mean number of small-to-macro handover
stays close to 1 indicating that the small-to-macro handover still occurs for higher
airtime. We observe that the mean number of macro-to-macro handovers consistently
increases with the airtime. One explanation is that the mobility pattern of the user
is such that once the mobile call is handed over from small to macro cell at some
point of the call, it remains outside the coverage area of small cells for the remaining
duration of the call. That duration in which it stays can be much longer than that
time it stayed in small cells. This is evident from the number of macro-to-macro cell
handovers that take place during the call.
0
0.125
0.25
0.375
0.5
0.625
0.75
0.875
1
AIRTIME INTERVALS
NO
RM
AL
IZE
D N
UM
BE
R O
F H
AN
DO
VE
RS
NUMBER OF HANDOVERS VERSUS AIRTIME OF MOBILE CALL
MACRO−MACRO
SMALL−SMALL
SMALL−MACRO
MACRO−SMALL
Figure 3.7: Variation of the mean number of handovers with airtime
3.5 Impact on Service Performance
In this section, we study the impact of small cells deployment on service performance
experienced by the users. We employ the widely used metric call drop probability
25
as a measure of service performance. To analyze call drop probability in different
scenarios, we classify the successfully answered calls based on three criteria:
(i) Mobility : We use the number of handovers to identify if the call is stationary
or mobile. The likelihood of a radio interface problem being a handover failure is
higher for a mobile call drop in comparison to a stationary call drop since we have
the evidence that the user has been moving in the case of a mobile call.
(ii) Terminating Cell : If the call was dropped in a macro cell due to a handover
failure, we cannot say for sure if a small cell is involved as the target cell. However,
if a call was dropped in small cell due to handover failure, there is a chance smaller
coverage of small cell played a part in the call getting dropped.
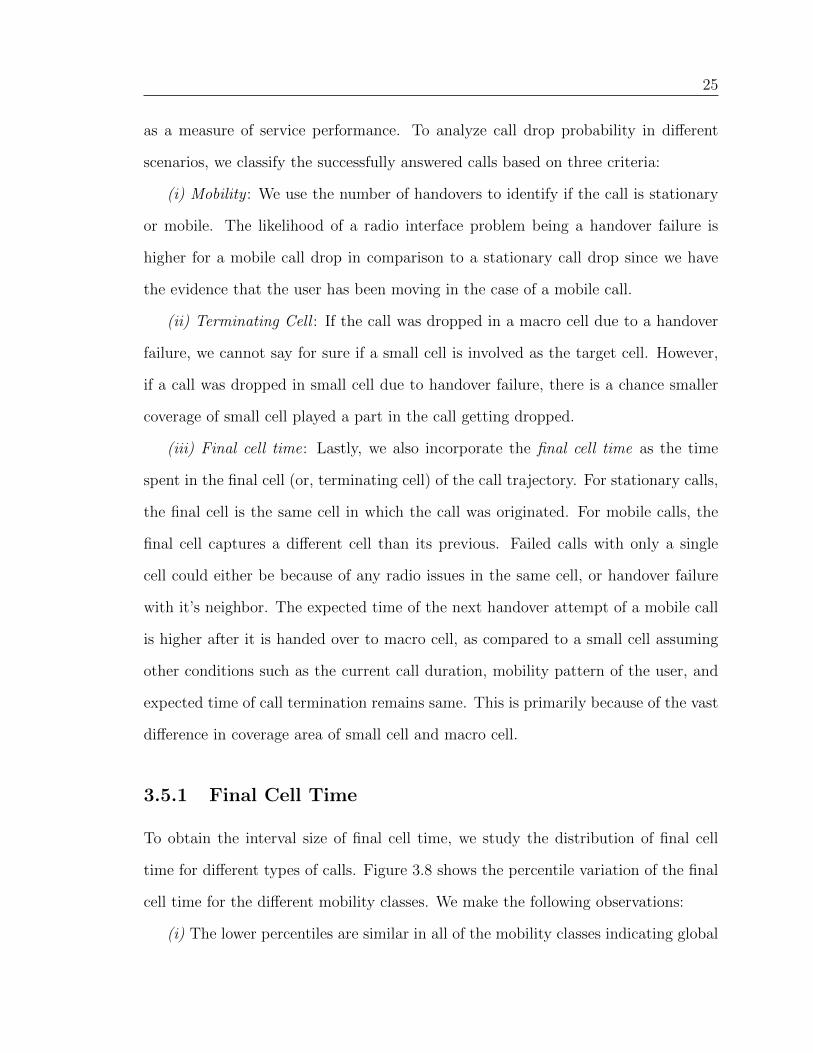
(iii) Final cell time: Lastly, we also incorporate the final cell time as the time
spent in the final cell (or, terminating cell) of the call trajectory. For stationary calls,
the final cell is the same cell in which the call was originated. For mobile calls, the
final cell captures a different cell than its previous. Failed calls with only a single
cell could either be because of any radio issues in the same cell, or handover failure
with it’s neighbor. The expected time of the next handover attempt of a mobile call
is higher after it is handed over to macro cell, as compared to a small cell assuming
other conditions such as the current call duration, mobility pattern of the user, and
expected time of call termination remains same. This is primarily because of the vast
difference in coverage area of small cell and macro cell.
3.5.1 Final Cell Time
To obtain the interval size of final cell time, we study the distribution of final cell
time for different types of calls. Figure 3.8 shows the percentile variation of the final
cell time for the different mobility classes. We make the following observations:
(i) The lower percentiles are similar in all of the mobility classes indicating global

26
presence of calls that spent very less time in the final cell before terminating.
(ii) The small-stationary class remains the highest percentile values from 30%-ile
onwards. This is expected as the entire call duration is taking place in the same
cell. Also, the final cell time is higher because there is a lower chance of call getting
dropped while being stationary.
(iii) The percentile value of macro-mobile class remains higher than small-mobile
class from 20%-ile onwards.
0 10 20 30 40 50 60 70 80 900
0.1
0.2
0.3
0.4
0.5
0.6
0.7
0.8
0.9
1
PERCENTILE
NO
RM
ALIZ
ED
FIN
AL C
ELL T
IME
FINAL CELL TIME PERCENTILE
MACRO − MOBILE
SMALL − MOBILE
SMALL − STATIONARY
Figure 3.8: Cumulative distribution of Final Cell Time for the different mobilityclasses
3.5.2 Dropped Call Analysis
We obtain Call Drop Probability Pdr(i, j, k) as follows:
Let X(i, j, k) denote the set of answered calls belonging to mobility class i, termi-
nating cell class j and final cell time class k. Let Xdr(i, j, k) denote the set of calls
in X that are dropped due to radio interface problems. We choose the value of the
final cell interval for our dropped call analysis based on observations in Section 3.5.1.
27
Pdr(i, j, k) =No. of calls in Xdr(i, j, k)
No. of calls in X(i, j, k)(3.3)
We make the following observations:
(i) We observe that the call drop probability is the highest for a mobile call ter-
minating in small cell independent of the final cell time. The call drop probability
for mobile calls terminating in small cell is higher than the call drop probability of
stationary calls terminating in small cells because there is a higher chance the mobile
calls were dropped due to handover failures. This result validates the impact of han-
dover failures on the small cells network performance. An important point to note is
that the number of calls terminating in small cells is much smaller than the number
of calls terminating in macro cells, as discussed in Section 3.2.
(ii) The call drop probability for a mobile call terminating in a macro cell is
the lowest independent of the final cell time. For a handover failure in macro cell,
the target cell could be a small cell or a macro cell. We cannot say for sure that
the handover failure occurred due to challenge of abrupt cell boundary of small cell.
Whereas for a handover failure in a small cell, we know for sure that there is an
abrupt cell boundary as the serving cell is a small cell.

Chapter 4
Data Service
In this chapter, we analyze the impact of small cell deployment on the data service
performance experienced by the users. We resort to coarse-grained measurements here
as opposed to fine-grained CDR measurements because data CDRs only comprise the
originating cell instead of the whole call trajectory. Coarse-grained measurements
are collected by the network equipments and summarized across all calls within the
time-granularity of an hour. Our expectation is the traffic offloading and the handover
impacts for data sessions should bear similar results as voice service. Here, we focus on
a tourist location as opposed to the whole of US. The tourist location has a relatively
higher traffic demand and user mobility as opposed to others and thus has a relatively
higher number of small cells deployed by the service provider.
We used the latitude-longitude information to identify the small cells in close
geographical proximity of the macro cells (within a radius of 1 kilometer). A total
of 53 small cells and 5 macro cells were selected for our study. In Section 4.1, we
describe the data sets used for our analysis. Section 4.2 describes the mathematical
techniques utilized for analyzing the data. In Section 4.3, we study the distribution
of the traffic offloaded to the small cells and the correlation between the macro cell
traffic and small cell traffic. Finally, in Section 4.4, we analyze the impact of network

29
events that induce service quality impacts in small cells.
4.1 Data Set
We collected hourly raw cell-level service quality measurements for a period of three
months. The measurements were collected for both small cells and macro cells in the
selected region. We now describe the relevant key performance indicators computed
using the service quality measurements.
(i) Session Attempts : The total number of RRC (Radio Resource Control) con-
nection attempts triggered by the users in a time bin.
(ii) Sessions Activated : The total number of RAB (Radio Access Bearer) Successes
in a time bin. A RAB is allocated once end-to-end resources are allocated for the
call.
(iii) Accessibility : The percentage of RAB Successes to RRC connection attempts
in a time bin. Accessibility is a measure of the successful session attempts triggered
by the users in the cellular network.
(iv) Retainability : The percentage of RAB drops to the RAB successes including
the successful incoming macro cell to small cell handovers and excluding the outgoing
small cell to macro cell handovers in a time bin. Dropped call percentage is inversely
related to retainability and can be computed by subtracting retainability from 100.
(v) Small-to-Small Handover Failure Percentage (S-S HOFP): The percentage of
the unsuccessful small-small handover attempts made in a time bin.
4.2 Methodology
In this section, we describe the approach for our experiments, including event series
formation, processing performed on the real-world data to make our analysis more

30
robust, and the new statistical correlation framework designed to find the aggregate
correlation score across multiple small cells.
4.2.1 Event Series Formation
We construct a time-series for each key performance indicator by dividing the original
series into n equal time-bins. This step is performed for the key performance indicator
of each small cell and macro cell. For example, for a metric like session attempts,
we use each hourly time-bin to capture the total number of PS RRC Connection
Attempts.
4.2.2 Data Sanitization
As shown in Figure 4.1, the event series possess characteristics such as time of day,
weekday versus weekend. To make a proper assessment, there is a need to sanitize
the event series from such diverse characteristics. We employ a robust singular value
decomposition-based approach [8] that performs local subspace computation using l1-
norm. It decomposes a time-series into normal and residual subspace. Anomalies are
extracting by statistical thresholding on the residual subspace. This method performs
iterative optimization by using augmented Lagrangian multipliers at each iteration
thereby implicitly accounting for any seasonality, stationarity, or high variability in
the event-series and is more robust to outlier effects compared to l2 norm.
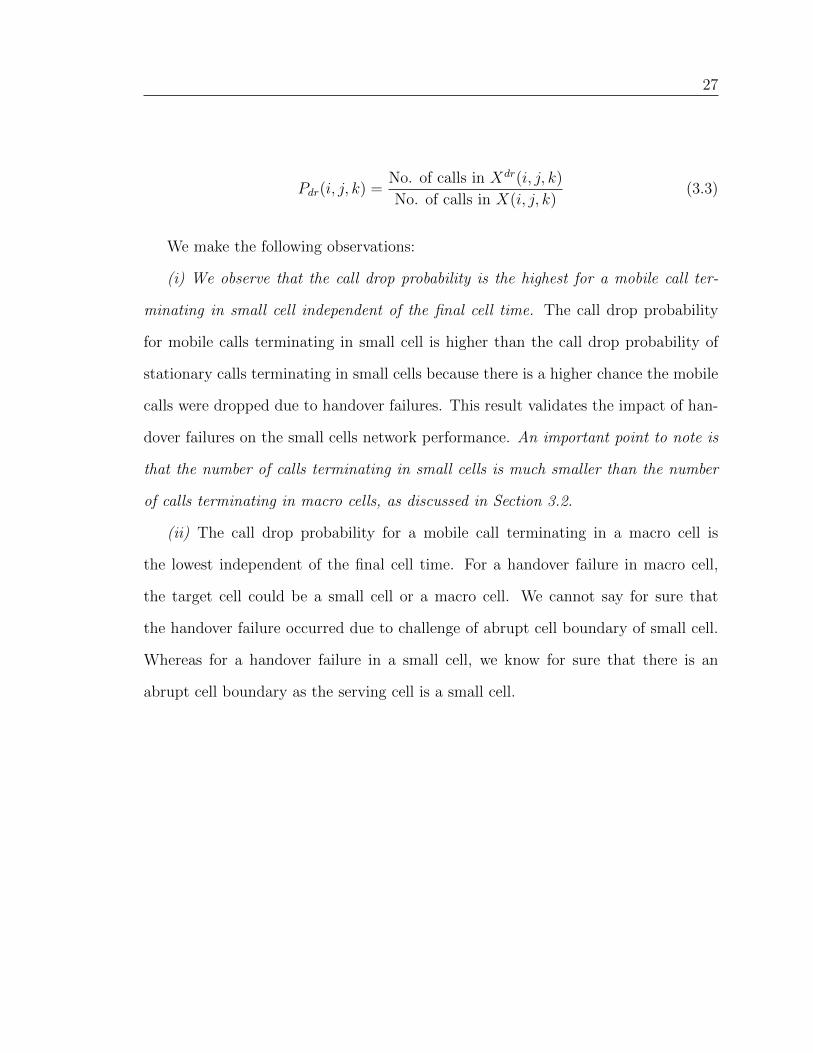
4.2.3 Statistical Correlation
Given a symptom event and a region of M small cells, the goal is to find the statistical
dependency of the symptom event and potential root cause event series across the M
cells. Figure 4.2 shows the methodology flow diagram for the analysis performed in
this section. For example, we employ statistical correlation to quantify the impact of

31
Figure 4.1: Example of an event series showing time-of-day effects and weekday versusweekend effect for a duration of one week and the residual signal after applying robustSVD -based filter. The y-axis is absent for proprietary reasons.
potential causes that lead to a data session being terminated from the network side.
Simple co-occurrence based approaches are ineffective due to high false positives as
co-occurrences may be a mere coincidence or one-time event. Next, we briefly describe
out approach.
Let P1, P2, ..., PM represent the residual symptom event series of the M cells re-
spectively. Let Q1, Q2, ..., QM represent the residual root cause event series of the M
cells respectively. Each of the series contains N samples. Firstly, we carry out the
spatial aggregation into P and Q as follows:
P =
∑Mi=1 Pi
M(4.1)
and

32
Q =
∑Mi=1Qi
M(4.2)
We need to exclude the cross-interaction between Pi and Qj where i and j are not
equal. Thus, we calculate modified form of Pearson’s correlation coefficient and the
population correlation coefficient CaggP,Q between P and Q is given by
CaggP,Q =
Cov(P,Q)√V arPV ar(Q)
(4.3)
where
Cov(P,Q) =
∑Mi=1Covariance(Pi, Qi)
M(4.4)
and
V ar(X) =
∑Mi=1 V ariance(Xi)
M(4.5)
Next, we test the statistical significance of the correlation. If the population
coefficent is non-zero then the correlation coefficent cannot be assumed to have a
standard normal distribution. A solution to this problem is the Fisher transformation
which exhibits an almost normal distribution. Fisher’s transform is applied to test
the hypothesis,

33
zagg =1
2ln
[1 + Cagg
P,Q
1− CaggP,Q
](4.6)
.
The standard error is given by
1√N − 3
(4.7)
To test the statistical significance, the samples need to be independent. Although
devoid of factors such as seasonality, the residual time-series still exhibit autocorrela-
tion as they are collected from real physical systems. The autocorrelation is eliminated
by incorporating a non-zero first order autocorrelation coefficient and thus obtaining
a reduced sample size known as effective sample size. The first order autocorrelations
r1(P ) and r1(Q) are obtained for the aggregate residual series P and Q as follows
r1(P ) =Cov(P, P + 1)
V ar(P )(4.8)
and
r1(Q) =Cov(Q,Q + 1)
V ar(Q)(4.9)
where P + 1 and Q + 1 are one time bin shifted versions of P and Q respectively.
The effective sample size Neff is defined as
34
Neff = mN1− r1(P )r1(Q)
1 + r1(P )r1(Q)(4.10)
Assuming the Fisher transformation is asymptotically Gaussian for large effective
sample size, the correlation score is defined as
score = zagg√
Neff − 3, (4.11)
We consider the correlation score is considered significant if it falls outside of the [-
2.33,2.33] range. With the Fisher transformation sample distribution asymptotically
Gaussian, this yields a low false positive ratio of 1%. Similar mechanism can be
applied to calculate the correlation score at each individual small cell.
For our experiments, our framework outputs the aggregate correlation score of all
small cells and individual correlation score for each tuple of small cell between the
symptom event and potential root cause event. We classify a aggregate correlation
between the symptom event series and another event series as significant if it falls
outside [-2.33,2.33], as discussed earlier.
Figure 4.2: Methodology
35
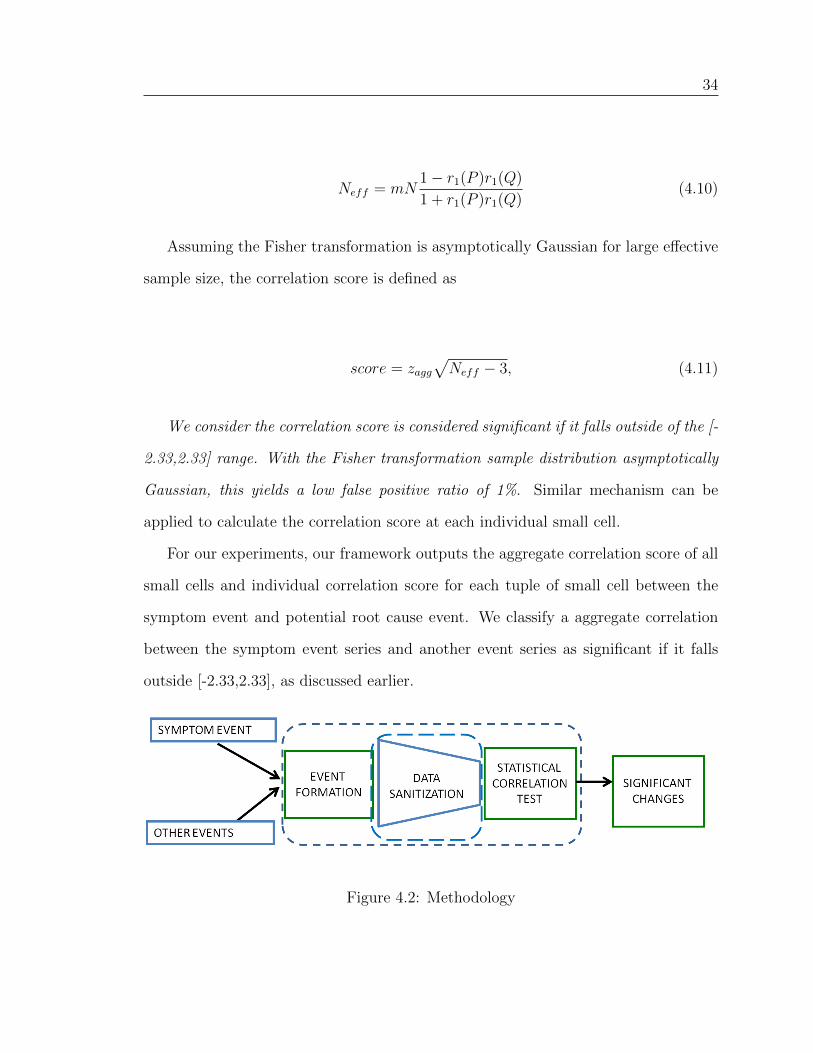
4.3 Macro Cell - Small Cell Interactions
If there were no small cells, a significant percentage of session attempts at small cells
would instead occur at the overlaid macro cells, thus increasing the likelihood of traffic
congestion at macro cells. By offloading the traffic from the macro cells, small cells
reduce the likelihood of traffic congestion in the macro cells. The higher the traffic
offload, the higher the usage of capacity gains provided by small cells. Although,
a very high traffic offload may cause traffic congestion at the small cells. We had
discussed earlier in Section 1 that small cells may be provided with cell selection bias
to increase the traffic offload. For our analysis, we assume the service provider has
chosen the value of cell selection bias for each small cell that performs optimal load
balancing between small cells and macro cells based on current network conditions.
In Figure 4.3, we observe that small cells take up significant fraction of the traffic
load and help alleviate traffic congestion in the macro cells.
0 10 20 30 40 50 60 70 80 90 100
DAY
AGGREGATE DATA TRAFFIC
MACRO ONLY DATA TRAFFIC
Figure 4.3: Visualization of daily aggregate traffic offload to small cells during thelong period of three months.

36
4.4 Data Retainability
Service performance (data retainability) could be impacted due to several network
events such as traffic load (congestion), handover failures, existence of coverage holes,
or cells being unavailable due to power outage or maintenance events. For our ex-
periments, we use Session Attempts in a time-bin at a small cell as a measure of the
Traffic Load in that small cell. Small Cell Unavailability refers to a power outage or
maintenance event at a small cell due to which the users connected to that small cells
face abrupt session termination. Similar termination can also occur due to a re-start
at the small cell.
The statistical correlation test described in Section 4.2.3 is applied by taking
retainability as the symptom event series. We conducted the test for hourly mea-
surements collected for a long period of three months to add statistical confidence to
our result. The four network events were Cell Unavailability, Cell re-start, handover
failure percentage and traffic load.
We find that all the four network events have a significant negative correlation
validating their impact on the retainability. The S-S Handover Failure percentage has
the highest correlation score. We find that handover failures are one of the dominating
contributors to data service quality issues in operational networks as compared to
other events. Small cell to small cell handover failures involves the worst scenario of
the challenge of abrupt cell boundaries. This is because the serving cell is a small cell
and the target cell is also a small cell. Moreover, as the tourist location has a relatively
higher density of small cells, there is also the challenge of increased neighboring cell
list. Both these challenges contribute to occurrence of small cell to small cell handover
failures in the location thereby impacting data service quality. These challenges were
discussed in Section 2.3.
We observe that Cell Unavailability has a higher correlation score than the traffic
37
load in the absolute sense. However, the percentage spread of Cell Unavailability is
less than 50% of the percentage spread of traffic load.
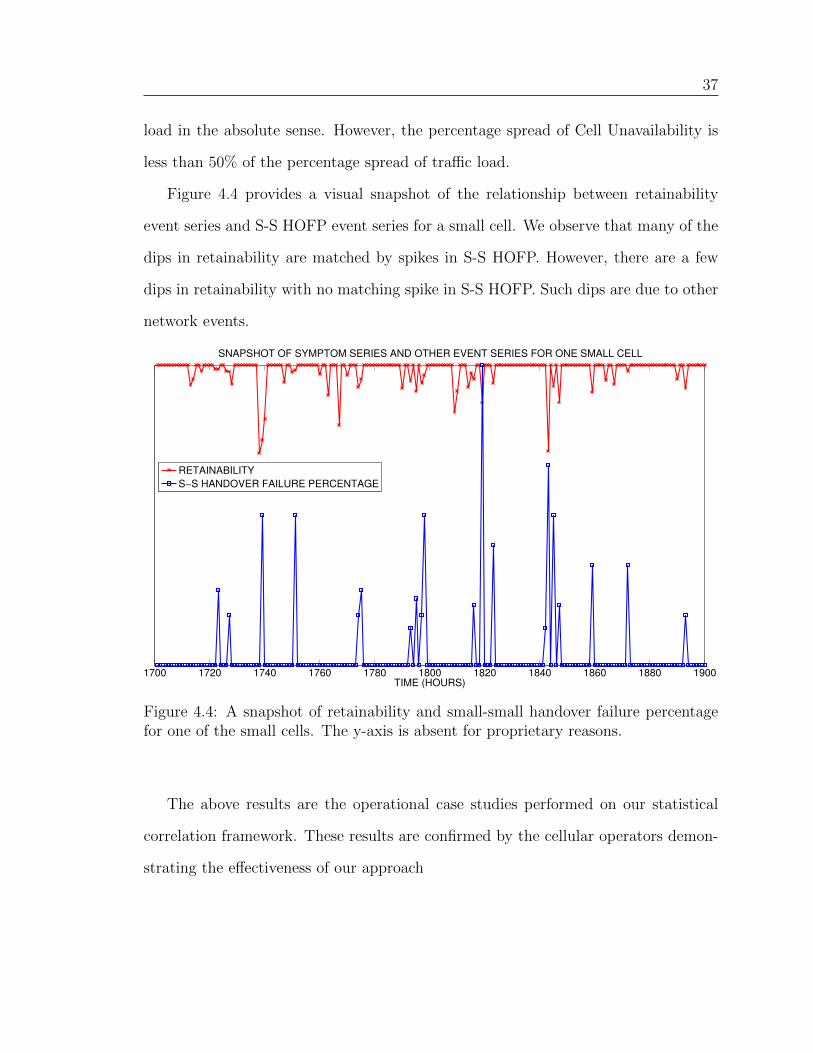
Figure 4.4 provides a visual snapshot of the relationship between retainability
event series and S-S HOFP event series for a small cell. We observe that many of the
dips in retainability are matched by spikes in S-S HOFP. However, there are a few
dips in retainability with no matching spike in S-S HOFP. Such dips are due to other
network events.
1700 1720 1740 1760 1780 1800 1820 1840 1860 1880 1900TIME (HOURS)
SNAPSHOT OF SYMPTOM SERIES AND OTHER EVENT SERIES FOR ONE SMALL CELL
RETAINABILITY
S−S HANDOVER FAILURE PERCENTAGE
Figure 4.4: A snapshot of retainability and small-small handover failure percentagefor one of the small cells. The y-axis is absent for proprietary reasons.
The above results are the operational case studies performed on our statistical
correlation framework. These results are confirmed by the cellular operators demon-
strating the effectiveness of our approach
Chapter 5
Related Work
To the best of our knowledge, this paper presents the first detailed measurement study
of voice and data service performance of an operational small-cell cellular network.
We summarize related studies as follows.
Macro-Cell Performance Studies: Recent cellular measurement studies have
characterised user mobility and behaviour. In [9], the authors found a large fraction of
the users have negligible mobility and significant portion of traffic is generated by the
more mobile users. Mobility performance testing in several end-user mobile scenarios
such as trains, subways etc. has been conducted in [10, 11]. In [10], the authors find
that mobility improves fairness in bandwidth allocation among users and traffic flows
although degrading throughput. Mobility patterns have also been studied specific
to traffic [12] and crowded events [7]. Call durations have been studied in [13, 14].
In contrast to these works, we focus on the service performance implications of the
changes introduced by the small cell deployment.
Small Cells Handover Simulation and Modeling Studies: Few system-level
simulations have been conducted to study the impact of small cell deployments on
the mobility performance in LTE-Advanced systems. The results in [15, 16] show
that the handover failure rate and number of mobility events monotonically increase

39
with user speed and density of small cells deployed. In [15], the handover failure rate
is shown to be highest for a high speed user connected to a cellular network of small
cells and macro cells operating on the same carrier frequency. In [16], the authors
find the main reason for handover failure is the handover request being made too late
due to the unstable signal strengths of the small cells. In [3], the authors analyse
the handover performance under varying conditions of small cell range expansion and
interference management. In [17], the authors study user association schemes for
optimal traffic offload to small cells. In contrast to these works, we use a global view
of the cellular network with small cell deployment to analyse service performance.
All of these works employ a naive small cell deployment setting. Unlike related works
which show a 120%- 140 % increase in handovers due to small cells, we observe that,
in an operational network, the extra handovers % is below 10% for the very high
mobile users.
Statistical Correlation. In NICE [18], the authors built a statistical correlation
framework for the network event time series of large IPTV networks. The correlation
technique was applied on simplistic binary time series whose correlations are easier to
interpret in comparison to our non-binary residual time series. Also, this framework
did not involve spatial aggregation of network events and focused on events at the
same data source. In contrast, our framework calculates the aggregate correlation
score for a given spatial footprint.
Chapter 6
Summary
In this thesis, we conducted a detailed measurement study of voice and data ser-
vice offered by a large-scale operational small cell network. Using call detail records
for voice service, we observed that (i) the majority of the calls involving small cells
originate and terminate at the same small cell, (iii) the calls with high number of
handovers between macro cells have negligible overhead of handovers involving small
cells and (iii) the call drop probability for a mobile call terminating at a small cell
is higher as compared to stationary call or mobile call terminating at a macro cell.
Further, we proposed a new service quality framework for estimating the aggregate
statistical dependency between two events across multiple small cells. The tests on
the framework are confirmed by the cellular operators demonstrating its effectiveness.
The framework is not dependent on small cells and can be extended to other tech-
nologies and data sets.Using data performance measurements collected, we observed
that (i) the small cells take up more traffic during conditions of high traffic load in the
cellular network, thus alleviating the impact of traffic congestion in the macro cells,
(ii) small-to-small cell handover failures are one of the dominating causes for service
quality impacts captured using data retainability. Our findings can be used to design
a set of handover policies for improvement of service performance and modeling of

41
call drop probability in operational small cells deployment overlaid by macro cells.
References
[1] K. Okino, T. Nakayama, C. Yamazaki, H. Sato, and Y. Kusano, “Pico cell rangeexpansion with interference mitigation toward LTE-Advanced heterogeneous net-works,” in Proc. of IEEE ICC, 2011.
[2] J. Andrews, “Seven ways that hetnets are a cellular paradigm shift,” IEEE Com-munications Magazine, pp. 136–144, 2013. 1
[3] D. Lopez-Perez, I. Guvenc, and X. Chu, “Mobility management challenges in3GPP heterogeneous networks,” IEEE Communications Magazine, pp. 70–78,2012. 1, 5
[4] H.-S. Park, A.-S. Park, J.-Y. Lee, and B.-C. Kim, “Two-step handover for LTEHetNet mobility enhancements,” in Proc. of ICTC, 2013. 1, 2.3
[5] Z. Becvar, P. Mach, and M. Vondra, “Optimization of SINR-based neighbor celllist for networks with small cells,” in Proc. of IEEE PIMRC, 2013. 1, 2.3
[6] A. Feki, V. Capdevielle, L. Roullet, and A. Sanchez, “Handover aware interfer-ence management in lte small cells networks,” in IEEE WiOpt, 2013. 1
[7] M. Shafiq, L. Ji, A. Liu, J. Pang, S. Venkataraman, and J. Wang, “A firstlook at cellular network performance during crowded events,” in Proc. of ACMSIGMETRICS, 2013. [Online]. Available: http://doi.acm.org/10.1145/2465529.2465754 2.1, 5
[8] A. Mahimkar, Z. Ge, J. Wang, J. Yates, Y. Zhang, J. Emmons, B. Huntley,and M. Stockert, “Rapid detection of maintenance induced changes inservice performance,” in Proc. of ACM CoNEXT, 2011. [Online]. Available:http://doi.acm.org/10.1145/2079296.2079309 4.2.2
[9] U. Paul, A. Subramanian, M. Buddhikot, and S. Das, “Understanding trafficdynamics in cellular data networks,” in Proc. of IEEE INFOCOM, 2011. 5
43
[10] F. P. Tso, J. Teng, W. Jia, and D. Xuan, “Mobility: A double-edgedsword for HSPA networks: A large-scale test on Hong Kong mobileHSPA networks,” in Proc. of ACM MobiHoc, 2010. [Online]. Available:http://doi.acm.org/10.1145/1860093.1860105 5
[11] K. Jang, M. Han, S. Cho, H.-K. Ryu, J. Lee, Y. Lee, and S. B. Moon,“3G and 3.5G wireless network performance measured from moving cars andhigh-speed trains,” in Proc. of ACM MICNET, 2009. [Online]. Available:http://doi.acm.org/10.1145/1614255.1614261 5
[12] M. Z. Shafiq, L. Ji, A. X. Liu, J. Pang, and J. Wang, “A firstlook at cellular machine-to-machine traffic: Large scale measurement andcharacterization,” in Proc. of ACM SIGMETRICS, 2012. [Online]. Available:http://doi.acm.org/10.1145/2254756.2254767 5
[13] D. Willkomm, S. Machiraju, J. Bolot, and A. Wolisz, “Primary users in cellularnetworks: A large-scale measurement study,” in Proc. of IEEE DySPAN, 2008.5
[14] P. O. S. V. De Melo, L. Akoglu, C. Faloutsos, and A. A. F.Loureiro, “Surprising patterns for the call duration distribution of mobilephone users,” in Proc. of ECML, 2010. [Online]. Available: http://dl.acm.org/citation.cfm?id=1889788.1889812 5
[15] TR 36.842 (V1.0.0), “Evolved Universal Terrestrial Radio Access (E-UTRA);Study on Small Cell Enhancements for E-UTRA and E-UTRAN Higherlayer aspects,” 3GPP, TR 36.842, Nov. 2013. [Online]. Available: http://www.3gpp.org/ftp/Specs/html-info/36839.htm 1, 3.3, 5
[16] T. Yamamoto and S. Konishi, “Impact of small cell deployments on mobilityperformance in LTE-Advanced systems,” in Proc. of IEEE PIMRC, 2013. 5
[17] Q. Ye, B. Rong, Y. Chen, M. Al-Shalash, C. Caramanis, and J. Andrews, “Userassociation for load balancing in heterogeneous cellular networks,” IEEE Trans-actions on Wireless Communications, pp. 2706–2716, 2013. 5
[18] A. Mahimkar, J. Yates, Y. Zhang, A. Shaikh, J. Wang, Z. Ge, andC. Ee, “Troubleshooting chronic conditions in large IP networks,” in Proc. ofACM CoNEXT, 2008. [Online]. Available: http://doi.acm.org/10.1145/1544012.1544014 5
[19] E. Nan, X. Chu, W. Guo, and J. Zhang, “User data traffic analysis for 3G cellularnetworks,” in Proc. of CHINACOM, 2013.
[20] H. Holma et al., WCDMA for UMTS. Wiley Online Library, 2000.
[21] R. Kreher, UMTS performance measurement: a practical guide to KPIs for theUTRAN environment. John Wiley & Sons, 2006.

44
[22] K. Pentikousis, M. Palola, M. Jurvansuu, and P. Perala, “Active goodput mea-surements from a public 3G/UMTS network,” IEEE Communications Letters,pp. 802–804, 2005.
[23] E. Halepovic and C. Williamson, “Characterizing and modeling user mobilityin a cellular data network,” in Proc. of ACM PE-WASUN, 2005. [Online].Available: http://doi.acm.org/10.1145/1089803.1089969
[24] 3GPP TR 36.839 (V11.1.0), “Evolved Universal Terrestrial Radio Access (E-UTRA); Mobility enhancements in heterogeneous networks,” Tech. Rep., Jan.2013. [Online]. Available: http://www.3gpp.org/ftp/Specs/html-info/36839.htm


