

Vertical distribution of zooplankton with emphasis on variation in lipid content and stable isotope signatures in Calanus
finmarchicus in the deep part of Skagerrak
Christoffer Bruus Pedersen Master thesis in biology
December 2015
Department of Bioscience Aarhus University

1
Forord Denne specialerapport indeholder en generel introduktion til de teoretisk aspekter vedrørende forståelsen af populationsbevægelserne i det pelagiske zooplanktonsamfund i forbindelse med de vertikale dagsvandringer og sæsonmæssige overvintringsadfærd. Introduktionen vil forsøge at belyse den teoretiske årsagssammenhæng til denne studeret adfærd, ud fra tidligere studier baseret på calanoida arten Calanus finmarchicus. Formålet er at skabe et overordnede indblik i emnet, samt en række af de metoder som det efterfølgende artikeludkast er fundamenteret ud fra. Desuden behandles isotop signaturen fra en række fundene pelagiske zooplankton arter ift. C. finmarchicus, og eventulle trofiske relationer fremlægges. Artikeludkastet er lavet på baggrund af sommertogtet 2014, hvor der blev taget en række prøver for at undersøge den vertikale dybdefordeling og trofiske struktur af zooplanktonsamfundet i Skagerrak. Artikeludkastet forsøger at belyse eventuel dagsvandring mellem de indsamlede dybde strata for de fundene arter, samt estimerer retning og styrke af vandringen. På baggrund af abundance og tidligere studier af arten, vil der i artikeludkastet blive sat fokus på C. finmarchicus, ved yderligere analyser af dybdefordeling mellem lipid indhold, udviklingsstadier samt isotopsignatur. Specielt er lavet i samarbejde med Afdeling for Marin Økologi på Biosciens på Aarhus Universitet. Speciale projektet har modtaget finansiel støtte af Elisabeth og Knud Pedersens Fond og fra Dansk Center for Havforskning. Jens Tang Christensen fra Aarhus Universitet har fungeret som intern vejleder, og jeg vil i den forbindelse gerne rette en stor tak for den store hjælp og sparing jeg har modtaget undervejs. Ligeledes skal der lyde en stor tak til de resterende vejledere, laboranter og medstudierne på Afdeling for Marin Økologi på Biosciens på Aarhus Universitet. Jeg har nydt godt af den store professionalisme og faglig støtte som afdelingen besidder, og dette har været en stor hjælp igennem arbejdsprocessen. Christoffer Bruus Pedersen Aarhus Universitet, December 2015.

2
Resumé
Specialet omhandler den vertikale fordeling af zooplankton, herunder med særligt fokus på calanoida arten Calanus finmarchicus, i Skagerrak. Et af de mest studeret marine fænomener i marinøkologiske sammenhænge er den vertikale fordeling af arterne i vandsøjlen herunder særligt den daglige vertikale vandring af zooplankton. Denne daglige vertikale vandring, hvor pelagiske zooplantonarter migrere fra få til hundrede meter i en 24 timers dagsrytme, anses for at være dyrerigest største migration i forhold til biomasse. Det normale migrationsmønster involverer bevægelse fra øvre områder af vansøjlen om natten, til større dybder i løbet af dagen. Adskillige hypoteser er blevet fremsat i et forsøg på at forklare årsagen til denne adfærd, men tilstedeværelse af dagsaktive rovdyr betragtes som den bedste forklarende årsagssammenhæng. Amplituden af den vertikale bevægelse af en population har vist sig at være forskellige mellem arter, også mellem ontogenetiske stadier af samme art, og kan være påvirket af faktorer som tilgængelighed af ressourcer og sult. Amplituden af den vertikal fordeling har i den forbindelse vist sig at stige gradvist med udviklingsstadiet, og maksimeres i de større copepodite stadier med tilsvarende større lipid indhold. Tidligere studier tyder også på at sult kan være en primær kontrollerende faktor for hvornår individer migrere tilbage mod overfladen, derved kan energi reserver ligeledes være kontrollerne for migrationen amplituden i forholdet mellem sikkerheden i dybet og fourageringsmulighederne ved overfladen. Opgaven forsøger i den forbindelse at belyse dybdefordelingen samt styrken af døgnvandring for de fundet arter, samt undersøge C. finmarchicus dybdefordeling ift. lipid indhold, størrelse samt udviklingsstadie. Vi fandt i den forbindelse både en sammenhæng mellem lipid indholdet og størrelsen ift. dybden. Dertil fordelte de større copepodite udviklingsstadier sig relative dybere end de tidligere stadier. Mistanke om begyndende overvintring i de dybeste beliggende individer af C. finmarchicus blev ligeledes bestyrket ved sammenligning af resultater med andre sammenlignelige studier. Yderligere undersøgte vi de isotopiske forskelle i vandsøjlen for C. finmarchicus, for at undersøge de potentielle variationer mellem isotopiske forhold mellem δ15N og δ13C, samt belyste den trofiske zooplankton struktur ift. C. finmarchicus. Undersøgelserne viste løbende ændring af kulstofkilden med dybden, men tilsvarende uændret trofiske position mellem individerne i hele vandsøjlen. Vores undersøgelser kunne ligeledes indikere en mere eller mindre omnivorisk fødesøgningsadfærd for C. finmarchicus fundet i Skagerrak. Overordnede indgik copepod arterne i samme trofiske nivieau som C. finmarchicus, dog med varierende kulstofkilder.
3
Summery The thesis is concerned with the vertical distribution of zooplankton, with special focus on calanoida species Calanus finmarchicus, in the Skagerrak. One of the most studied marine phenomena in marine ecology is the vertical distribution of species in the water column, including the diel vertical migration of zooplankton. This diel vertical migration, where the pelagic zooplankton species migrate from a few to hundred meters in a 24-‐h diurnal rhythm, is considered to be the biggest animal migration in terms of biomass on the planet. The normal pattern involves movement from shallow depths at night to greater depths during the day. Several hypotheses has been put forward in an attempt to explain the adaptive significance of diel vertical migration, but the predator evasion hypothesis are today consider the best-‐explanatory reason. The amplitude of the vertical movement of a population has been found to be different between species, including between ontogenetic stages of the same species, and may be influenced by factors such as availability of resources and hunger. The amplitude of the vertical distribution has been found to increase gradually with the development stage and maximized in the larger copepodite stages with higher lipid content. Previous studies have also indicated that hunger can be a primary controlling factor for when individuals migrate back to the surface. Thus energy reserves would also control the migration amplitude in relation between the safety of the depths and the foraging opportunities at the surface. The overall objective of this study was to determine the strength of the diel vertical migration for the examined pelagic zooplankton community, with a specific focus on C. finmarchicus distribution patterns in relation to size, lipid content and copepodite stages. In relation to the size and lipid mass distribution of C. finmarchicus did we find a significant correlation for both size and lipid mass with depth. In addition, the larger copepodite stages distributed relatively deeper than the earlier stages. The observed pattern of larger and late copepodite stages, stationary in deep strata, with highest lipid content in the deep-‐position individuals, agrees well with an onset dormancy pattern according to several studies. Further, we examined the isotopic differences in the water column for C. finmarchicus, in order to examine the potential variations between the isotopic ratio of δ15N and δ13C, as well as examine the trophic structure of the zooplankton community in relation to C. finmarchicus. The studies showed continuous change of carbon source with depth, with correspondingly unchanged trophic position between the individuals in the entire water column. Our studies could also indicate more or less omnivorous foraging behaviour for the C. finmarchicus found in Skagerrak. Overall entered the copepod species in the same trophic level as C. finmarchicus, however with some varying carbon sources.

4
Table of Contents General Introduction Forord ..................................................................................................................................................... 1 Resumé ................................................................................................................................................... 2 Summery ................................................................................................................................................ 3 Table of Contents ................................................................................................................................ 4 Introduction .......................................................................................................................................... 6 Calanus finmarchicus ................................................................................................................... 7 Dormancy .......................................................................................................................................... 8 Seasonal dynamics of life stages .............................................................................................. 8 Egg production ................................................................................................................................ 9 Skagerrak ........................................................................................................................................ 10 Diel vertical migration .............................................................................................................. 12 Distribution of C. finmarchicus .............................................................................................. 14 Energy base ................................................................................................................................... 15 Stable isotope ................................................................................................................................ 16 Isotopic baseline ..................................................................................................................... 18
The trophic position of C. finmarchicus relative to the other zooplankton and micronekton species found in the Skagerrak. ................................................................ 19
References .......................................................................................................................................... 21 Article Vertical distribution of zooplankton with emphasis on variation in lipid content and stable isotope signatures in Calanus finmarchicus in the deep part of Skagerrak ............................................................................................................................................ 30 Abstract ........................................................................................................................................... 30 Introduction .................................................................................................................................. 30 Materials and methods ............................................................................................................. 32 Sampling ..................................................................................................................................... 32 Laboratory analyses .............................................................................................................. 33 Isotope analyses ...................................................................................................................... 34 Vertical distribution analyses ............................................................................................ 34 Statistical analyses ................................................................................................................. 35
Results .............................................................................................................................................. 35 Hydrography ............................................................................................................................. 35 Vertical distribution .............................................................................................................. 36
5
Size, lipid and copepodite stage distribution of C. finmarchicus ........................ 37 Isotope analysis ....................................................................................................................... 43
Discussion ...................................................................................................................................... 44 Vertical distribution .............................................................................................................. 44 Size, lipid and copepodite stage distribution of C. finmarchicus ........................ 46 Isotopic distribution between depth strata of C. finmarchicus ........................... 47
References ...................................................................................................................................... 49

6
Introduction The pelagic community has an essential role in the transport of energy from the photic zone to the mesopelagic zone and the benthic communities. Plankton and micro nekton additionally contributes directly to the transport of organic matter and nutrients in the water column by their diel vertical migration displacement. Calanus finmarchicus plays a decisive role in this context, by converting low-‐energy carbohydrates and proteins in algae and phytoplankton into high-‐energy wax esters (Falk-‐Petersen et al. 2009). In relation with their daily migration in the upper water layers and annual immersion to the deep, C. finmarchicus constitute a vital link in the flow of energy from primary producers to the higher levels in the marine food chain (Runge and DeLafontaine 1996, Hansson et al. 1997, Petursdottir et al. 2008). Their ecological role is enabled trough their often massive populations in costal or shelf areas and their ability to fast accumulate high-‐energy reserves (Plourde and Runge 1993, Falk-‐Petersen et al. 2009), making C. finmarchicus the major source of energy for the larger stocks of fish, birds and marine mammals in the north Atlantic Seas (Falk-‐Petersen et al. 2009). For the majority of the distribution areas, C. finmarchicus account for about 40 – 90% of the zooplankton community (Melle et al. 2014), and function as an important food basis of a number of planktivorous fish species, including herring, mackerel, capelin, sandeel, young blue whiting and salmon, all of which are commercially significant species for the fishing industry (Trumble 1973, Dalpadado et al. 2000, Hind et al. 2000, Darbyson et al. 2003, Dommasnes et al. 2004, Smith and Link 2010). Consumption by herring along has been estimated at about 20-‐100% of the annual C. finmarchicus production (Dalpadado et al. 2000, Gislason and Astthorsson 2002, Dommasnes et al. 2004, Skjoldal et al. 2004, Prokopchuk and Sentyabov 2006, Utne et al. 2012). With that influence on the energy flux in the marine food web in mind, it is crucial to understand the population dynamics and trophic relationships in the pelagic communities of key species like C. finmarchicus. This thesis is therefore concerned
with the trophic role of C. finmarchicus and its vertical distribution in the water column, as well as any diel vertical migration patterns. The thesis will be based on data collected during a cruise in the Skagerrak Sea (Fig. 1) in mid-‐late summer 2014, however before the manuscript; a brief introduction to C. finmarchicus and a review of the location, diel vertical migration and stable isotope technique used, will be presented. Figure 1. Map of the study area with the position of sampling
stations (Bergstad et al. 2003).

7
Calanus finmarchicus The Calanus species, C. finmarchicus (Fig. 2) is an oceanic species with its core distribution in the Arctic and Northern Seas (Aksnes and Blindheim 1996). It considered one of the most important multicellular zooplankton species in the northern North Atlantic, based on its abundance and role in food webs and biogeochemical cycles. Together with two other important herbivore species of Calanus, C. glacialis and C. Hyperboreus, C. finmarchicus constitute a key link in the lipid-‐based energy flux in the Arctic and Northern Seas, by converting low-‐energy carbohydrates and proteins in algae and phytoplankton into high-‐energy wax esters (Falk-‐Petersen et al. 2009). For the majority of its area of distribution, C. finmarchicus account for about 40 – 90% of the zooplankton community by abundance and are concentrated in the two subpolar cyclonic gyres, in the Labrador/Irminger Seas and the southern Norwegian Sea (Melle et al. 2014). These cyclonic gyres are centred over deep ocean basins, and do also function as overwintering sites for C. finmarchicus (Båmstedt 2000, Hind et al. 2000, Heath et al. 2004, Falk-‐Petersen et al. 2009). Population centres, defined as regions where populations are overwintering, have been identified in the Labrador Sea, northern Irminger Basin, northern Iceland Basin, Faroe-‐Shetland Channel, eastern Norwegian Sea and Norwegian Trench (incl. Skagerrak) (Heath et al. 2004, Melle et al. 2014). During C. finmarchicus life cycle it develops from eggs to adult via six naupliar (NI-‐NVI) and five copepodid (CI-‐CV) stages after hatching. (Hind et al. 2000). The first two naupliar stages do not feed, and neither does the lipid-‐rich overwintering stages throughout dormancy (Sato et al. 2002, Petursdottir et al. 2010). During winter the larger part of the population, mainly copepodite stages (CIV-‐CV), migrates down to deep water. In the Norwegian Sea the overwintering stages start migrating to depths of >500m at the end of the vernal bloom in late summer and fall. (Williams 1985, Kaartvedt 1996, Fiksen and Carlotti 1998, Båmstedt 2000, Hind et al. 2000, Maar et al. 2002, Sato et al. 2002, Head et al. 2003, Heath et al. 2004, Petursdottir et al. 2008, Falk-‐Petersen et al. 2009, Melle et al. 2014). In fjords and shelf seas, the overwintering populations are found in deep trenches and basins (Kaartvedt 1996). The deep coastal basins and fjord of the Skagerrak, along the Danish and Norwegian coastline have shown sustainable-‐ and overwintering population of C. finmarchicus (Kaartvedt 1996, Båmstedt 2000, Heath et al. 2004, Melle et al. 2014).
Figure 2. Calanus finmarchicus. Photo (Miller 2004)

8
Dormancy When C. finmarchicus enters dormancy in late summer and fall, they carry with them lipid stores that make up for the most of their body weight (Hind et al. 2000, Falk-‐Petersen et al. 2009, Melle et al. 2014). These lipid stores sustain metabolism during the overwintering period (Falk-‐Petersen et al. 2009). The current theory is that this overwintering-‐behaviour enhances winter survival by reducing both predation risks and physiological costs, although the low temperatures may simply reduce physiological costs encountered at depth, by reducing the metabolism (Lampert 1989, Kaartvedt 1996, Hind et al. 2000, Hays 2003). Studies have shown considerable variability in the timing when C. finmarchicus enters dormancy, across their distribution range (Planque et al. 1997, Hind et al. 2000). Melle et al. (2014) demonstrated the start date of dormancy was more variable than the end date, and that C. finmarchicus enters dormancy later in the Northwest Atlantic, than in the Northeast Atlantic over similar spatial scales. They did also show that the timing of arousal occurs over a relatively short period in late winter across the entire range. This spatial variability in timing of dormancy could be explained by factors of food and temperature conditions, controlling the accumulation of storage lipid or environmental conditions experienced by individuals within populations. According to Clark et al. (2012), C. finmarchicus would remain active if the threshold of stored lipid is not sufficient, and from there molts to adulthood before descending to overwintering depth. In addition, the duration of dormancy is determined by the rate of stored lipid utilisation, which is temperature dependent (Hind et al. 2000, Falk-‐Petersen et al. 2009). Melle et al. (2014) explain the small variation for the timing of arousal across the entire range of North Atlantic as an effect of short dormancy duration due to warm water in the northwest area. In this area, studies (Maps et al. 2012) have shown that the population is forced in and out of dormancy during the late summer and only in late fall enters into full dormancy. This could contribute to the explanation of the relatively short period in late winter over which stage CVs emerge from dormancy throughout the North Atlantic, and why the Northwest Atlantic population enters dormancy later than the Northeast Atlantic population.
Seasonal dynamics of life stages The main overwintering stage is the pre-‐adult CV (McLaren et al. 2001, Heath et al. 2004). However, in regions influenced by arctic outflow, where water temperature is low, development rates are reduced and copepodite stages (CI-‐CIII) are found among the older overwintering copepodite stages (Broms and Melle 2007, Heath et al. 2008), suggesting that there is either a multiannual life cycle or an incapability to reach pre-‐adult stages within the first season (Melle and Skjoldal 1989). In the northern distribution, life cycles with a single annual generation are often the norm, and have mainly only a life span of one year (Båmstedt 2000, McLaren et al. 2001, Falk-‐Petersen et al. 2009). Further south there may be up to three generations per year, although the number of generations may vary among years in some areas and might even overlap (Irigoien 2000, Hirche et al. 2001, McLaren et al. 2001, Plourde et al. 2001, Head et al. 2013). Life span longer than one year is only described for C. finmarchicus from the Canadian archipelago (Longhurst et al. 1984), but are common for C.

9
glacialis and C. hyperboreus, that show an impressive plasticity, with life spans from one to few years or even longer (Hirche and Kattner 1993, Hirche and Niehoff 1996, Bonnet et al. 2005).
Egg production In mid-‐late winter (February-‐April) most C. finmarchicus leave dormancy from the depth and migrates to the surface waters, where they molt into adults and mate (Falk-‐Petersen et al. 2009). Females then lay their eggs in presence of the right environmental conditions. In this respect, egg production has proved to be closely coupled to water temperature and food levels of phytoplankton, for which chlorophyll-‐a concentration has shown to be a good proxy (Hirche 1990, Hirche et al. 1997, Runge et al. 2006). Studies of Hirche et al. (1997) and Pasternak et al. (2013) showed that egg production rate (EPR) increased with higher food concentrations, and increased exponentially with temperature. Their studies showed that egg production of C. finmarchicus stops under conditions of food shortage, which demonstrates that EPR depends on the external food availability. However, egg production prior to the spring bloom has been observed, when chlorophyll-‐a concentration were extremely low, indicating that C. finmarchicus is also able to use internal energy sources such as lipid reserves for egg production, or feed on alternative food (Richardson et al. 1999). But the extent to which internal body stores contribute to egg production for C. finmarchicus is still unspecified (Melle et al. 2014). For comparison, it is well known that C. hyperboreus uses internal body stores to produce eggs without any external food supply (Conover 1988). In general, EPR is clearly strongly related to food availability, and especially the phytoplankton concentration, throughout the North Atlantic (Hirche et al. 1997, Båmstedt 2000, Hind et al. 2000). But some studies have demonstrated that large spawning events sometimes occurs at relatively low food concentrations and low individual rates before the spring bloom, simply due to higher abundance of females (Niehoff et al. 1999, Richardson et al. 1999, Stenevik et al. 2007). This may point to other controlling factors for the spawning period of C. finmarchicus, than food variability alone. In regard to the temperature, both Hirche et al. (1997) and Pasternak et al. (2013) discloses findings that show the EPR of C. finmarchicus to increase with temperature in laboratory studies. Their results suggest that the C. finmarchicus EPR increases with temperature under favourable feeding conditions. Though, the effects of changes in temperature in situ are not broadly predictable. For example Melle et al. (2014) in situ trials, could only find a positive correlation between temperature and EPR in three study regions, a negative correlation in one and no relationship in eighth other. Hirche (1990) also demonstrated some regional differences with a higher average daily EPR measured, 24,4 eggs female-‐1 d-‐1 at 0 °C, than the highest rate of 21.9 eggs female-‐1 d-‐1 reported for C. finmarchicus by Marshall and Orr (1952) at 5 °C, and considerably higher than the average rates of 4 to 5 eggs female-‐1 d-‐1 assumed by Davis (1987). Other controlling factors may also influence EPR at different distribution areas. For example, local effect of food types available during spawning has shown an effect on timing and EPR, based on the available external energy e.g. (Niehoff et al. 1999, Jonasdottir et al. 2002, Niehoff

10
2004). The fact that females are known to feed omnivorously (Runge and DeLafontaine 1996, Ohman and Hirche 2001), can make chlorophyll concentrations less relevant, and to some extent, a unfitting measure for the overall food concentration. In light of the high degree of variability represented by these studies, prediction of EPR for C. finmarchicus from mere environmental variables such as chlorophyll concentration and especially temperature can seem inadequate, and other local factors may prove to be just as important.
Skagerrak Skagerrak (Fig. 3A) is a continental margin sea covering 32000 km2 of both shelf and slope environments (Stahl et al. 2004). It’s located in-‐between the North Sea and Kattegat, and borders from the line between Lindeness (Norway) and Hanstholm (Denmark), into Kattegat Marstand (Sweden) and Skagens rev (Denmark). The area creates the transition zone where water masses from the North Sea, and the shallow brackish Kattegat/Baltic Sea meets. The area is characteristic of its steep slopes dropping down to a maximum depth of a little over 700m and with mean depth of 210m, making it a deep water area (Rodhe 1987, Lund-‐Hansen et al. 1994). The deepest basin, called the Norwegian Trench, cuts through the entire Skagerrak in a northeastern to southwestern direction with a shelf to the south at 270m, giving it a topography of a large fjord (Rodhe 1987, Fonselius 1995, Stahl et al. 2004). At the northeastern end, the Trench has a narrow continuation into the Kattegat with average depth of about 100m (Rodhe 1987). The surface water consist of the incoming Jutland Current, passing along the western Danish coastline, and the outgoing brackish Baltic current, that together forms the Norwegian Coastal Current (Svansson 1975, Lund-‐Hansen et al. 1994, Maar et al. 2002). A counter-‐clockwise circulation dominates the water exchange of the Skagerrak with water from the North Sea, with a salinity of 33–35 ppt, entering the deep southwestern Skagerrak two places via the Jutland current and the Central North Sea current. From the southeast comes the outgoing Kattegat/ Baltic water with a salinity of 10 -‐20 ppt. The northbound Kattegat/ Baltic current originates from the innermost of the Baltic Sea and has been mixed in the Kattegat. This current continues north into Skagerrak along the Swedish coastline and mostly out to the North Sea along the Norwegian coast, but a small part is re-‐circulated back around the Skagerrak (Fig. 3B) (Rodhe 1987, Rodhe et al. 2004). In depth along the Norwegian Trench flows colder Atlantic water from north directly into the Skagerrak, this is only partly mixed with North Sea waters. The Atlantic current flow is parallel to the depth of the contours along the Norwegian Trench, which indicate a separate body of water (Rodhe 1987, Lalli and Parsons 1997, Hvas et al. 1998). The yearly mean fresh water supply comes from the Baltic with around 15000 m3 s-‐1, and an additional 2000 m3 s-‐1 from river outlet directly into the Skagerrak, of which the majority comes from the Norwegian rivers and fjords. The remaining water supply is a mixture of the different water masses entering the area (Svansson 1975, Lund-‐Hansen et al. 1994, Stahl et al. 2004). This circulation of water masses creates a characteristic pycnocline profile across the Skagerrak by mixing the water column at the periphery, while the central part is stratified most of the year. In summertime a thermocline

11
of 10°C difference between the surface and bottom water often arise, thus reinforcing the stratification effect in the centre. (Rodhe et al. 2004). The Skagerrak is characterized by high current velocities generated by the many water bodies entering the area to replace the water which is transported out through the Norwegian Coastal Current (Svansson 1975, Lund-‐Hansen et al. 1994). The mean transport of water due to the counter-‐clockwise circulation is estimated at between 0.5 and 1.0 X 10⁶ m3 s-‐1 giving it a flushing time above the shelf depth of around 100 days (Rodhe 1987). The direction of circulation occasionally changes in at the upper layers, whereas in the deeper layers, the cyclonic circulation is more or less present at all times. The mean velocity is also highest below and close to the shelf depth in the area of the Danish slope of the trench, 0,15-‐0,2 m s-‐1, and gets lesser where the water leaves the Skagerrak, along the Norwegian coast, 0,05-‐0,1 m s-‐1 (Rodhe 1987, Rodhe et al. 2004).
Figure 3. A: Skagerrak and the bordering seas. The coloured scale indicates the water depth in meters. From (Hvas et al. 1998). B: Representation of the general circulation in the North Sea, Skagerrak and Kattegat. The black arrows show the surface currents while the grey arrows showing the water current in depth. The arrow thickness indicates the strength of the currents. From (Hvas et al. 1998).
A B

12
Waters entering the Skagerrak are strongly influenced by the heavily populated catchment areas from both the Kattegat, Baltic and North Sea areas. A total of about 85 million people are living in the Kattegat/ Baltic Sea catchment, and 184 million in the North Sea catchment (Rodhe et al. 2004). This gives the area a potentially strong impact by nutrients and organic compounds originating from anthropological activity, which heavily can affect the ecosystem structure. Deposition of nitrogen from the atmosphere is estimated to represent 30-‐40% of the total nitrogen input, but this has been shown to rise in recent years, due to nitrogen limitation from agriculture over the last decade. The nutrient concentration fluctuates during the year, depending on the primary production and runoff from catchment areas. Especially the inner Danish waters is a source of large nutrient discharge via the Kattegat during autumn and winter storms (Miljøministeriet 2011). The nutrients considered limiting for the organic primary production in the Skagerrak are generally nitrogen, phosphorus and silicon. Seasonal limiting of ions like iron and cobalt may sometimes also be important (Tett et al. 2003).
Diel vertical migration Many taxa of both marine and freshwater zooplankton perform diel vertical migrations (DVM) and this behaviour probably represents the largest animal migration, in terms of biomass, on the planet. The normal pattern involves movement from shallow depths at night to greater depths during the day. The causation of DVM in the planktonic community has over the last century, led to numerous investigations into this phenomenon. Early studies have focused on quantifying the occurrence of this behaviour, and to which extent this behaviour was present in different taxa (Hays et al. 2001). Around the sixties the main focus on DVM was to identify the stimuli for initiation of the migration, and the ambient light intensity was determined as the triggering cue for the direction of the migration (e.g. (McNaught and Hasler 1964, Ringelberg et al. 1967). Later the focus of most research shifted from environmental cues, to consideration of the ultimate reasons that drives this behaviour (e.g. (Huntley and Brooks 1982, Giske et al. 1990, Bollens et al. 1992, Fiksen and Carlotti 1998). The normal pattern for DVM is an evening ascent to the surface layers where they feed during the night, and decent around dawn at sunrise, though several cases of reversed migration have been describe (Ohman et al. 1983). This may be strongly depending on size and pigmentation of the individual zooplankton species (e.g. (Zaret and Kerfoot 1975, Hays et al. 1994). The difference between the day and night depths defines the amplitude of DVM, and the shape of migration may either go up and down together in a narrow band, or may be sharply stratified in deep waters during the day but spread throughout the entire water column at night (Hays 2003). The amplitude and the shape of the vertical distribution of a population has been shown to be very different between species and between ontogenetic stages of the same species, and may be influenced by factors like turbidity food abundance and hunger (Bohrer 1980, Huntley and Brooks 1982, George 1983). A number of different hypotheses of DVM have been presented to explain the ultimate reasons for this behaviour. The majority of them can be divided into two broad categories
13
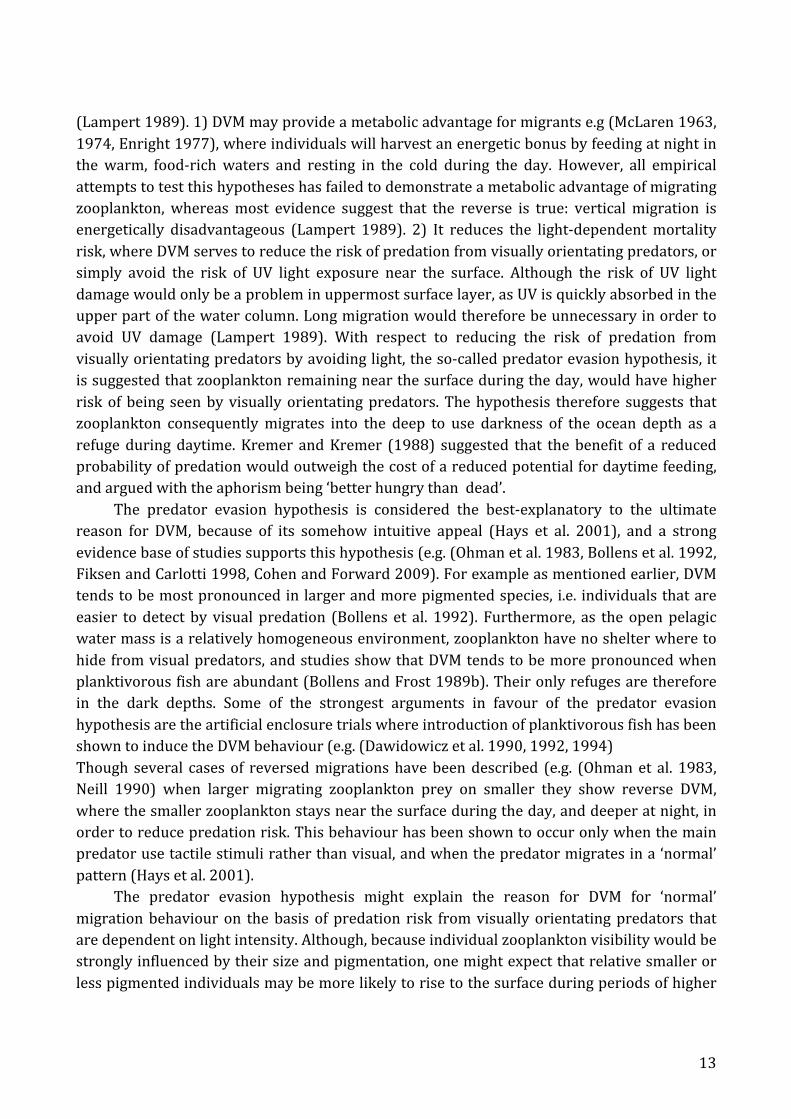
(Lampert 1989). 1) DVM may provide a metabolic advantage for migrants e.g (McLaren 1963, 1974, Enright 1977), where individuals will harvest an energetic bonus by feeding at night in the warm, food-‐rich waters and resting in the cold during the day. However, all empirical attempts to test this hypotheses has failed to demonstrate a metabolic advantage of migrating zooplankton, whereas most evidence suggest that the reverse is true: vertical migration is energetically disadvantageous (Lampert 1989). 2) It reduces the light-‐dependent mortality risk, where DVM serves to reduce the risk of predation from visually orientating predators, or simply avoid the risk of UV light exposure near the surface. Although the risk of UV light damage would only be a problem in uppermost surface layer, as UV is quickly absorbed in the upper part of the water column. Long migration would therefore be unnecessary in order to avoid UV damage (Lampert 1989). With respect to reducing the risk of predation from visually orientating predators by avoiding light, the so-‐called predator evasion hypothesis, it is suggested that zooplankton remaining near the surface during the day, would have higher risk of being seen by visually orientating predators. The hypothesis therefore suggests that zooplankton consequently migrates into the deep to use darkness of the ocean depth as a refuge during daytime. Kremer and Kremer (1988) suggested that the benefit of a reduced probability of predation would outweigh the cost of a reduced potential for daytime feeding, and argued with the aphorism being ‘better hungry than dead’. The predator evasion hypothesis is considered the best-‐explanatory to the ultimate reason for DVM, because of its somehow intuitive appeal (Hays et al. 2001), and a strong evidence base of studies supports this hypothesis (e.g. (Ohman et al. 1983, Bollens et al. 1992, Fiksen and Carlotti 1998, Cohen and Forward 2009). For example as mentioned earlier, DVM tends to be most pronounced in larger and more pigmented species, i.e. individuals that are easier to detect by visual predation (Bollens et al. 1992). Furthermore, as the open pelagic water mass is a relatively homogeneous environment, zooplankton have no shelter where to hide from visual predators, and studies show that DVM tends to be more pronounced when planktivorous fish are abundant (Bollens and Frost 1989b). Their only refuges are therefore in the dark depths. Some of the strongest arguments in favour of the predator evasion hypothesis are the artificial enclosure trials where introduction of planktivorous fish has been shown to induce the DVM behaviour (e.g. (Dawidowicz et al. 1990, 1992, 1994) Though several cases of reversed migrations have been described (e.g. (Ohman et al. 1983, Neill 1990) when larger migrating zooplankton prey on smaller they show reverse DVM, where the smaller zooplankton stays near the surface during the day, and deeper at night, in order to reduce predation risk. This behaviour has been shown to occur only when the main predator use tactile stimuli rather than visual, and when the predator migrates in a ‘normal’ pattern (Hays et al. 2001). The predator evasion hypothesis might explain the reason for DVM for ‘normal’ migration behaviour on the basis of predation risk from visually orientating predators that are dependent on light intensity. Although, because individual zooplankton visibility would be strongly influenced by their size and pigmentation, one might expect that relative smaller or less pigmented individuals may be more likely to rise to the surface during periods of higher

14
ambient light than larger pigmented individuals. Hays (1995) comparison between species and developmental stages support this argument. The study showed that juvenile stages of the copepod Metridia lucens spend longer time near the surface than the larger adult stages, whereas the larger copepod, Metridia longa, spends even less time at the surface each night. From this consideration of size:predation risk, argues Fiksen and Carlotti (1998) theoretically that the benefit of DVM on daily basis may depend on the given individual’s body condition. They looked at C. finmarchicus optimal migration strategy relative to the individual lipid reserves. They suggested that individuals with larger lipid reserves, thus potentially also more visible, might benefit less from near surface foraging, since they have sufficient resources to remain at depth until the reserves are depleted and hunger again drives them to the surface. Moreover, this prediction has been supported by empirical observations that showed how lipid rich individuals can maintain their reproductive output without increasing their risk of predation by near-‐surface foraging and therefore spend less time at the surface than their lipid poor co-‐specifics (Hays et al. 2001). The different suggested DVM controlling factors agree well with (Huntley and Brooks 1982) earlier findings. They investigated age-‐specific differences in DVM behaviour of Calanus pacificus, and found interestingly that the amplitude of vertical migration gradually increased with age, becoming maximal in the larger copepodite stages. Night depths remained constant with age while daytime depths increased. They also showed that the migratory behaviour of larger copepodite stages was influenced by the available food quantity. When phytoplankton was abundant and individual ingestion rates were high, copepodites performed high-‐amplitude migrations. As food availability declined, however, migration amplitudes decreased and the copepodites remained in the relatively food-‐rich surface waters at all times (Huntley and Brooks 1982). These results conform with the predator evasion hypothesis, that large more visually recognizable individuals seek safety deeper during daytime. It also suggests that hunger could be a primary controlling factor for when individuals migrates back towards the surface, and that energy reserves may control the migration amplitudes.
Distribution of C. finmarchicus As mention earlier, C. finmarchicus occurs throughout the North Atlantic (Fig. 4), and it has long been recognized that the species is a key contributor to the zooplankton ecosystem and particularly to the copepod biomass in this ocean. Main C. finmarchicus centres of distribution are in the Norwegian Sea and the Labrador Sea. Overwintering and breeding areas are generally concentrated around deep ocean basins and shelf seas. (Båmstedt 2000, Hind et al. 2000, Heath et al. 2004, Falk-‐Petersen et al. 2009, Melle et al. 2014). Matthews (1969) found two oceanic centres of abundance of C. finmarchicus, firstly in the oceanic area south of Greenland to the Labrador/Irminger Seas, secondly in the Norwegian Sea extending into the northern North Sea. These two areas do also function as centres of reproduction, and two oceanic cyclonic gyres, one within each area, transport the populations by currents from these reproduction centres into other regions of the North Atlantic. The spatial distribution of the log-‐transformed mean annual abundance of C. finmarchicus across the North Atlantic between

15
1958-‐1996 is shown in figure 4. The abundance is highest in the western part of the Atlantic, especially in the area of the Labrador Sea, and the ocean between the Irminger Basin and south of Greenland. From here the majority of the population disperses with the Gulf Stream and the North Atlantic drift to the Northeastern Atlantic. The data showed a restricted northern distribution partly due to northbound transport by the north Atlantic current, but also a tendency to a temperature restriction for a southern passage via the Azores Current (Planque and Batten 2000) Temperature is in this context considered one of the main factors controlling C. finmarchicus abundance and distribution range, thus creating a southern border (Kvile et al. 2014).
Figure 4. Spatial distribution of C. finmarchicus in the period between 1958-‐1996. The original abundance data have been log-‐transformed (log10 (x+1)), interpolated on regular grid and averaged. Grey scale is proportional to the resulting mean log-‐abundance. From (Planque and Batten 2000).
Energy base The synthesis of wax esters is a special adaptation in Calanus species and some other zooplankton to cope with the high seasonality of food availability. These lipid stores sustain metabolism during overwintering and subsequent molting and partial development of gonads in mid-‐late winter (Rey-‐Rassat et al. 2002). The adaptation is an effective way to quickly produce and to ensure high amounts of lipids during food plenty. The chemical components of wax esters are simple and consist of one fatty acid esterified to a long chain fatty alcohol in equimolar amounts (Bell et al. 1986). The arousal lipid-‐rich C. finmarchicus returning from winter diapause function as an important basis for the diet of a number of planktivorous fish species, including herring,
16
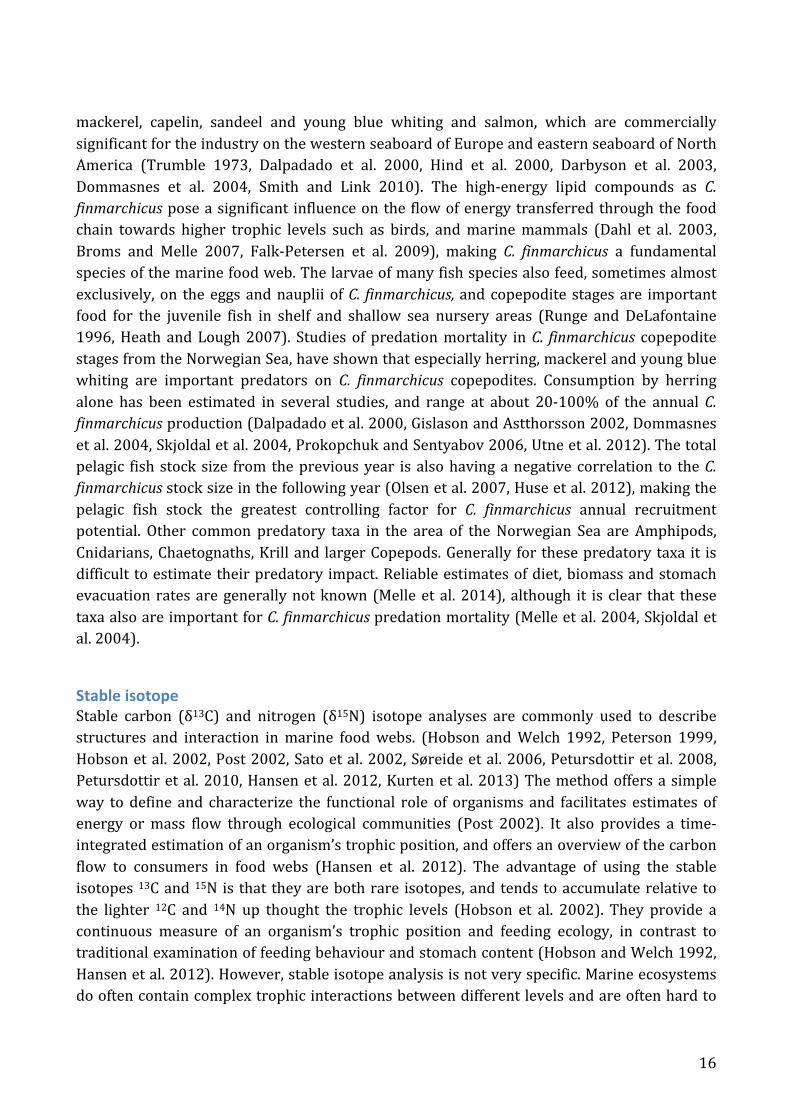
mackerel, capelin, sandeel and young blue whiting and salmon, which are commercially significant for the industry on the western seaboard of Europe and eastern seaboard of North America (Trumble 1973, Dalpadado et al. 2000, Hind et al. 2000, Darbyson et al. 2003, Dommasnes et al. 2004, Smith and Link 2010). The high-‐energy lipid compounds as C. finmarchicus pose a significant influence on the flow of energy transferred through the food chain towards higher trophic levels such as birds, and marine mammals (Dahl et al. 2003, Broms and Melle 2007, Falk-‐Petersen et al. 2009), making C. finmarchicus a fundamental species of the marine food web. The larvae of many fish species also feed, sometimes almost exclusively, on the eggs and nauplii of C. finmarchicus, and copepodite stages are important food for the juvenile fish in shelf and shallow sea nursery areas (Runge and DeLafontaine 1996, Heath and Lough 2007). Studies of predation mortality in C. finmarchicus copepodite stages from the Norwegian Sea, have shown that especially herring, mackerel and young blue whiting are important predators on C. finmarchicus copepodites. Consumption by herring alone has been estimated in several studies, and range at about 20-‐100% of the annual C. finmarchicus production (Dalpadado et al. 2000, Gislason and Astthorsson 2002, Dommasnes et al. 2004, Skjoldal et al. 2004, Prokopchuk and Sentyabov 2006, Utne et al. 2012). The total pelagic fish stock size from the previous year is also having a negative correlation to the C. finmarchicus stock size in the following year (Olsen et al. 2007, Huse et al. 2012), making the pelagic fish stock the greatest controlling factor for C. finmarchicus annual recruitment potential. Other common predatory taxa in the area of the Norwegian Sea are Amphipods, Cnidarians, Chaetognaths, Krill and larger Copepods. Generally for these predatory taxa it is difficult to estimate their predatory impact. Reliable estimates of diet, biomass and stomach evacuation rates are generally not known (Melle et al. 2014), although it is clear that these taxa also are important for C. finmarchicus predation mortality (Melle et al. 2004, Skjoldal et al. 2004).
Stable isotope Stable carbon (δ13C) and nitrogen (δ15N) isotope analyses are commonly used to describe structures and interaction in marine food webs. (Hobson and Welch 1992, Peterson 1999, Hobson et al. 2002, Post 2002, Sato et al. 2002, Søreide et al. 2006, Petursdottir et al. 2008, Petursdottir et al. 2010, Hansen et al. 2012, Kurten et al. 2013) The method offers a simple way to define and characterize the functional role of organisms and facilitates estimates of energy or mass flow through ecological communities (Post 2002). It also provides a time-‐integrated estimation of an organism’s trophic position, and offers an overview of the carbon flow to consumers in food webs (Hansen et al. 2012). The advantage of using the stable isotopes 13C and 15N is that they are both rare isotopes, and tends to accumulate relative to the lighter 12C and 14N up thought the trophic levels (Hobson et al. 2002). They provide a continuous measure of an organism’s trophic position and feeding ecology, in contrast to traditional examination of feeding behaviour and stomach content (Hobson and Welch 1992, Hansen et al. 2012). However, stable isotope analysis is not very specific. Marine ecosystems do often contain complex trophic interactions between different levels and are often hard to

17
examine under strict empirical conditions. Observations of feeding behaviour and trophic relations are therefor often hard or almost impossible to collect. Stable isotope analysis offers in contrast a possibility to examining these structures and the dynamics in marine food webs (Peterson and Fry 1987, Vander Zanden et al. 1999). The use of stable isotopes of carbon and nitrogen for analysis of marine ecosystems began with DeNiro and Epstein (1978, 1981). They found a correlation between the ratio of heavy to light isotopes of C and N in organisms and their trophic position (Hansen et al. 2012). The method to estimate the trophic position and feeding strategy of an organism is based on the principle that heavier isotopes accumulate from prey to predator (i.e. diet-‐tissue enrichment) and thus builds up through the food chain. The principle is that the lighter isotope (i.e. 12C and 14N) reacts at a faster rate -‐ leading to a higher δ value (heavy isotope enrichment) in the remaining substrate (Hansen et al. 2012). This accumulation of isotopes between prey and predator is called fractionation, and 13C and 15N accumulates differently between trophic levels, due to the different metabolic retention (Peterson and Fry 1987).
Mean fractionation of 15N between each trophic level is estimated at 3 to 4‰, relative to the organism’s diet, and can therefore be used to estimate the organism trophic position (Deniro and Epstein 1981, Peterson and Fry 1987, Post 2002). In contrast to 15N fractionation, the 13C isotope changes little as it moves through the food web (0 to 1‰ acc. Peterson and Fry (1987)). Sweeting et al. (2007) found fractionation values among fish at 1 to 2‰. Whereas DeNiro and Epstein (1978) showed that δ13C values between primary producers-‐ and consumers were almost unchanged. Due to this small or no fractionation of 13C between trophic levels, makes δ13C to a poor indicator for determining the organism trophic positions, in contrast with δ15N. Instead, δ13C is used to determine the organisms’ position in the environment (carbon source) as well as any migration pattern, due to the spatial variation in the carbon composition of the sources. Therefore, δ13C is often used to estimate the carbon source and mass flow through all the different trophic pathways leading to the organism (Rounick and Winterbourn 1986, Peterson and Fry 1987, Post 2002).
Due to the high fractionation of 15N between each trophic level (3 to 4‰, (Peterson and Fry 1987)), δ15N is considered ideal for estimation of trophic levels. Post (2002) concludes that the simplest model for estimating the trophic position of a secondary consumer is the measure of enrichment of nitrogen per trophic level, using the formula:
TL! = λ!"#$ +!"#!!"#$%&'() !"#$%&'( ! !"#!!"#$)
!"#$!
were λbase is the trophic position of the organism used to estimate δ15Nbase (e.g. 1 for primary producers or 2 for herbivores (primary consumers)). The δ15Nsecondary consumer is the δ15N measured value for the organism of interest (secondary consumer or any higher). The δ15Nbase is the mean value of the isotopic baseline and must capture the temporal variation in δ15N of primary producers and detrital energy sources for those consumers in question. Δδ15N is fractionation enrichment per trophic level, assumed to be between 3‰ and 4‰ (Peterson and Fry 1987). From the equation it is important to note the unknowns of δ15Nscondary consumer
18
and δ15Nbase. These are measured, but to get a sufficient estimate of the trophic position, one most have a good estimate of δ15Nbase (sample baseline). Post (2002) stated that the isotopic signature of a consumer alone is not generally sufficient to infer trophic position or carbon source without an appropriate isotopic baseline.
Isotopic baseline In general, it is straightforward to use the stable isotope ratio to evaluate structures of food webs but the challenge in this method is to compare the results across multiple systems (Cabana and Rasmussen 1996, Post 2002). There are considerable variation among ecosystems from which organisms draw their carbon and nitrogen. This variation is due to the differences in isotope ratio for the biologically available carbon and nitrogen at the base of the food chain and the variation in the fractionation rate (Rounick and Winterbourn 1986, Vander Zanden et al. 1999, Post et al. 2000, Hansen et al. 2012). These conditions make comparison between multiple systems difficult and it is therefore necessary to have an isotopic baseline to correct for the relative ratios of δ13C and δ15N. Without suitable estimates of δ13Cbase and δ15Nbase in each system, there is genuinely no way to determine if variation in the δ13C and δ15N of an organism reflects changes in food web structure and carbon flow, or just a variation in the δ13Cbase and δ15Nbase However, obtaining a suitable isotopic baseline is one of the most difficult problems the application of stable isotope techniques are facing (Post 2002). In marine ecosystems, most primary producers has a high variation in δ13C and δ15N over time, which complicate their direct usefulness as indicators of δ13Cbase and δ15Nbase for consumers higher up the food chain, that integrate δ13C and δ15N over much longer time periods (Cabana and Rasmussen 1996). Furthermore, it is difficult to sample primary producers in pelagic systems. In order to reduce the variation in the base level, Cabana and Rasmussen (1996) and Vander Zanden and Rasmussen (1999) suggest using long lived organisms to quantify δ13Cbase and δ15Nbase, because the temporal variance of their isotopic signature is much lower than that of short living primary producers (Post 2002). This could be for example mussels, which live as stationary primary consumers in the same area, making them less sensitive to temporal variations.
For a simple and more straightforward evaluation of food web structures and material flow within a single confined system, a relatively simple use of stable isotope ratios, without a baseline, has shown potential (Peterson et al. 1985, Keough et al. 1996, Hansson et al. 1997). This evaluation, however, will only have a mere outline representation of the systems mass flow and trophic relations, and would only really show an image of the accumulation of the heavier isotopes through the food chain. It would therefore only represent a small confined structure, with no possibility of compare the results across multiple systems (Kling et al. 1992, Post 2002). However, this approach could give a structural idea of carbon source and trophic order within a single system (Peterson et al. 1985, Hansson et al. 1997).

19
The trophic position of C. finmarchicus relative to the other zooplankton and micronekton species found in the Skagerrak. Søreide et al. (2008) and Petursdottir et al. (2010), both of which investigated variation in stable isotope ratios for C. finmarchicus in relation to life history found lower values of δ15N than the 10 to 10.8 ‰ found in our study. Their results suggested that C. finmarchicus was a pure herbivore, even during times with low algal biomass. Previous studies, however, have suggested that ciliates and heterotrophic dinoflagellates could be important food sources for C. finmarchicus in periods of deeper distribution and post-‐bloom, when algal food is scarce (Ohman and Runge 1994, Levinsen et al. 2000). Other studies have also shown that females feed omnivorously in periods of low food source availability during spawning (Runge and DeLafontaine 1996, Ohman and Hirche 2001). It therefore appears that C. finmarchicus feeds omnivorously in the Skagerrak in August throughout the water column, as we did not find any significant change in δ15N with depth. It is interesting to note, that the Dinoflagellate Ceratium tripos that was obtained in great numbers in the 55µm surface samples appear to be on the same trophic level as C. finmarchicus according to its δ15N value, while δ13C indicate that they rely on different carbon sources. The other species sampled in the Multinet appeared to feed at almost the same trophic level as C. finmarchicus, based on δ15N, and positioned 4 – 6 ‰ above the δ15N signature of particles (POM) obtained in a sediment trap at 40 m depth. However, the variations in δ13C values suggest that carbon sources may differ and that these differences vary with respect to depth stratum. Some species like Parathemisto abyssorum and young Meganyctiphanes norvegica also displayed variation between depth intervals. Parathemisto abyssorum mean δ15N values vary from 8.6 to 10.5‰ and Meganyctiphanes norvegica between 9.4 and 11.4‰. These difference may indicate a trophic shifts in relation to their position in the water column. Studies of C. finmarchicus have shown a high degree of plasticity, both in time and space (Fiksen and Giske 1995, Fiksen and Carlotti 1998, Pepin and Head 2009, Kvile et al. 2014, Melle et al. 2014). The isotopic composition has been shown to be able to change within a few weeks. In C. finmarchicus, for example, a switch in diet (from Bacillariophyceae to Dinophyceae) changed the isotopic fingerprints within only two weeks (Graeve et al. 2005). These somewhat fluctuating factors of individual feeding and ontogenetic stage strategies, only adds to the rationale for interpreting the trophic picture in a more three dimensional way. The isotopic signature of C. finmarchicus was compared to signatures of Euphausids and Decapods obtained in hauls of an Isaacs-‐Kidd Midwater Trawl (Fig. 5F). These data showed clear segregation of isotopic niches, with Pontophilus norvegicus lying more than one trophic level above C. finmarchicus according to accepted values for fractionation between trophic levels, (Michener and Kaufman 2008), (Deniro and Epstein 1981, Peterson and Fry 1987). Thus, C. finmarchicus may constitute an important food source for some of these Decapods.

20
100-‐200m
Calanus vinmarchicus Parathemisto abyssorum Gaidius tenuispinus
C
5
7
9
11
13
δ15 N
200-‐350m
Calanus vinmarchicus Pareuchata norvegica Parathemisto abyssorum Gaidius tenuispinus Meganyctiphanes norvegica
D
5
7
9
11
13
δ15 N
350-‐500m
Calanus vinmarchicus Pareuchata norvegica
Parathemisto abyssorum Sagitta spp.
Meganyctiphanes norvegica
E
9
10
11
12
13
14
15 δ1
5 N
F
Calanus vinmarchichus
Pasiphaea multidentata
Munida tenuimana
Pasiphaea tarda
Crangon crangon
Pandalus borealis
Pontophilus norvegicus
Pasiphaea sivado
Meganyctiphanes norvegica
-‐25 -‐23 -‐21 -‐19 -‐17 δ13C 0-‐50m
Calanus vinmarchicus Pareuchata norvegica Centropages typicus Metridia longa Meganyctiphanes norvegica Ceratium tripos POM
4
6
8
10
12
14 -‐25 -‐23 -‐21 -‐19 -‐17
δ15 N
δ13C 50-‐100m
Calanus vinmarchicus Metridia longa Gaidius tenuispinus
B A
Figure 5. Mean δ13C and δ15N ratio for the sampled zooplankton and shrimp species from Skagerrak. A-‐E: Comparison of C. finmarchicus with the sampled pelagic zooplankton, according to sampling depth intervals. F: Comparison of C. finmarchicus with collected krill and shrimp species.
21
References Aksnes, D. L., and J. Blindheim. 1996. Circulation patterns in the North Atlantic and possible
impact on population dynamics of Calanus finmarchicus. Ophelia 44:7-‐28. Bell, M. V., R. J. Henderson, and J. R. Sargent. 1986. The role of polyunsaturated fatty-‐acids in
fish. Comparative Biochemistry and Physiology B-‐Biochemistry & Molecular Biology 83:711-‐719.
Bergstad, O. A., A. D. Wik, and O. Hildre. 2003. Predator-‐prey relationships and food sources of the Skagerrak deep-‐water fish assemblage. Journal of Northwest Atlantic Fishery Science 31:165-‐180.
Bohrer, R. 1980. Experimental studies on diel vertical migration. In Ecology and Evolution of Zooplankton Communities (ed. W.C. Kerfoot) University Press of New England, Hanover, New Hampshire:111-‐121.
Bollens, S. M., and B. W. Frost. 1989a. Predator-‐induced diel vertical migration in a planktonic copepod. J Plankton Res 11:1047-‐1065.
Bollens, S. M., and B. W. Frost. 1989b. Zooplanktivorous fish and vanable diel vertical migration in the marine planktonic copepod Calanus pacificus. Limnol.Oceanogr. 34:1072-‐1083.
Bollens, S. M., B. W. Frost, D. S. Thoreson, and S. J. Watts. 1992. Diel vertical migration in zooplankton: field evidence in support of the predator avoidance hypothesis. Hydrobiologia 234:33-‐39.
Bonnet, D., A. Richardson, R. Harris, A. Hirst, G. Beaugrand, M. Edwards, S. Ceballos, R. Diekman, A. Lopez-‐Urrutia, L. Valdes, F. Carlotti, J. C. Molinero, H. Weikert, W. Greve, D. Lucic, A. Albaina, N. D. Yahia, S. F. Umani, A. Miranda, A. dos Santos, K. Cook, S. Robinson, and M. L. F. de Puelles. 2005. An overview of Calanus helgolandicus ecology in European waters. Progress in Oceanography 65:1-‐53.
Broms, C., and W. Melle. 2007. Seasonal development of Calanus finmarchicus in relation to phytoplankton bloom dynamics in the Norwegian Sea. Deep-‐Sea Research Part Ii-‐Topical Studies in Oceanography 54:2760-‐2775.
Båmstedt, U. 2000. Life cycle, seasonal vertical distribution and feeding of Calanus finmarchicus in Skagerrak coastal water. Marine Biology 137:279-‐289.
Cabana, G., and J. B. Rasmussen. 1996. Comparison of aquatic food chains using nitrogen isotopes. Proceedings of the National Academy of Sciences of the United States of America 93:10844-‐10847.
Clark, K. A. J., A. S. Brierley, and D. W. Pond. 2012. Composition of wax esters is linked to diapause behavior of Calanus finmarchicus in a sea loch environment. Limnology and Oceanography 57:65-‐75.
Cohen, J. H., and R. B. Forward. 2009. Zooplankton diel vertical migration -‐ a review of proximate control. Pages 77-‐109 in R. N. Gibson, R. J. A. Atkinson, and J. D. M. Gordon, editors. Oceanography and Marine Biology: An Annual Review, Vol 47. Crc Press-‐Taylor & Francis Group, Boca Raton.
Conover, R. J. 1988. Comparative life histories of the genera Calanus and Neocalanus in high latitudes of the northern hemisphere. Hydrobiologia 167:127-‐142.
Conway, D. V. P. 2006. Identification of the copepodite developmental stages of twenty-‐six North Atlantic copepods. Marine Biological Association of the United Kingdom, Occasional Publications.

22
Dahl, T. M., S. Falk-‐Petersen, G. W. Gabrielsen, J. R. Sargent, H. Hop, and R. M. Millar. 2003. Lipids and stable isotopes in common eider, black-‐legged kittiwake and northern fulmar: a trophic study from an Arctic fjord. Marine Ecology Progress Series 256:257-‐269.
Dalpadado, P., B. Ellertsen, W. Melle, and A. Dommasnes. 2000. Food and feeding conditions of Norwegian spring-‐spawning herring (Clupea harengus) through its feeding migrations. Ices Journal of Marine Science 57:843-‐857.
Darbyson, E., D. P. Swain, D. Chabot, and M. Castonguay. 2003. Diel variation in feeding rate and prey composition of herring and mackerel in the southern Gulf of St Lawrence. Journal of Fish Biology 63:1235-‐1257.
Davis, C. S. 1987. Components of the zooplankton production cycle in the temperate ocean. Journal of Marine Research 45:947-‐983.
Dawidowicz, P., and C. J. Loose. 1992. Metabolic costs during predator-‐induced diel vertical migration of Daphnia. Limnology and Oceanography 37:1589-‐1595.
Dawidowicz, P., J. Pijanowska, and K. Ciechomski. 1990. Vertical migration of Chaoborus larvae is induced by the presence of fish. Limnology and Oceanography 35:1631-‐1637.
Deniro, M. J., and S. Epstein. 1978. Influence of Diet on Distribution of Carbon Isotopes in Animals. Geochimica Et Cosmochimica Acta 42:495-‐506.
Deniro, M. J., and S. Epstein. 1981. Influence of Diet on the Distribution of Nitrogen Isotopes in Animals. Geochimica Et Cosmochimica Acta 45:341-‐351.
Dommasnes, A., W. Melle, P. Dalpadado, and B. Ellertsen. 2004. Herring as a major consumer in the Norwegian Sea. Ices Journal of Marine Science 61:739-‐751.
Enright, J. T. 1977. Diurnal vertical migration: adaptive significance and timing. Part 1. Selective advantage: a metabolic model. Limnology and Oceanography 22:856-‐872.
Falk-‐Petersen, S., P. Mayzaud, G. Kattner, and J. Sargent. 2009. Lipids and life strategy of Arctic Calanus. Marine Biology Research 5:18-‐39.
Falkenhaug, T., K. S. Tande, and T. Semenova. 1997. Diel, seasonal and ontogenetic variations in the vertical distributions of four marine copepods. Marine Ecology Progress Series 149:105-‐119.
Fiksen, O., and F. Carlotti. 1998. A model of optimal life history and Diel vertical migration in Calanus finmarchicus. Sarsia 83:129-‐147.
Fiksen, O., and J. Giske. 1995. Vertical-‐distribution and population-‐dynamics of copepods by dynamic optimization. Ices Journal of Marine Science 52:483-‐503.
Fonselius, S. 1995. Västerhavets och östersjöns Oceanografi. .in SMHI, editor., Norrköping. Fransz, H. G., J. M. Colebrook, J. C. Gamble, and K. M. 1991. The zooplankton of the North Sea.
Neth Jsea Res 28(1/2)::1-‐52. George, D. G. 1983. Interrelations between the vertical migration of Daphnia and chlorophyll a
in two large limnetic enclosures. J Plankton Res 5:457-‐475. Giske, J., D. L. Aksnes, B. M. Balino, S. Kaartvedt, U. Lie, J. T. Nordeide, A. G. V. Salvanes, S. M.
Wakili, and A. Aadnesen. 1990. Vertical distribution and trophic interactions of zooplankton and fish in Masfjorden, Norway. Sarsia 75:65-‐81.
Gislason, A., and A. S. Astthorsson. 2002. The food of Norwegian spring-‐spawning herring in the western Norwegian Sea in relation to the annual cycle of zooplankton. Sarsia 87:236-‐247.
Graeve, M., C. Albers, and G. Kattner. 2005. Assimilation and biosynthesis of lipids in Arctic Calanus species based on feeding experiments with a C-‐13 labelled diatom. Journal of Experimental Marine Biology and Ecology 317:109-‐125.

23
Gaard, E., A. Gislason, T. Falkenhaug, H. Soiland, E. Musaeva, A. Vereshchaka, and G. Vinogradov. 2008. Horizontal and vertical copepod distribution and abundance on the Mid-‐Atlantic Ridge in June 2004. Deep-‐Sea Research Part Ii-‐Topical Studies in Oceanography 55:59-‐71.
Hansen, J. H., R. B. Hedeholm, K. Sunksen, J. T. Christensen, and P. Gronkjaer. 2012. Spatial variability of carbon (delta C-‐13) and nitrogen (delta N-‐15) stable isotope ratios in an Arctic marine food web. Marine Ecology Progress Series 467:47-‐59.
Hansson, S., J. E. Hobbie, R. Elmgren, U. Larsson, B. Fry, and S. Johansson. 1997. The stable nitrogen isotope ratio as a marker of food-‐web interactions and fish migration. Ecology 78:2249-‐2257.
Hays, G. C. 1995. Ontogenetic and seasonal variation in the diel vertical migration of the copepods Metridia lucens and Metridia longa. Limnol. Oceanogr 40:1461-‐1465.
Hays, G. C. 2003. A review of the adaptive significance and ecosystem consequences of zooplankton diel vertical migrations. Hydrobiologia 503:163-‐170.
Hays, G. C., H. Kennedy, and B. W. Frost. 2001. Individual variability in diel vertical migration of a marine copepod: Why some individuals remain at depth when others migrate. Limnology and Oceanography 46:2050-‐2054.
Hays, G. C., C. A. Proctor, A. W. G. John, and A. J. Warner. 1994. Interspecific differences in diel vertical migration of marine copepods: the implications of size, colour and morphology. Limnology and Oceanography 39:1621-‐1629.
Head, E. J. H., L. R. Harris, and I. Yashayaev. 2003. Distributions of Calanus spp. and other mesozooplankton in the Labrador Sea in relation to hydrography in spring and summer (1995-‐2000). Progress in Oceanography 59:1-‐30.
Head, E. J. H., W. Melle, P. Pepin, E. Bagoien, and C. Broms. 2013. On the ecology of Calanus finmarchicus in the Subarctic North Atlantic: A comparison of population dynamics and environmental conditions in areas of the Labrador Sea-‐Labrador/Newfoundland Shelf and Norwegian Sea Atlantic and Coastal Waters. Progress in Oceanography 114:46-‐63.
Heath, M. R., P. R. Boyle, A. Gislason, W. S. C. Gurney, S. J. Hay, E. J. H. Head, S. Holmes, A. Ingvarsdottir, S. H. Jonasdottir, P. Lindeque, R. T. Pollard, J. Rasmussen, K. Richards, K. Richardson, G. Smerdon, and D. Speirs. 2004. Comparative ecology of over-‐wintering Calanus finmarchicus in the northern North Atlantic, and implications for life-‐cycle patterns. Ices Journal of Marine Science 61:698-‐708.
Heath, M. R., and R. G. Lough. 2007. A synthesis of large-‐scale patterns in the planktonic prey of larval and juvenile cod (Gadus morhua). Fisheries Oceanography 16:169-‐185.
Heath, M. R., J. Rasmussen, Y. Ahmed, J. Allen, C. I. H. Anderson, A. S. Brierley, L. Brown, A. Bunker, K. Cook, R. Davidson, S. Fielding, W. S. C. Gurney, R. Harris, S. Hay, S. Henson, A. G. Hirst, N. P. Holliday, A. Ingvarsdottir, X. Irigoien, P. Lindeque, D. J. Mayor, D. Montagnes, C. Moffat, R. Pollard, S. Richards, R. A. Saunders, J. Sidey, G. Smerdon, D. Speirs, P. Walsham, J. Waniek, L. Webster, and D. Wilson. 2008. Spatial demography of Calanus finmarchicus in the Irminger Sea. Progress in Oceanography 76:39-‐88.
Hind, A., W. S. C. Gurney, M. Heath, and A. D. Bryant. 2000. Overwintering strategies in Calanus finmarchicus. Marine Ecology Progress Series 193:95-‐107.
Hirche, H. J. 1990. Egg production of Calanus finmarchicus at low temperature. Marine Biology 106:53-‐58.
Hirche, H. J. 1996. Diapause in the marine copepod, Calanus finmarchicus -‐ A review. Ophelia 44:129-‐143.

24
Hirche, H. J., T. Brey, and B. Niehoff. 2001. A high-‐frequency time series at ocean Weather ship station M (Norwegian Sea): population dynamics of Calanus finmarchicus. Marine Ecology Progress Series 219:205-‐219.
Hirche, H. J., and G. Kattner. 1993. Egg production and lipid content of Calanus glacialis in spring: Indication of a food-‐dependent and food-‐independent reproductive mode. Marine Biology 117:615-‐622.
Hirche, H. J., U. Meyer, and B. Niehoff. 1997. Egg production of Calanus finmarchicus: Effect of temperature, food and season. Marine Biology 127:609-‐620.
Hirche, H. J., and B. Niehoff. 1996. Reproduction of the Arctic copepod Calanus hyperboreus in the Greenland Sea-‐field and laboratory observations. Polar Biology 16:209-‐219.
Hobson, K. A., A. Fisk, N. Karnovsky, M. Holst, J. M. Gagnon, and M. Fortier. 2002. A stable isotope (delta C-‐13, delta N-‐15) model for the North Water food web: implications for evaluating trophodynamics and the flow of energy and contaminants. Deep-‐Sea Research Part Ii-‐Topical Studies in Oceanography 49:5131-‐5150.
Hobson, K. A., and H. E. Welch. 1992. Determination of trophic relationships within a high arctic marine food web using delta-‐c-‐13 and delta-‐n-‐15 analysis. Marine Ecology Progress Series 84:9-‐18.
Huntley, M., and E. R. Brooks. 1982. Effects of Age and Food Availability on Diel Vertical Migration of Calanus pacificus. Marine Biology 71:23-‐31.
Huse, G., J. C. Holst, K. Utne, L. Nottestad, W. Melle, A. Slotte, G. Ottersen, T. Fenchel, and F. Uiblein. 2012. Effects of interactions between fish populations on ecosystem dynamics in the Norwegian Sea -‐ results of the INFERNO project Preface. Marine Biology Research 8:415-‐419.
Hvas, E., M.-‐L. Maarup, L. E. Hansen, K. Brock, and P. Blanner. 1998. Skagerrak 1992-‐ 1996. En sammenstilling af resultater fra Nordjyllands Amts recipienttilsyn i den kystnære del af Skagerrak., Nordjyllands Amt.
Irigoien, X. 2000. Vertical distribution and population structure of Calanus finmarchicus at station India (59 degrees N, 19 degrees W) during the passage of the great salinity anomaly, 1971-‐1975. Deep-‐Sea Research Part I-‐Oceanographic Research Papers 47:1-‐26.
Irigoien, X. 2004. Some ideas about the role of lipids in the life cycle of Calanus finmarchicus. J Plankton Res 26:259-‐263.
Jónasdóttir, S. H. 1999. Lipid content of Calanus finmarchicus during overwintering in the Faroe-‐Shetland Channel. Fisheries Oceanography 8:62-‐72.
Jonasdottir, S. H., H. G. Gudfinnsson, A. Gislason, and O. S. Astthorsson. 2002. Diet composition and quality for Calanus finmarchicus egg production and hatching success off south-‐west Iceland. Marine Biology 140:1195-‐1206.
Jonasdottir, S. H., and M. Koski. 2011. Biological processes in the North Sea: comparison of Calanus helgolandicus and Calanus finmarchicus vertical distribution and production. J Plankton Res 33:85-‐103.
Keough, J. R., M. E. Sierszen, and C. A. Hagley. 1996. Analysis of a Lake Superior coastal food web with stable isotope techniques. Limnology and Oceanography 41:136-‐146.
Kling, G. W., B. Fry, and W. J. Obrien. 1992. Stable isotopes and planktonic trophic structure in arctic lakes. Ecology 73:561-‐566.
Kremer, P., and J. N. Kremer. 1988. Energetic and behavioral im-‐ plications of pulsed food availability for zooplankton. . Bull. mar. sci,:797-‐809.
25
Kurten, B., S. J. Painting, U. Struck, N. V. C. Polunin, and J. J. Middelburg. 2013. Tracking seasonal changes in North Sea zooplankton trophic dynamics using stable isotopes. Biogeochemistry 113:167-‐187.
Kvile, K. O., P. Dalpadado, E. Orlova, N. C. Stenseth, and L. C. Stige. 2014. Temperature effects on Calanus finmarchicus vary in space, time and between developmental stages. Marine Ecology Progress Series 517:85-‐104.
Kaartvedt, S. 1996. Habitat preference during overwintering and timing of seasonal vertical migration of Calanus finmarchicus. Ophelia 44:145-‐156.
Lagergren, R., K. Leberfinger, and J. A. E. Stenson. 2008. Seasonal and ontogenetic variation in diel vertical migration of Chaoborus flavicans and its effect on depth-‐selection behavior of other zooplankton. Limnology and Oceanography 53:1083-‐1092.
Lalli, C. M., and T. R. Parsons. 1997. Biological Oceanography an introduction. Elder & Williams, University of British Columbia.
Lampert, W. 1989. The adaptive significance of diel vertical migration of zooplankton. Functional Ecology 3:21-‐27.
Lee, R. F., W. Hagen, and G. Kattner. 2006. Lipid storage in marine zooplankton. Marine Ecology Progress Series 307:273-‐306.
Levinsen, H., J. T. Turner, T. G. Nielsen, and B. W. Hansen. 2000. On the trophic coupling between protists and copepods in arctic marine ecosystems. Marine Ecology Progress Series 204:65-‐77.
Longhurst, A., D. Sameoto, and A. Herman. 1984. Vertical distribution of zooplankton in summer: Eastern Canadian archipelago. J Plankton Res 6:137-‐168.
Loose, C. J., and P. Dawidowicz. 1994. Trade-‐offs in diel vertical migration by zooplankton – the costs of predator avoidance. Ecology 75:2255-‐2263.
Lund-‐Hansen, L. C., C. Christiansen, C. Jügensen, K. Richardson, and P. Skyum. 1994. Basisbog i fysisk-‐biologisk Oceanografi. G.E.C Gads forlag, København.
Laakmann, S., M. Kochzius, and H. Auel. 2009. Ecological niches of Arctic deep-‐sea copepods: Vertical partitioning, dietary preferences and different trophic levels minimize inter-‐specific competition. Deep-‐Sea Research Part I-‐Oceanographic Research Papers 56:741-‐756.
Maps, F., J. A. Runge, A. Leising, A. J. Pershing, N. R. Record, S. Plourde, and J. J. Pierson. 2012. Modelling the timing and duration of dormancy in populations of Calanus finmarchicus from the Northwest Atlantic shelf. J Plankton Res 34:36-‐54.
Marshall, S. M., and A. P. Orr. 1952. On the biology of Calanus fin-‐ marchicus. VII. Factors affecting egg production. J Mar biol Ass UK 30:527-‐547.
Marshall, S. M., and A. P. Orr. 1955. The biology of marine copepod Calanus finmarchicus (Gunners). Oliver and Boyd, Edinburgh.
Matthews, J. B. L. 1969. Continuous Plankton Records: The geographical and seasonal distribution of Calanus finmarehicus in the North Atlantic. Bulletin of Marine Ecology 6:251-‐273.
McLaren, I. A. 1963. Effect of temperature on growth of zooplankton and the adaptive value of vertical migration. Journal of the Fisheries Research Board of Canada 20:685-‐727.
McLaren, I. A. 1974. Demographic strategy of vertical migration by a marine copepod. American Naturalist 108:91-‐102.
McLaren, I. A., E. Head, and D. D. Sameoto. 2001. Life cycles and seasonal distributions of Calanus finmarchicus on the central Scotian Shelf. Canadian Journal of Fisheries and Aquatic Sciences 58:659-‐670.

26
McNaught, D. C., and A. D. Hasler. 1964. Rate of movement of populations of Daphnia in relation to changes in light intensity. Journal of the Fisheries Research Board of Canada 21:291-‐318.
Melle, W., B. Ellertsen, and H. R. Skjoldal. 2004. Zooplankton: The link to higher trophic levels In: Skjoldal, H.R. (Ed). . The Norwegian Sea Ecosystem. Tapir, Trondheim:137-‐202.
Melle, W., J. Runge, E. Head, S. Plourde, C. Castellani, P. Licandro, J. Pierson, S. Jonasdottir, C. Johnson, C. Broms, H. Debes, T. Falkenhaug, E. Gaard, A. Gislason, M. Heath, B. Niehoff, T. G. Nielsen, P. Pepin, E. K. Stenevik, and G. Chust. 2014. The North Atlantic Ocean as habitat for Calanus finmarchicus: Environmental factors and life history traits. Progress in Oceanography 129:244-‐284.
Melle, W., and H. R. Skjoldal. 1989. Zooplankton reproduction in the Barents Sea: vertical distribution of eggs and nauplii of Calanus finmarchicus in relation to spring phytoplankton development. Olsen & Olsen, Fredensborg.
Michener, R. H., and L. Kaufman. 2008. Stable isotope ratios as tracers in marine food webs: An update. Pages 238-‐283 in R. M. A. K. LAJTHA, editor. Stable Isotopes in Ecology and Environmental Science. Blsckweel Publidhing.
Miljøministeriet, N. 2011. Vandplan 2009-‐2015. Nordlige Kattegat og Skagerrak. Hovedvandopland 1.1. Vanddistrikt: Jylland og Fyn.
Miller, C. B. 2004. Calanus finmarchicus.in N. Fisheries, editor. Teri Frady, http://www.nefsc.noaa.gov/press_release/2004/news04.14.htm.
Miller, C. B., J. A. Crain, and C. A. Morgan. 2000. Oil storage variability in Calanus finmarchicus. Ices Journal of Marine Science 57:1786-‐1799.
Maar, M., T. G. Nielsen, K. Richardson, U. Christaki, O. S. Hansen, S. Zervoudaki, and E. D. Christou. 2002. Spatial and temporal variability of food web structure during the spring bloom in the Skagerrak. Marine Ecology Progress Series 239:11-‐29.
Neill, W. E. 1990. Induced vertical migration in copepods as a defence against invertebrate predation. Nature 345:524-‐526.
Niehoff, B. 2004. The effect of food limitation on gonad development and egg production of the planktonic copepod Calanus finmarchicus. Journal of Experimental Marine Biology and Ecology 307:237-‐259.
Niehoff, B., U. Klenke, H. J. Hirche, X. Irigoien, R. Head, and R. Harris. 1999. A high frequency time series at Weathership M, Norwegian Sea, during the 1997 spring bloom: the reproductive biology of Calanus finmarchicus. Marine Ecology Progress Series 176:81-‐92.
Ohman, M. D., B. W. Frost, and E. B. Cohen. 1983. Reverse diel vertical migration -‐ an escape from invertebrate predators. Science 220:1404-‐1407.
Ohman, M. D., and H. J. Hirche. 2001. Density-‐dependent mortality in an oceanic copepod population. Nature 412:638-‐641.
Ohman, M. D., and J. A. Runge. 1994. Sustained fecundity when phytoplankton resources are in short supply—omnivory by Calanus finmarchicus in the Gulf of St-‐Lawrence. Limnology and Oceanography 39:21-‐36.
Olsen, E. M., W. Melle, S. Kaartvedt, J. C. Holst, and K. A. Mork. 2007. Spatially structured interactions between a migratory pelagic predator, the Norwegian spring-‐spawning herring Clupea harengus L., and its zooplankton prey. Journal of Fish Biology 70:799-‐815.

27
Pasternak, A., E. Arashkevich, K. Tande, and T. Falkenhaug. 2001. Seasonal changes in feeding, gonad development and lipid stores in Calanus finmarchicus and C-‐hyperboreus from Malangen, northern Norway. Marine Biology 138:1141-‐1152.
Pasternak, A. F., E. G. Arashkevich, U. Grothe, A. B. Nikishina, and K. A. Solovyev. 2013. Different effects of increased water temperature on egg production of Calanus finmarchicus and C-‐glacialis. Oceanology 53:547-‐553.
Pepin, P., and E. J. H. Head. 2009. Seasonal and depth-‐dependent variations in the size and lipid contents of stage 5 copepodites of Calanus finmarchicus in the waters of the Newfoundland Shelf and the Labrador Sea. Deep-‐Sea Research Part I-‐Oceanographic Research Papers 56:989-‐1002.
Peterson, B. J. 1999. Stable isotopes as tracers of organic matter input and transfer in benthic food webs: A review. Acta Oecologica-‐International Journal of Ecology 20:479-‐487.
Peterson, B. J., and B. Fry. 1987. Stable isotopes in ecosystem studies. Annual Review of Ecology and Systematics 18:293-‐320.
Peterson, B. J., R. W. Howarth, and R. H. Garritt. 1985. Multiple stable isotopes used to trace the flow of organic-‐matter in estuarine food webs. Science 227:1361-‐1363.
Petursdottir, H., S. Falk-‐Petersen, H. Hop, and A. Gislason. 2010. Calanus finmarchicus along the northern Mid-‐Atlantic Ridge: variation in fatty acid and alcohol profiles and stable isotope values, delta N-‐15 and delta C-‐13. J Plankton Res 32:1067-‐1077.
Petursdottir, H., A. Gislason, S. Falk-‐Petersen, H. Hop, and J. Svavarsson. 2008. Trophic interactions of the pelagic ecosystem over the Reykjanes Ridge as evaluated by fatty acid and stable isotope analyses. Deep-‐Sea Research Part Ii-‐Topical Studies in Oceanography 55:83-‐93.
Planque, B., and S. D. Batten. 2000. Calanus finmarchicus in the North Atlantic: the year of Calanus in the context of interdecadal change. Ices Journal of Marine Science 57:1528-‐1535.
Planque, B., G. C. Hays, F. Ibanez, and J. C. Gamble. 1997. Large scale spatial variations in the seasonal abundance of Calanus finmarchicus. Deep-‐Sea Research Part I-‐Oceanographic Research Papers 44:315-‐326.
Plourde, S., P. Joly, J. A. Runge, B. Zakardjian, and J. J. Dodson. 2001. Life cycle of Calanus finmarchicus in the lower St. Lawrence Estuary: the imprint of circulation and late timing of the spring phytoplankton bloom. Canadian Journal of Fisheries and Aquatic Sciences 58:647-‐658.
Plourde, S., and J. A. Runge. 1993. Reproduction of the planktonic copepod Calanus finmarchicus in the Lower St. Lawrence Estuary: relation to the cycle of phytoplankton production and evidence for a Calanus pump. . Marine Ecology Progress Series 102:217-‐227.
Post, D. M. 2002. Using stable isotopes to estimate trophic position: Models, methods, and assumptions. Ecology 83:703-‐718.
Post, D. M., M. L. Pace, and N. G. Hairston. 2000. Ecosystem size determines food-‐chain length in lakes. Nature 405:1047-‐1049.
Prokopchuk, I., and E. Sentyabov. 2006. Diets of herring, mackerel, and blue whiting in the Norwegian Sea in relation to Calanus finmarchicus distribution and temperature conditions. Ices Journal of Marine Science 63:117-‐127.
Rey-‐Rassat, C., X. Irigoien, R. Harris, and F. Carlotti. 2002. Energetic cost of gonad development in Calanus finmarchicus and C. helgolandicus. Marine Ecology Progress Series 238:301-‐306.

28
Richardson, K., S. H. Jonasdottir, S. J. Hay, and A. Christoffersen. 1999. Calanus finmarchicus egg production and food availability in the Faroe-‐Shetland Channel and northern North Sea: October-‐March. Fisheries Oceanography 8:153-‐162.
Ringelberg, J., J. Van Kasteel, and H. Servaas. 1967. The sensitivity of Daphnia magna Straus to changes in light intensity of various adaptation levels and its implications in diurnal vertical migration. Zeitschrift fur vergleichende Physiologie. 56:317-‐407.
Rodhe, J. 1987. The large scale circulation in the Skagerrak: interpretation of some observations. Tellus 39:245-‐253.
Rodhe, J., P. Tett, and F. Wulf. 2004. The baltic and north seas: a regional review of some important physical-‐chemical-‐ biological interaction processes The Sea 14:1029-‐1072.
Rounick, J. S., and M. J. Winterbourn. 1986. Stable Carbon Isotopes and Carbon Flow in Ecosystems. Bioscience 36:171-‐177.
Runge, J. A., and Y. DeLafontaine. 1996. Characterization of the pelagic ecosystem in surface waters of the northern Gulf of St Lawrence in early summer: The larval redfish Calanus microplankton interaction. Fisheries Oceanography 5:21-‐37.
Runge, J. A., S. Plourde, P. Joly, B. Niehoff, and E. Durbin. 2006. Characteristics of egg production of the planktonic copepod, Calanus finmarchicus, on Georges Bank: 1994-‐1999. Deep-‐Sea Research Part Ii-‐Topical Studies in Oceanography 53:2618-‐2631.
Sato, M., H. Sasaki, and M. Fukuchi. 2002. Stable isotopic compositions of overwintering copepods in the arctic and subarctic waters and implications to the feeding history. Journal of Marine Systems 38:165-‐174.
Skjoldal, H. R., P. Dalpadado, and A. Dommasnes. 2004. Food webs and trophic interactions. In: Skjoldal H.R: (Ed.), The Norwegian Sea Ecosystem. Tapir, Trondheim:447-‐506.
Smith, B. E., and J. S. Link. 2010. The trophic dynamics of 50 finfish and 2 squid species on the northeast U.S. Continental Shelf., NOAA Tech. Mem.
Stahl, H., A. Tengberg, J. Brunnegard, E. Bjornbom, T. L. Forbes, A. B. Josefson, H. G. Kaberi, I. M. K. Hassellov, F. Olsgard, P. Roos, and P. O. J. Hall. 2004. Factors influencing organic carbon recycling and burial in Skagerrak sediments. Journal of Marine Research 62:867-‐907.
Stenevik, E. K., W. Melle, E. Gaard, A. Gislason, C. T. A. Broms, I. Prokopchuk, and B. Ellertsen. 2007. Egg production of Calanus finmarchicus -‐ A basin-‐scale study. Deep-‐Sea Research Part Ii-‐Topical Studies in Oceanography 54:2672-‐2685.
Svansson, A. 1975. Physical and chemical oceanography of the Skagerrak and the Kattegat., Inst Mar Res (GENERIC), Lysekil.
Sweeting, C. J., J. T. Barry, N. V. C. Polunin, and S. Jennings. 2007. Effects of body size and environment on diet-‐tissue delta C-‐13 fractionation in fishes. Journal of Experimental Marine Biology and Ecology 352:165-‐176.
Søreide, J. E., S. Falk-‐Petersen, E. N. Hegseth, H. Hop, M. L. Carroll, K. A. Hobson, and K. Blachowiak-‐Samolyk. 2008. Seasonal feeding strategies of Calanus in the high-‐Arctic Svalbard region. Deep-‐Sea Research Part Ii-‐Topical Studies in Oceanography 55:2225-‐2244.
Søreide, J. E., T. Tamelander, H. Hop, K. A. Hobson, and I. Johansen. 2006. Sample preparation effects on stable C and N isotope values: a comparison of methods in Arctic marine food web studies. Marine Ecology Progress Series 328:17-‐28.
Tett, P., L. Gilpin, H. Svendsen, C. P. Erlandsson, U. Larsson, S. Kratzer, E. Fouilland, C. Janzen, J. Y. Lee, C. Grenz, A. Newton, J. G. Ferreira, T. Fernandes, and S. Scory. 2003.
29
Eutrophication and some European waters of restricted exchange. Continental Shelf Research 23:1635-‐1671.
Trumble, R. J. 1973. Distribution, relative abundance and general biology of selected underutilized fishery resources of the eastern North Pacific Ocean.
Utne, K. R., S. S. Hjollo, G. Huse, and M. Skogen. 2012. Estimating the consumption of Calanus finmarchicus by planktivorous fish in the Norwegian Sea using a fully coupled 3D model system. Marine Biology Research 8:527-‐547.
Vander Zanden, M. J., B. J. Shuter, N. Lester, and J. B. Rasmussen. 1999. Patterns of food chain length in lakes: A stable isotope study. American Naturalist 154:406-‐416.
Williams, R. 1985. Vertical distribution of Calanus finmarchicus and C. helgolandicus in relation to the development of the seasonal thermocline in the Celtic Sea. Marine Biology 86:145-‐149.
Worthington, E. 1931. Vertical movements of freshwater macroplankton. Int. Rev. Gesam. Hydrobiol 25:394-‐436.
Zaret, T. M., and W. C. Kerfoot. 1975. Fish predation on Bosmina longirostris, body size selection versus visibility selection. Ecology 56:232-‐237.

30
Vertical distribution of zooplankton with emphasis on variation in lipid content and stable isotope signatures in Calanus finmarchicus in the
deep part of Skagerrak Christoffer Bruus, Jens Tang Christensen Marine Ecology, Department of Bioscience, Aarhus University, 8000 Aarhus C, Denmark
Abstract Diel vertical migration (DVM) of zooplankton describes the behavioural displacement among species, and deals with their movements across 24-‐h period. In this context, was the DVM of the pelagic zooplankton community, with a specific focus on Calanus finmarchicus in relation to body size, lipid content and copepodite stages, examined during a cruise in the Skagerrak Sea in mid-‐late summer 2014. We found evidence of DVM, with varying strength, in the pelagic zooplankton community. The majority of the larger zooplankton and copepod species moved in a normal vertical migration pattern, while the smaller copepod species e.g. O. similis showed patterns of reveres migration. In regard to C. finmarchicus, were there a significant increase in body size and lipid content with depth, and vertical displacement between the copepodite stages. The larger and late stages of C. finmarchicus distributed in the deepest part of the water column, and vice versa for the smaller. The isotopic differences between depth strata in C. finmarchicus showed increasing values of δ!"C with depth while there was no change in δ!"N, suggesting that C. finmarchicus maintains its trophic position while carbon sources may shift. Keywords: Copepods; Diel vertical migration; Stable isotope; Copepodite stages.
Introduction The vertical distribution and diel vertical migration are among the most studied topics in aquatic biology. It describes the behaviour in relation to the depth distribution among species and deals with their movements across periods of days and seasons. The vertical distributions of the species are often an effect of their different ability to exploit various habitats, which vary with respect to e.g. resources, competition and risk of predation. Adaptation due to competitors and predators therefore affect habitat choice and influence the character of vertical distribution (Fiksen and Giske 1995). In winter the surface waters often only contain a few individuals, and a larger number are found in the deep (Hirche 1996). The theory is that this overwintering-‐behaviour enhance overwinter survival by reducing both predations risk and physiological costs, although, the low temperatures may simply reduce physiological costs encountered at depth, by reducing the metabolism (Kaartvedt 1996, Hind et al. 2000). Diel vertical migration (DVM) whereby animals migrate a few to several hundred meters in search of food sources, or seek refuge by descending into the darkness of the depth has been
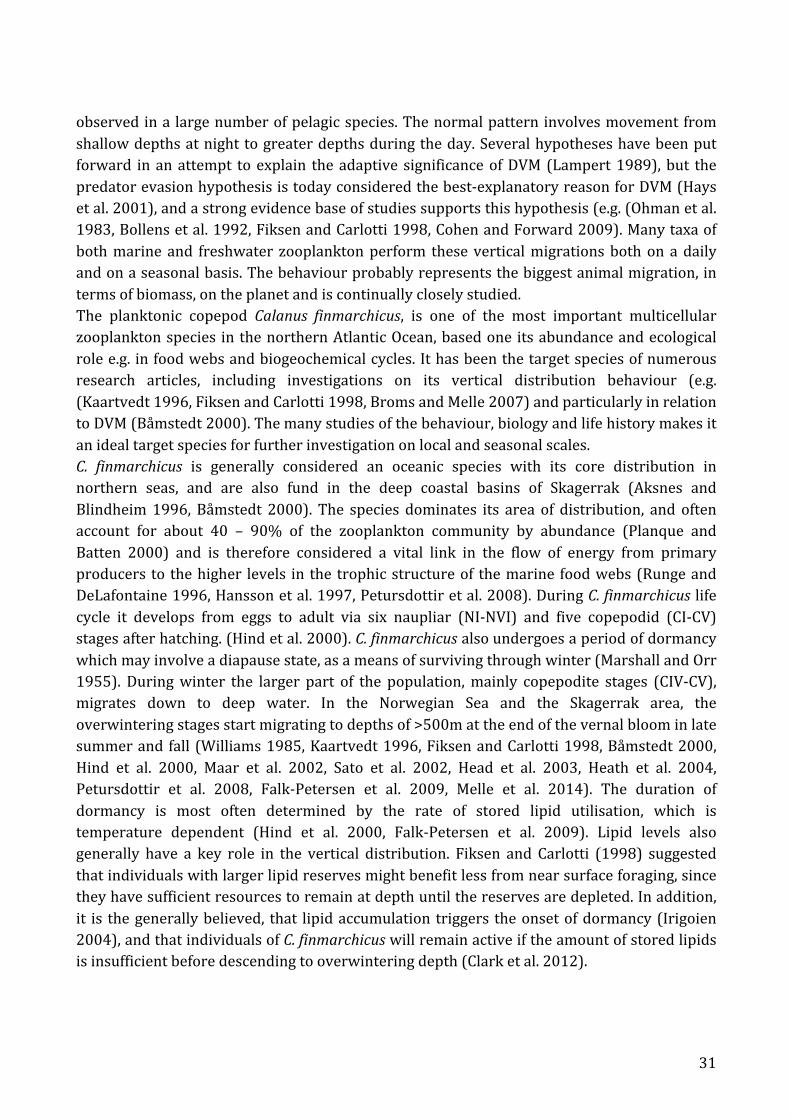
31
observed in a large number of pelagic species. The normal pattern involves movement from shallow depths at night to greater depths during the day. Several hypotheses have been put forward in an attempt to explain the adaptive significance of DVM (Lampert 1989), but the predator evasion hypothesis is today considered the best-‐explanatory reason for DVM (Hays et al. 2001), and a strong evidence base of studies supports this hypothesis (e.g. (Ohman et al. 1983, Bollens et al. 1992, Fiksen and Carlotti 1998, Cohen and Forward 2009). Many taxa of both marine and freshwater zooplankton perform these vertical migrations both on a daily and on a seasonal basis. The behaviour probably represents the biggest animal migration, in terms of biomass, on the planet and is continually closely studied. The planktonic copepod Calanus finmarchicus, is one of the most important multicellular zooplankton species in the northern Atlantic Ocean, based one its abundance and ecological role e.g. in food webs and biogeochemical cycles. It has been the target species of numerous research articles, including investigations on its vertical distribution behaviour (e.g. (Kaartvedt 1996, Fiksen and Carlotti 1998, Broms and Melle 2007) and particularly in relation to DVM (Båmstedt 2000). The many studies of the behaviour, biology and life history makes it an ideal target species for further investigation on local and seasonal scales. C. finmarchicus is generally considered an oceanic species with its core distribution in northern seas, and are also fund in the deep coastal basins of Skagerrak (Aksnes and Blindheim 1996, Båmstedt 2000). The species dominates its area of distribution, and often account for about 40 – 90% of the zooplankton community by abundance (Planque and Batten 2000) and is therefore considered a vital link in the flow of energy from primary producers to the higher levels in the trophic structure of the marine food webs (Runge and DeLafontaine 1996, Hansson et al. 1997, Petursdottir et al. 2008). During C. finmarchicus life cycle it develops from eggs to adult via six naupliar (NI-‐NVI) and five copepodid (CI-‐CV) stages after hatching. (Hind et al. 2000). C. finmarchicus also undergoes a period of dormancy which may involve a diapause state, as a means of surviving through winter (Marshall and Orr 1955). During winter the larger part of the population, mainly copepodite stages (CIV-‐CV), migrates down to deep water. In the Norwegian Sea and the Skagerrak area, the overwintering stages start migrating to depths of >500m at the end of the vernal bloom in late summer and fall (Williams 1985, Kaartvedt 1996, Fiksen and Carlotti 1998, Båmstedt 2000, Hind et al. 2000, Maar et al. 2002, Sato et al. 2002, Head et al. 2003, Heath et al. 2004, Petursdottir et al. 2008, Falk-‐Petersen et al. 2009, Melle et al. 2014). The duration of dormancy is most often determined by the rate of stored lipid utilisation, which is temperature dependent (Hind et al. 2000, Falk-‐Petersen et al. 2009). Lipid levels also generally have a key role in the vertical distribution. Fiksen and Carlotti (1998) suggested that individuals with larger lipid reserves might benefit less from near surface foraging, since they have sufficient resources to remain at depth until the reserves are depleted. In addition, it is the generally believed, that lipid accumulation triggers the onset of dormancy (Irigoien 2004), and that individuals of C. finmarchicus will remain active if the amount of stored lipids is insufficient before descending to overwintering depth (Clark et al. 2012).

32
The habitat conditions for zooplankton in the region of Skagerrak is influenced by the inflow of North Atlantic water, which reintroduces C. finmarchicus through the North Sea each spring from overwintering stocks on the North Atlantic shelf (Fransz et al. 1991), although overwintering also occurs inside Skagerrak (Båmstedt 2000). The hydrography of Skagerrak is characterized as a transition zone where water masses from the North Sea, and the shallow brackish Kattegat/Baltic Sea meet. It is characterized by a deep slope and shelf environment (Stahl et al. 2004) with slops dropping down to a maximum depth of >700m, with mean depth of 210m (Rodhe 1987). The surface water consists of the incoming Jutland Current, and the outgoing brackish Baltic Current. A counter-‐clockwise circulation dominates the area with northbound outgoing current from the east, with incoming deep North Atlantic water from north (Svansson 1975, Rodhe 1987, Lund-‐Hansen et al. 1994). Information on the vertical distribution and trophic structure of zooplankton in the pelagic ecosystem of Skagerrak is scarce. Few studies of zooplankton distribution (e.g. (Giske et al. 1990, Båmstedt 2000) and trophic relationships (e.g. (Giske et al. 1990, Maar et al. 2002, Bergstad et al. 2003) gives an overall picture of the structure of the area such as species seasonal distribution, development and ecological relationships, but there is not much information on the diversity of zooplankton, DVM, and trophic relationships. Studies of vertical isotopic differences on C. finmarchicus are also absent from the Skagerrak area. The overall objective of this study was to determine variation in the diel vertical distribution of the pelagic zooplankton community with a specific focus on C. finmarchicus distribution patterns in relation to size, lipid content and copepodite stages. The isotopic differences between depth strata of C. finmarchicus were examined to study potential variation in trophic relationships of the species with depth.
Materials and methods
Sampling All samples were collected from the research vessel Aurora in August 2014. The study area was positioned in the deep part of Skagerrak (Table 1, Fig. 1). Samples were collected at two stations (St. 1, 400 m depth, 58°06’ N, 09°50’ E; St. 2, 610 m depth, 58°03’ N, 09°09’ E). At both stations a day and night sampling was performed with approximately twelve hours interval.
Zooplankton samples were obtained by vertical hauls of a 0.5 m2 Multinet sampler (Hydro-‐Bios, Kiel) from bottom to surface. The Mulitnet sampler was lowered to the desired depth and slowly retrieved (0.5 -‐ 1m s-‐1). The sampler system consists of 9 conical net bags (four 55µm and five 300µm) attached to a stainless steel frame. The net bags are opened and closed by means of spring-‐loaded levers, which are triggered from the research vessel. The sampler was further equipped with a CTD providing data on pressure (depth), temperature and salinity. Each operation of the system consisted of two consecutive hauls, the first of which sampled four strata with 55µm-‐nets while the second sampled five strata with 300µm-‐nets.
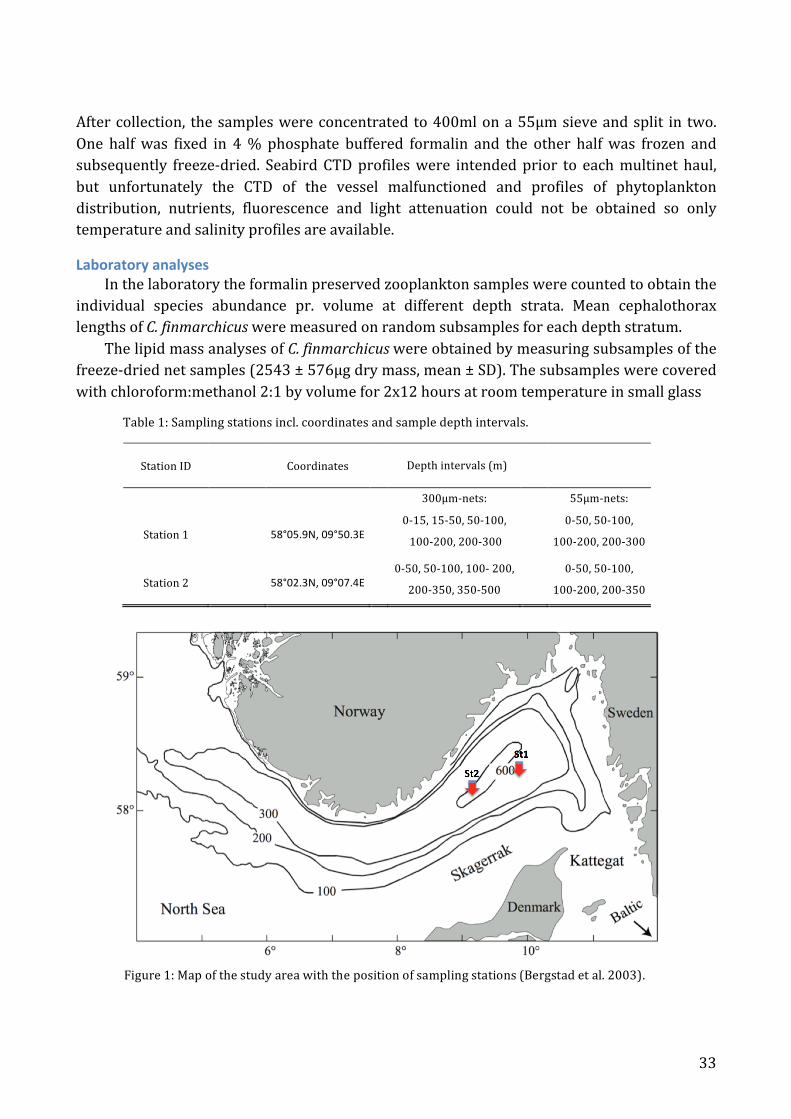
33
After collection, the samples were concentrated to 400ml on a 55μm sieve and split in two. One half was fixed in 4 % phosphate buffered formalin and the other half was frozen and subsequently freeze-‐dried. Seabird CTD profiles were intended prior to each multinet haul, but unfortunately the CTD of the vessel malfunctioned and profiles of phytoplankton distribution, nutrients, fluorescence and light attenuation could not be obtained so only temperature and salinity profiles are available.
Laboratory analyses In the laboratory the formalin preserved zooplankton samples were counted to obtain the individual species abundance pr. volume at different depth strata. Mean cephalothorax lengths of C. finmarchicus were measured on random subsamples for each depth stratum.
The lipid mass analyses of C. finmarchicus were obtained by measuring subsamples of the freeze-‐dried net samples (2543 ± 576μg dry mass, mean ± SD). The subsamples were covered with chloroform:methanol 2:1 by volume for 2x12 hours at room temperature in small glass
Table 1: Sampling stations incl. coordinates and sample depth intervals.
Station ID
Coordinates
Depth intervals (m)
300µm-‐nets:
55µm-‐nets:
0-‐15, 15-‐50, 50-‐100,
0-‐50, 50-‐100, Station 1
58°05.9N, 09°50.3E
100-‐200, 200-‐300
100-‐200, 200-‐300
0-‐50, 50-‐100, 100-‐ 200,
0-‐50, 50-‐100, Station 2
58°02.3N, 09°07.4E
200-‐350, 350-‐500 100-‐200, 200-‐350
Figure 1: Map of the study area with the position of sampling stations (Bergstad et al. 2003).

34
vials with lids, quickly rinsed with milli-‐Q ultrapure water and later freeze-‐dried for twelve hours before being measured for lipid weight loss (Hobson et al. 2002, Sato et al. 2002, Søreide et al. 2006, Petursdottir et al. 2008, Petursdottir et al. 2010, Hansen et al. 2012, Kurten et al. 2013). The lipid extracted C. finmarchicus were subsequently soaked in 1ml 2 N HCL for ca. few minutes to remove carbonates and rinsed with small portions of milli-‐Q ultrapure water until pH 6-‐7, to wash away acid and acid waste (Hobson et al. 2002, Søreide et al. 2006, Hansen et al. 2012). Thereafter, the samples were freeze-‐dried for twelve hours before being used for isotope analyses of δ!"C. The dried samples were kept in a desiccating cabinet containing silica gel between analyses (Hobson et al. 2002). The copepodite stage abundances of C. finmarchicus at each depth interval were determined by random subsampling from each formalin sample. From each sample 40–60 random individuals were measured and copepodite stages between (CVI-‐CI) were determined according to Conway (2006). The copepodite stage CV and CVI were difficult to separate, since they both have almost the same external appendages and morphology, and can therefore only be separated by approximation between the mean prosome lengths (Conway 2006). The prosome length separating CV from CVI where defined by the intervals (CV: ~2500-‐3400μm) and (CVI: >3400μm) according to Marshall and Orr (1955) and Conway (2006).
Isotope analyses Stable carbon and nitrogen isotopes ratios were analysed at the Department of Physics and Astronomy, Aarhus University, Denmark. Analyses were performed with the above dried samples. For C. finmarchicus analyses were performed on both lipid extracted and acid treated samples as well as on untreated samples. Samples for isotope analysis on other species were untreated. Approximately 400μg dry mass (DM) of zooplankton sample (391 ± 225μg DM, mean ± SD) was packaged into pre-‐weighed tin capsules (5 x 9 mm) as whole individuals. Dried zooplankton individuals larger than 400μg DM pr. individual were homogenized using a mortar and pestle. Several smaller specimens with no visible stomach contents, and collected in the same net, were selected and pooled into one sample (Hansen et al. 2012). A total of 352 C. finmarchicus and 226 samples of different zooplankton species were analysed and the isotopic δ13C and δ15N signatures were calculated as:
δ!"C or δ!"N ‰ = 𝑅!"#$%& 𝑅!"#$%#&% x 1000, where R is (13C/12C) or (15N/14N), and expressed relative to V-‐PDB (Vienna Pee Dee Belemnite) and pure N2 gas, respectively.
Vertical distribution analyses We used two separate indices of DVM as employed by Bollens and Frost (1989b) and Falkenhaug et al. (1997). (1) The weighted mean depth (WMD) method for both day and night samples. Day-‐ and night time WMD were calculated for each taxon using a modified variant of the model developed by Worthington (1931) :
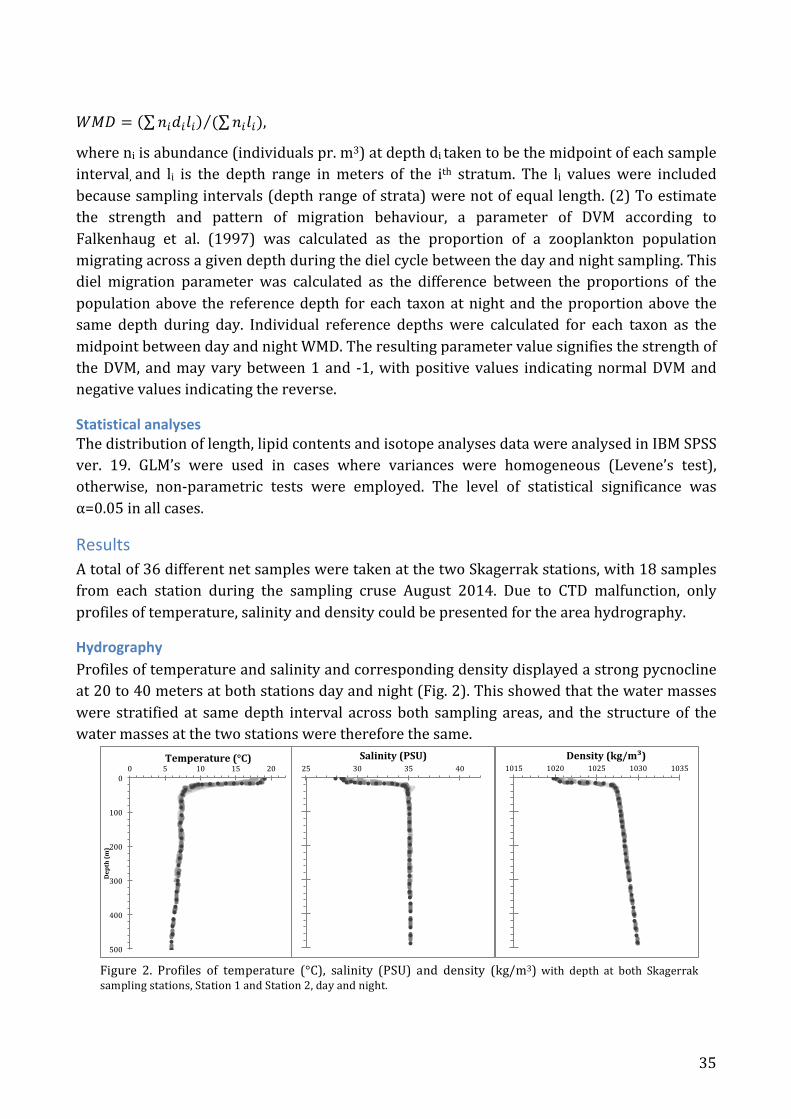
35
𝑊𝑀𝐷 = 𝑛!𝑑!𝑙! ( 𝑛!𝑙!),
where ni is abundance (individuals pr. m3) at depth di taken to be the midpoint of each sample interval, and li is the depth range in meters of the ith stratum. The li values were included because sampling intervals (depth range of strata) were not of equal length. (2) To estimate the strength and pattern of migration behaviour, a parameter of DVM according to Falkenhaug et al. (1997) was calculated as the proportion of a zooplankton population migrating across a given depth during the diel cycle between the day and night sampling. This diel migration parameter was calculated as the difference between the proportions of the population above the reference depth for each taxon at night and the proportion above the same depth during day. Individual reference depths were calculated for each taxon as the midpoint between day and night WMD. The resulting parameter value signifies the strength of the DVM, and may vary between 1 and -‐1, with positive values indicating normal DVM and negative values indicating the reverse.
Statistical analyses The distribution of length, lipid contents and isotope analyses data were analysed in IBM SPSS ver. 19. GLM’s were used in cases where variances were homogeneous (Levene’s test), otherwise, non-‐parametric tests were employed. The level of statistical significance was α=0.05 in all cases.
Results A total of 36 different net samples were taken at the two Skagerrak stations, with 18 samples from each station during the sampling cruse August 2014. Due to CTD malfunction, only profiles of temperature, salinity and density could be presented for the area hydrography.
Hydrography Profiles of temperature and salinity and corresponding density displayed a strong pycnocline at 20 to 40 meters at both stations day and night (Fig. 2). This showed that the water masses were stratified at same depth interval across both sampling areas, and the structure of the water masses at the two stations were therefore the same.
0
100
200
300
400
500
0 5 10 15 20
Depth (m
)
Temperature (°C) 25 30 35 40
Salinity (PSU) 1015 1020 1025 1030 1035
Density (kg/m³)
Figure 2. Profiles of temperature (°C), salinity (PSU) and density (kg/m3) with depth at both Skagerrak sampling stations, Station 1 and Station 2, day and night.

36
Table 2. The mean weighted mean depth (WMD) and diel vertical migration direction and strength (DVM) of the analysed species at Station 1 and Station 2. WMD were calculated according to Lagergren et al. (2008), and represents the mean depth (m) the specie population migrate across. DVM is calculated according to Falkenhaug et al. (1997): DVM = 1, indicates maximum normal migration strength, while DVM = -‐1, maximum reverse migration strength. * Are species collated in 55μm sample nets, the rest are sample in 300μm nets.
Species
Station 1
Station 2 Mean WMD DVM Mean WMD DVM Calanus finmarchicus 163 0.20 260 0.31 Oithona similis* 63 -‐0.03 -‐ -‐ Paracalanus parvus* 42 -‐0.10 113 0.00 Microstella norvegica* 53 0.05 127 -‐0.34 Centropages typicus 37 0.13 25 0.00 Acartia longiremis 120 0.43 329 0.43 Metridia longa 216 -‐0.02 235 0.46 Gaidius tenuispinus 140 -‐0.07
254 0.02
Parathemisto abyssorum 225 0.12
321 -‐0.01 Meganyctiphanes norvegica 61 0.42
287 0.31
Conchoecia spp. 181 0.16
254 0.21 Sagitta spp. 198 0.10 297 0.02
Mesozooplankton A total of 23 different zooplankton species were found of which 13 were copepods (Calanus finmarchicus, Paracalanus parvus, Metridia longa, Centropages typicus, Acartia clausi, Acartia longiremis, Oithona similis, Microstella norvegica, Corycaeus anglicus, Heterorhabdus norvegicus, Gaidius tenuispinus, Pareuchata norvegica, Gaidius brevispinus), 2 were shrimp species (Crangon crangon, Pasiphaeidae multidentata), 2 were Eumalacostraca (Parathemisto abyssorum, Meganyctiphanes norvegica), 1 crab species (Carcinus maenas), 1 Errantia species (Tomopteris helgolandica), 1 Acrania species (Amphioxus lanceolatum) and species of Ostracoda (Conchoecia spp.), Chaetognatha (Sagitta spp.) and jellyfish (Semaeostomeaes spp.) which could not be determined to species level. The three most abundant taxa were Conchoecia spp. and the copepods C. finmarchicus and Oithona similis. C. finmarchicus and Conchoecia spp. were found in large numbers in every net sample from the two sampling stations, whereas the smaller Oithona similis were only found in the fine meshed 55μm nets, which was also the case for the smaller Microstella norvegica and Paracalanus parvus. For most of the sampled zooplankton species, the sample sizes were too small for further analyses (<0.1% of the total abundance) and only the species presented in table 2 were considered abundant enough for additional representation and analyses.
Vertical distribution At Station 1 the highest zooplankton concentration was observed in the upper 100m to 200m of the water column both day and night, whereas at the deeper Station 2, the highest

37
concentrations were found below 200m. The concentration distributions of zooplankton differed between the two stations, but were more or less in same range within stations. Of the total zooplankton at Station 1, 63% and 74% occurred above 100m, and 66% and 88% above 200m by day and night, respectively. Correspondingly, only 18% and 30% were above 100m, and 24% and 44% above 200m at Station 2 by day and night, respectively. With respect to the deeper part of the water column, only 34% and 12% of the zooplankton were found below 200m by day and night, respectively, at Station 1, while the majority of the zooplankton was found below 200m at Station 2 with 76% and 56% by day and night, respectively. However, the relative depth distribution was differed among genera and species (Fig. 3 & 4). Several species had wide vertical depth ranges, covering 0-‐500m e.g. C. finmarchicus, Oithona similis, Metridia longa, and Conchoecia spp. Most taxa caught in the deepest sample interval 350-‐500m were also found the rest of the water column. The only exception was Gaidius brevispinus, which was restricted to depths below 200m. The smaller copepod species e.g. O. similis, M. norvegica, C. typicus and P. parvus differed from the rest by being distributed in the upper layers of the water column. This distribution was found to be consistent both day and night at both stations. However, some individuals tended to migrate down during night (Fig. 3 & 4). We did not find any individuals of O. similis in the day sample of Station 2. This was puzzling since we found it in almost all sampling strata at night. The overall result of the vertical distribution of three of these four small species showed a reverse DVM of between day and night at both stations (table 2). Only C. typicus differed by remaining in the upper water column during day and night although the DVM parameter for Station 3 indicated a weak normal DVM. The larger zooplankton and copepod species (Fig. 3 and 4) were distributed throughout the water column and tended to normal DVM for the majority of the listed species (table 2). The DVM index showed normal diel migration across the mean WMD for the majority of larger zooplankton and copepod species, but the strength of DVM varied among species. A few species had so low DVM index values (<0.09) that they were considered insignificant, indicating that these species remained stationary or only migrated within the sampled strata.
Size, lipid and copepodite stage distribution of C. finmarchicus The length of C. finmarchicus was strongly correlated with depth at both stations (Spearman’s rho, ρ=0.348, p<0.001) and (ρ=0.92, p<0.001) for Station 1 and Station 2, respectively (Fig. 5 A-‐B). Pairwise 2-‐tailed t-‐test comparison for C. finmarchicus length between day and night were only significant at Station 1, 15-‐50m, (t28=-‐2.34 p=0.013), and at Station 2, 100-‐200m (t38=-‐2.04 p=0.049), signifying that C. finmarchicus were larger at night in these two depth strata. All other pairwise comparison between day and night were not significant. Lipid content of C. finmarchicus was also correlated with depth at both stations (Spearman’s rho, ρ=0.365 p=0.009) and (ρ=0.755 p<0.001) for Station 1 and Station 2, respectively (Fig. 5 C-‐D).

38
0 50 100 Abundance (%)
Night
0 50 100 Abundance (%)
Day
O. similis
0 50 100 Abundance (%)
Day
0 50 100 Abundance (%)
Night
Microstella norvegica
0 50 100 Abundance (%)
Day
0 50 100 Abundance (%)
Night
P. parvus
0 50 100 Abundance (%)
Day
0 50 100 Abundance (%)
Night
C. typicus
0 50 100 Abundance (%)
Day
0 50 100 Abundance (%)
Night
C. finmarchicus
0 50 100 Abundance (%)
Day
0 50 100 Abundance (%)
Night
A. longiremis
0 50 100 Abundance (%)
Day
0 50 100 Abundance (%)
Night
M. longa
0 50 100 Abundance (%)
Day
0 50 100 Abundance (%)
Night
G. tenuispinus
0 50 100 Abundance (%)
Day
0 50 100 Abundance (%)
Night
Conchoecia spp.
0 50 100 Abundance (%)
Day
0 50 100 Abundance (%)
Night
Sagitta spp.

39
0 50 100 Abundance (%)
Night
figure continued
0 50 100 Abundance (%)
Day
0 50 100 Abundance (%)
Night
P. abyssorum
0 50 100 Abundance (%)
Day
0 50 100 Abundance (%)
Night
Meganyctiphanes norvegica
Figure 3. Vertical distribution of the zooplankton species during day and night sampling at Station 1, showing the means of relative abundance (%) of the sampling depth strata: 0-‐15, 15-‐50, 50-‐100, 100-‐200 and 200-‐300, respectively, starting from the top. The copepod species O. similis, Microstella norvegica and P. parvus were collected in 55μm nets while the rest were sampled in 300μm nets.
0 50 100 Abundance (%)
Day
0 50 100 Abundance (%)
Night
O. similis
0 50 100 Abundance (%)
Day
0 50 100 Abundance (%)
Night
Microstella norvegica
0 50 100 Abundance (%)
Day
0 50 100 Abundance (%)
Night
P. parvus
0 50 100 Abundance (%)
Day
0 50 100 Abundance (%)
Night
C. typicus
0 50 100 Abundance (%)
Day
0 50 100 Abundance (%)
Night
C. finmarchicus
0 50 100 Abundance (%)
Day
0 50 100 Abundance (%)
Night
A. longiremis
0 50 100 Abundance (%)
Day
0 50 100 Abundance (%)
Night
M. longa
0 50 100 Abundance (%)
Day
G. tenuispinus
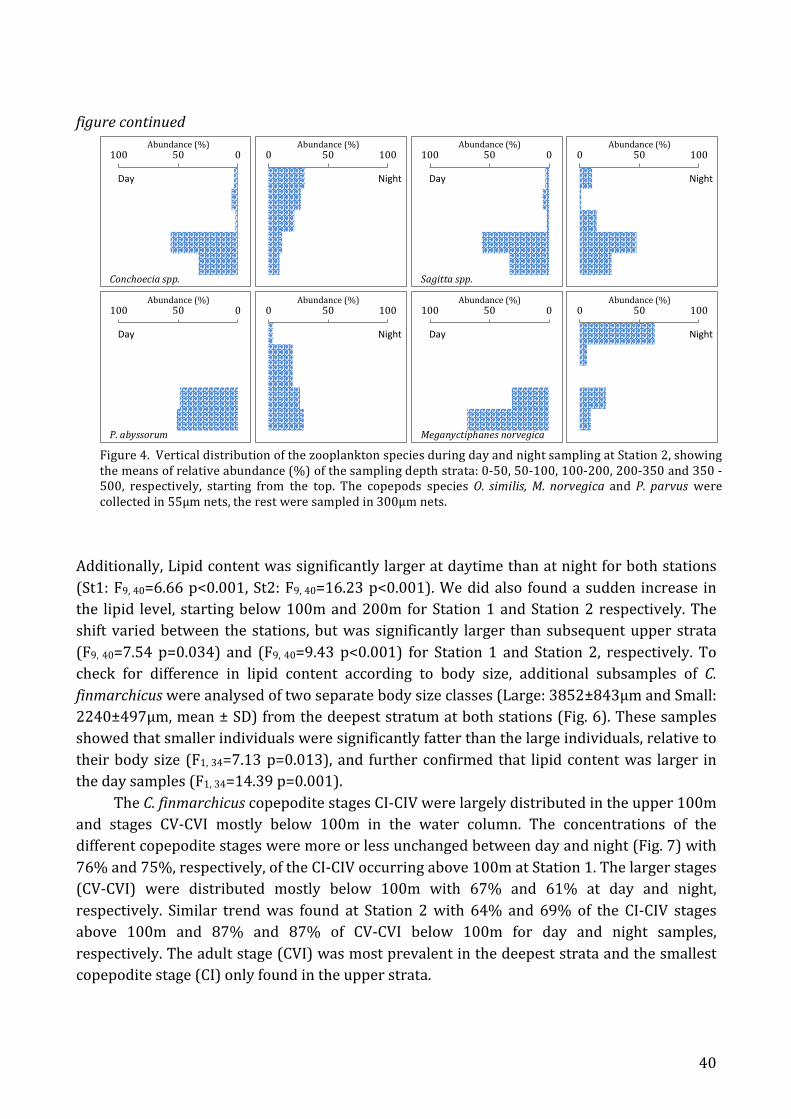
40
figure continued
Additionally, Lipid content was significantly larger at daytime than at night for both stations (St1: F9, 40=6.66 p<0.001, St2: F9, 40=16.23 p<0.001). We did also found a sudden increase in the lipid level, starting below 100m and 200m for Station 1 and Station 2 respectively. The shift varied between the stations, but was significantly larger than subsequent upper strata (F9, 40=7.54 p=0.034) and (F9, 40=9.43 p<0.001) for Station 1 and Station 2, respectively. To check for difference in lipid content according to body size, additional subsamples of C. finmarchicus were analysed of two separate body size classes (Large: 3852±843μm and Small: 2240±497μm, mean ± SD) from the deepest stratum at both stations (Fig. 6). These samples showed that smaller individuals were significantly fatter than the large individuals, relative to their body size (F1, 34=7.13 p=0.013), and further confirmed that lipid content was larger in the day samples (F1, 34=14.39 p=0.001). The C. finmarchicus copepodite stages CI-‐CIV were largely distributed in the upper 100m and stages CV-‐CVI mostly below 100m in the water column. The concentrations of the different copepodite stages were more or less unchanged between day and night (Fig. 7) with 76% and 75%, respectively, of the CI-‐CIV occurring above 100m at Station 1. The larger stages (CV-‐CVI) were distributed mostly below 100m with 67% and 61% at day and night, respectively. Similar trend was found at Station 2 with 64% and 69% of the CI-‐CIV stages above 100m and 87% and 87% of CV-‐CVI below 100m for day and night samples, respectively. The adult stage (CVI) was most prevalent in the deepest strata and the smallest copepodite stage (CI) only found in the upper strata.
0 50 100 Abundance (%)
Day
0 50 100 Abundance (%)
Night
Conchoecia spp.
0 50 100 Abundance (%)
Day
0 50 100 Abundance (%)
Night
Sagitta spp.
0 50 100 Abundance (%)
Day
0 50 100 Abundance (%)
Night
P. abyssorum
0 50 100 Abundance (%)
Day
0 50 100 Abundance (%)
Night
Meganyctiphanes norvegica
Figure 4. Vertical distribution of the zooplankton species during day and night sampling at Station 2, showing the means of relative abundance (%) of the sampling depth strata: 0-‐50, 50-‐100, 100-‐200, 200-‐350 and 350 -‐ 500, respectively, starting from the top. The copepods species O. similis, M. norvegica and P. parvus were collected in 55μm nets, the rest were sampled in 300μm nets.

41
0
50
100
150
200
250
300
1800 1900 2000 2100 2200 2300 2400
Depth (m)
Mean length (μm) A
0
100
200
300
400
500
1800 2300 2800 3300
Depth (m)
B
0 20 40 60 80
Lipid mass (%) C
0 20 40 60 80 D
Day Night
Figure 5. A-‐B: Mean length (μm) of C. finmarchicus cephalothorax (±SE), at Station 1 and Station 2 respectively. C-‐D: Mean lipid mass (%) (±SE) of C. finmarchicus along sample depth strata at Station 1 and Station 2 respectively. Data are plotted against the mid-‐point of the depth interval sampled.

42
Figure 7. Vertical distribution of the copepodite stage abundances (%) of C. finmarchicus, during day and night sampling. A-‐B Station 1 day and night. C-‐D Station 2 day and night, respectively.
0
20
40
60
80
Lipid mass (%)
Figure 6. Mean lipid mass (%) of bottom net samples at Station 1 (200-‐300m) and Station 2 (350-‐500m) (±SD) for C. finmarchicus. Round: Juvenile individuals. Square: Adult individuals. Hallow: Day sample. Filled: Night sample.
0% 20% 40% 60% 80% 100%
0-‐50
50-‐100
100-‐200
200-‐350
350-‐500
Copepodite stage abundances (%)
Depth level (m)
C
0% 20% 40% 60% 80% 100%
0-‐15
15-‐50
50-‐100
100-‐200
200-‐300
Copepodite stage abundances (%)
Depth level (m)
A 0% 20% 40% 60% 80% 100%
0-‐15
15-‐50
50-‐100
100-‐200
200-‐300
Copepodite stage abundances (%)
Depth level (m)
B
0% 20% 40% 60% 80% 100%
0-‐50
50-‐100
100-‐200
200-‐350
350-‐500
Copepodite stage abundances (%)
Depth level (m)
D
CVI CV CIIII CIII CII CI

43
Isotope analysis C. finmarchicus isotopic composition ranged in δ13C from -‐21.1‰ to -‐16.4‰ (lipid extracted and acidified samples) (Fig. 8) and in δ15N from 7.6‰ to 11.3‰(untreated samples) (Fig. 9). The extraction of lipid and acidification to remove carbonates raised the overall mean of δ13C from -‐21.57‰ to -‐19.87‰. There were no significant differences in isotopic signatures between night and day samples at either station. However, there was a significant effect of depth on δ13C at both stations (Fig. 8) independent of time (Station 1 F4.20 = 7.535, p< 0.01); Station 2 (unequal variances), (Kruskal-‐Wallis: H4=26.35 p<0.01)). Pairwise comparisons at Station 2, showed significant differences in δ!"C between depth strata (350-‐500m) and (0-‐50m) (Mann-‐Whitney U-‐test: U=32.433 ,p<0.001), and between (350-‐500m) and (50-‐100m) (Mann-‐Whitney U-‐test: U=27.333 ,p=0.002). At both stations the upper strata (0-‐50m) had the lowest mean δ15N values, but there were no significant effect of depth on δ15N at either station (Fig. 9). To test for the possibility that size could have an effect on δ13C and δ15N values, new tests on separated size classes CV-‐CVI (3912.45±714μm) and CI-‐CIIII (2272.96±450μm) from 200-‐300m at Station 1, and 350-‐500m at Station 2 were conducted. The test revealed a significant effect of body size on δ13C (F= df=1 p<0.001), but no effect on δ15N. The large individuals (CV-‐CVI) of C. finmarchicus had a higher δ13C, than the small (CI-‐CIIII). Again, there was no effect of sampling time.
Figure 8. A-‐B: Mean δ13C (±SE) values of lipid and carbonate treated C. finmarchicus along sample depth strata at Station 1 and Station 2 respectively.
0
50
100
150
200
250
300
-‐23 -‐21 -‐19 -‐17 -‐15
Depth (m)
Mean δ13C
A
Day Night
0
50
100
150
200
250
300
350
400
450
500
-‐23 -‐21 -‐19 -‐17 -‐15
Depth (m)
Mean δ13C B
Day Night
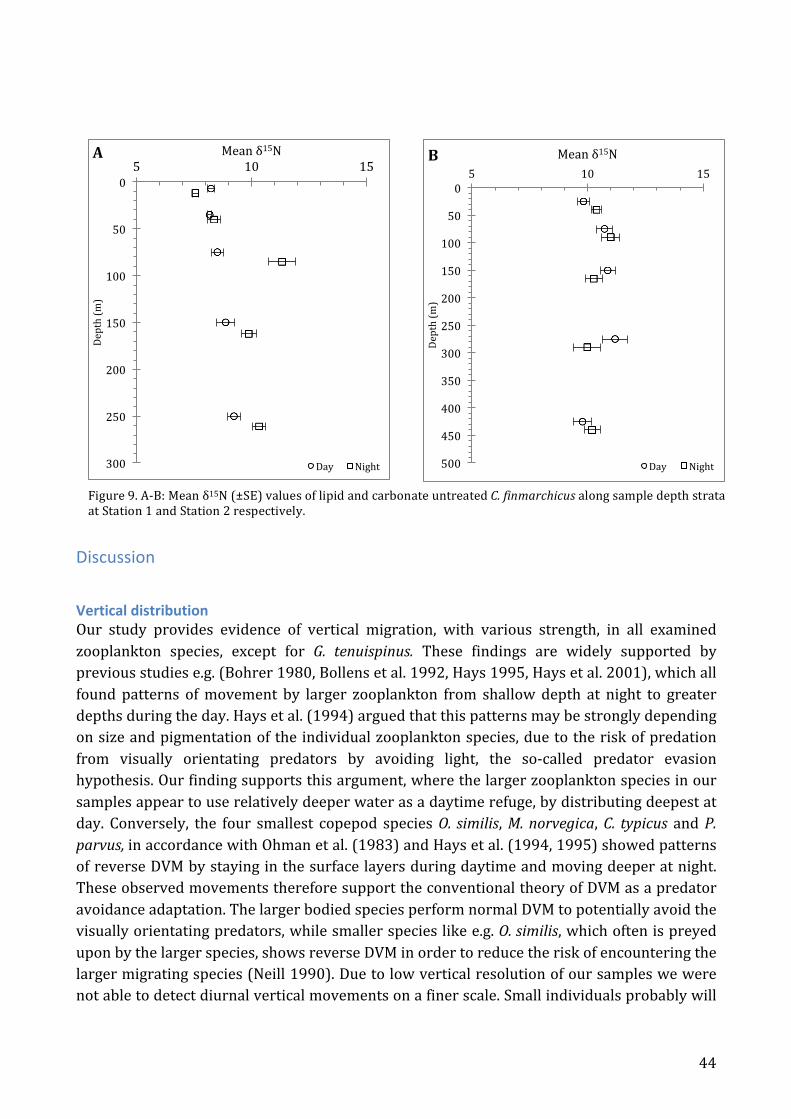
44
Discussion
Vertical distribution Our study provides evidence of vertical migration, with various strength, in all examined zooplankton species, except for G. tenuispinus. These findings are widely supported by previous studies e.g. (Bohrer 1980, Bollens et al. 1992, Hays 1995, Hays et al. 2001), which all found patterns of movement by larger zooplankton from shallow depth at night to greater depths during the day. Hays et al. (1994) argued that this patterns may be strongly depending on size and pigmentation of the individual zooplankton species, due to the risk of predation from visually orientating predators by avoiding light, the so-‐called predator evasion hypothesis. Our finding supports this argument, where the larger zooplankton species in our samples appear to use relatively deeper water as a daytime refuge, by distributing deepest at day. Conversely, the four smallest copepod species O. similis, M. norvegica, C. typicus and P. parvus, in accordance with Ohman et al. (1983) and Hays et al. (1994, 1995) showed patterns of reverse DVM by staying in the surface layers during daytime and moving deeper at night. These observed movements therefore support the conventional theory of DVM as a predator avoidance adaptation. The larger bodied species perform normal DVM to potentially avoid the visually orientating predators, while smaller species like e.g. O. similis, which often is preyed upon by the larger species, shows reverse DVM in order to reduce the risk of encountering the larger migrating species (Neill 1990). Due to low vertical resolution of our samples we were not able to detect diurnal vertical movements on a finer scale. Small individuals probably will
0
50
100
150
200
250
300
5 10 15
Depth (m)
Mean δ15N
A
Day Night
Figure 9. A-‐B: Mean δ15N (±SE) values of lipid and carbonate untreated C. finmarchicus along sample depth strata at Station 1 and Station 2 respectively.
0
50
100
150
200
250
300
350
400
450
500
5 10 15
Depth (m)
Mean δ15N B
Day Night

45
not migrate hundreds of meters in one single diurnal rhythm, especially in considering that the amplitude of migration is associated with energetic costs (Huntley and Brooks 1982). Fiksen and Carlotti (1998) argues that the benefit of DVM amplitude may dependent on the given individual body condition. Huntley and Brooks (1982) also suggests that hunger could be a primary controlling factor for whether individuals migrate back and forth to the surface and that energy reserves may control the migration amplitudes. Thus, individuals only move according to their energy needs, and therefore tend to position themselves in accordance with predation-‐risk, refuge options and energy needs, qua the cost benefit relation (Fiksen and Giske 1995). Båmstedts (2000) similar study in the same waters, observed only daily movements over distances of a few to tens of meters. There are, however, some limitations to this approach when samples are only obtained once during day and once during night for each station. This makes it impossible to test statistically for differences in WMD and DVM and also involves a risk of not detecting all copepods passing this reference depth during a 24 h period. Thus, the index will only provide a rough picture of this behaviour between day and night, and will not show any individual variability in the migration schedule. Thus, due to these methodological restrictions, the WMD and the DVM parameter presented in this study should therefore only be regarded as approximations on the vertical migration changes between day and night. We found a clear difference in the zooplankton depth dispersal between stations. The
deeper Station 2 had the main concentration of zooplankton below 200m while Station 1 had most zooplankton distributed above 200m. The average WMD among species confirmed this concentration shift with little more than a hundred meters differences between the stations from 124m at Station 1 to 227m at Station 2. Station 2 is located in the deepest part of the Skagerrak, thus offering zooplankton the option to seek deeper and gain greater safety with depth (Bollens and Frost 1989a) and also an energetic profit of lower temperatures (Falk-‐Petersen et al. 2009). Melle et al. (2014) found a correlation between abundance distribution with depth and temperature. Their finding supports the idea that maximum abundance is found in the deeper colder basins, or close to them. Gaard et al. (2008) also finds that the depth range may be associated with geographical gradients in temperature. Several species were observed to change their vertical distributions along the studied transects, having deeper position over deep basins. However, our temperature profiles show very little temperature difference between 100 and 250 meters at both stations, thus, it is unlikely that temperature is the determining factor for this depth distribution difference in our study. Gaard et al. (2008) also suggests that the depth position following the seabed contour could create opportunity for interaction between mesopelagic-‐ and bathypelagic species and environments. One possibility could also be the simple relationship that increasing depth allows a greater distribution range, thereby allowing individuals to seek deeper. Having only studied two stations, we cannot rule out the possibility that the observation is the result of a general heterogeneity in density distributions.

46
Size, lipid and copepodite stage distribution of C. finmarchicus The positive correlation of size and lipid content with depth, and the difference of depth distribution between copepods stages, could indicate that the deepest part of the population was at the onset of dormancy, due to their deployment stage and lipid content, in agreement with Jónasdóttir (1999), Miller et al. (2000) and Pasternak (2001). It is generally accepted that lipid accumulation triggers the onset of dormancy (Rey-‐Rassat et al. 2002, Irigoien 2004). However, we did not examine for indications of diapause behaviour (i.e. lack of motility) during field collection. (Båmstedt 2000, Head et al. 2003, Heath et al. 2004, Pepin and Head 2009, Jonasdottir and Koski 2011) all showed equivalent distribution patterns, were C. finmarchicus follow the scheme of a more shallow distribution of younger stages, and a deeper resting phase of late copepodite stages during the overwintering period. The late copepodite stages in our study could simply have accumulated sufficient storage of lipid prior to their dormancy, while lipid content of the smaller copepodite stages were still insufficient. According to Clark et al. (2012), C. finmarchicus will remain active if the threshold of stored lipid is not sufficient, and molt to adulthood before descending to overwintering depth. Båmstedt (2000) demonstrated that the population of C. finmarchicus can be characterised as having active periods of feeding, reproduction and growth in the period from February to July in the area of Skagerrak, with a following 6 to 7 months of dormancy in the deep waters. Studies of (Fiksen and Giske 1995, Fiksen and Carlotti 1998, Pepin and Head 2009, Kvile et al. 2014, Melle et al. 2014) also show that the season of the vertical distribution has a high degree of plasticity, both in time and space, due to variability in the composition of the causal factors such as feeding, competition and to some degree of ontogenetic constraints within each individual. Therefore, even though we observed diel vertical migration in C. finmarchicus, which means a continuous daily activity for a larger part of the population, is it still possible that a proportion of the population already had migrated down as an onset of dormancy, while the less developed still were active and influential in terms of DVM. To test this, we would have to compare the movements of each individual developmental stage, to measure stage dependent DVM, however, we did not do that. Nevertheless, our observations show consistency with the concept of Rey-‐Rassat et al. (2002). They proposed that a threshold amount of lipid is needed in order to supply individuals with the energy required for dormancy, moulting and early gonad development. Accumulation of energy stores above this threshold would trigger a physiological response, probably hormonally mediated (Irigoien 2004), to descend to deeper waters and enter dormancy. For this to be realistic there should be a clear separation in the relative lipid content among the depth strata that would represent the dormancy candidates. Our findings of a significant separation among lipid levels between two consecutive strata at both stations, could confirm this concept to be realistic in our observation. Pepin and Head’s (2009) observations of variation in size and lipid content of C. finmarchicus, also concluded, independent of Rey-‐Rassat et al.’s (2002) concept, that lipid weight of C. finmarchicus was the best measure associated with the onset of dormancy. It is therefore not implausible that the deepest located individuals were at onset of dormancy in our samples due their significantly

47
higher lipid content, and the distribution of the size and late copepodite stages could further contribute to support this, e.g. (Heath et al. 2004).
Our finding that lipid content was significantly greater at midday than at midnight is difficult to explain. Under the assumption of normal DVM behaviour the opposite would be expected since lipid content increase with depth. This suggested that there has been an energetic costs during the night, indicating an eventual diurnal cycle of energy intake and expenditure. However, the difference seems too great for individuals to be able to build up so great lipid in the period of a few hours. Additionally, such behaviour would include that they should have a diurnal rhythm between active and inactive periods. However, this behaviour has not been documented by any other similar studies. Another possibility could be due to migration of lipid rich individuals towards the surface during day. However the observed normal DVM pattern for C. finmarchicus, invalidate this possibility. Therefore, it has not been possible to find similar observations on these trends, thus providing a qualified explanation for the observations. However, due to the consequences that our study only took offset in a small randomly selected sample size of C. finmarchicus from each sample strata, estimation of copepodite stages, lipid and size distribution, might therefore not necessarily represent the true population, but should be seen as an approximations in the effort of describing the vertical picture of the ecological distribution of C. finmarchicus.
Isotopic distribution between depth strata of C. finmarchicus Stable carbon and nitrogen isotope analyses are commonly used to describe food web structure and interactions. The method facilitate easy estimates of energy and mass flow through ecological communities (Post 2002), and provides a time-‐integrated estimation of an organism’s trophic position, and offers an overview of the carbon flow to consumers in food webs (Hansen et al. 2012). Mean fractionation in δ15N between each trophic level is estimated at 3 to 4‰ and can therefore be used to estimate the organism trophic position (Deniro and Epstein 1981, Peterson and Fry 1987, Post 2002). However, it is important to realize, that findings vary greatly among studies. Conversely, the δ13C usually changes little with trophic level (0 to 1‰) (Peterson and Fry (1987). This small or no fractionation of δ13C between trophic levels makes δ13C a useful indicator of carbon source and of migration patterns, in the case where there is spatial variation in the carbon composition of the sources (Post 2002). The significant differences in δ13C values in our study of C. finmarchicus could therefore indicate different origins of carbon sources at the different strata, or considerable microbial transformation of carbon sources as they sink through the water column. The differences further corroborate that there is no major vertical feeding migration in C. finmarchicus and that the individuals are foraging in the same strata in which they are found, although analysis of their food sources would be required to prove this. The deepest located individuals exhibit relatively high variation in δ13C, and some of these match the δ13C values of the individuals found in the upper strata. This may point to the possibility that these individuals were last foraging in shallow layers before migrating deeper. This could further back the suspicion of onset of dormancy in some of these individuals. The
48
high δ13C variations might therefore disclose the possibility of the presence of both active-‐ and overwintering stages in the deepest stratum.
The δ15N values of C. finmarchicus in our study were relatively high compared with some studies (Petursdottir et al. 2008, Søreide et al. 2008, Petursdottir et al. 2010), but agree well with others (Laakmann et al. 2009, Hansen et al. 2012). Values of δ15N in Søreide et al. (2008) and Petursdottir et al. (2010) suggested that C. finmarchicus was pure herbivore, even during times with low algal biomass. Although we do not have isotopic signatures of autotrophs in our study, but the higher values indicate, in line with Laakmann et al. (2009), that their diet is not purely autotrophic. It is often assumed that C. finmarchicus feed almost entirely on phytoplankton organisms (Lee et al. 2006), which is often reflected in their life-‐history traits of seasonal migration and lipid deposition in relation with foraging in periods of algal blooms (Falk-‐Petersen et al. 2009). However, studies also suggest that ciliates and heterotrophic dinoflagellates are just as important food sources in periods of deeper distribution and post-‐bloom, when algal food is scarce (Ohman and Runge 1994, Levinsen et al. 2000). In periods, prior to spring bloom, when chlorophyll-‐a concentrations are extremely low, additional studies of local effect of food type availability also showed female C. finmarchicus to feed omnivorously (Runge and DeLafontaine 1996, Ohman and Hirche 2001). The fact that there were no significant differences in δ15N between depth strata suggest that C. finmarchicus in Skagerrak feed omnivorously at the same trophic level throughout the water column in August.

49
References Aksnes, D. L., and J. Blindheim. 1996. Circulation patterns in the North Atlantic and possible
impact on population dynamics of Calanus finmarchicus. Ophelia 44:7-‐28. Bergstad, O. A., A. D. Wik, and O. Hildre. 2003. Predator-‐prey relationships and food sources of
the Skagerrak deep-‐water fish assemblage. Journal of Northwest Atlantic Fishery Science 31:165-‐180.
Bohrer, R. 1980. Experimental studies on diel vertical migration. In Ecology and Evolution of Zooplankton Communities (ed. W.C. Kerfoot) University Press of New England, Hanover, New Hampshire:111-‐121.
Bollens, S. M., and B. W. Frost. 1989a. Predator-‐induced diel vertical migration in a planktonic copepod. J Plankton Res 11:1047-‐1065.
Bollens, S. M., and B. W. Frost. 1989b. Zooplanktivorous fish and vanable diel vertical migration in the marine planktonic copepod Calanus pacificus. Limnol.Oceanogr. 34:1072-‐1083.
Bollens, S. M., B. W. Frost, D. S. Thoreson, and S. J. Watts. 1992. Diel vertical migration in zooplankton: field evidence in support of the predator avoidance hypothesis. Hydrobiologia 234:33-‐39.
Broms, C., and W. Melle. 2007. Seasonal development of Calanus finmarchicus in relation to phytoplankton bloom dynamics in the Norwegian Sea. Deep-‐Sea Research Part Ii-‐Topical Studies in Oceanography 54:2760-‐2775.
Båmstedt, U. 2000. Life cycle, seasonal vertical distribution and feeding of Calanus finmarchicus in Skagerrak coastal water. Marine Biology 137:279-‐289.
Clark, K. A. J., A. S. Brierley, and D. W. Pond. 2012. Composition of wax esters is linked to diapause behavior of Calanus finmarchicus in a sea loch environment. Limnology and Oceanography 57:65-‐75.
Cohen, J. H., and R. B. Forward. 2009. Zooplankton diel vertical migration -‐ a review of proximate control. Pages 77-‐109 in R. N. Gibson, R. J. A. Atkinson, and J. D. M. Gordon, editors. Oceanography and Marine Biology: An Annual Review, Vol 47. Crc Press-‐Taylor & Francis Group, Boca Raton.
Conway, D. V. P. 2006. Identification of the copepodite developmental stages of twenty-‐six North Atlantic copepods. Marine Biological Association of the United Kingdom, Occasional Publications.
Deniro, M. J., and S. Epstein. 1981. Influence of Diet on the Distribution of Nitrogen Isotopes in Animals. Geochimica Et Cosmochimica Acta 45:341-‐351.
Falk-‐Petersen, S., P. Mayzaud, G. Kattner, and J. Sargent. 2009. Lipids and life strategy of Arctic Calanus. Marine Biology Research 5:18-‐39.
Falkenhaug, T., K. S. Tande, and T. Semenova. 1997. Diel, seasonal and ontogenetic variations in the vertical distributions of four marine copepods. Marine Ecology Progress Series 149:105-‐119.
Fiksen, O., and F. Carlotti. 1998. A model of optimal life history and Diel vertical migration in Calanus finmarchicus. Sarsia 83:129-‐147.
Fiksen, O., and J. Giske. 1995. Vertical-‐distribution and population-‐dynamics of copepods by dynamic optimization. Ices Journal of Marine Science 52:483-‐503.
Fransz, H. G., J. M. Colebrook, J. C. Gamble, and K. M. 1991. The zooplankton of the North Sea. Neth Jsea Res 28(1/2)::1-‐52.

50
Giske, J., D. L. Aksnes, B. M. Balino, S. Kaartvedt, U. Lie, J. T. Nordeide, A. G. V. Salvanes, S. M. Wakili, and A. Aadnesen. 1990. Vertical distribution and trophic interactions of zooplankton and fish in Masfjorden, Norway. Sarsia 75:65-‐81.
Gaard, E., A. Gislason, T. Falkenhaug, H. Soiland, E. Musaeva, A. Vereshchaka, and G. Vinogradov. 2008. Horizontal and vertical copepod distribution and abundance on the Mid-‐Atlantic Ridge in June 2004. Deep-‐Sea Research Part Ii-‐Topical Studies in Oceanography 55:59-‐71.
Hansen, J. H., R. B. Hedeholm, K. Sunksen, J. T. Christensen, and P. Gronkjaer. 2012. Spatial variability of carbon (delta C-‐13) and nitrogen (delta N-‐15) stable isotope ratios in an Arctic marine food web. Marine Ecology Progress Series 467:47-‐59.
Hansson, S., J. E. Hobbie, R. Elmgren, U. Larsson, B. Fry, and S. Johansson. 1997. The stable nitrogen isotope ratio as a marker of food-‐web interactions and fish migration. Ecology 78:2249-‐2257.
Hays, G. C. 1995. Ontogenetic and seasonal variation in the diel vertical migration of the copepods Metridia lucens and Metridia longa. Limnol. Oceanogr 40:1461-‐1465.
Hays, G. C., H. Kennedy, and B. W. Frost. 2001. Individual variability in diel vertical migration of a marine copepod: Why some individuals remain at depth when others migrate. Limnology and Oceanography 46:2050-‐2054.
Hays, G. C., C. A. Proctor, A. W. G. John, and A. J. Warner. 1994. Interspecific differences in diel vertical migration of marine copepods: the implications of size, colour and morphology. Limnology and Oceanography 39:1621-‐1629.
Head, E. J. H., L. R. Harris, and I. Yashayaev. 2003. Distributions of Calanus spp. and other mesozooplankton in the Labrador Sea in relation to hydrography in spring and summer (1995-‐2000). Progress in Oceanography 59:1-‐30.
Heath, M. R., P. R. Boyle, A. Gislason, W. S. C. Gurney, S. J. Hay, E. J. H. Head, S. Holmes, A. Ingvarsdottir, S. H. Jonasdottir, P. Lindeque, R. T. Pollard, J. Rasmussen, K. Richards, K. Richardson, G. Smerdon, and D. Speirs. 2004. Comparative ecology of over-‐wintering Calanus finmarchicus in the northern North Atlantic, and implications for life-‐cycle patterns. Ices Journal of Marine Science 61:698-‐708.
Hind, A., W. S. C. Gurney, M. Heath, and A. D. Bryant. 2000. Overwintering strategies in Calanus finmarchicus. Marine Ecology Progress Series 193:95-‐107.
Hirche, H. J. 1996. Diapause in the marine copepod, Calanus finmarchicus -‐ A review. Ophelia 44:129-‐143.
Hobson, K. A., A. Fisk, N. Karnovsky, M. Holst, J. M. Gagnon, and M. Fortier. 2002. A stable isotope (delta C-‐13, delta N-‐15) model for the North Water food web: implications for evaluating trophodynamics and the flow of energy and contaminants. Deep-‐Sea Research Part Ii-‐Topical Studies in Oceanography 49:5131-‐5150.
Huntley, M., and E. R. Brooks. 1982. Effects of Age and Food Availability on Diel Vertical Migration of Calanus pacificus. Marine Biology 71:23-‐31.
Irigoien, X. 2004. Some ideas about the role of lipids in the life cycle of Calanus finmarchicus. J Plankton Res 26:259-‐263.
Jónasdóttir, S. H. 1999. Lipid content of Calanus finmarchicus during overwintering in the Faroe-‐Shetland Channel. Fisheries Oceanography 8:62-‐72.
Jonasdottir, S. H., and M. Koski. 2011. Biological processes in the North Sea: comparison of Calanus helgolandicus and Calanus finmarchicus vertical distribution and production. J Plankton Res 33:85-‐103.
51
Kurten, B., S. J. Painting, U. Struck, N. V. C. Polunin, and J. J. Middelburg. 2013. Tracking seasonal changes in North Sea zooplankton trophic dynamics using stable isotopes. Biogeochemistry 113:167-‐187.
Kvile, K. O., P. Dalpadado, E. Orlova, N. C. Stenseth, and L. C. Stige. 2014. Temperature effects on Calanus finmarchicus vary in space, time and between developmental stages. Marine Ecology Progress Series 517:85-‐104.
Kaartvedt, S. 1996. Habitat preference during overwintering and timing of seasonal vertical migration of Calanus finmarchicus. Ophelia 44:145-‐156.
Lagergren, R., K. Leberfinger, and J. A. E. Stenson. 2008. Seasonal and ontogenetic variation in diel vertical migration of Chaoborus flavicans and its effect on depth-‐selection behavior of other zooplankton. Limnology and Oceanography 53:1083-‐1092.
Lampert, W. 1989. The adaptive significance of diel vertical migration of zooplankton. Functional Ecology 3:21-‐27.
Lee, R. F., W. Hagen, and G. Kattner. 2006. Lipid storage in marine zooplankton. Marine Ecology Progress Series 307:273-‐306.
Levinsen, H., J. T. Turner, T. G. Nielsen, and B. W. Hansen. 2000. On the trophic coupling between protists and copepods in arctic marine ecosystems. Marine Ecology Progress Series 204:65-‐77.
Lund-‐Hansen, L. C., C. Christiansen, C. Jügensen, K. Richardson, and P. Skyum. 1994. Basisbog i fysisk-‐biologisk Oceanografi. G.E.C Gads forlag, København.
Laakmann, S., M. Kochzius, and H. Auel. 2009. Ecological niches of Arctic deep-‐sea copepods: Vertical partitioning, dietary preferences and different trophic levels minimize inter-‐specific competition. Deep-‐Sea Research Part I-‐Oceanographic Research Papers 56:741-‐756.
Marshall, S. M., and A. P. Orr. 1955. The biology of marine copepod Calanus finmarchicus (Gunners). Oliver and Boyd, Edinburgh.
Melle, W., J. Runge, E. Head, S. Plourde, C. Castellani, P. Licandro, J. Pierson, S. Jonasdottir, C. Johnson, C. Broms, H. Debes, T. Falkenhaug, E. Gaard, A. Gislason, M. Heath, B. Niehoff, T. G. Nielsen, P. Pepin, E. K. Stenevik, and G. Chust. 2014. The North Atlantic Ocean as habitat for Calanus finmarchicus: Environmental factors and life history traits. Progress in Oceanography 129:244-‐284.
Miller, C. B., J. A. Crain, and C. A. Morgan. 2000. Oil storage variability in Calanus finmarchicus. Ices Journal of Marine Science 57:1786-‐1799.
Maar, M., T. G. Nielsen, K. Richardson, U. Christaki, O. S. Hansen, S. Zervoudaki, and E. D. Christou. 2002. Spatial and temporal variability of food web structure during the spring bloom in the Skagerrak. Marine Ecology Progress Series 239:11-‐29.
Neill, W. E. 1990. Induced vertical migration in copepods as a defence against invertebrate predation. Nature 345:524-‐526.
Ohman, M. D., B. W. Frost, and E. B. Cohen. 1983. Reverse diel vertical migration -‐ an escape from invertebrate predators. Science 220:1404-‐1407.
Ohman, M. D., and H. J. Hirche. 2001. Density-‐dependent mortality in an oceanic copepod population. Nature 412:638-‐641.
Ohman, M. D., and J. A. Runge. 1994. Sustained fecundity when phytoplankton resources are in short supply—omnivory by Calanus finmarchicus in the Gulf of St-‐Lawrence. Limnology and Oceanography 39:21-‐36.

52
Pasternak, A., E. Arashkevich, K. Tande, and T. Falkenhaug. 2001. Seasonal changes in feeding, gonad development and lipid stores in Calanus finmarchicus and C-‐hyperboreus from Malangen, northern Norway. Marine Biology 138:1141-‐1152.
Pepin, P., and E. J. H. Head. 2009. Seasonal and depth-‐dependent variations in the size and lipid contents of stage 5 copepodites of Calanus finmarchicus in the waters of the Newfoundland Shelf and the Labrador Sea. Deep-‐Sea Research Part I-‐Oceanographic Research Papers 56:989-‐1002.
Peterson, B. J., and B. Fry. 1987. Stable isotopes in ecosystem studies. Annual Review of Ecology and Systematics 18:293-‐320.
Petursdottir, H., S. Falk-‐Petersen, H. Hop, and A. Gislason. 2010. Calanus finmarchicus along the northern Mid-‐Atlantic Ridge: variation in fatty acid and alcohol profiles and stable isotope values, delta N-‐15 and delta C-‐13. J Plankton Res 32:1067-‐1077.
Petursdottir, H., A. Gislason, S. Falk-‐Petersen, H. Hop, and J. Svavarsson. 2008. Trophic interactions of the pelagic ecosystem over the Reykjanes Ridge as evaluated by fatty acid and stable isotope analyses. Deep-‐Sea Research Part Ii-‐Topical Studies in Oceanography 55:83-‐93.
Planque, B., and S. D. Batten. 2000. Calanus finmarchicus in the North Atlantic: the year of Calanus in the context of interdecadal change. Ices Journal of Marine Science 57:1528-‐1535.
Post, D. M. 2002. Using stable isotopes to estimate trophic position: Models, methods, and assumptions. Ecology 83:703-‐718.
Rey-‐Rassat, C., X. Irigoien, R. Harris, and F. Carlotti. 2002. Energetic cost of gonad development in Calanus finmarchicus and C. helgolandicus. Marine Ecology Progress Series 238:301-‐306.
Rodhe, J. 1987. The large scale circulation in the Skagerrak: interpretation of some observations. Tellus 39:245-‐253.
Runge, J. A., and Y. DeLafontaine. 1996. Characterization of the pelagic ecosystem in surface waters of the northern Gulf of St Lawrence in early summer: The larval redfish Calanus microplankton interaction. Fisheries Oceanography 5:21-‐37.
Sato, M., H. Sasaki, and M. Fukuchi. 2002. Stable isotopic compositions of overwintering copepods in the arctic and subarctic waters and implications to the feeding history. Journal of Marine Systems 38:165-‐174.
Stahl, H., A. Tengberg, J. Brunnegard, E. Bjornbom, T. L. Forbes, A. B. Josefson, H. G. Kaberi, I. M. K. Hassellov, F. Olsgard, P. Roos, and P. O. J. Hall. 2004. Factors influencing organic carbon recycling and burial in Skagerrak sediments. Journal of Marine Research 62:867-‐907.
Svansson, A. 1975. Physical and chemical oceanography of the Skagerrak and the Kattegat., Inst Mar Res (GENERIC), Lysekil.
Søreide, J. E., S. Falk-‐Petersen, E. N. Hegseth, H. Hop, M. L. Carroll, K. A. Hobson, and K. Blachowiak-‐Samolyk. 2008. Seasonal feeding strategies of Calanus in the high-‐Arctic Svalbard region. Deep-‐Sea Research Part Ii-‐Topical Studies in Oceanography 55:2225-‐2244.
Søreide, J. E., T. Tamelander, H. Hop, K. A. Hobson, and I. Johansen. 2006. Sample preparation effects on stable C and N isotope values: a comparison of methods in Arctic marine food web studies. Marine Ecology Progress Series 328:17-‐28.

53
Williams, R. 1985. Vertical distribution of Calanus finmarchicus and C. helgolandicus in relation to the development of the seasonal thermocline in the Celtic Sea. Marine Biology 86:145-‐149.
Worthington, E. 1931. Vertical movements of freshwater macroplankton. Int. Rev. Gesam. Hydrobiol 25:394-‐436.


