

1Q 2014 | VIETNAM OVERVIEW
KNOWLEDGE REpORtvietnam
www.colliers.com/vietnam
Imperia An phu, District 2, HCMC

VIEtNAM ECONOMIC UpDAtE• Local government shows endeavour in economic
reformHO CHI MINH CIty & HANOI’s ECONOMIC UpDAtEHO CHI MINH CIty pROpERty MARKEt
Office• Market Overview• Market Insight• ForecastRetail• Market Overview• Market Insight• ForecastCondominium• Market Overview• Market Insight• ForecastCompounded Villa & townhouse• Market Overview• Market Insight• Forecast
sOUtHERN INDUstRIAL MARKEtHANOI pROpERty MARKEt
Office• Market Overview• Market Insight• ForecastRetail• Market Overview• Market Insight• ForecastResidential• Market Overview• Market Insight• Forecast
tAbLE OF CONtENts
VIEtNAM pROpERty MARKEt At A GLANCE
1
2
3
5
7
910
11
12
13
. . . . . . . . . . . . . . . . . . . . . . . . . . . . . . . . . . . . . . . . . . . . . . .
. . . . . . . . . . . . . . . . . . . . . . . . . . . . . . . . . . . . . . . . . . . . . . .
. . . . . . . . . . . . . . . . . . . . . . . . . . . . . . . . . . . . . . . . . . . . . . .
. . . . . . . . . . . . . . . . . . . . . . . . . . . . . . . . . . . . . . . . . . . . . .
. . . . . . . . . . . . . . . . . . . . . . . . . . . . . . . . . . . . . . . . . . . . . .
. . . . . . . . . . . . . . . . . . . . . . . . . . . . . . . . . . . . . . . . . . . . . .
. . . . . . . . . . . . . . . . . . . . . . . . . . . . . . . . . . . . . . . . . . . . . . .
. . . . . . . . . . . . . . . . . . . . . . . . . . . . . . . . . . . . . . . . . . . . . . .
. . . . . . . . . . . . . . . . . . . . . . . . . . . . . . . . . . . . . . . . . . . . . . .
. . . . . . . . . . . . . . . . . . . . . . . . . . . . . . . . . . . . . . . . . . . . . .
VIETNAM | 1Q 2014 | ECONOMIC UPDATE
p.1 | Colliers International
VIEtNAM’ s GDp GROWtH RAtE
IMpORt - EXpORt FIGUREs, 1Q 2014
source: GsO, Colliers International
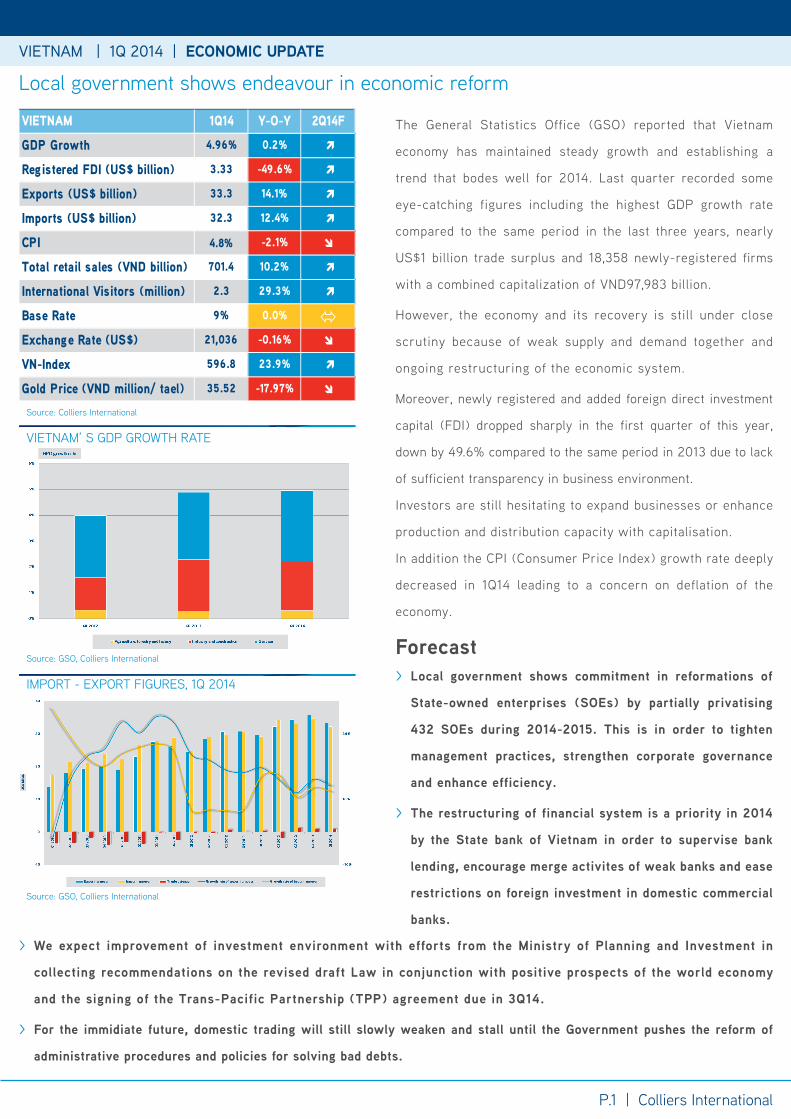
Local government shows endeavour in economic reform
VIETNAM 1Q14 Y-O-Y 2Q14FGDP Growth 4.96% 0.2%
Registered FDI (US$ billion) 3.33 -49.6%
Exports (US$ billion) 33.3 14.1%
Imports (US$ billion) 32.3 12.4%
CPI 4.8% -2.1%
Total retail sales (VND billion) 701.4 10.2%
International Visitors (million) 2.3 29.3%
Base Rate 9% 0.0% Exchange Rate (US$) 21,036 -0.16%
VN-Index 596.8 23.9%
Gold Price (VND million/ tael) 35.52 -17.97%
source: Colliers International
source: GsO, Colliers InternationalForecast > Local government shows commitment in reformations of
State-owned enterprises (SOEs) by partially privatising
432 SOEs during 2014-2015. This is in order to tighten
management practices, strengthen corporate governance
and enhance efficiency.
> The restructuring of financial system is a priority in 2014
by the State bank of Vietnam in order to supervise bank
lending, encourage merge activites of weak banks and ease
restrictions on foreign investment in domestic commercial
banks.
the General statistics Office (GsO) reported that Vietnam
economy has maintained steady growth and establishing a
trend that bodes well for 2014. Last quarter recorded some
eye-catching figures including the highest GDp growth rate
compared to the same period in the last three years, nearly
Us$1 billion trade surplus and 18,358 newly-registered firms
with a combined capitalization of VND97,983 billion.
However, the economy and its recovery is still under close
scrutiny because of weak supply and demand together and
ongoing restructuring of the economic system.
Moreover, newly registered and added foreign direct investment
capital (FDI) dropped sharply in the first quarter of this year,
down by 49.6% compared to the same period in 2013 due to lack
of sufficient transparency in business environment.
Investors are still hesitating to expand businesses or enhance
production and distribution capacity with capitalisation.
In addition the CpI (Consumer price Index) growth rate deeply
decreased in 1Q14 leading to a concern on deflation of the
economy.
> We expect improvement of investment environment with efforts from the Ministry of Planning and Investment in
collecting recommendations on the revised draft Law in conjunction with positive prospects of the world economy
and the signing of the Trans-Pacific Partnership (TPP) agreement due in 3Q14.
> For the immidiate future, domestic trading will still slowly weaken and stall until the Government pushes the reform of
administrative procedures and policies for solving bad debts.

HO CHI MINH & HA NOI | 1Q 2014 | ECONOMIC UPDATE
p.2 | Colliers International
HCMC - HANOI GDp GROWtH RAtEHCMC - HANOI CpI GROWtH by MONtH
source: GsO, Colliers International
> HCMC saw positive signs of economic recovery in
the first quarter of 2014.
> A huge foreign capital inflow, mainly contributed by
real estate sector (approximately Us$302.3 million)
was recorded.
> GDp growth rate is in upward trend though Industry
and Construction sector saw a decrease over the
same period of 2013 (6.1% vs. 6.8%).
> In the next quarter, the city will focus on tackling
difficulties of local firms as well as accelerating
major infrastructure projects.
HCMC saw positive prospects in economic figures
HO CHI MINH CITY 1Q14 Y-O-Y 2Q14FGDP Growth 7.7% 0.1%
Registered FDI (US$ million) 687.7 11.6
Exports (US$ billion) 6.33 -7.0%
Imports (US$ billion) 5.38 -6.0%
CPI 4.57% 1.33%
Total retail sales (VND billion) 152.6 12.1%
International Visitors (million) 1.2 19.0%
source: GsO, Colliers International
source: GsO, Colliers International
Registered FDI of Ha Noi dropped 1.8% y-o-y during last quarter
HA NOI 1Q14 Y-O-Y 2Q14FGDP Growth 6.6% -0.9%
Registered FDI (US$ million) 38 -74%
Exports (US$ billion) 2.51 9.8%
Imports (US$ billion) 5.5 0.2%
International Visitors (million) 0.5 12.3%
> Hanoi’s GDp growth in 1Q 2014 reached 6.6%
y-o-y of which the service sector contributed 4%
and another 2.57% was added by the construction
and industry.
> During last quarter, the service showed the
greatest improvement of 7.6%, followed by
construction and industry at 6.1%.source: GsO, Colliers International
HO CHI MINH CITY | 1Q 2014 | PROPERTY MARKET
> Regarding to foreign investment, the registered FDI of Hanoi last quarter dropped 1.8% y-o-y.
> In Jan 2014, CpI of Hanoi rise by 0.7% m-o-m or 6.78% y-o-y. this was the highest rise of CpI in this quarter because of tet
Holiday. After that, the CpI gained only 0.49% m-o-m in Feb and dropped 0.15% m-o-m in Mar.
> Generally, the CpI of Mar increased approx. 5.99% y-o-y.

HO CHI MINH & HA NOI | 1Q 2014 | ECONOMIC UPDATE HO CHI MINH CITY | 1Q 2014 | PROPERTY MARKET
HCmC Property market Overview
View of HCMC CbD
HO CHI MINH CITY | 1Q 2014 | OFFICE MARKET
p.3 | Colliers International
GRADE A pERFORMANCE, 1Q 2014
FUtURE sUppLy OF GRADE A & b OFFICE, 1Q 2014source: Colliers International
source: Colliers International
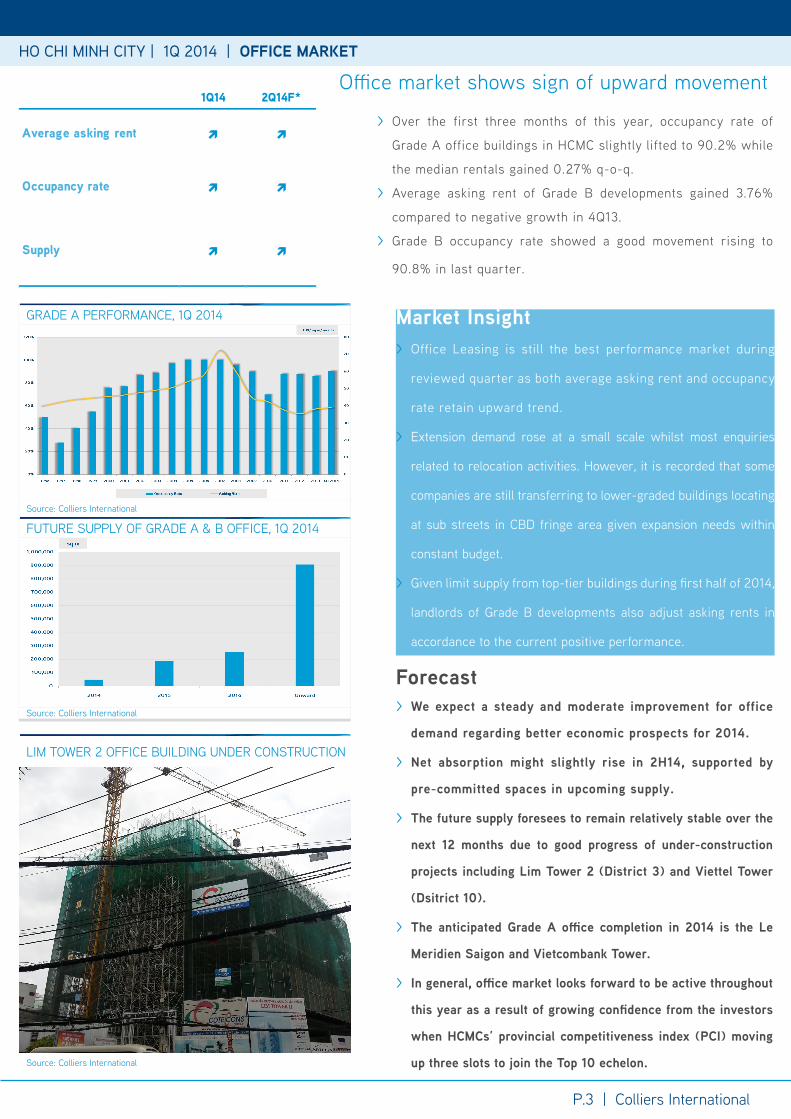
LIM tOWER 2 OFFICE bUILDING UNDER CONstRUCtION
source: Colliers International
Forecast > We expect a steady and moderate improvement for office
demand regarding better economic prospects for 2014.
> Net absorption might slightly rise in 2H14, supported by
pre-committed spaces in upcoming supply.
> The future supply foresees to remain relatively stable over the
next 12 months due to good progress of under-construction
projects including Lim Tower 2 (District 3) and Viettel Tower
(Dsitrict 10).
> The anticipated Grade A office completion in 2014 is the Le
Meridien Saigon and Vietcombank Tower.
> In general, office market looks forward to be active throughout
this year as a result of growing confidence from the investors
when HCMCs’ provincial competitiveness index (PCI) moving
up three slots to join the Top 10 echelon.
Office market shows sign of upward movement
> Over the first three months of this year, occupancy rate of
Grade A office buildings in HCMC slightly lifted to 90.2% while
the median rentals gained 0.27% q-o-q.
> Average asking rent of Grade b developments gained 3.76%
compared to negative growth in 4Q13.
> Grade b occupancy rate showed a good movement rising to
90.8% in last quarter.
Market Insight > Office Leasing is still the best performance market during
reviewed quarter as both average asking rent and occupancy
rate retain upward trend.
> Extension demand rose at a small scale whilst most enquiries
related to relocation activities. However, it is recorded that some
companies are still transferring to lower-graded buildings locating
at sub streets in CbD fringe area given expansion needs within
constant budget.
> Given limit supply from top-tier buildings during first half of 2014,
landlords of Grade b developments also adjust asking rents in
accordance to the current positive performance.
1Q14 2Q14F*
Average asking rent
Occupancy rate
Supply
HO CHI MINH CITY | 1Q 2014 | OFFICE MARKET
p.4 | Colliers International

HO CHI MINH CITY | 1Q 2014 | OFFICE MARKET
p.3 | Colliers International
HO CHI MINH CITY | 1Q 2014 | OFFICE MARKET
p.4 | Colliers International
HCmC Office market Overview
* Us$/ sq. m/ month (on net area)
No Name AddressCom-pletion year
NLA (sq m)
service Charges (*)
Occupancy rate
NFA asking rent (*)
1 saigon Centre 65 Le Loi 1996 11,650 6.0 90% 41.02 saigon tower 29 Le Duan 1997 13,950 6.0 100% 37.03 sunwah tower 115 Nguyen Hue 1997 20,800 6.0 90% 42.54 the Metropolitan 235 Dong Khoi 1997 15,200 6.0 95% 41.35 Diamond plaza 34 Le Duan 1999 15,936 8.0 98% 39.06 Kumho Asiana plaza 39 Le Duan 2009 26,000 8.0 98% 49.37 bitexco Financial tower 45 Ngo Duc Ke 2010 37,710 8.0 86% 34.08 president place 93 Nguyen Du 2012 8,330 6.0 88% 30.0
9 times square 22-36 Nguyen Hue 2012 9,000 7.0 65% 50.0
Grade A 187,841 7.0 90.2% 39
1 OsIC 8 Nguyen Hue 1993 6,500 6.0 99% 20.02 yoco building 41 Nguyen thi Minh Khai 1995 5,000 5.0 100% 16.03 somerset Chancellor Court 21-23 Nguyen thi Minh Khai 1996 3,200 5.0 98% 21.04 Central plaza 17 Le Duan 1997 6,094 5.0 100% 26.05 saigon Riverside Office 2A-4A ton Duc thang 1997 10,000 5.0 98% 20.06 saigon trade Center 37 ton Duc thang 1997 31,416 6.0 96% 23.07 Harbour View tower 35 Nguyen Hue 1997 8,000 5.0 93% 20.0
8 MeLinh point tower 02 Ngo Duc Ke 1999 17,600 6.0 100% 24.09 Zen plaza 54-56 Nguyen trai 2001 11,037 5.0 97% 21.010 bitexco Office building 19-25 Nguyen Hue 2003 6,000 5.0 100% 22.011 the Landmark 5b ton Duc thang 2005 8,000 5.0 82% 21.012 Opera View 161-167 Dong Khoi 2006 3,100 7.0 95% 26.013 Indochina park tower 4bis Nguyen Dinh Chieu 2006 2,145 4.0 96% 10.014 petro tower 1-5 Le Duan 2007 13,304 5.0 99% 30.015 City Light 45 Vo thi sau 2007 10,000 5.0 98% 15.016 the Landcaster 22bis Le thanh ton 2007 7,000 5.0 100% 24.017 Gemadept tower 5 Le thanh ton 2008 14,000 7.0 100% 23.018 Fideco tower 81-85 Ham Nghi 2008 15,000 6.0 99% 20.019 Havana tower 132 Ham Nghi 2008 7,326 6.0 99% 21.020 sailing tower 51 Nguyen thi Minh Khai 2008 16,910 5.0 99% 25.021 Royal Center 235 Nguyen Van Cu 2008 14,320 5.0 100% 23.022 tMs 172 Hai ba trung 2009 4,000 4.0 100% 23.023 bao Viet tower 233 Dong Khoi 2010 10,650 6.0 100% 21.024 Green power tower 35 ton Duc thang 2010 15,600 6.0 96% 22.025 Vincom Center 68-70-72 Le thanh ton 2010 56,600 5.0 72% 25.026 saigon Royal 91 pasteur 2010 5,340 4.0 100% 19.027 A&b tower 76 Le Lai 2010 17,120 6.0 99% 28.028 Maritime bank tower 192 Nguyen Cong tru 2010 19.596 5.0 89% 23.029 Empress tower 138 Hai ba trung 2012 19,538 6.0 87% 26.030 Lim tower 9-11 ton Duc thang 2013 29,265 6.0 89 28.0
Grade b (selective developments) 364,396 4.9 90.73% 19.15
HO CHI MINH CITY | 1Q 2014 | RETAIL MARKET
p.5 | Colliers International
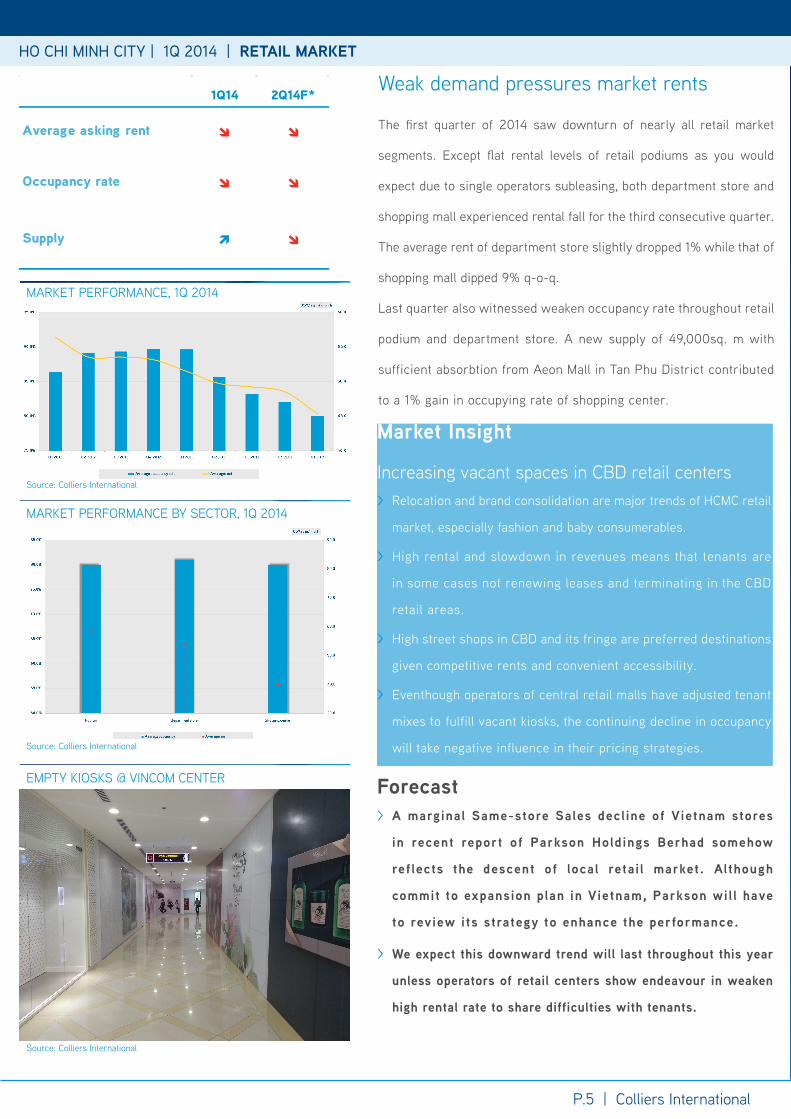
the first quarter of 2014 saw downturn of nearly all retail market
segments. Except flat rental levels of retail podiums as you would
expect due to single operators subleasing, both department store and
shopping mall experienced rental fall for the third consecutive quarter.
the average rent of department store slightly dropped 1% while that of
shopping mall dipped 9% q-o-q.
Last quarter also witnessed weaken occupancy rate throughout retail
podium and department store. A new supply of 49,000sq. m with
sufficient absorbtion from Aeon Mall in tan phu District contributed
to a 1% gain in occupying rate of shopping center.
MARKEt pERFORMANCE, 1Q 2014
MARKEt pERFORMANCE by sECtOR, 1Q 2014
EMpty KIOsKs @ VINCOM CENtER
source: Colliers International
source: Colliers International
source: Colliers International
Forecast > A marginal Same-store Sales decline of Vietnam stores
in recent report of Parkson Holdings Berhad somehow
reflects the descent of local retai l market. Although
commit to expansion plan in Vietnam, Parkson wil l have
to review its strategy to enhance the performance.
> We expect this downward trend will last throughout this year
unless operators of retail centers show endeavour in weaken
high rental rate to share difficulties with tenants.
Weak demand pressures market rents
Market Insight
Increasing vacant spaces in CbD retail centers > Relocation and brand consolidation are major trends of HCMC retail
market, especially fashion and baby consumerables.
> High rental and slowdown in revenues means that tenants are
in some cases not renewing leases and terminating in the CbD
retail areas.
> High street shops in CbD and its fringe are preferred destinations
given competitive rents and convenient accessibility.
> Eventhough operators of central retail malls have adjusted tenant
mixes to fulfill vacant kiosks, the continuing decline in occupancy
will take negative influence in their pricing strategies.
HO CHI MINH CITY | 1Q 2014 | RETAIL MARKET
p.6 | Colliers International
1Q14 2Q14F*
Average asking rent
Occupancy rate
Supply
HO CHI MINH CITY | 1Q 2014 | RETAIL MARKET
p.5 | Colliers International
HO CHI MINH CITY | 1Q 2014 | RETAIL MARKET
No Name of project /building Address Location Comple-
tion yearNLA
(sq m)Average Rental
(Us$/sq m/month) Occupancy Rate
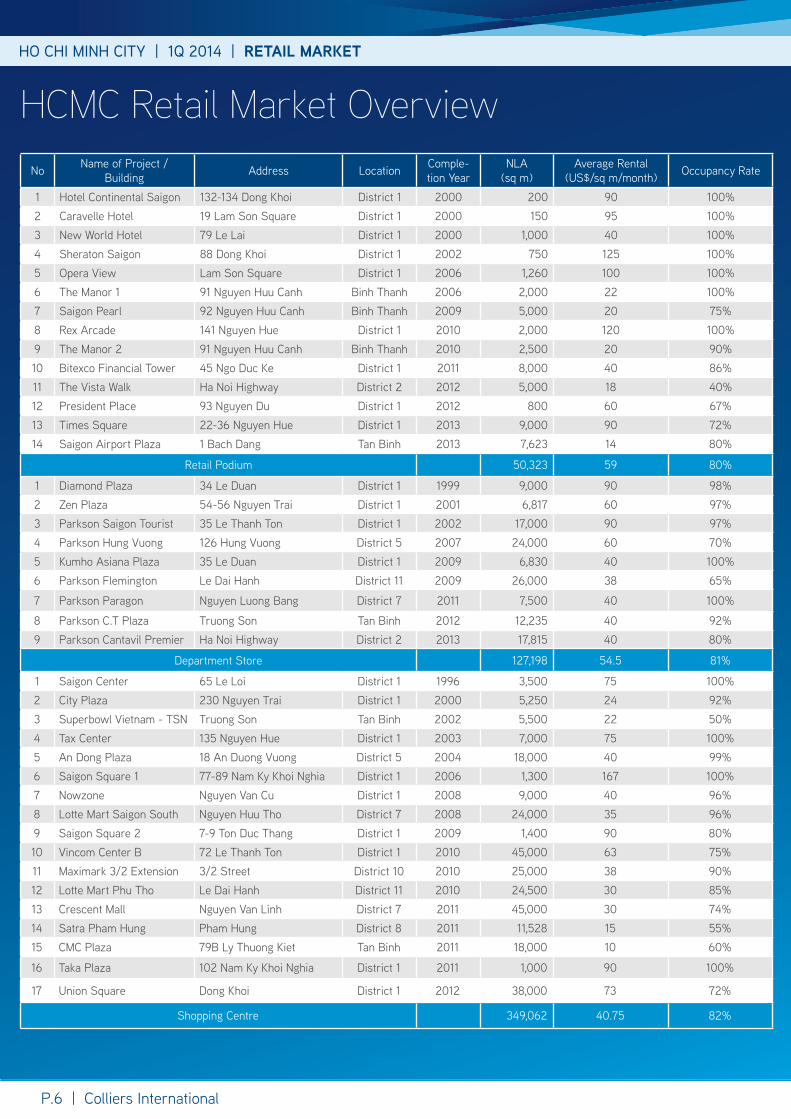
1 Hotel Continental saigon 132-134 Dong Khoi District 1 2000 200 90 100%2 Caravelle Hotel 19 Lam son square District 1 2000 150 95 100%3 New World Hotel 79 Le Lai District 1 2000 1,000 40 100%4 sheraton saigon 88 Dong Khoi District 1 2002 750 125 100%5 Opera View Lam son square District 1 2006 1,260 100 100%6 the Manor 1 91 Nguyen Huu Canh binh thanh 2006 2,000 22 100%7 saigon pearl 92 Nguyen Huu Canh binh thanh 2009 5,000 20 75%8 Rex Arcade 141 Nguyen Hue District 1 2010 2,000 120 100%9 the Manor 2 91 Nguyen Huu Canh binh thanh 2010 2,500 20 90%10 bitexco Financial tower 45 Ngo Duc Ke District 1 2011 8,000 40 86%11 the Vista Walk Ha Noi Highway District 2 2012 5,000 18 40%12 president place 93 Nguyen Du District 1 2012 800 60 67%13 times square 22-36 Nguyen Hue District 1 2013 9,000 90 72%14 saigon Airport plaza 1 bach Dang tan binh 2013 7,623 14 80%
Retail podium 50,323 59 80%
1 Diamond plaza 34 Le Duan District 1 1999 9,000 90 98%2 Zen plaza 54-56 Nguyen trai District 1 2001 6,817 60 97%3 parkson saigon tourist 35 Le thanh ton District 1 2002 17,000 90 97%4 parkson Hung Vuong 126 Hung Vuong District 5 2007 24,000 60 70%5 Kumho Asiana plaza 35 Le Duan District 1 2009 6,830 40 100%6 parkson Flemington Le Dai Hanh District 11 2009 26,000 38 65%
7 parkson paragon Nguyen Luong bang District 7 2011 7,500 40 100%
8 parkson C.t plaza truong son tan binh 2012 12,235 40 92%9 parkson Cantavil premier Ha Noi Highway District 2 2013 17,815 40 80%
Department store 127,198 54.5 81%
1 saigon Center 65 Le Loi District 1 1996 3,500 75 100%2 City plaza 230 Nguyen trai District 1 2000 5,250 24 92%3 superbowl Vietnam - tsN truong son tan binh 2002 5,500 22 50%4 tax Center 135 Nguyen Hue District 1 2003 7,000 75 100%5 An Dong plaza 18 An Duong Vuong District 5 2004 18,000 40 99%6 saigon square 1 77-89 Nam Ky Khoi Nghia District 1 2006 1,300 167 100%7 Nowzone Nguyen Van Cu District 1 2008 9,000 40 96%8 Lotte Mart saigon south Nguyen Huu tho District 7 2008 24,000 35 96%9 saigon square 2 7-9 ton Duc thang District 1 2009 1,400 90 80%10 Vincom Center b 72 Le thanh ton District 1 2010 45,000 63 75%11 Maximark 3/2 Extension 3/2 street District 10 2010 25,000 38 90%12 Lotte Mart phu tho Le Dai Hanh District 11 2010 24,500 30 85%13 Crescent Mall Nguyen Van Linh District 7 2011 45,000 30 74%14 satra pham Hung pham Hung District 8 2011 11,528 15 55%15 CMC plaza 79b Ly thuong Kiet tan binh 2011 18,000 10 60%
16 taka plaza 102 Nam Ky Khoi Nghia District 1 2011 1,000 90 100%
17 Union square Dong Khoi District 1 2012 38,000 73 72%
shopping Centre 349,062 40.75 82%
HCmC Retail market Overview
p.6 | Colliers International
HO CHI MINH CITY | 1Q 2014 | CONDOMINIUM MARKET
p.7 | Colliers International
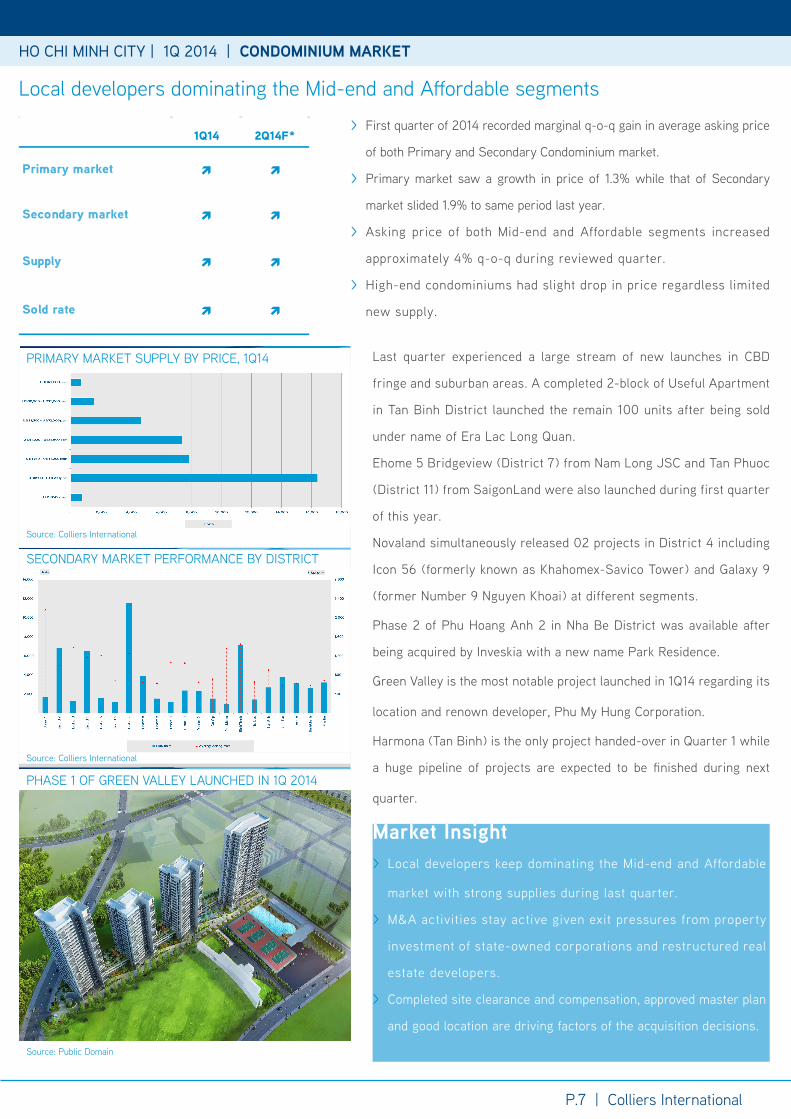
pRIMARy MARKEt sUppLy by pRICE, 1Q14
sECONDARy MARKEt pERFORMANCE by DIstRICt
Last quarter experienced a large stream of new launches in CbD
fringe and suburban areas. A completed 2-block of Useful Apartment
in tan binh District launched the remain 100 units after being sold
under name of Era Lac Long Quan.
Ehome 5 bridgeview (District 7) from Nam Long JsC and tan phuoc
(District 11) from saigonLand were also launched during first quarter
of this year.
Novaland simultaneously released 02 projects in District 4 including
Icon 56 (formerly known as Khahomex-savico tower) and Galaxy 9
(former Number 9 Nguyen Khoai) at different segments.
phase 2 of phu Hoang Anh 2 in Nha be District was available after
being acquired by Inveskia with a new name park Residence.
Green Valley is the most notable project launched in 1Q14 regarding its
location and renown developer, phu My Hung Corporation.
Harmona (tan binh) is the only project handed-over in Quarter 1 while
a huge pipeline of projects are expected to be finished during next
quarter.
source: Colliers International
source: Colliers International
pHAsE 1 OF GREEN VALLEy LAUNCHED IN 1Q 2014
source: public Domain
Market Insight > Local developers keep dominating the Mid-end and Affordable
market with strong supplies during last quarter.
> M&A activities stay active given exit pressures from property
investment of state-owned corporations and restructured real
estate developers.
> Completed site clearance and compensation, approved master plan
and good location are driving factors of the acquisition decisions.
Local developers dominating the Mid-end and Affordable segments
> First quarter of 2014 recorded marginal q-o-q gain in average asking price
of both primary and secondary Condominium market.
> primary market saw a growth in price of 1.3% while that of secondary
market slided 1.9% to same period last year.
> Asking price of both Mid-end and Affordable segments increased
approximately 4% q-o-q during reviewed quarter.
> High-end condominiums had slight drop in price regardless limited
new supply.
HO CHI MINH CITY | 1Q 2014 | CONDOMINIUM MARKET
1Q14 2Q14F*
Primary market
Secondary market
Supply
Sold rate
HO CHI MINH CITY | 1Q 2014 | CONDOMINIUM MARKET
p.7 | Colliers International
HO CHI MINH CITY | 1Q 2014 | CONDOMINIUM MARKET
> single bed apartment and studio’s sized ranging from 55 to 70sq. m at projects located in suburban areas like tan binh, tan
phu and thu Duc District are best-selling products of the market currently.
> Finishing apartment projects are preferred option of End-user purchasers and buy-to-let customers who expect long-term capital
gain while investors diversify from High-end to Mid-end segment at suburban areas due to higher liquidation.
> Handing-over flats after 50% payment and paying the rest in 2-3 years with no or fixed low interest rate are common promotional
program of the developers.
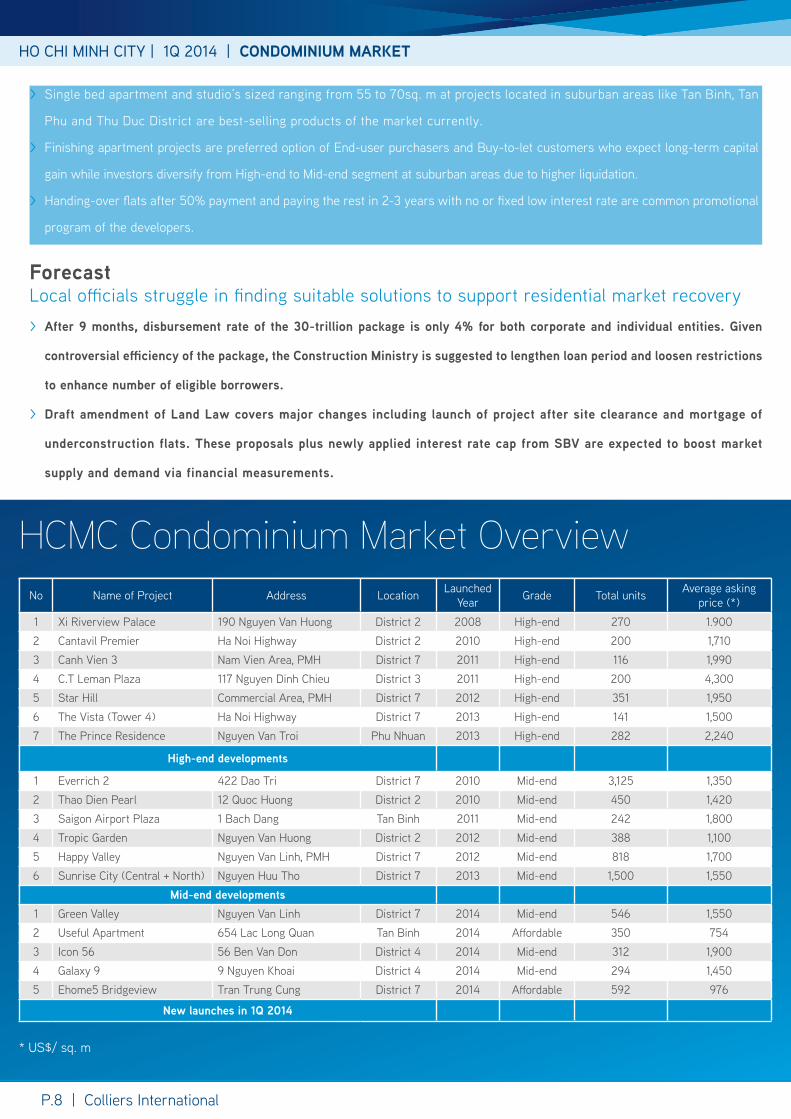
No Name of project Address Location Launched year Grade total units Average asking
price (*)
1 Xi Riverview palace 190 Nguyen Van Huong District 2 2008 High-end 270 1.9002 Cantavil premier Ha Noi Highway District 2 2010 High-end 200 1,7103 Canh Vien 3 Nam Vien Area, pMH District 7 2011 High-end 116 1,9904 C.t Leman plaza 117 Nguyen Dinh Chieu District 3 2011 High-end 200 4,3005 star Hill Commercial Area, pMH District 7 2012 High-end 351 1,9506 the Vista (tower 4) Ha Noi Highway District 7 2013 High-end 141 1,5007 the prince Residence Nguyen Van troi phu Nhuan 2013 High-end 282 2,240
High-end developments
1 Everrich 2 422 Dao tri District 7 2010 Mid-end 3,125 1,3502 thao Dien pearl 12 Quoc Huong District 2 2010 Mid-end 450 1,4203 saigon Airport plaza 1 bach Dang tan binh 2011 Mid-end 242 1,8004 tropic Garden Nguyen Van Huong District 2 2012 Mid-end 388 1,1005 Happy Valley Nguyen Van Linh, pMH District 7 2012 Mid-end 818 1,7006 sunrise City (Central + North) Nguyen Huu tho District 7 2013 Mid-end 1,500 1,550
Mid-end developments1 Green Valley Nguyen Van Linh District 7 2014 Mid-end 546 1,5502 Useful Apartment 654 Lac Long Quan tan binh 2014 Affordable 350 7543 Icon 56 56 ben Van Don District 4 2014 Mid-end 312 1,9004 Galaxy 9 9 Nguyen Khoai District 4 2014 Mid-end 294 1,4505 Ehome5 bridgeview tran trung Cung District 7 2014 Affordable 592 976
New launches in 1Q 2014
HCmC Condominium market Overview
* Us$/ sq. m
p.8 | Colliers International
ForecastLocal officials struggle in finding suitable solutions to support residential market recovery > After 9 months, disbursement rate of the 30-trillion package is only 4% for both corporate and individual entities. Given
controversial efficiency of the package, the Construction Ministry is suggested to lengthen loan period and loosen restrictions
to enhance number of eligible borrowers.
> Draft amendment of Land Law covers major changes including launch of project after site clearance and mortgage of
underconstruction flats. These proposals plus newly applied interest rate cap from SBV are expected to boost market
supply and demand via financial measurements.

HO CHI MINH CITY | 1Q 2014 | COMPOUNDED VILLA & TOWNHOUSE MARKET
p.9 | Colliers International
No Name of project Address Location Launched year Grade total units Average asking
price (*)
1 Chateau Nguyen Luong bang, pMH District 7 2011 Luxury 67 7,1002 thao Dien Villas Nguyen Van Huong st. District 2 2011 High-end 18 2,4003 thao Dien Midpoint Nguyen Van Huong st. District 2 2011 High-end 11 3,8304 Goldora Villa bung Ong thoan st. District 9 2011 Mid-end 119 1,4005 HeadQuarters Nguyen Huu tho st. Nha be 2011 High-end 46 1,5806 Hoja Villa Duong Dinh Hoi st. District 9 2012 Mid-end 29 1,2207 Nam Vien Villas Nam Vien District, pMH District 7 2013 High-end 58 3,2008 My Van 2 Nam Vien District, pMH District 7 2013 High-end 32 4,2009 saigon pearl Villa p3 Nguyen Huu Canh st. binh thanh 2013 High-end 36 7,12010 Mega Residence Eastern Ring Road District 9 2014 Mid-end 160 630
HCmC Compounded villa & townhouse market
> primary asking price of Luxury and High-end segments remained
stable during last quarter.
> Average price of Mid-end developments slightly decreased due to
competitive selling price of new launches including Mega Residence
(District 9) and phase 2 of Arista Villas (thu Duc).
Market Insight > there are two main groups of buyers: End-users and Investors
with different selective factors.
> Investors prefers to purchase new launches from a very early stage
to choose the best products at initial price. project location and
early-bird offers are decisive elements of this group.
> In contrast, End-user buyers are more cautious in their choices at
completing/completed projects with existing infrastructure system
and visible surrounding facilities.
1Q14 2Q14F*
Average asking price
Sold rate
Supply
CURRENt sUppLy by DIstRICt, 1Q 2014
source: Colliers International
Most of market supply located in suburban areas
District 7 is preferred location of compounded villa and townhouse
projects with 1,010 units (41%), mostly contributed by phu My Hung New
Urban Area.
the number of current units in District 9 and District 2 are accounted of
19% and 17% of total supply respectively.
Majority of current supply in District 9 is nested around the Eastern Ring
Road bordered by Lien phuong and Nguyen Duy trinh street.
* Us$/ sq. m

SOUTHERN AREAS | 1Q 2014 | INDUSTRIAL MARKET
p.10 | Colliers International
> southern Key Economic Region is the leader in developing and manufacturing some of the advanced services, especially in
manufacturing of electronic components, software, business services, logistics, finance, telecommunications, tourism.
> HCMC plays the most important role of caliber service center in southeast Asia with increasing demand for industrial
properties, especially renting of factory building sized of 500-3,000 sq. m. Currently, this type of product is favored by
foreign investors.
> because of similar rental rates, factories in the Ips at HCMC, Long An, binh Duong, Dong Nai are competing by additional
services covering investment permit procedures of warehouse renting and professional personnels.
> Given detailed business needs, landlords of Ips also offer built-in factories/warehouses following tenants’ specifications, this
service is known as “built to suit“.
MAJOR INDUstRIEs OF sOUtHERN pROVINCEs
source: public Domain, Colliers International
Developers of Industrial parks competing with value-added services
Southern industrial market OverviewNo Name of Development Location Area
(hecta) Warehouse Rental Occupancy Rate
1 tan binh tan binh + tan phu District 128 3-4 100%2 Linh trung 1 thu Duc District 62 3-4 100%3 tan tao binh Chanh District 380 3 87.7%4 tan thuan District 7 300 4 81%5 Le Minh Xuan binh Chanh District 100 3 100%6 Vinh Loc binh Chanh District 203 3-4 100%7 Cu Chi Western North Cu Chi District 208 2-3 100%8 Hien phuoc 1 Nha be District 311 3-4 92%9 Cat Lai 2 District 2 124 3.5 89%10 Dong Nam Cu Chi District 287 2-3 27%
* Us$/ sq. m

HANOI | 1Q 2014 | PROPERTY MARKET
Hanoi Property market OverviewHANOI | 1Q 2014 | OFFICE MARKET
p.11 | Colliers International Keangnam Hanoi Landmark tower

HANOI | 1Q 2014 | OFFICE MARKET
Landlords of Grade A buildings in the old CbD still kept confident with
their strategic location and service provision. they continue to retain
their higher asking rents while offering more flexible negotiations on
other contract terms and better sales scheme in order to absorb new
tenants as well as retain existing.
We notice the strategy to hold higher figure rent on contract while the
actual rent paid is practically lower by “rent free period”, and longer
fitting out time as well as other incentives.
p.11 | Colliers International
GRADE A OFFICE pERFORMANCE
source: Colliers International
FUtURE sUppLy by DIstRICt
> In the middle of 2014, Lotte Centre Hanoi would be ready to use, adding another 45,000 sq. m of Grade A office in the area
between old and new CBD. This shall challenging much greater competition threat to either old or new CBD areas.
> Because of that huge increasing number of supply, the office market would still belong to tenant.
Developers adopt flexible incentive strategies to anticipated with gains in office supply entering market > the downtrend of office market continued during 1Q 2014. Although
the occupancy rate was higher than previous quarter, the asking
rent kept decreasing.
> In 1Q 2014, Grade A asking rents decreased slightly. Rents were
recorded on average at Us$32.3 per sq. m per month.
> Landlords around the city continue to offer incentives or tenants
as mutual benefits in order to attract companies during hard times
economic.
> the average occupancy of the Grade A offices was about 75%, a
little bit higher than the previous quarter.
> EVN tower’s (Cua bac street, ba Dinh District) 73,000 sq. m has
not been launched in last quarter as scheduled.
> three Grade b office buildings were launched, adding approx. 45.6
thousand sq. m of Net Leasable Area to the market.
> Most of the new spaces came from Hai ba trung District.
> the minor remaining space was the five-floor podium of Eurowindow
Complex (22 tran Duy Hung street, Cau Giay District).
> pVI tower (Cau Giay District) was launched in Jan 2014, adding to
Grade A office market approx. 51,000 sq. m of NLA, of which about
70% area has been occupied.
1Q14 2Q14F*
Average asking rent
Occupancy rate
Supply

MARKEt sUppLy, 1Q 2014
HANOI | 1Q 2014 | RETAIL MARKET
p.12 | Colliers International
> Retail podiums received the highest rental among market
segments, ranging from approx. Us$71.2 to Us$100 per sq.
m per month, fol lowed by department stores (fluctuating
from $32.8 to $84 per sq. m per month).
> the rental of shopping centre reached only $34.8 to $67.4 per sq.
m per month.
> However, the average rent of shopping centre is higher than
department store (i.e. Us $53 vs Us $46 per sqm per month).
> Average rent of retail podium reached Us $80 per sqm per month.
> Considering occupancy rate, the highest number belongs to
department store (88%), whereas retail podium and shopping
centre were occupied by approx. 82.1% and 80.5% accordingly.
MARKEt pERFORMANCE, 1Q 2014
source: Colliers International
source: Colliers International
Forecast > Lotte Center Hanoi is scheduled to launch in 2Q 2014. This premium location will attract many visitors in the area between the Old and
New CBDs.
> Meanwhile on the demand side, it is believed that retailers are also facing lots of difficulties in their business when customers are
tightening their budget due to the slow economy. However, as the International retailers are targeting Vietnamese large population
and new trendy lifestyle, we could expect that retail market segment would recover faster than any other real estate sector.
> As the negotiation process of TPP (Trans-Pacific Partnership), a trade agreement between Australia, Brunei, Chile, Canada, Japan,
Malaysia, Mexico, New Zealand, Peru, Singapore, the United States and Vietnam, might finish in Q3 2014, a brighter future is expected
for retail market.
Large scale projects pressure rental rates
the podium of MIpEC tower which was acquired by Lotte Vietnam
last year has been re-launched in this quarter, under new name
of Lotte Mart. this shopping center added approx. 20,000 sq. m
back to the market.
the average market rent was recorded at approximately Us
$49.76/ sq. m, a decrease of 4.8% q-o-q or approx. 34.2%
y-o-y. the occupancy rate was about 81.6%, declining by 1.4
percentage point q-o-q. this decline mainly comes from the
mass launching of new space and the re-launching of retail
space at the end of last year.
General ly, the retail market seems silent as the economic sti l l
grey. the CpI increased slightly in Jan and Feb, by 0.7% and
0.46% q-o-q, respectively. It even dropped by 0.15% q-o-q in
Mar.
HANOI | 1Q 2014 | RESIDENTIAL MARKET
p.13 | Colliers International
1Q14 2Q14F*
Average asking rent
Occupancy rate
Supply

HANOI | 1Q 2014 | RETAIL MARKET
p.12 | Colliers International
HANOI | 1Q 2014 | RESIDENTIAL MARKET
p.13 | Colliers International
Following the survey of Colliers International, HN residential market
has 32% of total projects under construction, 41% on planning and
vacant land status while 27% remaining delayed.
the future supply focus on the projects located in Ha Dong, tu Liem,
Dong Da, Cau Giay, and Hoang Mai District.
the major primary supply in 1Q 2014 is in Ha Dong and Hai ba trung
District.
the number of apartments in the primary supply decreased of approx.
16% from previous quarter.
pRIMARy MARKEt pERFORMANCE, 1Q 2014
sECONDARy MARKEt pERFORMANCE, 1Q 2014
MARKEt sUppLy by DIstRICt, 1Q 2014
source: Colliers International
source: Colliers International
Forecast > In 1Q2014, the market price of apartment is stable and the liquidity
in some projects is more positive given discount and supporting
policies from the developers. These programs are expected to boost
market demand in near future.
> The buyers are now more careful in their decision after series of
projects have been delayed because of the difficulty in capital,
they now tend to concern in developers with high reputation and
projects are under construction with clear legal document.
stability in both primary and secondary residential market
source: Colliers International
> Average asking price of the primary market is stable in last quarter.
> Affordable apartments’ asking price is in range of Us$600 – 700
per sq. m while the Mid-end segment reached Us$1,100 per sq. m.
> the secondary market slightly decreased, it only dropped about 2%
in asking price from previous quarter.
> Ha Dong and Cau Giay areas with affordable projects pricing at
Us$ 844 per sq. m on average are leading in supply number of
apartments.
> the average price of apartment tend to moderately increase in next
quarters, partly coming from the changing in area measurement
method according to the Circular 03/2014/tt-bXD issued by the
Ministry of Construction.
> About 7,000 units were completed in last quarter, which show that
developer have trend to strongly push on the progress of the project
in order to reinforce the customers’ belief.
> the asking price in both primary and secondary markets stable
relatively and there are sign of recovery in the next quarters.
1Q14 2Q14F*
Primary market
Secondary market
Supply
Sold rate

HANOI | 1Q 2014 | PROPERTY MARKET
No Name of project Developer Location Completed year
NLA(sq m.)
Average asking price (*)
1 Viet tower Hoa binh trading & Invest-ment JsC 1 thai Ha, Dong Da 2008 20,000 18
2 EVN tower EVN 11 Cua bac, ba Dinh 2012 45,621 45
3 star tower CFtD - VLA Lot 32, Duong Dinh Nghe, Cau Giay 2012 3,465 17
4 pacific building NCX 2 Dai Co Viet, Hai ba trung 2013 4,279 17
5 VID tower 30/4 tourism & trading JsC 115 tran Hung Dao, Hoan Kiem 2013 4,136 21
6 63 Le Van Luong 319 Group 63 Le Van Luong, trung Hoa, Cau Giay 2013 12,254 18
Hanoi Office market Overview
p.14 | Colliers International
Hanoi Retail market Overview
Hanoi Residential market Overview
No Name of project Developer Location Completed year
NLA(sq m.)
Average asking price (*)
1 EVN tower EVN 11 Cua bac, ba Dinh 2012 4,385 45
2 Hong River tower thien Duc services JsC 2 tran Hung Dao, Hoan Kiem 2012 2,300 35
3 63 Le Van Luong 319 Group 63 Le Van Luong, trung Hoa, Cau Giay 2013 20,728 45
4 Mo Market shopping Mall Vinaconex 459C bach Mai, truong Dinh, Hai ba trung 2013 24,223 45
5 CtM building CtM 139 Cau Giay 2014 5,000 45
No Name of project Developer Location Hand-over period total units Average asking
price (*)
1 Mandarin Garden Hoa phat Group Hoang Minh Giam, trung Hoa, Cau Giay 1Q 2014 1,008 1,524
2 berriver Long bien Hanco 9 Nguyen Van Cu, Long bien 2Q 2014 324 1,270
3 tan tay Do Hai phat tan Lap, Dan phuong 3Q 2014 924 610
4 136 Ho tung Mau Vinaconex 7 Ho tung Mau, Cau Dien, tu Liem 4Q 2014 360 730
5 the pride Hai phat An Hung, Ha Dong 4Q 2015 2,000 760
* Us$/ sq m/ month (on net area)
* Us$/ sq m/ month (on net area)

p.14 | Colliers International
KNOWLEDGE REPORT | 1Q 2014 | VIETNAM
With more than 100 professionals in 2 offices in Vietnam, the team is market driven and has proven and successful track record with both international and local experience.
From Hanoi to Ho Chi Minh City, we provide a full range of real estate services
•Research > Market research across all sectors > Market analysis, advisory, and strategy
•Valuation & Advisory Services > Valuation for land, existing property or development sites > Feasibility studies to determine NPV, IRR and highest & best use
•Office Services > Tenant Representation > Landlord Representation
•Residential Sales & Leasing
•Retail Services
• Investment Services
•Real Estate Management Services
•Corporate Services
• Industrial Leasing
The foundation of our services is the strength and depth of our experience.
COLLIERS INTERNATIONAL
HO CHI MINH CItybitexco Office building, 7th Floor19-25 Nguyen Hue streetDistrict 1, HCM City, Vietnamtel: + 84 8 3827 5665
HANOICapital tower, 10th Floor109 tran Hung Dao street, Hoan Kiem District, Hanoi, Vietnamtel: +84 4 3941 3277
485 offices in63 countries on6 continents
Accelerating success
QUANG NGUYENResearch [email protected]+84 938 056 603
About Colliers InternationalColliers International is a leader in global real estate services, defined by our spirit of enterprise.through a culture of service excellence and a shared sense of initiative, we integrate the resources of real estate specialists worldwide to accelerate the success of our partners.
We connect through a shared set of values that shape a collaborative environment throughout our organization that is unsurpassed in the industry.
publication Coverage Frequency Content Availability
Research & Forecast Report
Vietnam Cities Quarterly All market sectors publicly available
CbD Report HCMC CbD Monthly Office, Retail, Hotel and serviced Apartment
publicly available
Asia pacific Office Report
Asia pacific in-cluding Vietnam
Quarterly Office market publicly available
Vietnam property Market Report
Vietnam cities Quarterly All market sectors On subscription
Development Recommendation
Vietnam cities At request All market sectors On subscription
$2billion in annual revenue
2.5billion square feet under management
15,700professionalsand staff
www.colliers.com/vietnam
Please contact, If you would like to recieve our other research reports
LINH PHAMResearch [email protected]+84 912 013 536
This document has been prepared by Colliers International for advertising and general information only. Colliers International makes no guarantees, representations or warranties of any kind, expressed or implied, regarding the information including, but not limited to, warranties of content, accuracy and reliability. Any interested party should undertake their own inquiries as to the accuracy of the information. Colliers International excludes unequivocally all inferred or implied terms, conditions and warranties arising out of this document and excludes all liability for loss and damages arising there from. This publication is the copyrighted property of Colliers International and/or its licensor(s). ©2013. All rights reserved.
YEN NGUYENResearch [email protected]+84 915 478 778


