

Yale School of Management
Hedge Funds and International Opportunities and Threats
William N. Goetzmann
Yale School of Management

Yale School of Management
Two Parts
Example of opportunity Corporate governance Sentiment
Example of threat Blame and the Asian currency crisis

Yale School of Management
Modeling and Measuring Russian Corporate Governance:
The Case of Russian Preferred and Common Shares
William N. Goetzmann
Matthew Spiegel
Andrey Ukhov

Yale School of Management
Barriers to Efficiency
Expectations process flawed. Unreasonable expectations Poor information about benefits
The comparison process is flawed Market prices not observed or accurate
The trading process is flawed. Insider information vs. liquidity Recorded prices are inaccurate.

Yale School of Management
The Average Ratio of Common to Preferred Price Equally Weighted Index
0
1
2
3
4
5
6
7
8
Aug
-97
Oct
-97
Dec
-97
Feb
-98
Apr
-98
Jun-
98
Aug
-98
Oct
-98
Dec
-98
Feb
-99
Apr
-99
Jun-
99
Aug
-99
Oct
-99
Dec
-99
Feb
-00
Apr
-00
Jun-
00
Aug
-00
Oct
-00
Dec
-00
Feb
-01
Apr
-01
Jun-
01
Aug
-01
Oct
-01
Dec
-01
Feb
-02
Apr
-02
Jun-
02
Aug
-02
Oct
-02
Dec
-02
Feb
-03
Apr
-03
Date
Rat
io o
f C
om
mo
n t
o P
refe
rred
Sh
are
Pri
ces
Big 8 ALL

Yale School of Management
Stylized facts about Russian Preferred Shares
Minimum dividend set equal to a fraction of the firm’s earnings. Typically 10%.
Minimum dividend must at least equal that paid to the common shareholders.
Protection against splits, and similar actions.

Yale School of Management
The Puzzle
Why do Russian preferred shares typically sell for substantially less than the common?
The preferred are guaranteed cash flows at least equal to the common.
The preferred are guaranteed at least 10% of the firm’s profits.
The preferred get the legal right to vote.

Yale School of Management
Voting
Preferred shareholders are allowed to vote on: . . . modifications or amendments to the Charter may
affect the rights and interests of the first issue Preferred Stock owners . . . the decision has to be ratified by those owning two thirds of the Preferred Stock . . . Surgutneftegaz Charter
Other firms pool votes from the common and preferred.
Is voting really allowed?
Yale School of Management
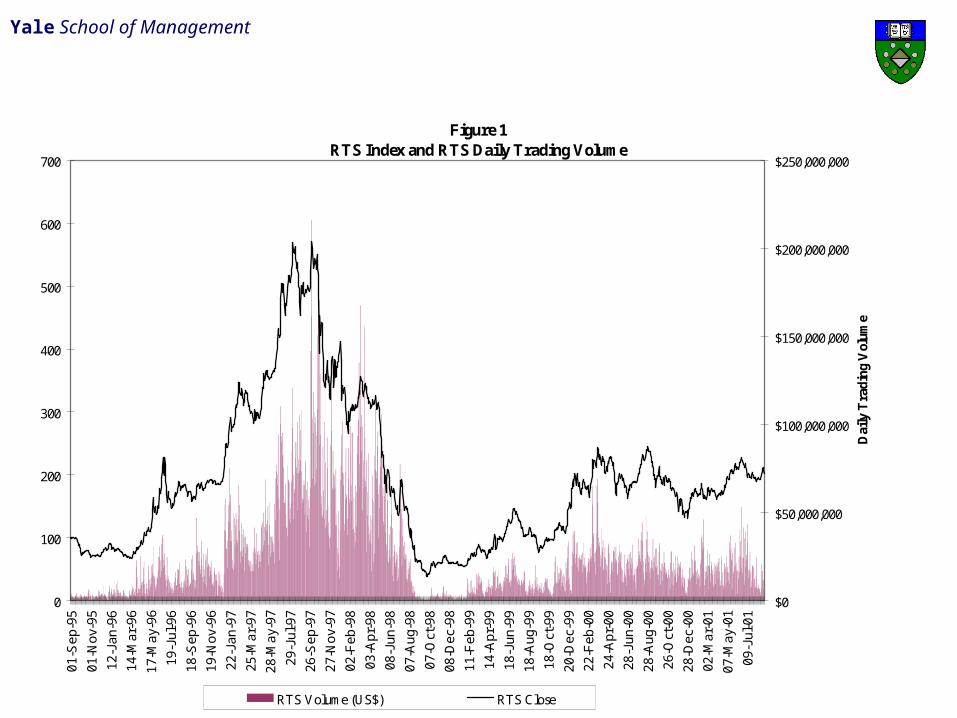
Figure 1RTS Index and RTS Daily Trading Volume
0
100
200
300
400
500
600
700
01-S
ep-9
5
01-N
ov-9
5
12-J
an-9
6
14-M
ar-9
6
17-M
ay-9
6
19-J
ul-9
6
18-S
ep-9
6
19-N
ov-9
6
22-J
an-9
7
25-M
ar-9
7
28-M
ay-9
7
29-J
ul-9
7
26-S
ep-9
7
27-N
ov-9
7
02-F
eb-9
8
03-A
pr-9
8
08-J
un-9
8
07-A
ug-9
8
07-O
ct-9
8
08-D
ec-9
8
11-F
eb-9
9
14-A
pr-9
9
18-J
un-9
9
18-A
ug-9
9
18-O
ct-9
9
20-D
ec-9
9
22-F
eb-0
0
24-A
pr-0
0
28-J
un-0
0
28-A
ug-0
0
26-O
ct-0
0
28-D
ec-0
0
02-M
ar-0
1
07-M
ay-0
1
09-J
ul-0
1
$0
$50,000,000
$100,000,000
$150,000,000
$200,000,000
$250,000,000
Dai
ly T
radi
ng V
olum
e
RTS Volume (US$) RTS Close

Yale School of Management
Can Corporate Governance Explain the Price Discrepancy?
Paper builds three simple models of expropriation and calculates the parameters needed to explain the current observed price discrepancies.
Two cash flow perpetual growth models, with a constant discount rate.
One relative return model.

Yale School of Management
Model 1: Value Expropriation
At some date T the common will take some fraction α of the preferred’s value.
Free parameters: r = interest rateα = level of expropriationg = growth rateT = expropriation date.
Fix r and α to reasonable values and then see if reasonable values of g and T will fit the data.

Yale School of Management
Values of T and g Implied by Prices of Common and Preferred Shares
Expropriation level: 75%r = real rate, g(rowth rate) in %, T
(expropriation date) years
LKOH RTKM SNGS
r 2000 2002 2000 2002 2000 2002
5% [g]
[T]
[2]
[14]
[-4]
[6]
[4]
[6]
[3]
[14]
[4]
[19]
[4]
[56]
15% [g]
[T]
[12]
[16]
[6]
[7]
[14]
[6]
[13]
[15]
[14]
[21]
[14]
[61]

Yale School of Management
Conclusions
No reasonable assumptions justify the spread. Is Russia a place where “reasonable”
assumptions make sense? Was this an opportunity for a convergence
trade? What factors should be considered?

Yale School of Management
Threats: Background
Speculators in global marketsSoros’ 1992 “attack”1997 Asian crisis1998 IMF study
Small group of funds with leverage attacking. Herding Positive feedback -- momentum

Yale School of Management
Possible? Likely?
Hedge fund scale vs. financial institutionsCo-ordination vs. concealmentPositive feedback?
Tech bubble stocks/large investors

Yale School of Management
BGP paper
Focus on a set of major funds Monthly data. Estimate exposures through time. Examine returns around crisis.
Some weekly data for two funds. Provides better estimates.

Yale School of Management
Funds and Capitalization, 9/1993 through 9/1997
Company 9/93 Capital 9/94 Capital 9/95 Capital 9/96 Capital 9/97 CapitalCapital International $414,851,451 $889,557,779 $889,557,779 $1,281,490,551 $2,098,790,487
$77,475,986 $188,000,000 $188,000,000 $521,000,000 $1,030,000,000 NA $2,100,000,000 $2,100,000,000 $2,471,369,347 $3,173,802,345
Tiger Management Corp. $3,207,000,000 $3,867,000,000 $3,867,000,000 $4,096,585,000 $7,109,416,846Orbis Investment Mgmt Ltd $586,086,439 $616,622,417 $616,622,417 $826,700,000 $1,122,579,613Orbis Investment Mgmt Ltd $626,514,397 $724,830,691 $724,830,691 $899,500,000 $1,039,465,999
Soros Fund Management NA $1,397,535,723 $1,397,535,723 $1,661,300,000 $2,026,600,000Soros Fund Management NA $3,803,764,764 $3,803,764,764 $4,528,400,000 $5,882,800,000
Soros Fund Management NA $1,259,245,119 $1,259,245,119 $1,567,900,000 $1,544,200,000Swiss Bank Corporation NA $828,724,170 $828,724,170 $1,848,500,000 $2,379,200,000
$4,911,928,273 $21,918,252,844 $15,675,280,664 $21,442,320,671 $29,467,860,414

Yale School of Management
Estimation
Rolling correlationsChanging frequencyWhat assets/currencies?

Yale School of Management
Fund Performance
Return 9/93 -10/97
June
July
August
Septem
ber
October
Emerging Markets Fund 8.13% 0.87% 1.59% 1.08% 1.88% 1.25%Everest Capital Int'l Ltd 18.21% 0.87% 0.87% 2.41% -2.10% 3.82%Haussman Holdings NV 12.54% 2.41% 0.87% 0.87% 10.98% 5.85%
Jaguar Fund NV 22.42% -2.10% 10.98% 0.87% 0.87% -4.29%
Orbis Global Equity Fund 13.72% 3.82% 5.85% -4.29% 0.87% 0.87%Orbis Optimal Equity Fund 6.65% 1.06% -1.67% 2.81% 0.27% 0.87%Quantum Emerging Growth 19.97% 5.65% 10.29% -6.72% 2.00% -11.77%
Quasar International Fund 11.25% 2.35% 9.17% -5.88% 0.45% -15.11%Quota Fund NV 43.50% 4.25% 13.62% -8.17% -3.86% -15.74%
Swiss Bank Currency Portfolio 13.92% -2.52% 0.38% 4.11% 1.46% 0.72%
Ringgit/Dollar Return -0.10% -0.47% -4.21% -10.17% NA

Yale School of Management
04/14/95
06/16/95 08/18/95 10/20/95 12/22/95 02/23/96 04/26/96 06/28/96 08/30/96 11/01/96 01/03/97 03/07/97 05/09/97 07/11/97 09/12/97 11/14/97
-15
-10
-5
0
5
Estimated Exposure Coefficie
nt
0.6 5
0.7
0.7 5
0.8
0.8 5
0.9
0.9 5
1
1.0 5
As ia n Ba s k e t
J a pa n
Ge rma ny
Brita in
Me x ic o
ring g it In de x
M anager 1: Exposures to M ul t i pl e Currenci es1 2 we e k ro llin g c oe ffic ie n ts

Yale School of Management
Managers
1994Jan
1994Apr
1994Jul
1994Oct
1995Jan
1995Apr
1995Jul
1995Oct
1996Jan
1996Apr
1996Jul
1996Oct
1997Jan
1997Apr
1997Jul
1997Oct
-40
-20
01
02
0Quantum.Emerging.Growth
Estimated 4 Month Exposure to Asia Basket
1994Jan
1994Apr
1994Jul
1994Oct
1995Jan
1995Apr
1995Jul
1995Oct
1996Jan
1996Apr
1996Jul
1996Oct
1997Jan
1997Apr
1997Jul
1997Oct
-20
02
04
0
Quasar.International.Fund
Estimated 4 Month Exposure to Asia Basket

Yale School of Management
Managers
1994Jan
1994Apr
1994Jul
1994Oct
1995Jan
1995Apr
1995Jul
1995Oct
1996Jan
1996Apr
1996Jul
1996Oct
1997Jan
1997Apr
1997Jul
1997Oct
-60
-40
-20
02
0Quota.Fund.NV
Estimated 4 Month Exposure to Asia Basket
1994Jan
1994Apr
1994Jul
1994Oct
1995Jan
1995Apr
1995Jul
1995Oct
1996Jan
1996Apr
1996Jul
1996Oct
1997Jan
1997Apr
1997Jul
1997Oct
-10
01
02
03
0
Currency.Portfolio.Ltd
Estimated 4 Month Exposure to Asia Basket

Yale School of Management
Fund & Hsieh Study
Larger number of funds: 19Style analysis identified macro-managers
Macro Trend Emerging Market
More events

Yale School of Management
October 1987
-40-30-20-10
0102030405060
Ret
urn
for
the
Mon
th
9/1/1987
Hedge Funds in Sample

Yale School of Management
1992 European Rate Mechanism Crisis
-10
0
10
20
30
Macro Macro Macro Macro Macro Macro Macro Macro Macro
Macro Macro Macro trend trend trend EM unclass unclass
unclass unclass unclass unclass
Yale School of Management
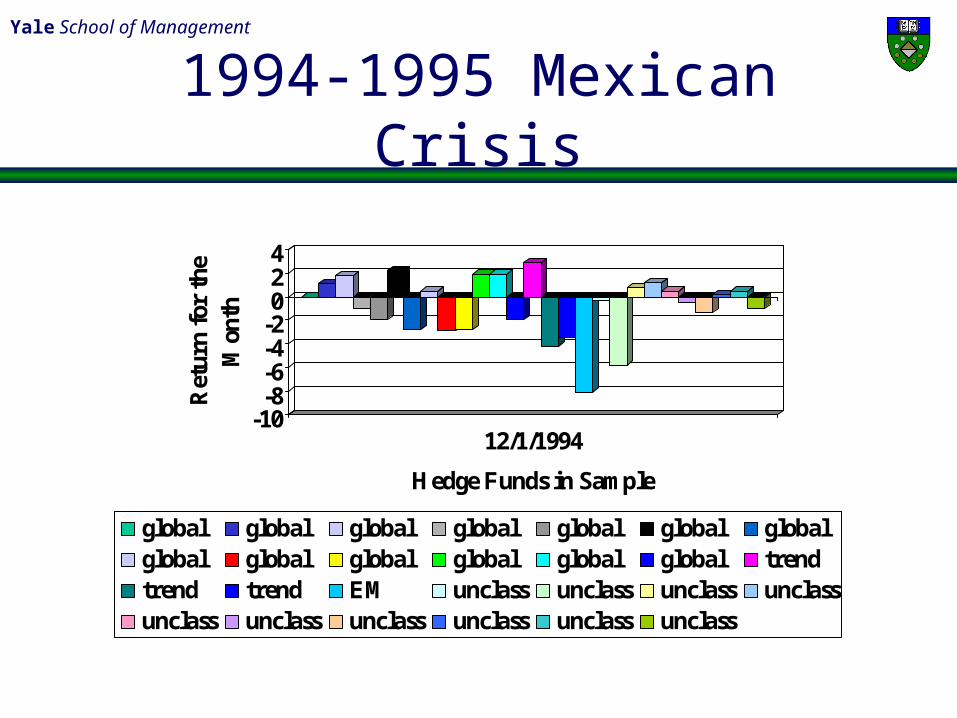
1994-1995 Mexican Crisis
-10-8-6-4-2024
Ret
urn
for
the
Mon
th
12/1/1994
Hedge Funds in Sample
global global global global global global globalglobal global global global global global trendtrend trend EM unclass unclass unclass unclassunclass unclass unclass unclass unclass unclass

Yale School of Management

Yale School of Management
According to F&S…
“Hedge funds never had more than $6 Billion short position in Asia currencies”
Was this enough?Small compared to banks: $36 billion net
outflow.

Yale School of Management
Current/Future Issues
“Manipulation” of voting rights?Short-selling as a threat?Foreign investor governance “arbitrage”Nature of arbitrage in expectations


