

© Optimal Design January 2018 1 of 10
Minimizing Reshuffling/Shifting in Container Stacking
OptiStack Software Presentation
http://www.optimaldesign.com/OptiStack/OptiStack.htm
Document Purpose This document presents a recent advance in optimization of Container Stacking, an efficiency problem
faced in particular by container maritime ports. Its aim is to explain what kind of optimization OptiStack
does, and then illustrate on an industrial size example the efficiency gains and economies that could
be generated by solving the difficult problem of reshuffle minimization.
1. Introduction
a. The Stacking Problem
In the operation of a container port, many decisions have to be taken on a regular basis in order to run
the port as efficiently as possible. One of them involves deciding where exactly each incoming
container should be placed in the port’s storage area.
In order to keep the port’s storage area at a reasonable size, containers are typically stacked ones on
top of others, in piles. This gives rise to a problem that significantly impacts the port’s efficiency: it is
often necessary to access a container that has other containers already stacked on top of it. In such a
situation, a reshuffling, or shifting, takes place: in one or more unproductive moves, the containers
on top of the one needed are unstacked and moved elsewhere, so that the target container becomes
accessible. Needless to say, these unproductive moves degrade the port’s overall efficiency, as they
take time and require resources that may be needed elsewhere.
Ideally, the containers would be stacked in such a way that each time a container is needed it is the
top one in its pile. However, it turns out that it is extremely difficult to decide at the time of arrival of
each container which pile is the one that would ultimately yield that ideal situation. In fact, there
currently appears to be no fully satisfying computational approach to the problem, especially when
the number of containers is large. Consequently, useless reshuffling/shifting of containers regularly
occurs. However, it is possible to minimize their number by optimizing the stacking.
b. The Proposed Technique
Optimal Design is a software development company specializing since two decades in optimization of
extremely difficult problems. In particular, it exploits in its various software products the Grouping
Genetic Algorithm (GGA), a powerful optimization technique invented by the founder of the company.
It turns out that the GGA applies quite well to the Container Stacking problem, and Optimal Design has
built prototype software to demonstrate the Proof of Concept, which shows a great potential of the
technique.

© Optimal Design January 2018 2 of 10
2. The OptiStack Software
a. Entities Taken into Account
In order to demonstrate the applicability of the GGA to the Stacking Problem, OptiStack takes into
account the following:
A list of available places (the piles) to place/stack the containers, each with a maximum
capacity not to be exceeded at any time, representing the storage area
A number of containers already present in the piles, representing the situation of a port in use
A list of incoming containers to store in the storage area, with their arrival time
For each of both the incoming and initially present containers, their expected leave time
The arrival and leave times are arbitrary – in particular, several containers may arrive/leave
each after the other.
b. The Simulations and the Decisions to take
Given the above data, OptiStack performs a number of Simulations of the containers coming in and
leaving the storage area, according to the arrival and leave time of the containers. In each Simulation,
the time spans from the initial contents of the storage area, up to the time where all containers leave,
and:
Each time a container arrives, the Decision must be taken as to where (into which pile) it
should be placed, with pile capacity never exceeded
Each time a container leaves (be it one present in the beginning, or one previously arrived), as
many unproductive moves (reshuffles/shifts) are counted as there are containers above the
one leaving in its pile (this may – and ideally should – be zero), the count being a penalty on
the quality of the solution
In each of the Simulations, OptiStack uses its optimizing algorithm to make the best possible
Decisions, i.e. ones that lead to the lowest penalty at the end of the Simulation
Over the course of a number of Simulations, OptiStack’s algorithm refines its strategy of
placing the incoming containers in the piles, so that the total penalty be is as small as possible
– yielding the optimization of the Stacking process
At the end of the optimization run, the best way of placing the incoming containers, i.e. the
sequence of Decisions yielding the minimal total amount of shuffling/shifting, is retained as
the solution to the problem of where exactly each of the incoming containers should be
placed.
c. The Performance
i. The Criteria, Test Setup and Initial Conditions
One obvious criterion of the above process is that it should be very fast, so that the Decisions identified
by the optimization can be practically applied in the time still available after the optimization. The
other criterion is that the solution should be of very high quality: the penalty, i.e. number of
reshuffles/shifts, should be very low.
© Optimal Design January 2018 3 of 10
In order to demonstrate the Proof of Concept that, indeed, the above criteria are met by OptiStack, a
synthetic dataset was constructed as follows:
10 container placements, each with a capacity of 10 – i.e. 10 piles up to 10 containers high
48 containers of initial containers, randomly distributed across the piles
100 incoming containers, for each the Decision must be taken as to where to place it
Consequently, 148 containers leaving, since the storage is emptied at the end of each
Simulation
Arrival and leave times randomly distributed
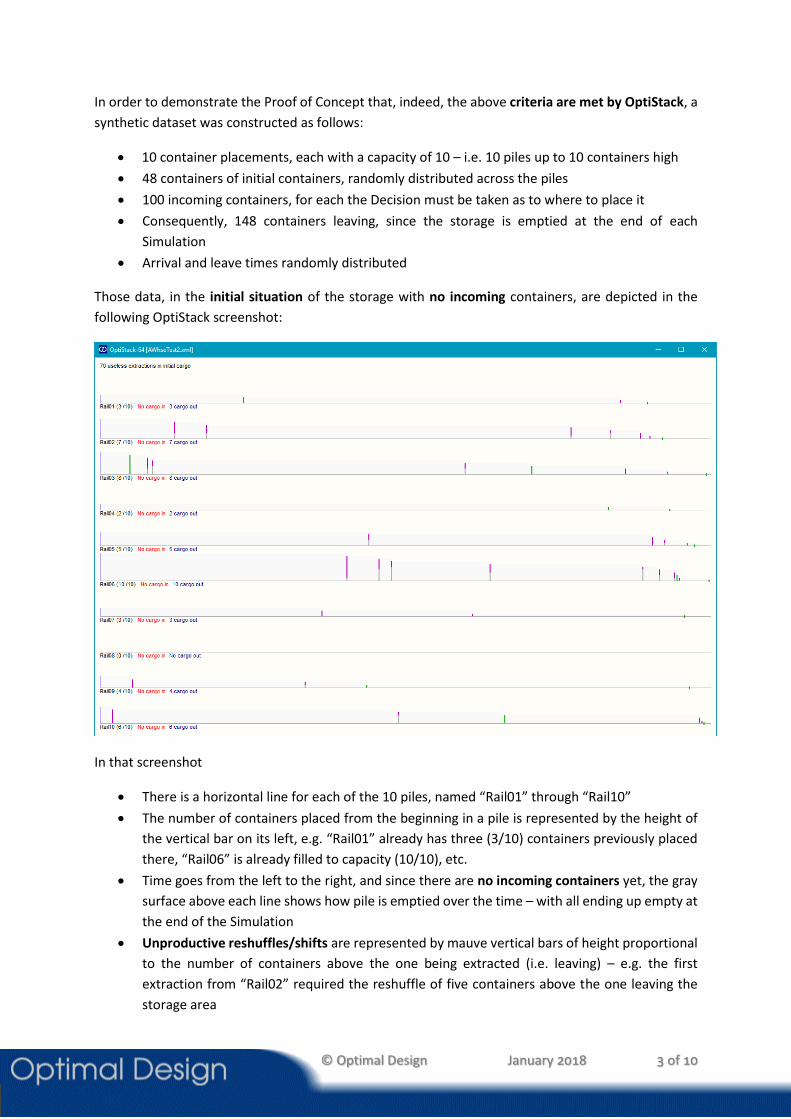
Those data, in the initial situation of the storage with no incoming containers, are depicted in the
following OptiStack screenshot:
In that screenshot
There is a horizontal line for each of the 10 piles, named “Rail01” through “Rail10”
The number of containers placed from the beginning in a pile is represented by the height of
the vertical bar on its left, e.g. “Rail01” already has three (3/10) containers previously placed
there, “Rail06” is already filled to capacity (10/10), etc.
Time goes from the left to the right, and since there are no incoming containers yet, the gray
surface above each line shows how pile is emptied over the time – with all ending up empty at
the end of the Simulation
Unproductive reshuffles/shifts are represented by mauve vertical bars of height proportional
to the number of containers above the one being extracted (i.e. leaving) – e.g. the first
extraction from “Rail02” required the reshuffle of five containers above the one leaving the
storage area

© Optimal Design January 2018 4 of 10
As specified above, the leave times for these initial containers were set at random, which
explains the very high number of reshuffles/shifts (and mauve color): as given in the top left
of the screenshot, 70 useless extractions for just 48 containers! This is a result of random
stacking.
With incoming containers, various strategies can be applied to place them as smartly as possible – and
obviously, OptiStack’s objective is to place them in the best possible way. The results of three approa-
ches to do the placement were collected with the above setup, as follows.
ii. A Random Result
Applying the “strategy” of placing each incoming container onto a randomly selected pile where it
would not exceed its capacity, the following result was obtained:
Compared to the previous screenshot, there are many more vertical bars: they represent the additional
moves of containers entering and leaving the storage area. In particular:
The gray area above the lines goes up each time a container is stacked up onto a pile
Each time an incoming container (not an initially present one) is extracted from the top of the
pile during the Simulation, a thick bright green bar represents the number of other containers
beneath it – illustrating a successful placement of that container at the time of its arrival
Each time an incoming container (not an initially present one) is extracted with a
reshuffle/shift needed to access it, a thick bright red bar represents the number of containers
above it that needed to be extracted just to be able to access it – representing a bad placement
of that container at the time of its arrival
The amount of bright-green versus bright red in the screenshot visually illustrates the perfor-
mance of the stacking strategy in use – so it’s no wonder that there is so much red there, given

© Optimal Design January 2018 5 of 10
the trivial “strategy” of random placement: as given in top left, there are 327 reshuffles/shifts
in that solution.
iii. A Reasonably Good Heuristic’s Result
Applying a reasonably good heuristic to place the incoming containers, the following was obtained:
There is now significantly less bright red (and more bright green) in the screenshot, meaning quite
fewer useless reshuffles/shifts of the containers in the Simulation. Indeed, only 191 useless extractions
happen in that Simulation, compared to the 327 obtained with a random placement of incoming
containers.
While performing reasonably well with regard to the number of useless container moves, the heuristic
nevertheless remains extremely fast: just 2.5 seconds were needed to obtain the above solution.
© Optimal Design January 2018 6 of 10
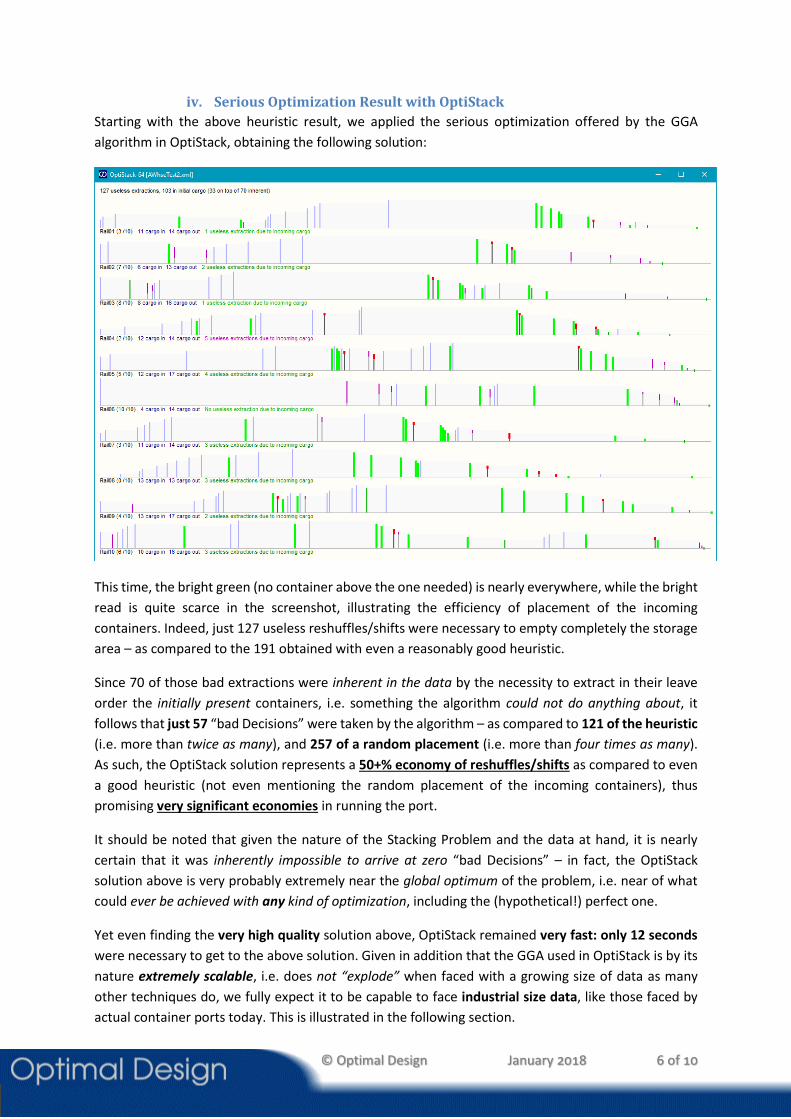
iv. Serious Optimization Result with OptiStack
Starting with the above heuristic result, we applied the serious optimization offered by the GGA
algorithm in OptiStack, obtaining the following solution:
This time, the bright green (no container above the one needed) is nearly everywhere, while the bright
read is quite scarce in the screenshot, illustrating the efficiency of placement of the incoming
containers. Indeed, just 127 useless reshuffles/shifts were necessary to empty completely the storage
area – as compared to the 191 obtained with even a reasonably good heuristic.
Since 70 of those bad extractions were inherent in the data by the necessity to extract in their leave
order the initially present containers, i.e. something the algorithm could not do anything about, it
follows that just 57 “bad Decisions” were taken by the algorithm – as compared to 121 of the heuristic
(i.e. more than twice as many), and 257 of a random placement (i.e. more than four times as many).
As such, the OptiStack solution represents a 50+% economy of reshuffles/shifts as compared to even
a good heuristic (not even mentioning the random placement of the incoming containers), thus
promising very significant economies in running the port.
It should be noted that given the nature of the Stacking Problem and the data at hand, it is nearly
certain that it was inherently impossible to arrive at zero “bad Decisions” – in fact, the OptiStack
solution above is very probably extremely near the global optimum of the problem, i.e. near of what
could ever be achieved with any kind of optimization, including the (hypothetical!) perfect one.
Yet even finding the very high quality solution above, OptiStack remained very fast: only 12 seconds
were necessary to get to the above solution. Given in addition that the GGA used in OptiStack is by its
nature extremely scalable, i.e. does not “explode” when faced with a growing size of data as many
other techniques do, we fully expect it to be capable to face industrial size data, like those faced by
actual container ports today. This is illustrated in the following section.
© Optimal Design January 2018 7 of 10
3. Industrial Size Example
a. The Sizing
The above example in Section 2 is mostly didactic - but OptiStack can handle industrial size problems,
faced in particular by container ports. To illustrate this, we have generated a synthetic example in the
same way as above, but much larger – namely:
600 piles (or “stacks”), i.e. places where containers can be stacked to away departure from the
port’s yard
6000 containers involved in the simulation:
o 900 containers are present in the yard from the start, representing an ongoing port
operation
o 5100 containers are incoming into the yard
o All 6000 containers are outgoing, meaning that the simulation ends when the whole
yard is emptied.
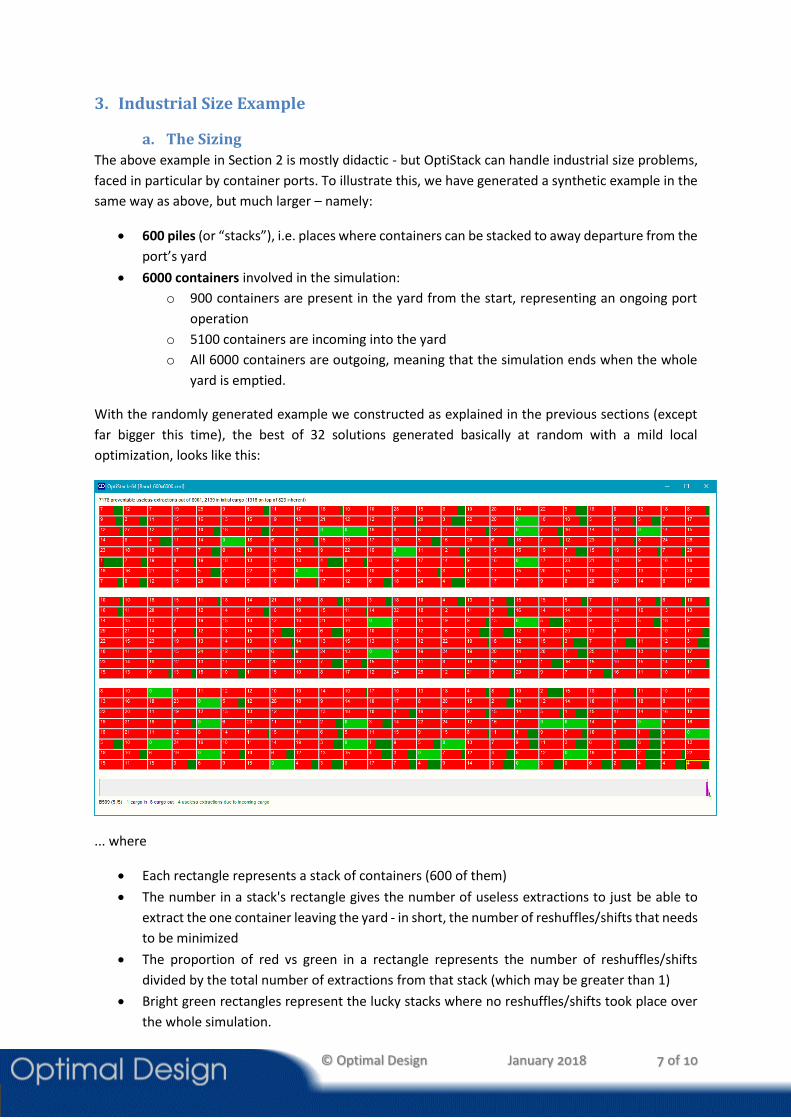
With the randomly generated example we constructed as explained in the previous sections (except
far bigger this time), the best of 32 solutions generated basically at random with a mild local
optimization, looks like this:
... where
Each rectangle represents a stack of containers (600 of them)
The number in a stack's rectangle gives the number of useless extractions to just be able to
extract the one container leaving the yard - in short, the number of reshuffles/shifts that needs
to be minimized
The proportion of red vs green in a rectangle represents the number of reshuffles/shifts
divided by the total number of extractions from that stack (which may be greater than 1)
Bright green rectangles represent the lucky stacks where no reshuffles/shifts took place over
the whole simulation.

© Optimal Design January 2018 8 of 10
In the initial solution above – which took less than half a second to generate – there are 7178 (top left
corner) preventable reshuffles/shifts (the "bad decisions") that could potentially have been avoided
with a smarter stacking strategy applied to incoming cargo - there is nothing that can be done with the
cargo that was badly placed right from the start (not in the current version of OptiStack).
Then the actual optimization - the Grouping Genetic Algorithm of ours(*) - is started... and the run is
in our opinion nothing short of spectacular:
After just one minute of running, OptiStack’s optimizer came up with the following:
... where the green already largely dominates the red. Indeed, the number of useless reshuffles/shifts,
i.e. the avoidable cost, was divided by more than six, yielding 83+% economy running the yard.
After two minutes, OptiStack produced the following solution:

© Optimal Design January 2018 9 of 10
... where the bright green largely dominates. Indeed, the avoidable reshuffles/shifts are now just 131,
i.e. they have been divided by more than 54, yielding 98+% economy running the yard.
And in less than three minutes (2'42" actually), and honestly much to our own surprise, all avoidable
losses were eliminated, yielding a globally optimal stacking strategy:
We have to admit that this result really amazed us. So much so that we have recorded it in real time
– the recording can be found on Optimal Design’s OptiStack product web page.

© Optimal Design January 2018 10 of 10
4. Conclusions and Next Steps Given the above, we are convinced we devised a novel way of addressing a problem – the minimization
of reshuffling/shifting of containers – that causes container ports very significant losses in efficiency
when not properly addressed. In other words, we have identified a way of generating very significant
economies in said ports, by applying the technology in OptiStack.
On top of the quality of its solutions, the approach embodied in OptiStack also has the all-important
advantage of being extremely fast, making it possible to solve one of the major problems in port
management, namely immediately reacting to new information constantly flowing in: every time a
ship (or train or truck) is about to arrive with cargo, OptiStack is able to compute the best strategy
where to best place the incoming containers, based on data (in particular estimated departure data)
that came in just minutes ago.
We believe the above firmly establishes the applicability of the technology to real-world container
ports, and are keen to work with port management specialists to make it available to industrial users
to improve their operations.
Get more info on Optimal Design’s OptiStack product webpage.
(*) Reference book to the underlying OptiStack technology: Genetic Algorithms and Grouping
Problems by Falkenauer, Emanuel (1998) or simply search for "Falkenauer" on Amazon.


