UNITED STATES SECURITIES AND EXCHANGE COMMISSION Washington, D.C. 20549 FORM 8-K CURRENT REPORT Pursuant to Section 13 OR 15(d) of The Securities Exchange Act of 1934 Date of Report (Date of earliest event reported): April 22, 2020 Freeport-McMoRan Inc. (Exact name of registrant as specified in its charter) Delaware 001-11307-01 74-2480931 (State or other jurisdiction of incorporation) (Commission File Number) (IRS Employer Identification No.) 333 North Central Avenue Phoenix AZ 85004 (Address of principal executive offices) (Zip Code) Registrant's telephone number, including area code: (602) 366-8100 Check the appropriate box below if the Form 8-K filing is intended to simultaneously satisfy the filing obligation of the registrant under any of the following provisions (see General Instruction A.2. below): ☐ Written communications pursuant to Rule 425 under the Securities Act (17 CFR 230.425) ☐ Soliciting material pursuant to Rule 14a-12 under the Exchange Act (17 CFR 240.14a-12) ☐ Pre-commencement communications pursuant to Rule 14d-2(b) under the Exchange Act (17 CFR 240.14d-2(b)) ☐ Pre-commencement communications pursuant to Rule 13e-4(c) under the Exchange Act (17 CFR 240.13e-4(c)) Securities registered pursuant to Section 12(b) of the Act: Title of each class Trading Symbol(s) Name of each exchange on which registered Common Stock, par value $0.10 per share FCX The New York Stock Exchange Indicate by check mark whether the registrant is an emerging growth company as defined in Rule 405 of the Securities Act of 1933 (§230.405) or Rule 12b-2 of the Securities Exchange Act of 1934 (§240.12b-2). Emerging growth company ☐ If an emerging growth company, indicate by check mark if the registrant has elected not to use the extended transition period for complying with any new or revised financial accounting standards provided pursuant to Section 13(a) of the Exchange Act. ☐
Transcript
UNITED STATESSECURITIES AND EXCHANGE COMMISSION
Washington, D.C. 20549
FORM 8-KCURRENT REPORT
Pursuant to Section 13 OR 15(d) of The Securities Exchange Act of 1934
Date of Report (Date of earliest event reported): April 22, 2020
Freeport-McMoRan Inc.(Exact name of registrant as specified in its charter)
Delaware 001-11307-01 74-2480931(State or other jurisdiction
of incorporation)(Commission File Number)
(IRS EmployerIdentification No.)
333 North Central Avenue Phoenix AZ 85004
(Address of principal executive offices) (Zip Code)
Registrant's telephone number, including area code: (602) 366-8100
Check the appropriate box below if the Form 8-K filing is intended to simultaneously satisfy the filing obligation of the registrant under any of the following provisions (see General Instruction A.2. below):
☐ Written communications pursuant to Rule 425 under the Securities Act (17 CFR 230.425)
☐ Soliciting material pursuant to Rule 14a-12 under the Exchange Act (17 CFR 240.14a-12)
☐ Pre-commencement communications pursuant to Rule 14d-2(b) under the Exchange Act (17 CFR 240.14d-2(b))
☐ Pre-commencement communications pursuant to Rule 13e-4(c) under the Exchange Act (17 CFR 240.13e-4(c))
Securities registered pursuant to Section 12(b) of the Act:
Title of each class Trading Symbol(s) Name of each exchange on which registered
Common Stock, par value $0.10 per share FCX The New York Stock Exchange
Indicate by check mark whether the registrant is an emerging growth company as defined in Rule 405 of the Securities Act of 1933 (§230.405) or Rule 12b-2 of the Securities Exchange Act of 1934 (§240.12b-2).
Emerging growth company ☐
If an emerging growth company, indicate by check mark if the registrant has elected not to use the extended transition period for complying with any new or revised financial accounting standards provided pursuant to Section 13(a) of the Exchange Act. ☐
Item 2.02. Results of Operations and Financial Condition.
Freeport-McMoRan Inc. ("FCX") issued a press release dated April 24, 2020, announcing its revised operating plans in response to the COVID-19 pandemic and reporting its first-quarter 2020 financial and operating results. A copy of thepress release is furnished hereto as Exhibit 99.1.
Item 5.02. Departure of Directors or Certain Officers; Election of Directors; Appointment of Certain Officers; Compensatory Arrangements of Certain Officers.
On April 22, 2020, and in support of the company’s efforts to reduce costs and conserve cash during the current period of uncertainty resulting from low copper prices and the economic downturn in connection with the COVID-19pandemic, senior management recommended and the Compensation Committee of the Board of Directors of FCX approved a 25% reduction in the base salary of Richard C. Adkerson, the President and Chief Executive Officer, andKathleen L. Quirk, the Executive Vice President and Chief Financial Officer (each an “Executive”), effective May 1, 2020 through the remainder of 2020. In addition, each Executive agreed that only 10% of the reduced base salary will bepaid in cash to cover benefit premiums and other scheduled payroll deductions, with the remainder paid in an award of restricted stock units that will vest on December 31, 2020. Ms. Quirk and FCX have agreed that these changes will nottrigger or otherwise modify any rights under her employment agreement. Mr. Adkerson does not have an employment agreement.
Item 7.01. Regulation FD Disclosure.
The slides to be presented in connection with FCX’s previously announced conference call being webcast on the internet at 10:00 a.m. Eastern Time on April 24, 2020, to discuss FCX's revised operating plans and first-quarter 2020results are furnished hereto as Exhibit 99.2.
The information furnished pursuant to Item 2.02 and Item 7.01 shall not be deemed “filed” for purposes of Section 18 of the Securities Exchange Act of 1934, as amended (the “Exchange Act”), or otherwise subject to the liabilities of thatsection, nor shall it be deemed incorporated by reference in any filing under the Securities Act of 1933, as amended, or the Exchange Act, regardless of any general incorporation language in such filing.
Item 9.01. Financial Statements and Exhibits.
(d) Exhibits.
Exhibit Number Exhibit Title99.1 Press release dated April 24, 2020, titled “Freeport-McMoRan Announces Revised
Operating Plans in Response to the COVID-19 Pandemic and Reports First-Quarter 2020 Results."
99.2 Slides dated April 24, 2020, titled "FCX Conference Call to Discuss Revised Operating Plans in Response to COVID-19 Pandemic and First-Quarter 2020 Results."
104 The cover page from this Current Report on Form 8-K, formatted in Inline XBRL.
SIGNATURE
Pursuant to the requirements of the Securities Exchange Act of 1934, the registrant has duly caused this report to be signed on its behalf by the undersigned hereunto duly authorized.
FREEPORT-McMoRan INC.
By: /s/ C. Donald Whitmire, Jr.----------------------------------------
C. Donald Whitmire, Jr.Vice President and Controller -Financial Reporting (authorized signatory andPrincipal Accounting Officer)
Date: April 24, 2020
Freeport-McMoRan Announces RevisedOperating Plans in Response to the COVID-19 Pandemic and
Reports First-Quarter 2020 Results
Highlights of Revised Operating Plans:• $1.3 billion reduction (~18 percent) in 2020 estimated operating costs• $800 million reduction (~30 percent) in 2020 estimated capital expenditures• $100 million reduction (~20 percent) in 2020 estimated exploration and administrative costs• ~400 million pound reduction (~15 percent) in the Americas 2020 estimated copper sales volumes• Actions enhance outlook for cash generation and maintenance of strong liquidity at low prices
PHOENIX, AZ, April 24, 2020 - Freeport-McMoRan Inc. (NYSE: FCX) announced today its first-quarter 2020 financial results and revised operating plans in response to the global COVID-19 pandemic and resulting negative impact on theglobal economy.
FCX’s revised operating plans are designed to protect the health and well-being of its employees, their families and communities where they live, ensure safe and reliable operations to serve customers, and protect the company’sstrong liquidity position through reductions in costs and capital spending while preserving the long-term value of the company’s assets.
Prioritizing Health and Safety. FCX has proactively implemented operating protocols at each of its operating sites to contain and mitigate the risk of spread of COVID-19. A series of actions have been implemented, including, but notlimited to, physical distancing, travel restrictions, sanitizing, and frequent health screening and monitoring. FCX is also incorporating testing procedures administered by medical providers at many of its facilities. In April 2020, FCXsuspended operations at its Chino copper mine in New Mexico because of the spread of COVID-19 among a limited number of employees. FCX’s protocols have been effective in mitigating and preventing a major outbreak of COVID-19at its operating sites. As the COVID-19 pandemic and related effects continue to evolve rapidly worldwide, FCX will continue to monitor, assess and update its COVID-19 related response, as needed.
FCX is also working closely with communities where it operates across the globe and has provided monetary support and in-kind contributions of medical supplies and food.
Richard C. Adkerson, President and Chief Executive Officer, said, "Our global team is demonstrating an effective response to protect the health of our workforce, provide for business continuity, and support ourcommunities during this unprecedented challenge. The prudent steps we are taking to safeguard our business, address costs and capital spending, and preserve our strong liquidity position are necessary to protect long-term asset values in the current weak and uncertain economic environment and to position us to ramp up and resume normal operations safely and quickly as health and economic conditions improve. Our team hassubstantial experience in successfully executing under volatile market conditions. I am confident that we will overcome the current challenges and 'prove our mettle' as we have effectively done in previous periods ofeconomic weakness. We continue to achieve important progress in establishing large-scale, low-cost copper and gold production from our underground ore bodies at Grasberg and advance initiatives in the Americas toposition FCX for significant increases in cash flows in 2021 and beyond.”
1
Revised Operating Plans. FCX has assessed its near-term operating plans with a focus on maximizing cash flow and protecting liquidity in a weak and uncertain economic environment and to preserve asset values foranticipated improved copper prices as economic conditions recover. A series of actions are being implemented to significantly reduce all elements of costs and capital spending and adjust mine plans and correspondingmining and milling rates to maximize cash flow at lower prices. The plans also incorporate the impact of lower input costs, principally energy and foreign exchange rates, and higher gold prices.
SUMMARY CONSOLIDATED OPERATING AND FINANCIAL DATA — REVISED OPERATING PLANS FOR 2020Following are consolidated operating and financial data for 2020, including a comparison of April 2020 estimates to the estimates reported in January 2020:
April 2020Estimates January 2020 Estimates
(Based on $2.30 per pound of copper) (Based on $2.85 per pound of copper)
First-quarter 2020 (Actual) Remainder of 2020 Total2020
Total2020
Total PercentChange
CONSOLIDATED OPERATING DATA Sales, excluding purchases
Copper (billions of recoverable pounds) 0.7 2.4 3.1 3.5 (11)%Gold (thousands of recoverable ounces) 144 636 780 775 1%Molybdenum (millions of recoverable pounds) 21 59 80 88 (9)%
Unit net cash costs per pounda $ 1.90 b $ 1.44 $ 1.55 c,d $ 1.75 c (12)% CONSOLIDATED FINANCIAL DATA (in billions) Operating cash flows $ (0.0) $ 1.8 $ 1.8 c,d $ 2.4 c (25)%
Capital expenditurese $ 0.6 $ 1.4 $ 2.0 $ 2.8 (29)%Operating cash flows less capital expenditures $ (0.6) $ 0.4 $ (0.2) $ (0.4) 50%Cash and cash equivalents $ 1.6 N/A $ 1.7 $ 1.1 55%Total debt, including current portion $ 10.1 N/A $ 9.7 $ 9.9 f (2)%
a. Reflects per pound weighted-average unit net cash costs (net of by-product credits) for all copper mines, before net noncash and other costs.b. For reconciliations of per pound unit costs by operating division to production and delivery costs applicable to sales reported in FCX's consolidated financial statements, refer to the supplemental schedules, "Product Revenues and Production Costs,"
beginning on page X.c. April 2020 estimates assume average prices of $1,600 per ounce of gold and $9.00 per pound of molybdenum for the remainder of 2020. The January 2020 estimates were based on average prices of $1,500 per ounce of gold and $10.00 per pound of
molybdenum for the year 2020.d. Refer to the first-quarter 2020 conference call slides which are available on FCX's website, "fcx.com," for the impact of price changes for the remainder of 2020 on consolidated unit net cash costs and operating cash flows.e. Excludes capital expenditures for the development of the new smelter in Indonesia (see page 6).f. The January 2020 estimates included $0.5 billion in debt associated with the new smelter for PT Freeport Indonesia (PT-FI).
MINING OPERATIONS
FCX’s revised operating plans and estimates reflect current assumptions, and FCX will continue to closely monitor health and market conditions and make further adjustments to its mine plans as required.
Productivity and Innovation Initiatives. During 2019, FCX advanced initiatives in its North America and South America operations to enhance productivity through the use of new technologies, data science and a more interactive, multi-disciplined operating structure. Capital projects associated with this initiative, which were expected to total $150 million for the year 2020, and were projected to add approximately 200 million pounds of copper per year beginning in 2022,have been suspended in response to current market conditions and capital preservation initiatives. Under current market conditions, FCX’s data analytics tools will be utilized to drive cost performance,
2
improve recoveries and other initiatives that do not require significant investment. FCX’s learnings and capabilities in this area are expected to generate value under a broad range of market conditions.
North America Copper Mines. FCX operates seven open-pit copper mines in North America - Morenci, Bagdad, Safford, Sierrita and Miami in Arizona, and Chino and Tyrone in New Mexico. In addition to copper, certain of these minesproduce molybdenum concentrate, gold and silver. FCX is also nearing completion of a development project in eastern Arizona to commence production from the Lone Star leachable ores during the second half of 2020. All of the NorthAmerica mining operations are wholly owned, except for Morenci. FCX records its 72 percent undivided joint venture interest in Morenci using the proportionate consolidation method.
Revised Operating Plans. FCX has completed a review of mine plans at each of its operating sites in North America to target a lower cost mining configuration, defer all nonessential projects and preserve long-term value in thelong-lived resources. Under the revised plans, mining and milling rates for the year 2020 have been reduced by approximately 20 percent, resulting in a projected 12 percent decline in North America copper sales for the year 2020(compared to the January 2020 estimate), lower unit net cash costs and lower capital spending requirements.
The plans take into account the impact of currently suspended operations at the Chino mine. FCX is currently assessing options and future timing of restart of the Chino mine, which will take into account health and marketconditions. FCX has also deferred approximately $0.3 billion in capital projects from 2020 to future periods for the North America copper mines.
Following extensive review, FCX has elected to complete the initial phase of the Lone Star copper leach project with a remaining investment of approximately $100 million in 2020. The decision was supported by the advancedstage of the project (approximately 90 percent complete), expected quick return of the remaining investment and long-term value of the resource. First production is expected during the second half of 2020. Initial production from the LoneStar copper leach project following a ramp-up period is expected to average approximately 200 million pounds of copper per year, with the potential for future expansion options.
In April 2020, FCX entered into forward sales contracts for 150 million pounds of copper for settlement in May and June of 2020. The forward sales provide for fixed pricing of $2.34 per pound of copper on approximately 60percent of North America's projected sales volumes for May and June 2020.
Operating Data. Following is selected summary consolidated operating data for the North America copper mines for 2020, including a comparison of April 2020 estimates to the estimates reported in January 2020:
Unit net cash costs per pound of copper $ 2.04 a $ 1.67 $ 1.77 b $ 1.93 b (8)%
a. For a reconciliation of unit net cash costs per pound to production and delivery costs applicable to sales reported in FCX's consolidated financial statements, refer to the supplemental schedules, "Product Revenues and Production Costs," beginning onpage X.
b. Based on achievement of current sales volume and cost estimates, and assuming an average molybdenum price of $9.00 per pound for the remainder of 2020. The impact of price changes during the remainder of 2020 on North America's average unitnet cash costs for the year 2020 would approximate $0.03 per pound for each $2 per pound change in the average price of molybdenum. The January 2020 estimates were based on an average price of $10.00 per pound of molybdenum for the year2020.
3
South America Mining. FCX operates two copper mines in South America - Cerro Verde in Peru (in which FCX owns a 53.56 percent interest) and El Abra in Chile (in which FCX owns a 51 percent interest). These operations areconsolidated in FCX's financial statements. In addition to copper, the Cerro Verde mine produces molybdenum concentrate and silver.
Revised Operating Plans. As previously reported, in mid-March 2020, the Peruvian government issued a Supreme Decree and declaration of a National Emergency in its efforts to contain the outbreak of COVID-19, andsubsequently extended this order through May 10, 2020. To comply with the government’s requirements, Cerro Verde temporarily transitioned to a care and maintenance status and has adjusted its operations to prioritize critical activities.Cerro Verde has also completed construction of temporary onsite facilities and enhanced protocols to enable critical operations to be maintained in compliance with the Peruvian government order. From April 1, 2020, to April 23, 2020,Cerro Verde has operated at approximately one-third of planned rates. The Peruvian government could extend the declaration of a national emergency beyond May 10, 2020.
Cerro Verde continues to review health guidelines with Peruvian government authorities to position Cerro Verde for a return to normal operations as soon as possible.
Cerro Verde’s revised 2020 plans reflect limited operations during second-quarter 2020 and increased mining and milling rates in the second half of the year. Subject to the timing of Peruvian government approvals associated withthe global pandemic, milling rates are currently expected to average approximately 400,000 metric tons per day in the second half of 2020. Cerro Verde’s mine plans have been revised to target a lower cost mining configuration, defer allnonessential projects and preserve long-term value in the long-lived resource. Compared with January 2020 estimates, mining and milling rates have been reduced by 13 percent (including the impact of the Peruvian government orderand mine plan optimization in the second half of 2020), resulting in a decline in projected copper sales of approximately 130 million pounds (13 percent) in 2020. The revised mine plans also include significant reductions in capitalspending and operating costs.
Operating plans at El Abra have also been revised to incorporate lower mining rates, operating costs and capital spending.
FCX has deferred approximately $0.2 billion in capital projects for South America mining from 2020 to future periods.
Operating Data. Following is summary consolidated operating data for South America mining for 2020, including a comparison of April 2020 estimates to the estimates reported in January 2020:
April 2020Estimates January 2020 Estimates
First-quarter 2020
(Actual) Remainder of 2020 Total2020
Total2020
Total PercentChange
Copper sales (millions of recoverable pounds) 247 705 952 1,150 (17)% Unit net cash costs per pound of copper $ 2.00 a $ 1.89 $ 1.92 b $ 1.95 b (2)%
a. For a reconciliation of unit net cash costs per pound to production and delivery costs applicable to sales reported in FCX's consolidated financial statements, refer to the supplemental schedules, "Product Revenues and Production Costs," beginning onpage X.
b. Based on achievement of current sales volume and cost estimates, and assuming an average price of $9.00 per pound of molybdenum for the remainder of 2020. The January 2020 estimates were based on an average price of $10.00 per pound ofmolybdenum for the year 2020.
Projected sales volumes and average unit net cash costs for the South America operations are dependent on government approvals for Cerro Verde to return to full operations during the second half of 2020.
4
Indonesia Mining. PT-FI assets include one of the world’s largest copper and gold deposits at the Grasberg minerals district in Papua, Indonesia. PT-FI produces copper concentrate that contains significant quantities of gold and silver.FCX has a 48.76 percent ownership interest in PT-FI and manages its mining operations. Under the terms of the shareholders agreement, FCX’s economic interest in PT-FI approximates 81 percent through 2022. PT-FI's results areconsolidated in FCX's financial statements.
Revised Operating Plans and Development Activities. PT-FI has implemented a series of actions to prevent a spread of COVID-19 at its remote operating site in Papua. PT-FI has been successful in maintaining the health of itsworkforce while continuing to make important progress in increasing production from its underground ore bodies.
During first-quarter 2020, PT-FI achieved additional progress in increasing mining rates by adding a total of 49 new drawbells at the Deep Mill Level Zone (DMLZ) and Grasberg Block Cave underground mines to buildscale. Combined average daily production from the DMLZ and Grasberg Block Cave underground mines averaged approximately 37,500 metric tons of ore per day, slightly above forecast and 44 percent above the fourth-quarter 2019average. PT-FI remains on track to continue to ramp-up production rates and expects 2021 production of 1.4 billion pounds of copper (more than 75 percent above the current April 2020 estimate) and 1.4 million ounces of gold (70 percentabove the current April 2020 estimate).
The successful completion of this ramp up is expected to enable PT-FI to generate average annual production for the next several years of 1.55 billion pounds of copper and 1.6 million ounces of gold at an average unit net cashcost of approximately $0.20 per pound.
PT-FI’s revised plans incorporate benefits of reduced input costs for energy, foreign exchange and recent increases in gold prices. PT-FI has also deferred approximately $0.2 billion in capital projects from 2020 to future periods,primarily related to a delay in construction and installation of an additional milling circuit from 2022 to 2023, mostly reflecting limitations on work schedules and travel by international contractors during COVID-19 mitigation measures.
PT-FI's estimated annual capital spending on underground mine development projects is expected to average $0.8 billion per year for the three-year period 2020 through 2022, net of scheduled contributions from PT IndonesiaAsahan Aluminium (Persero) (PT Inalum). In accordance with applicable accounting guidance, aggregate costs (before scheduled contributions from PT Inalum), which are expected to average $1.0 billion per year for the three-year period2020 through 2022, will be reflected as an investing activity in FCX's cash flow statement, and contributions from PT Inalum will be reflected as a financing activity.
Operating Data. Following is summary consolidated operating data for Indonesia Mining for 2020, including a comparison of April 2020 estimates to the estimates reported in January 2020:
April 2020Estimates January 2020 Estimates
First-quarter 2020
(Actual) Remainder of 2020 Total2020
Total2020
Total PercentChange
Copper sales (millions of recoverable pounds) 127 615 742 750 (1)%Gold sales (thousands of recoverable ounces) 139 636 775 775 —%Unit net cash costs per pound of copper $ 1.31 a $ 0.51 $ 0.65 b $ 1.04 b (37)%
a. For a reconciliation of unit net cash costs per pound to production and delivery costs applicable to sales reported in FCX's consolidated financial statements, refer to the supplemental schedules, "Product Revenues and Production Costs," beginning onpage X.
b. Based on achievement of current sales volume and cost estimates, and assuming an average gold price of $1,600 per ounce for the remainder of 2020. The impact of price changes during the remainder of 2020 on PT-FI's average unit net cash costsfor the year 2020 would approximate $0.05 per pound for each $50 per ounce change in the average price of gold. The January 2020 estimates were based on an average price of $1,500 per ounce of gold for the year 2020.
PT-FI's projected sales volumes and unit net cash costs for the year 2020 are dependent on a number of factors, including operational performance and timing of shipments. PT-FI has received a one-year extension of its exportlicense through March 15, 2021.
5
Indonesian Smelter. As a result of disruptions to work and travel schedules of international contractors and current limitations on access to the proposed physical site in Gresik, Indonesia associated with COVID-19 mitigationmeasures, PT-FI has notified the Indonesian government of delays in achieving the completion timeline of December 2023. PT-FI is currently discussing with the Indonesian government a deferred schedule for the project as well as otheralternatives in light of COVID-19 and global economic conditions.
Molybdenum Mines. FCX has two wholly owned molybdenum mines in Colorado - the Henderson underground mine and the Climax open-pit mine. The Henderson and Climax mines produce high-purity, chemical-grade molybdenumconcentrate, which is typically further processed into value-added molybdenum chemical products. The majority of the molybdenum concentrate produced at the Henderson and Climax mines, as well as from FCX's North America andSouth America copper mines, is processed at FCX's conversion facilities.
Revised Operating Plans. In response to global market conditions, FCX intends to reduce production from the Climax open pit mine by approximately 50 percent for the remainder of 2020. The Climax mine produced 17 millionpounds of molybdenum in 2019. Revised operating plans for the molybdenum business also include reductions in operating costs, administrative and centralized support costs and capital spending.
EXPLORATION, CORPORATE ITEMS AND OTHERFCX’s revised operating plans prioritize existing mine operations and full resource potential of existing operations. Exploration expenditures are being reduced by approximately 60 percent in 2020 (from the January 2020 estimate
of $70 million to approximately $30 million) and activities will focus on analyzing and incorporating data from historical drilling programs. FCX has long-lived reserves and a significant resource position in its existing portfolio.
FCX is also implementing a series of actions to reduce administrative and centralized support costs in conjunction with its revised operating plans. Cost savings initiatives include a temporary reduction in certain employee benefits,the initiation of furloughs and employee separation programs and reductions in bonus programs, third party service costs, facilities costs, travel and other expenses.
As part of the cost savings initiatives, the Board of Directors (the Board) has approved a 25 percent reduction in the salary of each of FCX's Chief Executive Officer and Chief Financial Officer through the end of 2020. Each ofthese executives has also agreed to forgo substantially all their reduced cash salary for the remainder of 2020, which will be paid in an award of restricted stock units that will vest at the end of the year.
Selling, general and administrative expense for the remainder of 2020 is expected to be over 15 percent below the 2019 total of $414 million.
LIQUIDITYAt March 31, 2020, FCX had $5.1 billion in liquidity, comprised of $1.6 billion in consolidated cash and $3.5 billion of availability under its revolving credit facility maturing in 2024.
During first-quarter 2020, FCX completed the sale of $1.3 billion in new 8-year and 10-year senior notes at an average interest rate of 4.2 percent. The net proceeds were used to purchase a portion of the senior notes due 2021and 2022, and in early April 2020, to redeem the remainder of the senior notes due 2021. FCX has significant liquidity to manage volatility, and following the April 2020 redemption, no senior notes maturing until 2022.
The aggressive changes in FCX's operating plans are approximately $0.2 billion favorable to 2020 liquidity compared to the operating plans reported in late January 2020, measured on the basis of operating cash flows less capitalexpenditures, an 18 percent decline in estimated copper prices between the two operating plans (refer to Consolidated Financial Data on page 2). With successful execution of these revised operating plans, FCX expects operating cashflows to improve significantly in 2021 and future years with substantial cash flow above capital expenditures as economic conditions improve.
FINANCIAL POLICY
FCX's financial policy will continue to prioritize liquidity and balance sheet management during this period of global economic turmoil associated with the COVID-19 pandemic. The Board suspended the May 2020 quarterly cashdividend of $0.05 per share on FCX's common stock, and under current market and economic conditions, the Board does not expect to declare common stock dividends during 2020. The declaration and payment of future
6
dividends will be assessed on an ongoing basis, taking into account FCX’s financial results, cash requirements, future prospects, global economic conditions, and other factors deemed relevant by the Board.
FIRST-QUARTER 2020 RESULTSFCX reported a net loss attributable to common stock of $491 million ($0.34 per share) in first-quarter 2020. After adjusting for net charges of $256 million ($0.18 per share), primarily associated with inventory valuation
adjustments, adjusted net loss attributable to common stock totaled $235 million ($0.16 per share) in first-quarter 2020. For additional information, refer to the supplemental schedule, "Adjusted Net (Loss) Income," on page VI.
SUMMARY FINANCIAL DATA
Three Months Ended March 31, 2020 2019 (in millions, except per share amounts) Revenuesa,b $ 2,798 $ 3,792 Operating (loss) incomea $ (473) $ 321 Net (loss) income attributable to common stockc,d $ (491) $ 31 Diluted net (loss) income per share of common stock $ (0.34) $ 0.02 Diluted weighted-average common shares outstanding 1,452 1,457 Operating cash flowse $ (38) $ 534 Capital expenditures $ 610 $ 622 At March 31:
Cash and cash equivalents $ 1,602 $ 2,833 Total debt, including current portion $ 10,074 $ 9,905
a. For segment financial results, refer to the supplemental schedules, "Business Segments," beginning on page VIII.b. Includes (unfavorable) favorable adjustments to prior period provisionally priced concentrate and cathode copper sales totaling $(107) million ($(45) million to net loss attributable to common stock or $(0.03) per share) in first-quarter 2020 and $70 million
($29 million to net income attributable to common stock or $0.02 per share) in first-quarter 2019. For further discussion, refer to the supplemental schedule, "Derivative Instruments," on page VII.c. Includes net charges of $256 million ($0.18 per share) in first-quarter 2020 and $36 million ($0.03 per share) in first-quarter 2019 that are described in the supplemental schedule, "Adjusted Net (Loss) Income," on page VI.d. FCX defers recognizing profits on intercompany sales until final sales to third parties occur. For a summary of net impacts from changes in these deferrals, refer to the supplemental schedule, "Deferred Profits," on page VII.e. Working capital and other sources (uses) totaled $119 million in first-quarter 2020 and $(56) million in first-quarter 2019.
7
SUMMARY OPERATING DATA
Three Months Ended March 31, 2020 2019 Copper (millions of recoverable pounds)
Production 731 780 Sales, excluding purchases 729 784 Average realized price per pound $ 2.43 $ 2.90 Site production and delivery costs per pounda $ 2.19 $ 2.17 Unit net cash costs per pounda $ 1.90 $ 1.78
Gold (thousands of recoverable ounces) Production 156 166 Sales, excluding purchases 144 242 Average realized price per ounce $ 1,606 $ 1,291
Molybdenum (millions of recoverable pounds) Production 19 23 Sales, excluding purchases 21 22 Average realized price per pound $ 11.10 $ 12.69
a. Reflects per pound weighted-average production and delivery costs and unit net cash costs (net of by-product credits) for all copper mines, before net noncash and other costs. For reconciliations of per pound unit costs by operating division to productionand delivery costs applicable to sales reported in FCX's consolidated financial statements, refer to the supplemental schedules, "Product Revenues and Production Costs," beginning on page X.
Consolidated Sales VolumesFirst-quarter 2020 copper sales of 729 million pounds and gold sales of 144 thousand ounces were higher than January 2020 estimates of 725 million pounds of copper and 105 thousand ounces of gold, mostly reflecting higher
production from PT-FI, partly offset by lower sales volumes in North America and South America. First-quarter 2020 copper and gold sales volumes were lower than first-quarter 2019 sales volumes primarily reflecting anticipated lower millrates at PT-FI as it continues to ramp-up production from its underground ore bodies and lower mill and recovery rates at Cerro Verde, partly offset by higher mining rates in North America.
First-quarter 2020 molybdenum sales of 21 million pounds approximated both the January 2020 estimate and first-quarter 2019 sales of 22 million pounds.
Consolidated Unit Net Cash CostsConsolidated average unit net cash costs (net of by-product credits) for FCX's copper mines of $1.90 per pound of copper in first-quarter 2020, were lower than the January 2020 estimate of $2.02 per pound, primarily reflecting
higher gold sales volumes. Consolidated average unit net cash costs in first-quarter 2020 were higher than the first-quarter 2019 average of $1.78 per pound, primarily reflecting lower by-product credits and higher mining and milling costsin North America, partly offset by lower site production and delivery costs from PT-FI associated with the completion of mining the Grasberg open pit.
8
MINING OPERATIONSNorth America Copper Mines. Following is summary consolidated operating data for the North America copper mines:
Three Months Ended March 31, 2020 2019 Copper (millions of recoverable pounds)
Production 346 336 Sales, excluding purchases 355 320 Average realized price per pound $ 2.56 $ 2.85
Molybdenum (millions of recoverable pounds)
Productiona 8 7
Unit net cash costs per pound of copperb Site production and delivery, excluding adjustments $ 2.15 $ 2.06 By-product credits (0.22) (0.26) Treatment charges 0.11 0.11
Unit net cash costs $ 2.04 $ 1.91
a. Refer to summary operating data on page 8 for FCX's consolidated molybdenum sales, which includes sales of molybdenum produced at the North America copper mines.b. For a reconciliation of unit net cash costs per pound to production and delivery costs applicable to sales reported in FCX's consolidated financial statements, refer to the supplemental schedules, "Product Revenues and Production Costs," beginning on
page X.
North America's consolidated copper sales volumes of 355 million pounds in first-quarter 2020 were higher than first-quarter 2019 copper sales volumes of 320 million pounds, primarily reflecting higher mining rates. North Americacopper sales are estimated to approximate 1.4 billion pounds for the year of 2020, consistent with 2019.
Average unit net cash costs (net of by-product credits) for the North America copper mines of $2.04 per pound of copper in first-quarter 2020 were higher than first-quarter 2019 unit net cash costs of $1.91 per pound, primarilyreflecting higher mining and milling costs, partly offset by higher sales volumes.
South America Mining. Following is summary consolidated operating data for South America mining:
Three Months Ended March 31, 2020 2019 Copper (millions of recoverable pounds)
Production 245 299 Sales 247 290 Average realized price per pound $ 2.33 $ 2.93
Molybdenum (millions of recoverable pounds)
Productiona 4 8
Unit net cash costs per pound of copperb Site production and delivery, excluding adjustments $ 2.00 c $ 1.73 By-product credits (0.17) (0.34) Treatment charges 0.16 0.19 Royalty on metals 0.01 0.01
Unit net cash costs $ 2.00 $ 1.59
a. Refer to summary operating data on page 8 for FCX's consolidated molybdenum sales, which includes sales of molybdenum produced at Cerro Verde.
9
b. For a reconciliation of unit net cash costs per pound to production and delivery costs applicable to sales reported in FCX's consolidated financial statements, refer to the supplemental schedules, "Product Revenues and Production Costs," beginning onpage X.
c. Excludes COVID-19 related costs of $0.08 per pound of copper, primarily associated with idle facility costs at Cerro Verde as a result the Peruvian government's issuance of a Supreme Decree and declaration of a National Emergency in its efforts tocontain the outbreak of COVID-19 and contract cancellation costs at El Abra.
South America's consolidated copper sales volumes of 247 million pounds in first-quarter 2020 were lower than first-quarter 2019 copper sales volumes of 290 million pounds, primarily reflecting anticipated lower recovery ratesand lower mill rates associated with Cerro Verde's temporary transition to a care and maintenance status associated with the COVID-19 pandemic. Sales from South America mining are expected to approximate 1.0 billion pounds ofcopper for the year 2020, compared with 1.2 billion pounds of copper for the year 2019.
Average unit net cash costs (net of by-product credits) for South America mining of $2.00 per pound of copper in first-quarter 2020 were higher than unit net cash costs of $1.59 per pound in first-quarter 2019, primarily reflectinglower sales volumes and lower by-product credits.
Indonesia Mining. Following is summary consolidated operating data for Indonesia mining:
Three Months Ended March 31, 2020 2019 Copper (millions of recoverable pounds)
Production 140 145 Sales 127 174 Average realized price per pound $ 2.28 $ 2.92
Gold (thousands of recoverable ounces)
Production 152 162 Sales 139 235 Average realized price per ounce $ 1,606 $ 1,291
Unit net cash costs per pound of coppera Site production and delivery, excluding adjustments $ 2.68 $ 3.10 Gold and silver credits (1.85) (1.81) Treatment charges 0.30 0.29 Export duties 0.03 0.10 Royalty on metals 0.15 0.16
Unit net cash costs $ 1.31 $ 1.84
a. For a reconciliation of unit net cash costs per pound to production and delivery costs applicable to sales reported in FCX's consolidated financial statements, refer to the supplemental schedules, "Product Revenues and Production Costs," beginning on
page X.
PT-FI's consolidated sales of 127 million pounds of copper and 139 thousand ounces of gold in first-quarter 2020 were lower than first-quarter 2019 consolidated sales of 174 million pounds of copper and 235 thousand ounces ofgold, reflecting anticipated lower mill rates as PT-FI continues to ramp-up production from its underground ore bodies. Consolidated sales volumes from PT-FI are expected to approximate 742 million pounds of copper and 0.8 millionounces of gold in 2020, compared with 667 million pounds of copper and 1.0 million ounces of gold in 2019.
Because of the fixed nature of a large portion of PT-FI's costs, unit net cash costs can vary significantly from quarter to quarter depending on copper and gold volumes. PT-FI's unit net cash costs (including gold and silver credits)of $1.31 per pound of copper in first-quarter 2020, were lower than unit net cash costs of $1.84 per pound in first-quarter 2019, primarily reflecting lower site production and delivery costs associated with lower mining and milling rates.
10
Molybdenum Mines. Production from the Molybdenum mines totaled 7 million pounds of molybdenum in first-quarter 2020 and 8 million pounds in first-quarter 2019. Refer to summary operating data on page 8 for FCX's consolidatedmolybdenum sales and average realized prices, which includes sales of molybdenum produced at the Molybdenum mines and from FCX's North America and South America copper mines.
Average unit net cash costs for the Molybdenum mines of $10.03 per pound of molybdenum in first-quarter 2020 were higher than average unit net cash costs of $9.80 per pound in first-quarter 2019. Based on current salesvolume and cost estimates, average unit net cash costs for the Molybdenum mines are expected to approximate $10.60 per pound of molybdenum for the year 2020.
For a reconciliation of unit net cash costs per pound to production and delivery costs applicable to sales reported in FCX's consolidated financial statements, refer to the supplemental schedules, "Product Revenues and ProductionCosts," beginning on page X.
CASH FLOWS, CASH and DEBTOperating Cash Flows. Cash used in operating activities totaled $38 million (including $119 million of working capital and other sources) in first-quarter 2020. Based on current sales volume and cost estimates, and assuming
average prices of $2.30 per pound of copper, $1,600 per ounce of gold and $9.00 per pound of molybdenum for the remainder of 2020, FCX's consolidated operating cash flows are estimated to approximate $1.8 billion (including $0.8billion of working capital and other sources) for the year 2020.
Capital Expenditures. Capital expenditures totaled $0.6 billion in first-quarter 2020, including approximately $0.3 billion for major projects. Capital expenditures are expected to approximate $2.0 billion for the year 2020, including$1.3 billion for major projects primarily associated with underground development activities in the Grasberg minerals district and completion of the Lone Star copper leach project.
Cash. Following is a summary of the U.S. and international components of consolidated cash and cash equivalents available to the parent company, net of noncontrolling interests' share, taxes and other costs at March 31, 2020(in billions):
Cash at domestic companies $ 0.8 Cash at international operations 0.8
Total consolidated cash and cash equivalents 1.6 Noncontrolling interests' share (0.3)
Cash, net of noncontrolling interests' share $ 1.3 Withholding taxes — a
Net cash available $ 1.3
a. Rounds to less than $0.1 billion.
Debt. Following is a summary of total debt and the weighted-average interest rates at March 31, 2020 (in millions, except percentages).
At March 31, 2020, FCX had no borrowings, $13 million in letters of credit issued and $3.5 billion available under its revolving credit facility.
During first-quarter 2020, FCX issued $1.3 billion in new senior notes. FCX used the net proceeds to repay all of the senior notes due 2021 and a portion of the senior notes due 2022 (refer to Liquidity on page 6 for furtherdiscussion).
11
WEBCAST INFORMATIONA conference call with securities analysts to discuss FCX's first-quarter 2020 results is scheduled for today at 10:00 a.m. Eastern Time. The conference call will be broadcast on the Internet along with slides. Interested parties may
listen to the conference call live and view the slides by accessing “fcx.com.” A replay of the webcast will be available through Friday, May 22, 2020.-----------------------------------------------------------------------------------------------------------
FCX is a leading international mining company with headquarters in Phoenix, Arizona. FCX operates large, long-lived, geographically diverse assets with significant proven and probable reserves of copper, gold and molybdenum.FCX is one of the world's largest publicly traded copper producers.
FCX’s portfolio of assets includes the Grasberg minerals district in Indonesia, one of the world's largest copper and gold deposits; and significant mining operations in North America and South America, including the large-scaleMorenci minerals district in Arizona and the Cerro Verde operation in Peru. Additional information about FCX is available on FCX's website at "fcx.com."
Cautionary Statement and Regulation G Disclosure: This press release contains forward-looking statements in which FCX discusses its potential future performance. Forward-looking statements are all statements other than statements of historical facts, such as plans,projections, or expectations relating to ore grades and milling rates; forecasts or expectations regarding business outlook; production and sales volumes; unit net cash costs; cash flows; capital expenditures; liquidity; operating costs; operating plans; cost savings; FCX'sexpectations regarding its share of PT-FI's net (loss) income and future cash flows through 2022; PT-FI's development, financing, construction and completion of a new smelter in Indonesia; improvements in operating procedures and technology; exploration efforts and results;development and production activities, rates and costs; tax rates; export quotas and duties; the impact of copper, gold and molybdenum price changes; the impact of deferred intercompany profits on earnings; reserve estimates; execution of the settlement agreement associatedwith the Louisiana coastal erosion cases; and future dividend payments, share purchases and sales. The words “anticipates,” “may,” “can,” “plans,” “believes,” “estimates,” “expects,” “projects,” "targets," “intends,” “likely,” “will,” “should,” “could,” “to be,” ”potential," “assumptions,”“guidance,” “future” and any similar expressions are intended to identify those assertions as forward-looking statements. The declaration of dividends is at the discretion of the Board and will depend on FCX's financial results, cash requirements, future prospects, and other factorsdeemed relevant by the Board.
FCX cautions readers that forward-looking statements are not guarantees of future performance and actual results may differ materially from those anticipated, expected, projected or assumed in the forward-looking statements. Important factors that can cause FCX'sactual results to differ materially from those anticipated in the forward-looking statements include, but are not limited to, the duration and scope of and uncertainties associated with the COVID-19 pandemic, and the impact thereof on commodity prices, FCX’s business and theglobal economy, which are evolving and beyond FCX’s control, and any related actions taken by governments and businesses (including the Peruvian government’s order); FCX’s ability to contain and mitigate the risk of spread or major outbreak of COVID-19 at its operating sites,including at PT-FI’s remote operating site in Papua; supply of and demand for, and prices of, copper, gold and molybdenum; mine sequencing; changes in mine plans or operational modifications, delays, deferrals or cancellations; production rates; timing of shipments; results offeasibility studies; potential inventory adjustments; potential impairment of long-lived mining assets; the potential effects of violence in Indonesia generally and in the province of Papua; the Indonesian government's extension of PT-FI's export license after March 15, 2021; risksassociated with underground mining; satisfaction of requirements in accordance with PT-FI's special mining license (IUPK) to extend mining rights from 2031 through 2041; the Indonesian government's approval of a deferred schedule for completion of the new smelter inIndonesia; expected results from improvements in operating procedures and technology, including innovation initiatives; industry risks; regulatory changes; political and social risks; labor relations; weather- and climate-related risks; environmental risks; litigation results;cybersecurity incidents; changes in general market, economic and industry conditions; financial condition of FCX’s customers, suppliers, vendors, partners and affiliates, particularly during weak economic conditions and extended periods of low commodity prices; reductions inliquidity and access to capital; and other factors described in more detail under the heading “Risk Factors” in FCX's Annual Report on Form 10-K for the year ended December 31, 2019, filed with the U.S. Securities and Exchange Commission (SEC), as updated by FCX'ssubsequent filings with the SEC.
Investors are cautioned that many of the assumptions upon which FCX's forward-looking statements are based are likely to change after the forward-looking statements are made, including for example commodity prices, which FCX cannot control, and productionvolumes and costs, some aspects of which FCX may not be able to control. Further, FCX may make changes to its business plans that could affect its results. FCX cautions investors that it does not intend to update forward-looking statements more frequently than quarterlynotwithstanding any changes in its assumptions, changes in business plans, actual experience or other changes, and FCX undertakes no obligation to update any forward-looking statements.
This press release also contains certain financial measures such as adjusted net (loss) income and unit net cash costs per pound of copper and molybdenum, which are not recognized under U.S. generally accepted accounting principles. As required by SEC RegulationG, reconciliations of these measures to amounts reported in FCX's consolidated financial statements are in the supplemental schedules of this press release.
12
Freeport-McMoRan Inc.SELECTED OPERATING DATA
Three Months Ended March 31, 2020 2019 2020 2019 MINING OPERATIONS: Production Sales COPPER (millions of recoverable pounds) (FCX's net interest in %)
Consolidated 19 23 21 22 Less noncontrolling interests 2 4 3 3 Net 17 19 18 19
Average realized price per pound $ 11.10 $ 12.69 a. Amounts are net of Morenci's undivided joint venture partners' interests.
b. FCX’s economic interest in PT Freeport Indonesia (PT-FI) is expected to approximate 81 percent through 2022 and 48.76 percent thereafter.
c. Consolidated sales volumes exclude purchased copper of 88 million pounds in first-quarter 2020 and 117 million pounds in first-quarter 2019.
I
Freeport-McMoRan Inc.SELECTED OPERATING DATA (continued)
Three Months Ended March 31, 2020 2019 100% North America Copper Mines Leach Operations
Leach ore placed in stockpiles (metric tons per day) 728,100 705,000 Average copper ore grade (percent) 0.27 0.23 Copper production (millions of recoverable pounds) 235 226
Mill Operations
Ore milled (metric tons per day) 333,400 315,600 Average ore grades (percent):
Copper 0.32 0.33 Molybdenum 0.02 0.02
Copper recovery rate (percent) 87.0 87.8 Production (millions of recoverable pounds):
Copper 178 176 Molybdenum 8 8
100% South America Mining Leach Operations
Leach ore placed in stockpiles (metric tons per day) 182,500 166,700 Average copper ore grade (percent) 0.37 0.34 Copper production (millions of recoverable pounds) 63 59
Mill Operations
Ore milled (metric tons per day) 349,600 a 386,500 Average ore grades (percent):
Copper 0.35 0.37 Molybdenum 0.01 0.02
Copper recovery rate (percent) 78.4 87.2 Production (millions of recoverable pounds):
Copper 182 240 Molybdenum 4 8
100% Indonesia Mining
Ore extracted and milled (metric tons per day): Grasberg open pit 7,500 b 102,800 Deep Ore Zone underground minec 20,200 30,300 Grasberg Block Cave underground minec 19,000 5,000 Deep Mill Level Zone underground minec 18,500 6,800 Big Gossan underground minec 6,800 5,600
Total 72,000 150,500
Average ore grades: Copper (percent) 1.15 0.62 Gold (grams per metric ton) 0.99 0.58
Production (recoverable): Copper (millions of pounds) 140 145 Gold (thousands of ounces) 152 162
100% Molybdenum Mines
Ore milled (metric tons per day) 26,900 27,700 Average molybdenum ore grade (percent) 0.15 0.16 Molybdenum production (millions of recoverable pounds) 7 8
a. Beginning on March 16, 2020, Cerro Verde mill operations were impacted as a result of the Peruvian government's issuance of a Supreme Decree and declaration of a National Emergency in its efforts to contain the outbreak of COVID-19. The Cerro
Verde mill operations averaged over 400,000 metric tons of ore per day from January 1, 2020, through March 15, 2020.
b. Represents ore from the Grasberg open-pit stockpile.
c. Reflects ore extracted, including ore from development activities that result in metal production.
II
Freeport-McMoRan Inc.CONSOLIDATED STATEMENTS OF OPERATIONS (Unaudited)
Three Months Ended March 31, 2020 2019 (In Millions, Except Per Share Amounts) Revenuesa $ 2,798 $ 3,792 Cost of sales:
Production and deliveryb 2,545 c 2,919 Depreciation, depletion and amortization 341 c 347 Metals inventory adjustments 222 57 Total cost of sales 3,108 3,323
Selling, general and administrative expenses 110 112 Mining exploration and research expenses 16 27 Environmental obligations and shutdown costs 26 42 Net loss (gain) on sales of assets 11 (33)
Total costs and expenses 3,271 3,471 Operating (loss) income (473) 321 Interest expense, netb,d (127) (146) Net loss on early extinguishment of debt (32) (6) Other income, netb 20 14 (Loss) income from continuing operations before income taxes and equity in affiliated companies' net earnings (losses) (612) 183 Benefit from (provision for) income taxese 60 (105) Equity in affiliated companies' net earnings (losses) 3 (3) Net (loss) income from continuing operations (549) 75 Net gain from discontinued operations — 1 Net (loss) income (549) 76 Net loss (income) attributable to noncontrolling interests 58 (45)
Net (loss) income attributable to common stockholdersf $ (491) $ 31
Diluted net (loss) income per share attributable to common stock:
Dividends declared per share of common stock $ — $ 0.05
a. Includes adjustments to provisionally priced concentrate and cathode sales. For a summary of adjustments to provisionally priced copper sales, refer to the supplemental schedule, "Derivative Instruments," on page VII.b. Includes other net charges totaling $16 million for first-quarter 2020 and $22 million for first-quarter 2019, which are summarized in the supplemental schedule, "Adjusted Net (Loss) Income," on page VI.c. Includes COVID-19 related costs totaling $28 million, primarily associated with idle facility costs at Cerro Verde as a result of the Peruvian government's issuance of a Supreme Decree and declaration of a National Emergency in its efforts to contain the
outbreak of COVID-19 and contract cancellation costs at El Abra, which are summarized in the supplemental schedule, "Adjusted Net (Loss) Income," on page VI.d. Consolidated interest costs (before capitalization) totaled $171 million in first-quarter 2020 and $178 million in first-quarter 2019.e. For a summary of FCX's income taxes, refer to the supplemental schedule, "Income Taxes," beginning on page VI.f. FCX defers recognizing profits on intercompany sales until final sales to third parties occur. For a summary of net impacts from changes in these deferrals, refer to the supplemental schedule, "Deferred Profits," on page VII.
March 31, December 31, 2020 2019 (In Millions) ASSETS Current assets:
Cash and cash equivalents $ 1,602 $ 2,020 Trade accounts receivable 515 741 Income and other tax receivables 591 426 Inventories:
Materials and supplies, net 1,614 1,649 Mill and leach stockpiles 1,106 1,143 Product 1,134 1,281
Other current assets 795 655 Total current assets 7,357 7,915
Property, plant, equipment and mine development costs, net 29,899 29,584 Long-term mill and leach stockpiles 1,272 1,425 Other assets 1,691 1,885 Total assets $ 40,219 $ 40,809
LIABILITIES AND EQUITY Current liabilities:
Accounts payable and accrued liabilities $ 2,465 $ 2,576 Current portion of environmental and asset retirement obligations 305 436 Current portion of debt 245 5 Accrued income taxes 128 119 Dividends payable — 73
Total current liabilities 3,143 3,209 Long-term debt, less current portion 9,829 9,821 Deferred income taxes 4,087 4,210 Environmental and asset retirement obligations, less current portion 3,758 3,630 Other liabilities 2,439 2,491
Total liabilities 23,256 23,361 Equity:
Stockholders' equity: Common stock 158 158 Capital in excess of par value 25,875 25,830 Accumulated deficit (12,771) (12,280) Accumulated other comprehensive loss (668) (676) Common stock held in treasury (3,739) (3,734)
Total stockholders' equity 8,855 9,298 Noncontrolling interestsa 8,108 8,150
Total equity 16,963 17,448 Total liabilities and equity $ 40,219 $ 40,809
a. Includes $4.6 billion associated with the December 2018 PT-FI transaction, including $4.1 billion associated with the PT Indonesia Asahan Aluminium (Persero) acquisition of Rio Tinto's joint venture interest.
IV
Freeport-McMoRan Inc.CONSOLIDATED STATEMENTS OF CASH FLOWS (Unaudited)
Three Months Ended March 31, 2020 2019 (In Millions) Cash flow from operating activities:
Net (loss) income $ (549) $ 76 Adjustments to reconcile net (loss) income to net cash (used in) provided by operating activities:
Depreciation, depletion and amortization 341 347 Metals inventory adjustments 222 57 Net loss (gain) on sales of assets 11 (33) Stock-based compensation 27 29 Net charges for environmental and asset retirement obligations, including accretion 60 64 Payments for environmental and asset retirement obligations (71) (46) Net charges for defined pension and postretirement plans 18 26 Pension plan contributions (26) (16) Net loss on early extinguishment of debt 32 6 Deferred income taxes (118) 33 Charges for Cerro Verde royalty dispute 9 15 Payments for Cerro Verde royalty dispute (57) (10) Other, net (56) 42 Changes in working capital and other:
Accounts receivable 205 19 Inventories 154 192 Other current assets (89) 42 Accounts payable and accrued liabilities (149) (247) Accrued income taxes and timing of other tax payments (2) (62)
Net cash (used in) provided by operating activities (38) 534 Cash flow from investing activities:
Capital expenditures: North America copper mines (184) (210) South America (74) (61) Indonesia (326) (319) Molybdenum mines (7) (4) Other (19) (28)
Proceeds from sales of assets 66 a 84 b Other, net (2) (8)
Net cash used in investing activities (546) (546) Cash flow from financing activities:
Proceeds from debt 1,478 114 Repayments of debt (1,242) (1,356) Cash dividends and distributions paid:
Common stock (73) (73) Noncontrolling interests — (9)
Contributions from noncontrolling interests 32 — Stock-based awards net payments (4) (7) Debt financing costs and other, net (18) —
Net cash provided by (used in) financing activities 173 (1,331) Net decrease in cash, cash equivalents, restricted cash and restricted cash equivalents (411) (1,343) Cash, cash equivalents, restricted cash and restricted cash equivalents at beginning of year 2,278 4,455
Cash, cash equivalents, restricted cash and restricted cash equivalents at end of periodc $ 1,867 $ 3,112
a. Includes $60 million in contingent consideration associated with the 2016 sale of TF Holdings Limited because the average cobalt price exceeded $20 per pound during the 24-month period ending December 31, 2019.b. Includes $50 million in contingent consideration associated with the 2016 sale of onshore California oil & gas properties because the average oil price exceeded $70 per barrel during 2018.c. Includes restricted cash and restricted cash equivalents of $265 million at March 31, 2020, and $279 million at March 31, 2019.
V
Freeport-McMoRan Inc.ADJUSTED NET (LOSS) INCOME
Adjusted net (loss) income is intended to provide investors and others with information about FCX's recurring operating performance. This information differs from net (loss) income attributable to common stock determined inaccordance with U.S. generally accepted accounting principles (GAAP) and should not be considered in isolation or as a substitute for measures of performance determined in accordance with U.S. GAAP. FCX's adjusted net (loss)income follows, which may not be comparable to similarly titled measures reported by other companies (in millions, except per share amounts).
Three Months Ended March 31, 2020 2019 Pre-tax After-taxa Per Share Pre-tax After-taxa Per Share Net (loss) income attributable to common stock N/A $ (491) $ (0.34) N/A $ 31 $ 0.02 Metals inventory adjustments $ (222) $ (182) $ (0.12) $ (57) $ (26) $ (0.02) COVID-19 related costs (28) b (9) (0.01) — — — Other net charges (16) c (8) (0.01) (22) d (10) (0.01) Net adjustments to environmental obligations and related litigation reserves (14) (14) (0.01) (35) (35) (0.02) Net (loss) gain on sales of assets (11) (11) (0.01) 33 33 0.02 Net loss on early extinguishment of debt (32) (32) (0.02) (6) (5) — Net tax (charges) credits N/A (1) — N/A 6 — Gain on discontinued operations — — — 1 1 — $ (323) $ (256) e $ (0.18) $ (86) $ (36) $ (0.03) Adjusted net (loss) income attributable to common stock N/A $ (235) $ (0.16) N/A $ 67 $ 0.05 a. Reflects impact to FCX net (loss) income attributable to common stock (i.e., net of any taxes and noncontrolling interests).b. Includes $20 million recorded to production and delivery and $8 million to depreciation, depletion and amortization, primarily related to idle facility costs at Cerro Verde and contract cancellation costs at El Abra.c. Includes other charges recorded to production and delivery ($5 million), other income, net ($4 million), and interest expense, net ($7 million), primarily related to a change in a tax position at Cerro Verde and asset impairments.d. Includes charges recorded to production and delivery, primarily associated with weather-related issues at El Abra and for non-recurring employee costs at PT-FI.e. Does not foot because of rounding.
INCOME TAXESFollowing is a summary of the approximate amounts used in the calculation of FCX's consolidated income tax benefit (provision) (in millions, except percentages):
Three Months Ended March 31, 2020 2019 Income Tax Income Tax Income Effective (Provision) Income Effective (Provision) (Loss)a Tax Rate Benefit (Loss)a Tax Rate Benefit U.S.b $ (451) 1% $ 4 c $ (97) 1% $ 1 South America (202) 39% 78 263 40% (105) Indonesia (19) (63)% (12) d 79 33% (26) e Eliminations and other 60 N/A (11) (62) N/A 10 Rate adjustmentf — N/A 1 — N/A 15 Continuing operations $ (612) 10% g $ 60 $ 183 57% $ (105)
a. Represents (loss) income from continuing operations before income taxes and equity in affiliated companies' net earnings (losses).b. In addition to FCX's North America mining operations, the U.S. jurisdiction reflects corporate-level expenses, which include interest expense associated with senior notes, general and administrative expenses, and environmental obligations and shutdown costs.c. Includes a tax credit of $6 million associated with the removal of a valuation allowance on deferred tax assets.d. Includes a tax charge of $8 million ($7 million net of noncontrolling interest) associated with an unfavorable 2012 Indonesia Supreme Court ruling.e. Includes a tax credit of $8 million ($6 million net of noncontrolling interest) associated with the reduction in PT-FI's statutory tax rates in accordance with its special mining license (IUPK).f. In accordance with applicable accounting rules, FCX adjusts its interim provision for income taxes equal to its consolidated tax rate.g. FCX's first-quarter 2020 consolidated effective income tax rate is a function of the combined effective tax rates for the jurisdictions in which FCX operates, excluding the U.S. jurisdiction. Because FCX's U.S. jurisdiction generated net losses in first-quarter 2020 that will not
result in a realized tax benefit, applicable accounting rules require FCX to adjust its estimated annual effective tax rate to exclude the impact of U.S. net losses.
VI
Freeport-McMoRan Inc.INCOME TAXES (continued)
Assuming achievement of current sales volume and cost estimates and average prices of $2.30 per pound for copper, $1,600 per ounce for gold and $9.00 per pound for molybdenum for the remainder of 2020, FCX estimates itsconsolidated effective tax rate for the year 2020 would approximate 62 percent. Changes in sales volumes and average prices during 2020 would incur tax impacts at estimated effective rates of 38 percent for Indonesia, 34 percent forPeru and 0 percent for the U.S.
Variations in the relative proportions of jurisdictional income result in fluctuations to FCX's consolidated effective income tax rate. Because of FCX's U.S. tax position, it does not record a financial statement impact for income orlosses generated in the U.S.
DERIVATIVE INSTRUMENTSFor the three months ended March 31, 2020, FCX's mined copper was sold 49 percent in concentrate, 24 percent as cathode and 27 percent as rod from North America operations. Substantially all of FCX's copper concentrate
and cathode sales contracts provide final copper pricing in a specified future month (generally one to four months from the shipment date) based primarily on quoted London Metal Exchange (LME) monthly average copper prices. FCXrecords revenues and invoices customers at the time of shipment based on then-current LME prices, which results in an embedded derivative on provisionally priced concentrate and cathode sales that is adjusted to fair value throughearnings each period, using the period-end forward prices, until final pricing on the date of settlement. LME copper settlement prices averaged $2.56 per pound during first-quarter 2020 and settled at $2.18 per pound on March 31, 2020.Because a significant portion of FCX's copper concentrate and cathode sales in any quarterly period usually remain subject to final pricing, the quarter-end forward price is a major determinant of the average recorded copper price for theperiod. FCX's average realized copper price was $2.43 per pound in first-quarter 2020.
Following is a summary of the adjustments to prior period and current period provisionally priced copper sales (in millions, except per share amounts):
Three Months Ended March 31,
2020 2019
Prior
Perioda CurrentPeriodb Total
PriorPerioda
CurrentPeriodb Total
Revenues $ (107) $ (131) $ (238) $ 70 $ 52 $ 122Net (loss) income attributable to common stock $ (45) $ (54) $ (99) $ 29 $ 20 $ 49Net (loss) income per share of common stock $ (0.03) $ (0.04) $ (0.07) $ 0.02 $ 0.01 $ 0.03
a. Reflects adjustments to provisionally priced copper sales at December 31, 2019 and 2018.b. Reflects adjustments to provisionally priced copper sales during the three months ended March 31, 2020 and 2019.
At March 31, 2020, FCX had provisionally priced copper sales at its copper mining operations totaling 187 million pounds of copper (net of intercompany sales and noncontrolling interests) recorded at an average price of $2.24per pound, subject to final pricing over the next several months. FCX estimates that each $0.05 change in the price realized from the quarter-end provisional price would have an approximate $6 million effect on 2020 net incomeattributable to common stock. The LME copper price settled at $2.32 per pound on April 23, 2020.
DEFERRED PROFITSFCX defers recognizing profits on sales from its mining operations to Atlantic Copper and on 25 percent of PT-FI's sales to PT Smelting (PT-FI's 25 percent-owned Indonesian smelting unit) until final sales to third parties occur.
Changes in these deferrals attributable to variability in intercompany volumes resulted in net additions (reductions) to operating (loss) income totaling $11 million ($7 million to net loss attributable to common stock) in first-quarter 2020,$(31) million ($(14) million to net income attributable to common stock) in first-quarter 2019. FCX's net deferred profits on its inventories at Atlantic Copper and PT Smelting to be recognized in future periods' net income attributable tocommon stock totaled $2 million at March 31, 2020. Quarterly variations in ore grades, the timing of intercompany shipments and changes in product prices will result in variability in FCX's net deferred profits and quarterly earnings.
VII
Freeport-McMoRan Inc.BUSINESS SEGMENTS
FCX has organized its mining operations into four primary divisions – North America copper mines, South America mining, Indonesia mining and Molybdenum mines, and operating segments that meet certain thresholds arereportable segments. Separately disclosed in the following tables are FCX's reportable segments, which include the Morenci, Bagdad, Cerro Verde and Grasberg (Indonesia Mining) copper mines, the Rod & Refining operations andAtlantic Copper Smelting & Refining.
Intersegment sales between FCX’s business segments are based on terms similar to arms-length transactions with third parties at the time of the sale. Intersegment sales may not be reflective of the actual prices ultimatelyrealized because of a variety of factors, including additional processing, the timing of sales to unaffiliated customers and transportation premiums.
FCX allocates certain operating costs, expenses and capital expenditures to its operating divisions and individual segments. However, not all costs and expenses applicable to an operation are allocated. U.S. federal and stateincome taxes are recorded and managed at the corporate level (included in Corporate, Other & Eliminations), whereas foreign income taxes are recorded and managed at the applicable country level. In addition, most mining explorationand research activities are managed on a consolidated basis, and those costs along with some selling, general and administrative costs, are not allocated to the operating divisions or individual segments. Accordingly, the followingsegment information reflects management determinations that may not be indicative of what the actual financial performance of each operating division or segment would be if it was an independent entity.
(In millions) Atlantic Corporate, North America Copper Mines South America Mining Copper Other Other Cerro Other Indonesia Molybdenum Rod & Smelting & Elimi- FCX Morenci Bagdad Mines Total Verde Mines Total Mining Mines Refining & Refining nations Total
Provision for (benefit from) income taxes — — — — 110 (5) 105 26 — — 1 (27) 105
Total assets at March 31, 2019 2,904 709 4,051 7,664 8,674 1,720 10,394 15,792 1,785 232 771 4,421 41,059
Capital expenditures 62 25 123 210 56 5 61 319 4 1 4 23 622 a. Includes PT-FI's sales to PT Smelting totaling $380 million in first-quarter 2020 and $409 million in first-quarter 2019.b. Includes revenues from FCX's molybdenum sales company, which includes sales of molybdenum produced by the Molybdenum mines and by certain of the North America and South America copper mines.
IX
Freeport-McMoRan Inc.PRODUCT REVENUES AND PRODUCTION COSTS
Unit net cash costs per pound of copper and molybdenum are measures intended to provide investors with information about the cash-generating capacity of FCX's mining operations expressed on a basis relating to the primarymetal product for the respective operations. FCX uses this measure for the same purpose and for monitoring operating performance by its mining operations. This information differs from measures of performance determined inaccordance with U.S. GAAP and should not be considered in isolation or as a substitute for measures of performance determined in accordance with U.S. GAAP. These measures are presented by other metals mining companies,although FCX's measures may not be comparable to similarly titled measures reported by other companies.
FCX presents gross (loss) profit per pound of copper in the following tables using both a “by-product” method and a “co-product” method. FCX uses the by-product method in its presentation of gross (loss) profit per pound ofcopper because (i) the majority of its revenues are copper revenues, (ii) it mines ore, which contains copper, gold, molybdenum and other metals, (iii) it is not possible to specifically assign all of FCX's costs to revenues from the copper,gold, molybdenum and other metals it produces and (iv) it is the method used by FCX's management and Board of Directors to monitor FCX's mining operations and to compare mining operations in certain industry publications. In the co-product method presentations, shared costs are allocated to the different products based on their relative revenue values, which will vary to the extent FCX's metals sales volumes and realized prices change.
FCX shows revenue adjustments for prior period open sales as a separate line item. Because these adjustments do not result from current period sales, these amounts have been reflected separately from revenues on currentperiod sales. Noncash and other costs, which are removed from site production and delivery costs in the calculation of unit net cash costs, consist of items such as stock-based compensation costs, inventory adjustments, long-lived assetimpairments, idle facility costs, restructuring and/or unusual charges. As discussed above, gold, molybdenum and other metal revenues at copper mines are reflected as credits against site production and delivery costs in the by-productmethod. The following schedules are presentations under both the by-product and co-product methods together with reconciliations to amounts reported in FCX's consolidated financial statements.
X
Freeport-McMoRan Inc.PRODUCT REVENUES AND PRODUCTION COSTS (continued)
North America Copper Mines Product Revenues, Production Costs and Unit Net Cash Costs Three Months Ended March 31, 2020
(In millions) By-Product Co-Product Method Method Copper Molybdenuma Otherb Total
Revenues, excluding adjustments $ 906 $ 906 $ 77 $ 25 $ 1,008 Site production and delivery, before net noncash and other costs shown below 760 698 71 18 787
By-product credits (75) — — — —
Treatment charges 38 36 — 2 38
Net cash costs 723 734 71 20 825
Depreciation, depletion and amortization (DD&A) 92 84 6 2 92
Metals inventory adjustments 145 145 — — 145
Noncash and other costs, net 34 29 2 3 34
Total costs 994 992 79 25 1,096 Other revenue adjustments, primarily for pricing on prior period open sales (22) (22) — — (22)
Gross loss $ (110) $ (108) $ (2) $ — $ (110)
Copper sales (millions of recoverable pounds) 354 354
Molybdenum sales (millions of recoverable pounds)a 8 Gross loss per pound of copper/molybdenum: Revenues, excluding adjustments $ 2.56 $ 2.56 $ 9.69 Site production and delivery, before net noncash and other costs shown below 2.15 1.97 8.93
By-product credits (0.22) — —
Treatment charges 0.11 0.10 —
Unit net cash costs 2.04 2.07 8.93
DD&A 0.26 0.24 0.73
Metals inventory adjustments 0.41 0.41 —
Noncash and other costs, net 0.10 0.08 0.23
Total unit costs 2.81 2.80 9.89 Other revenue adjustments, primarily for pricing on prior period open sales (0.06) (0.06) —
Gross loss per pound $ (0.31) $ (0.30) $ (0.20)
Reconciliation to Amounts Reported Metals Production Inventory Revenues and Delivery DD&A Adjustments
Totals presented above $ 1,008 $ 787 $ 92 $ 145
Treatment charges (8) 30 — —
Noncash and other costs, net — 34 — — Other revenue adjustments, primarily for pricing on prior period open sales (22) — — —
Eliminations and other 7 9 — —
North America copper mines 985 860 92 145
Other miningc 2,591 2,473 234 64
Corporate, other & eliminations (778) (788) 15 13
As reported in FCX's consolidated financial statements $ 2,798 $ 2,545 $ 341 $ 222
a. Reflects sales of molybdenum produced by certain of the North America copper mines to FCX's molybdenum sales company at market-based pricing.b. Includes gold and silver product revenues and production costs.c. Represents the combined total for FCX's other mining operations as presented in the supplemental schedule, "Business Segments," beginning on page VIII.
XI
Freeport-McMoRan Inc.PRODUCT REVENUES AND PRODUCTION COSTS (continued)
North America Copper Mines Product Revenues, Production Costs and Unit Net Cash Costs Three Months Ended March 31, 2019
(In millions) By-Product Co-Product Method Method Copper Molybdenuma Otherb Total
Revenues, excluding adjustments $ 914 $ 914 $ 87 $ 23 $ 1,024 Site production and delivery, before net noncash and other costs shown below 658 616 52 17 685
By-product credits (83) — — — —
Treatment charges 36 35 — 1 36
Net cash costs 611 651 52 18 721
DD&A 83 77 3 3 83
Noncash and other costs, net 23 22 1 — 23
Total costs 717 750 56 21 827 Other revenue adjustments, primarily for pricing on prior period open sales 12 12 — — 12
Gross profit $ 209 $ 176 $ 31 $ 2 $ 209
Copper sales (millions of recoverable pounds) 320 320
Molybdenum sales (millions of recoverable pounds)a 7 Gross profit per pound of copper/molybdenum: Revenues, excluding adjustments $ 2.85 $ 2.85 $ 11.68 Site production and delivery, before net noncash and other costs shown below 2.06 1.92 6.98
By-product credits (0.26) — —
Treatment charges 0.11 0.11 —
Unit net cash costs 1.91 2.03 6.98
DD&A 0.26 0.24 0.44
Noncash and other costs, net 0.07 0.07 0.14
Total unit costs 2.24 2.34 7.56 Other revenue adjustments, primarily for pricing on prior period open sales 0.04 0.04 —
Gross profit per pound $ 0.65 $ 0.55 $ 4.12
Reconciliation to Amounts Reported Production Revenues and Delivery DD&A
Totals presented above $ 1,024 $ 685 $ 83
Treatment charges (13) 23 —
Noncash and other costs, net — 23 — Other revenue adjustments, primarily for pricing on prior period open sales 12 — —
Eliminations and other 11 12 —
North America copper mines 1,034 743 83
Other miningc 3,515 2,851 244
Corporate, other & eliminations (757) (675) 20
As reported in FCX's consolidated financial statements $ 3,792 $ 2,919 $ 347
a. Reflects sales of molybdenum produced by certain of the North America copper mines to FCX's molybdenum sales company at market-based pricing.b. Includes gold and silver product revenues and production costs.c. Represents the combined total for FCX's other mining operations as presented in the supplemental schedule, "Business Segments," beginning on page VIII.
XII
Freeport-McMoRan Inc.PRODUCT REVENUES AND PRODUCTION COSTS (continued)
South America Mining Product Revenues, Production Costs and Unit Net Cash Costs Three Months Ended March 31, 2020
(In millions) By-Product Co-Product Method
Method Copper Othera Total
Revenues, excluding adjustments $ 575 $ 575 $ 54 $ 629Site production and delivery, before net noncash and other costs shown below 494 457 49 506
By-product credits (42) — — —
Treatment charges 40 40 — 40
Royalty on metals 1 1 — 1
Net cash costs 493 498 49 547
DD&A 107 98 9 107
Metals inventory adjustments 60 60 — 60
Noncash and other costs, net 30 b 28 2 30
Total costs 690 684 60 744Other revenue adjustments, primarily for pricing on prior period open sales (75) (75) — (75)
Gross loss $ (190) $ (184) $ (6) $ (190)
Copper sales (millions of recoverable pounds) 247 247 Gross loss per pound of copper: Revenues, excluding adjustments $ 2.33 $ 2.33 Site production and delivery, before net noncash and other costs shown below 2.00 1.85
By-product credits (0.17) —
Treatment charges 0.16 0.16
Royalty on metals 0.01 0.01
Unit net cash costs 2.00 2.02
DD&A 0.44 0.40
Metals inventory adjustments 0.24 0.24
Noncash and other costs, net 0.12 b 0.11
Total unit costs 2.80 2.77 Other revenue adjustments, primarily for pricing on prior period open sales (0.30) (0.30)
Gross loss per pound $ (0.77) $ (0.74)
Reconciliation to Amounts Reported Metals Production Inventory Revenues and Delivery DD&A Adjustments
Totals presented above $ 629 $ 506 $ 107 $ 60
Treatment charges (40) — — —
Royalty on metals (1) — — —
Noncash and other costs, net — 30 — —Other revenue adjustments, primarily for pricing on prior period open sales (75) — — —
Eliminations and other (1) (2) 1 —
South America mining 512 534 108 60
Other miningc 3,064 2,799 218 149
Corporate, other & eliminations (778) (788) 15 13
As reported in FCX's consolidated financial statements $ 2,798 $ 2,545 $ 341 $ 222
a. Includes silver sales of 0.9 million ounces ($17.71 per ounce average realized price). Also reflects sales of molybdenum produced by Cerro Verde to FCX's molybdenum sales company at market-based pricing.b. Includes COVID-19 related costs of $20 million ($0.08 per pound of copper), primarily associated with idle facility costs at Cerro Verde as a result the Peruvian government's issuance of a Supreme Decree and declaration of a National Emergency in its efforts to contain the
outbreak of COVID-19 and contract cancellation costs at El Abra.c. Represents the combined total for FCX's other mining operations as presented in the supplemental schedule, "Business Segments," beginning on page VIII.
XIII
Freeport-McMoRan Inc.PRODUCT REVENUES AND PRODUCTION COSTS (continued)
South America Mining Product Revenues, Production Costs and Unit Net Cash Costs Three Months Ended March 31, 2019
(In millions) By-Product Co-Product Method Method Copper Othera Total
Revenues, excluding adjustments $ 850 $ 850 $ 112 $ 962 Site production and delivery, before net noncash and other costs shown below 503 450 66 516
By-product credits (99) — — —
Treatment charges 56 56 — 56
Royalty on metals 2 2 — 2
Net cash costs 462 508 66 574
DD&A 114 101 13 114
Noncash and other costs, net 24 b 24 — 24
Total costs 600 633 79 712 Other revenue adjustments, primarily for pricing on prior period open sales 47 47 — 47
Gross profit $ 297 $ 264 $ 33 $ 297
Copper sales (millions of recoverable pounds) 290 290 Gross profit per pound of copper: Revenues, excluding adjustments $ 2.93 $ 2.93 Site production and delivery, before net noncash and other costs shown below 1.73 1.55
By-product credits (0.34) —
Treatment charges 0.19 0.19
Royalty on metals 0.01 0.01
Unit net cash costs 1.59 1.75
DD&A 0.39 0.34
Noncash and other costs, net 0.09 b 0.09
Total unit costs 2.07 2.18 Other revenue adjustments, primarily for pricing on prior period open sales 0.16 0.16
Gross profit per pound $ 1.02 $ 0.91
Reconciliation to Amounts Reported Production Revenues and Delivery DD&A
Totals presented above $ 962 $ 516 $ 114
Treatment charges (56) — —
Royalty on metals (2) — —
Noncash and other costs, net — 24 — Other revenue adjustments, primarily for pricing on prior period open sales 47 — —
Eliminations and other — (1) —
South America mining 951 539 114
Other miningc 3,598 3,055 213
Corporate, other & eliminations (757) (675) 20
As reported in FCX's consolidated financial statements $ 3,792 $ 2,919 $ 347
a. Includes silver sales of 1.3 million ounces ($15.75 per ounce average realized price). Also reflects sales of molybdenum produced by Cerro Verde to FCX's molybdenum sales company at market-based pricing.b. Includes charges of $12 million ($0.04 per pound of copper) associated with weather-related impacts at El Abra.c. Represents the combined total for FCX's other mining operations as presented in the supplemental schedule, "Business Segments," beginning on page VIII.
XIV
Freeport-McMoRan Inc.PRODUCT REVENUES AND PRODUCTION COSTS (continued)
Indonesia Mining Product Revenues, Production Costs and Unit Net Cash Costs Three Months Ended March 31, 2020
(In millions) By-Product Co-Product Method
Method Copper Gold Silvera Total
Revenues, excluding adjustments $ 290 $ 290 $ 223 $ 8 $ 521Site production and delivery, before net noncash and other costs shown below 341 190 146 5 341
Gold and silver credits (236) — — — —
Treatment charges 38 21 16 1 38
Export duties 4 2 2 — 4
Royalty on metals 19 12 7 — 19
Net cash costs 166 225 171 6 402
DD&A 101 56 43 2 101
Noncash and other costs, net 27 15 12 — 27
Total costs 294 296 226 8 530Other revenue adjustments, primarily for pricing on prior period open sales (20) (20) 5 — (15)
PT Smelting intercompany profit 25 14 11 — 25
Gross profit (loss) $ 1 $ (12) $ 13 $ — $ 1
Copper sales (millions of recoverable pounds) 127 127
Gold sales (thousands of recoverable ounces) 139 Gross profit (loss) per pound of copper/per ounce of gold: Revenues, excluding adjustments $ 2.28 $ 2.28 $ 1,606 Site production and delivery, before net noncash and other costs shown below 2.68 1.49 1,052
Gold and silver credits (1.85) — —
Treatment charges 0.30 0.17 118
Export duties 0.03 0.02 11
Royalty on metals 0.15 0.09 50
Unit net cash costs 1.31 1.77 1,231
DD&A 0.79 0.44 310
Noncash and other costs, net 0.21 0.12 82
Total unit costs 2.31 2.33 1,623 Other revenue adjustments, primarily for pricing on prior period open sales (0.16) (0.16) 33
Reconciliation to Amounts Reported Production Revenues and Delivery DD&A
Totals presented above $ 521 $ 341 $ 101
Treatment charges (38) — —
Export duties (4) — —
Royalty on metals (19) — —
Noncash and other costs, net — 27 — Other revenue adjustments, primarily for pricing on prior period open sales (15) — —
PT Smelting intercompany profit — (25) —
Indonesia mining 445 343 101
Other miningb 3,131 2,990 225
Corporate, other & eliminations (778) (788) 15
As reported in FCX's consolidated financial statements $ 2,798 $ 2,545 $ 341
a. Includes silver sales of 0.6 million ounces ($14.09 per ounce average realized price).b. Represents the combined total for FCX's other mining operations as presented in the supplemental schedule, "Business Segments," beginning on page VIII.
XV
Freeport-McMoRan Inc.PRODUCT REVENUES AND PRODUCTION COSTS (continued)
Indonesia Mining Product Revenues, Production Costs and Unit Net Cash Costs Three Months Ended March 31, 2019
(In millions) By-Product Co-Product Method Method Copper Gold Silvera Total
Revenues, excluding adjustments $ 507 $ 507 $ 303 $ 9 $ 819 Site production and delivery, before net noncash and other costs shown below 538 333 199 6 538
Gold and silver credits (314) — — — —
Treatment charges 51 31 19 1 51
Export duties 17 11 6 — 17
Royalty on metals 28 17 11 — 28
Net cash costs 320 392 235 7 634
DD&A 105 65 39 1 105
Noncash and other costs, net 2 b 1 1 — 2
Total costs 427 458 275 8 741 Other revenue adjustments, primarily for pricing on prior period open sales 19 19 2 — 21
PT Smelting intercompany profit 3 2 1 — 3
Gross profit $ 102 $ 70 $ 31 $ 1 $ 102
Copper sales (millions of recoverable pounds) 174 174
Gold sales (thousands of recoverable ounces) 235 Gross profit per pound of copper/per ounce of gold: Revenues, excluding adjustments $ 2.92 $ 2.92 $ 1,291 Site production and delivery, before net noncash and other costs shown below 3.10 1.92 850
Gold and silver credits (1.81) — —
Treatment charges 0.29 0.18 80
Export duties 0.10 0.06 27
Royalty on metals 0.16 0.10 46
Unit net cash costs 1.84 2.26 1,003
DD&A 0.61 0.37 166
Noncash and other costs, net 0.01 b 0.01 4
Total unit costs 2.46 2.64 1,173 Other revenue adjustments, primarily for pricing on prior period open sales 0.11 0.11 9
PT Smelting intercompany profit 0.02 0.01 5
Gross profit per pound/ounce $ 0.59 $ 0.40 $ 132
Reconciliation to Amounts Reported Production Revenues and Delivery DD&A
Totals presented above $ 819 $ 538 $ 105
Treatment charges (51) — —
Export duties (17) — —
Royalty on metals (28) — —
Noncash and other costs, net 19 21 — Other revenue adjustments, primarily for pricing on prior period open sales 21 — —
PT Smelting intercompany profit — (3) —
Indonesia mining 763 556 105
Other miningc 3,786 3,038 222
Corporate, other & eliminations (757) (675) 20
As reported in FCX's consolidated financial statements $ 3,792 $ 2,919 $ 347
a. Includes silver sales of 0.6 million ounces ($14.85 per ounce average realized price).b. Includes credits of $19 million ($0.11 per pound of copper) recorded in revenues associated with adjustments to prior year treatment charges.c. Represents the combined total for FCX's other mining operations as presented in the supplemental schedule, "Business Segments," beginning on page VIII.
XVI
Freeport-McMoRan Inc.PRODUCT REVENUES AND PRODUCTION COSTS (continued)
Molybdenum Mines Product Revenues, Production Costs and Unit Net Cash Costs Three Months Ended March 31,
(In millions) 2020 2019 Revenues, excluding adjustmentsa $ 77 $ 98 Site production and delivery, before net noncash and other costs shown below 64 70
Treatment charges and other 6 7
Net cash costs 70 77
DD&A 16 16
Metals inventory adjustments 4 —
Noncash and other costs, net 2 1
Total costs 92 94
Gross (loss) profit $ (15) $ 4
Molybdenum sales (millions of recoverable pounds)a 7 8 Gross (loss) profit per pound of molybdenum: Revenues, excluding adjustmentsa $ 10.97 $ 12.49 Site production and delivery, before net noncash and other costs shown below 9.17 8.94
Treatment charges and other 0.86 0.86
Unit net cash costs 10.03 9.80
DD&A 2.29 2.00
Metals inventory adjustments 0.51 —
Noncash and other costs, net 0.30 0.16
Total unit costs 13.13 11.96
Gross (loss) profit per pound $ (2.16) $ 0.53
Reconciliation to Amounts Reported Metals Production Inventory
Three Months Ended March 31, 2020 Revenues and Delivery DD&A Adjustments
Totals presented above $ 77 $ 64 $ 16 $ 4
Treatment charges and other (6) — — —
Noncash and other costs, net — 2 — —
Molybdenum mines 71 66 16 4
Other miningb 3,505 3,267 310 205
Corporate, other & eliminations (778) (788) 15 13
As reported in FCX's consolidated financial statements $ 2,798 $ 2,545 $ 341 $ 222
Three Months Ended March 31, 2019
Totals presented above $ 98 $ 70 $ 16 $ —
Treatment charges and other (7) — — —
Noncash and other costs, net — 1 — —
Molybdenum mines 91 71 16 —
Other miningb 4,458 3,523 311 —
Corporate, other & eliminations (757) (675) 20 57
As reported in FCX's consolidated financial statements $ 3,792 $ 2,919 $ 347 $ 57
a. Reflects sales of the Molybdenum mines' production to FCX's molybdenum sales company at market-based pricing. On a consolidated basis, realizations are based on the actual contract terms for sales to third parties; as a result, FCX's consolidated average realized price per
pound of molybdenum will differ from the amounts reported in this table.b. Represents the combined total for FCX's other mining operations as presented in the supplemental schedule, "Business Segments," beginning on page VIII. Also includes amounts associated with FCX's molybdenum sales company, which includes sales of molybdenum
produced by the Molybdenum mines and by certain of the North America and South America copper mines.


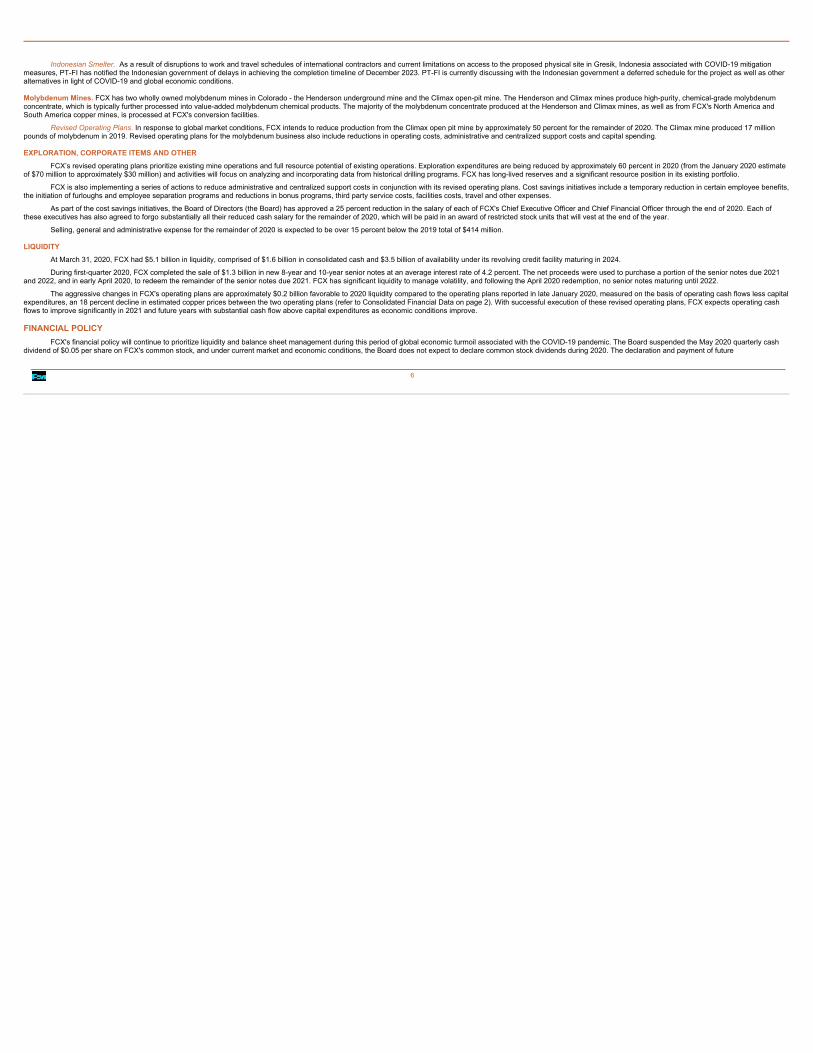


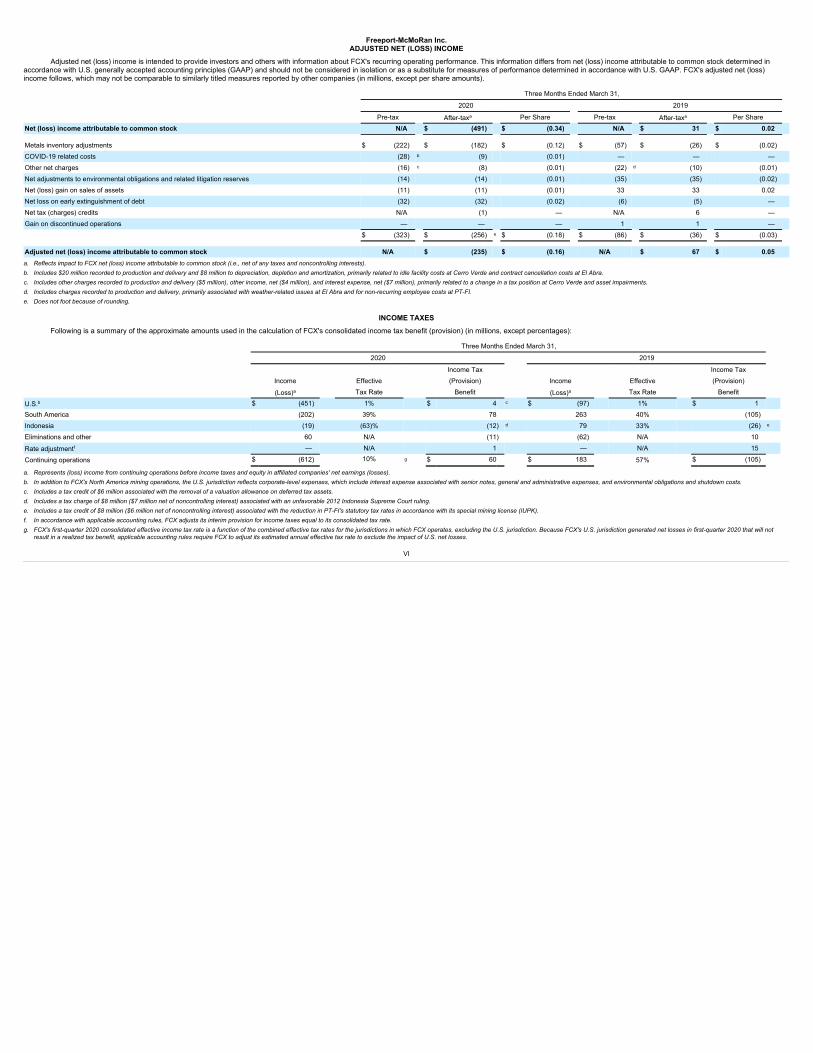


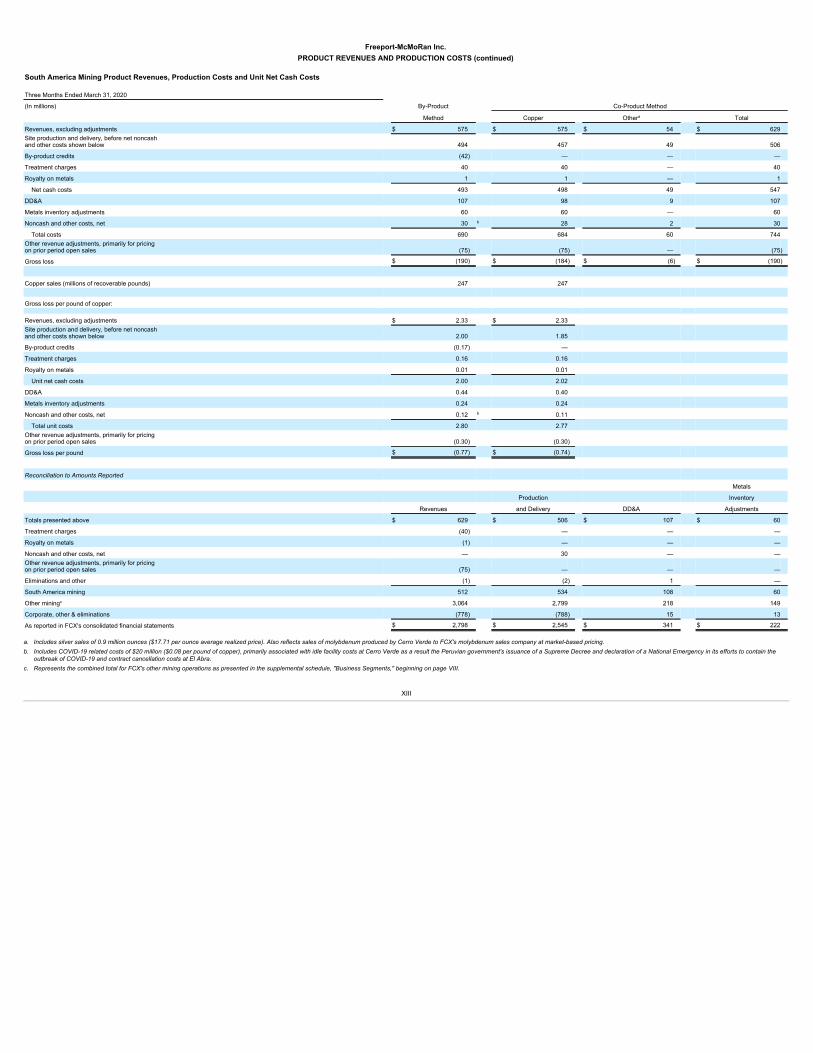


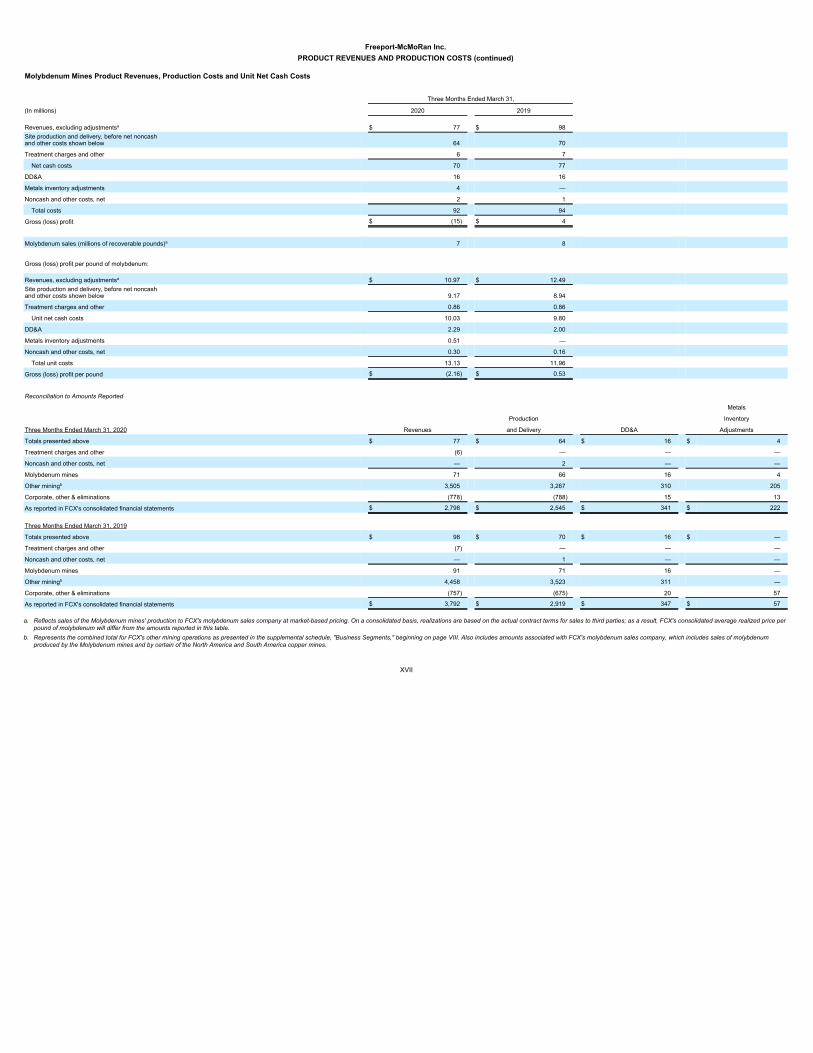


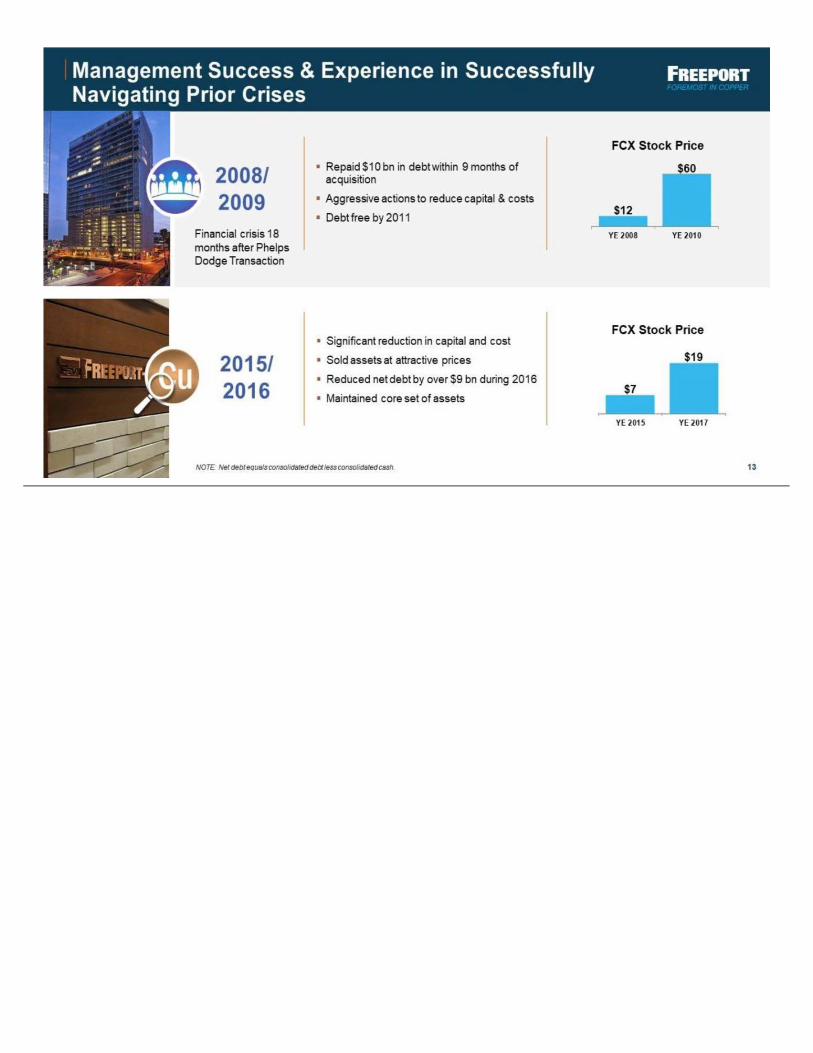
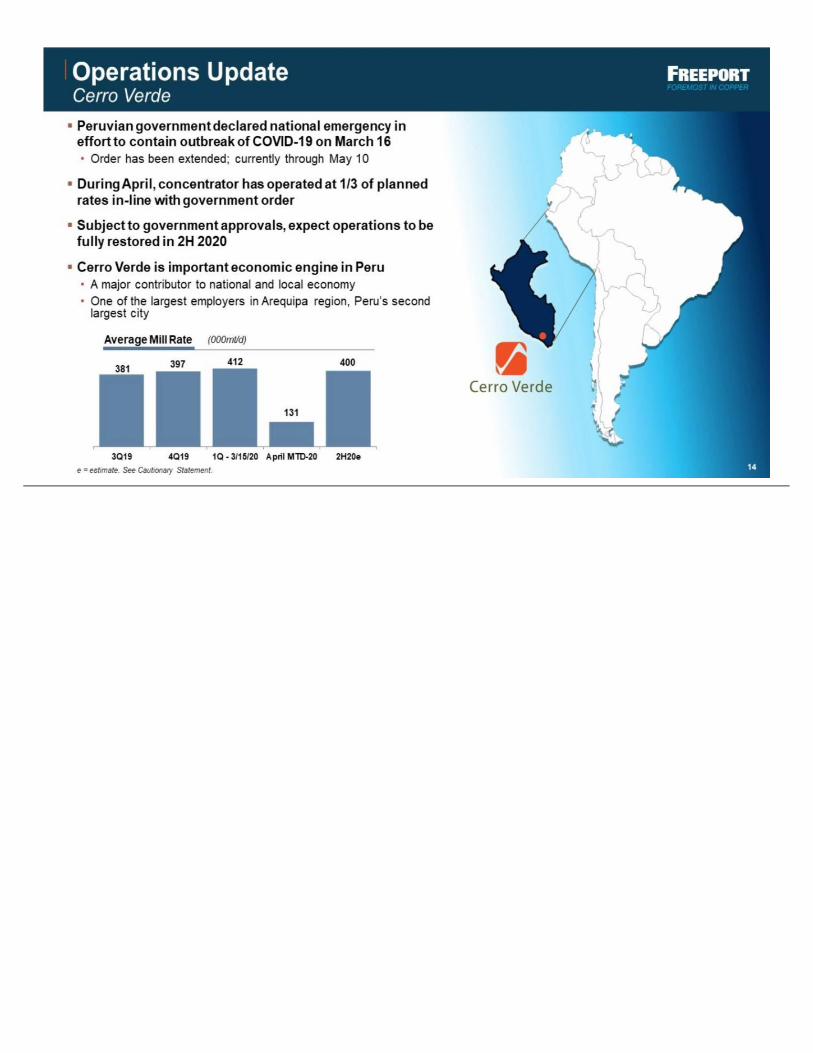


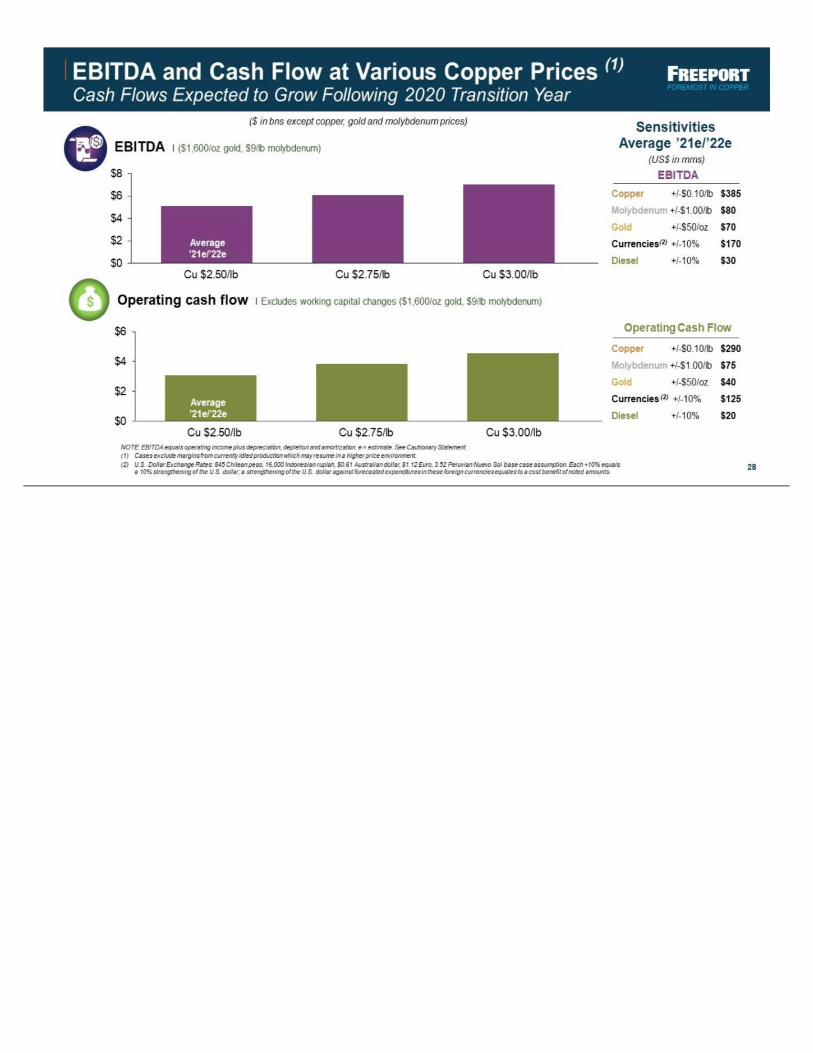

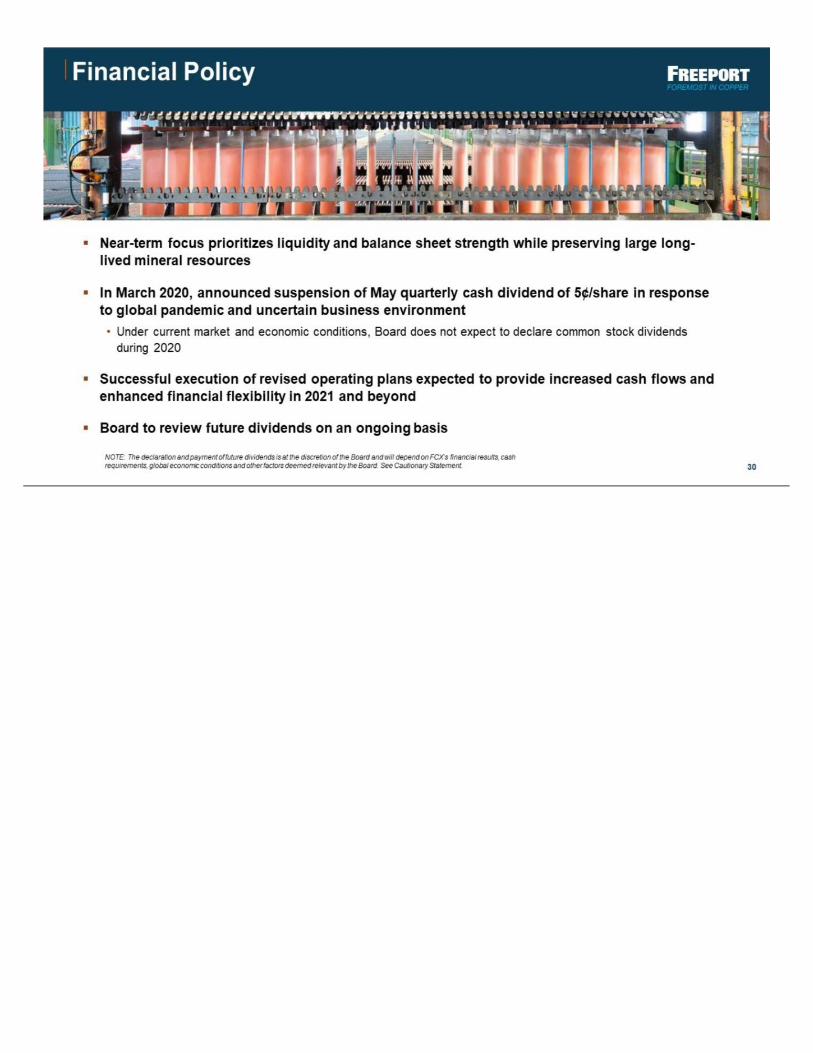


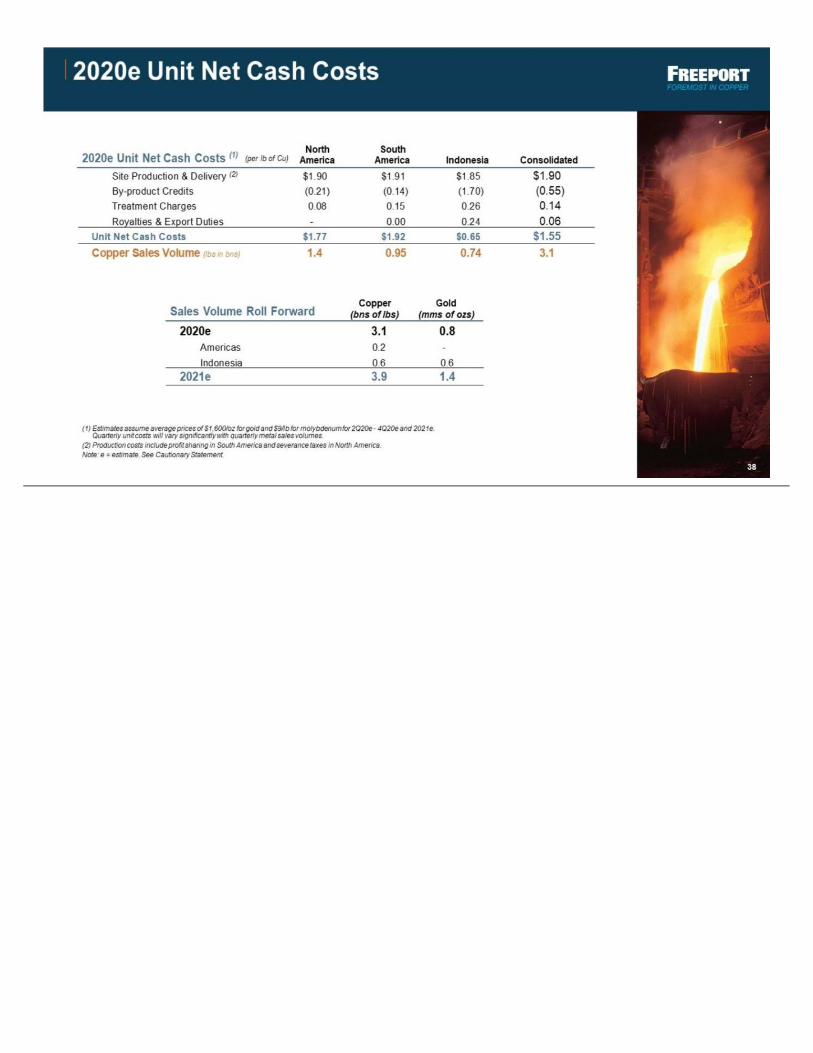


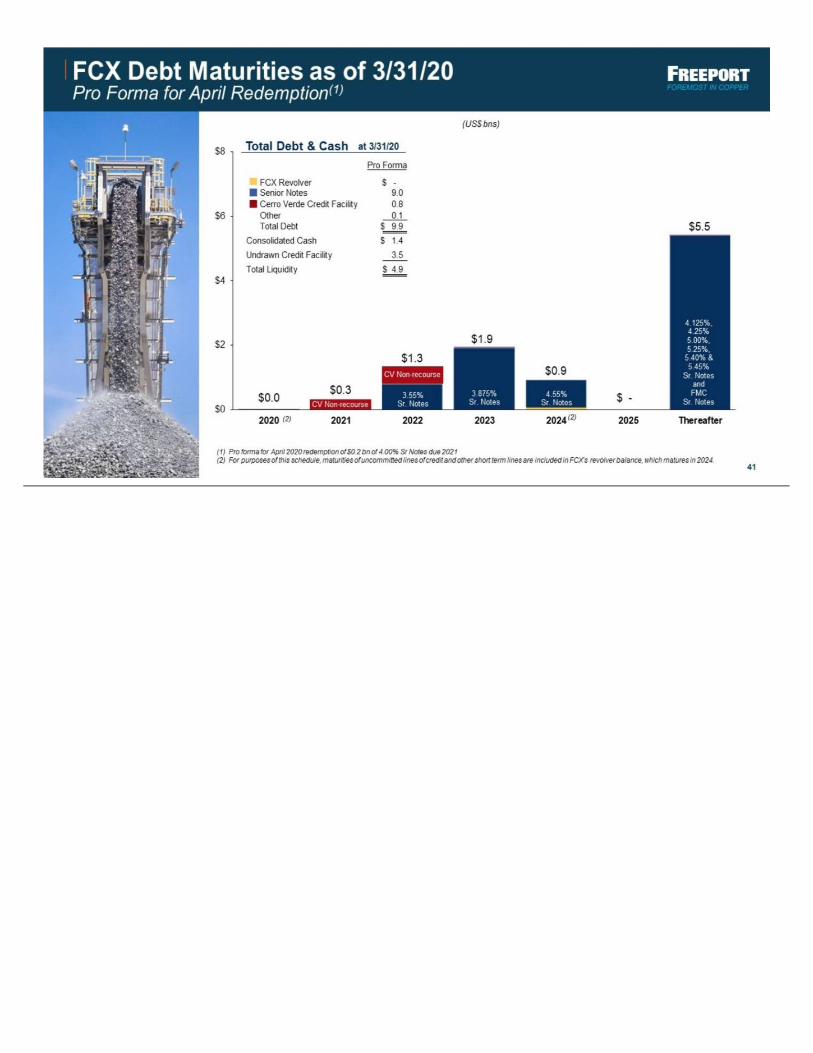


![K Z* < } r M...²3 b ) )Ê l ¥ Þ « ¸ ß î Ý 4 g r M ¥ Þ « ¸ ß î Ý+¬ / c Í Ý Ô å x Å ± Ñ å' b#Õ#Ø ^ ] #Õ è)T â _ ²0[ ^"@2A [ M b [ c / @ B K Z 8 r M K ?](https://static.documents.pub/doc/80x56/611f7e741202882eb037772f/k-z-r-m-3-b-l-4-g-r-m-.jpg)

![m F> ® ¬ ³ · _ ] ¢ m F * Ý N J ] ¢ ¸ Ä ® V C D Z m F ð V * Ý J ] ¢ C ü R ë Å m F - ù * ª ò m F -] * Ý J ] ¢ m F * Ý N J ] ¢ m F X - ð 7 A Ç F * Ì J m F X](https://static.documents.pub/doc/80x56/600658e75db02f02cf25056e/m-f-m-f-n-j-v-c-d-z-m-f-v-j-.jpg)


