Road User Understanding of Bicycle Signal Faces on Traffic Signals Christopher Monsere Sirisha Kothuri Portland State University Portland, Oregon David Hurwitz Douglas Cobb Oregon State University Corvallis, Oregon Christina Fink Bill Schultheiss Thomas Hillman Gwen Shaw Jesse Boudart Toole Design Group, Inc. Silver Spring, Maryland Final Report for NCHRP Project 20-07/Task 420 Submitted November 2019 Web-Only Document 273: NCHRP
Transcript
Road User Understanding of Bicycle Signal Faces on Traffic Signals Christopher Monsere Sirisha Kothuri Portland State University Portland, Oregon David Hurwitz Douglas Cobb Oregon State University Corvallis, Oregon Christina Fink Bill Schultheiss Thomas Hillman Gwen Shaw Jesse Boudart Toole Design Group, Inc. Silver Spring, Maryland
Final Report for NCHRP Project 20-07/Task 420 Submitted November 2019
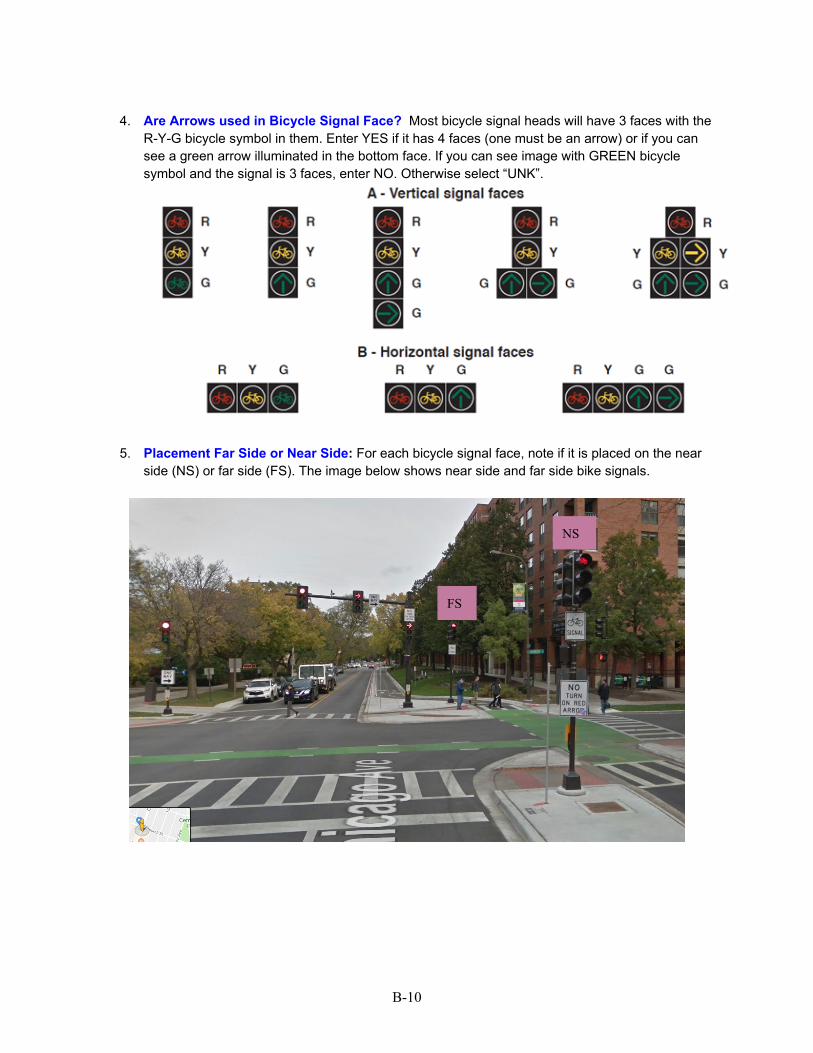
Web-Only Document 273:
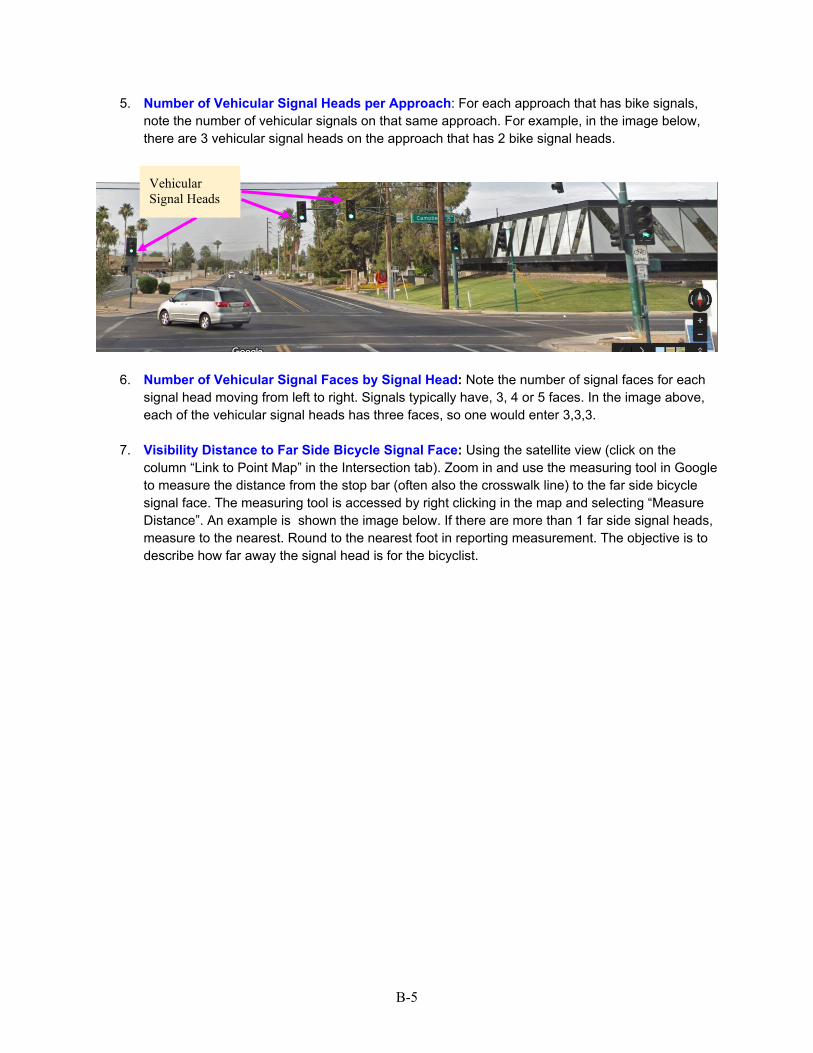
NCHRP
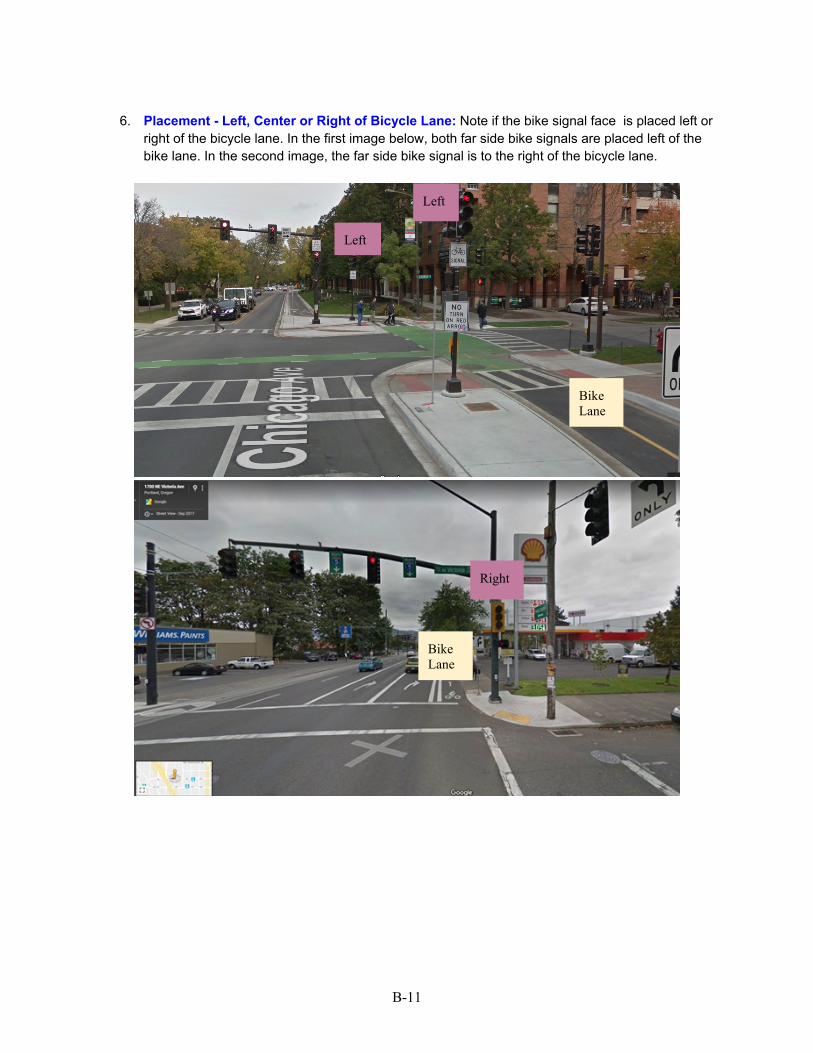
NCHRP Web-Only Document 273:
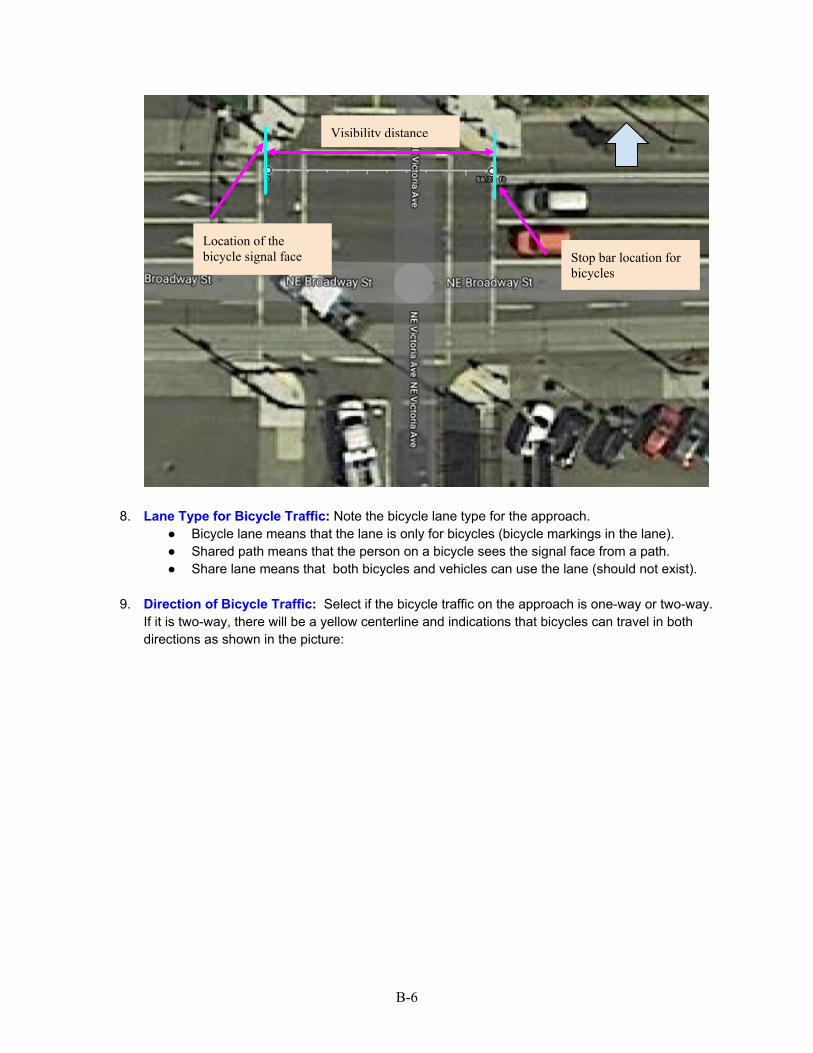
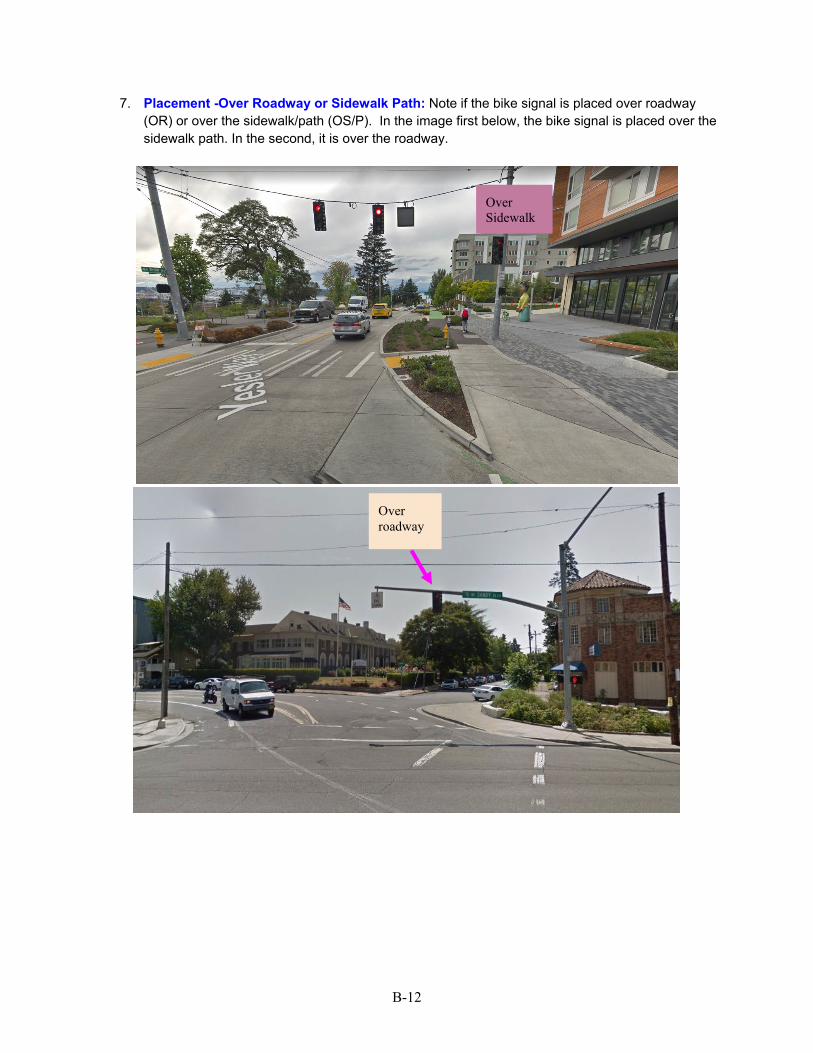
Road User Understanding of Bicycle Signal Faces on Traffic Signals
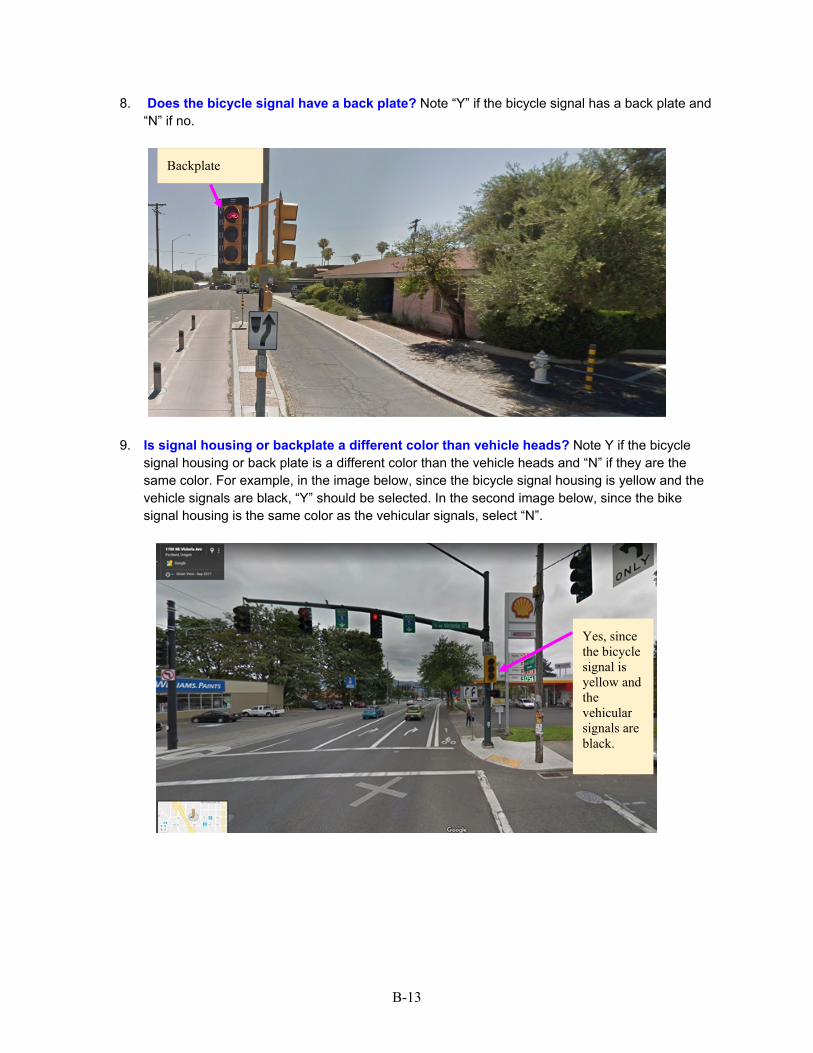
Christopher Monsere Sirisha Kothuri Portland State University Portland, Oregon David Hurwitz Douglas Cobb Oregon State University Corvallis, Oregon
Christina Fink Bill Schultheiss Thomas Hillman Gwen Shaw Jesse Boudart Toole Design Group, Inc. Silver Spring, Maryland
Final Report for NCHRP Project 20-07/Task 420
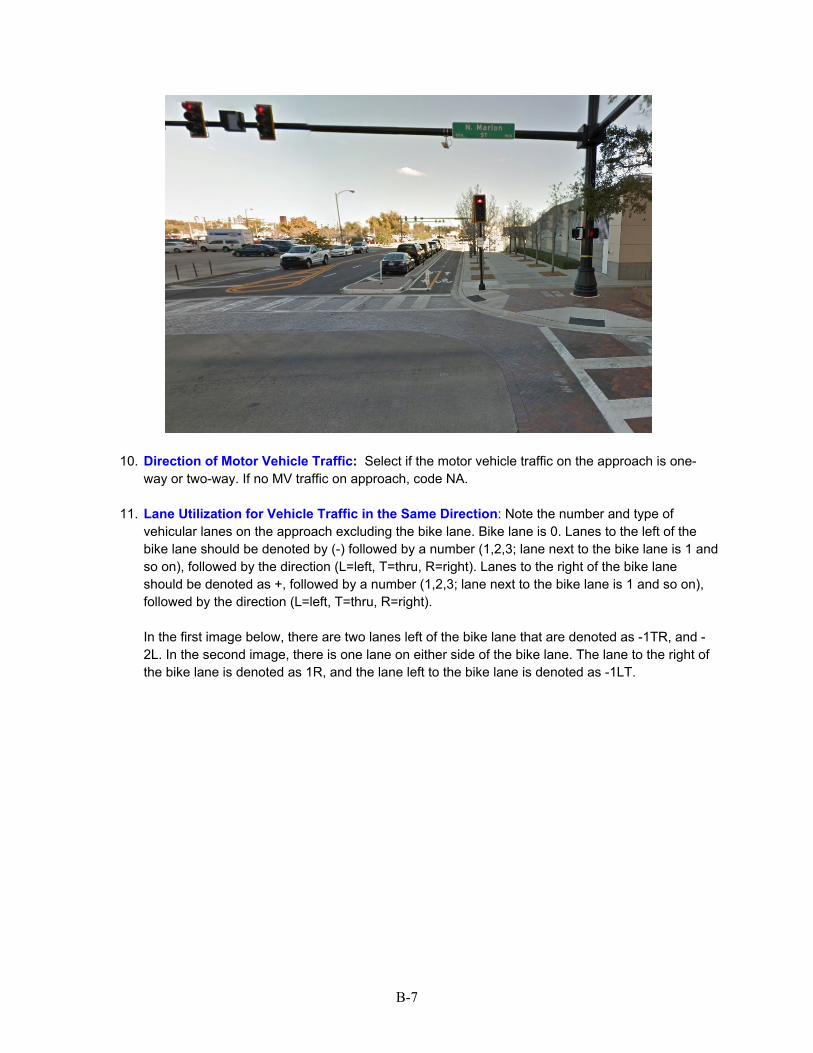
Submitted November 2019
ACKNOWLEDGMENT
This work was sponsored by the American Association of State Highway and Transportation Officials (AASHTO), in cooperation with the Federal Highway Administration, and was conducted in the National Cooperative Highway Research Program (NCHRP), which is administered by the Transportation Research Board (TRB) of the National Academies of Sciences, Engineering, and Medicine.
COPYRIGHT INFORMATION
Authors herein are responsible for the authenticity of their materials and for obtaining written permissions from publishers or persons who own the copyright to any previously published or copyrighted material used herein.
Cooperative Research Programs (CRP) grants permission to reproduce material in this publication for classroom and not-for-profit purposes. Permission is given with the understanding that none of the material will be used to imply TRB, AASHTO, FAA, FHWA, FMCSA, FRA, FTA, Office of the Assistant Secretary for Research and Technology, PHMSA, or TDC endorsement of a particular product, method, or practice. It is expected that those reproducing the material in this document for educational and not-for-profit uses will give appropriate acknowledgment of the source of any reprinted or reproduced material. For other uses of the material, request permission from CRP.
DISCLAIMER
The opinions and conclusions expressed or implied in this report are those of the researchers who performed the research. They are not necessarily those of the Transportation Research Board; the National Academies of Sciences, Engineering, and Medicine; or the program sponsors.
The information contained in this document was taken directly from the submission of the author(s). This material has not been edited by TRB.
The National Academy of Sciences was established in 1863 by an Act of Congress, signed by President Lincoln, as a private, non-
governmental institution to advise the nation on issues related to science and technology. Members are elected by their peers for
outstanding contributions to research. Dr. Marcia McNutt is president.
The National Academy of Engineering was established in 1964 under the charter of the National Academy of Sciences to bring the
practices of engineering to advising the nation. Members are elected by their peers for extraordinary contributions to engineering.
Dr. John L. Anderson is president.
The National Academy of Medicine (formerly the Institute of Medicine) was established in 1970 under the charter of the National
Academy of Sciences to advise the nation on medical and health issues. Members are elected by their peers for distinguished contributions
to medicine and health. Dr. Victor J. Dzau is president.
The three Academies work together as the National Academies of Sciences, Engineering, and Medicine to provide independent,
objective analysis and advice to the nation and conduct other activities to solve complex problems and inform public policy decisions.
The National Academies also encourage education and research, recognize outstanding contributions to knowledge, and increase
public understanding in matters of science, engineering, and medicine.
Learn more about the National Academies of Sciences, Engineering, and Medicine at www.national-academies.org.
The Transportation Research Board is one of seven major programs of the National Academies of Sciences, Engineering, and Medicine.
The mission of the Transportation Research Board is to provide leadership in transportation improvements and innovation through
trusted, timely, impartial, and evidence-based information exchange, research, and advice regarding all modes of transportation. The
Board’s varied activities annually engage about 8,000 engineers, scientists, and other transportation researchers and practitioners from
the public and private sectors and academia, all of whom contribute their expertise in the public interest. The program is supported by
state transportation departments, federal agencies including the component administrations of the U.S. Department of Transportation,
and other organizations and individuals interested in the development of transportation.
Learn more about the Transportation Research Board at www.TRB.org.
C O O P E R A T I V E R E S E A R C H P R O G R A M S
CRP STAFF FOR NCHRP Web-Only Document 273 Christoper J. Hedges, Director, Cooperative Research Programs Lori L. Sundstrom, Deputy Director, Cooperative Research Programs Ann M. Hartell, Senior Program Officer Jarrel McAfee, Senior Program Assistant Eileen P. Delaney, Director of Publications Natalie Barnes, Associate Director of Publications Jennifer Correro, Assistant Editor
NCHRP PROJECT 20-07/Task 420 PANEL AREA OF SPECIAL PROJECTS
Alexander Kevin Barr, Florida DOT, Fort Lauderdale, FL Drew L. Buckner, Michigan DOT, Chesterfield, MI Julius A. Codjoe, Louisiana DOTD, Baton Rouge, LA Naa-Atswei Tetteh, Delaware DOT, Smyma, DE Gabriel Thum, Pima Association of Governments, Tucson, AZ Ivan B. Ulberg, Montana DOT, Helena, MT Ann H. Do, FHWA Liaison
ACKNOWLEDGMENTS The research reported herein was performed under NCHRP 20-07 Task 420. Dr. Christopher M. Monsere, P.E., Professor of Civil and Environmental Engineering at Portland State University PSU, was the Principal Investigator. The other authors of this report are Dr. Sirisha Kothuri, (PSU), Dr. David Hurwitz, Oregon State University (OSU), Douglas Cobb, OSU, Christina Fink, Toole Design Group, Inc. (TDG), Bill Schultheiss, TDG, Jesse Boudart, TDG, Thomas Hillman, TDG, and Gwen Shaw, TDG. A number of students contributed to the data collection effort including Duong Vu at Portland State University and Alden Sova, Logan Scott-Deeter, Jason Formanack, and Lukas Bauer at Oregon State University. Hagai Tapiro, postdoctoral researcher at Oregon State University, contributed to the literature review. The agency staff who participated in the interview provided valuable insight and shared their experience. Rock Miller was instrumental in developing the list of intersections for inventory as he shared the initial NCUTCD list he had compiled. In addition, the research team acknowledges the people who responded to our survey to identify intersections with bicycle signals.
Project Objectives ..................................................................................................................................... 5 Overview of Project by Tasks ................................................................................................................... 5 Purpose and Organization of Report ......................................................................................................... 6
BACKGROUND AND LITERATURE REVIEW ................................................................................... 7
Basic Human Factors Concepts ................................................................................................................ 7 Visibility and Comprehension of Bicycle Signal Face ........................................................................... 12 Compliance ............................................................................................................................................. 16 Safety at Intersections with Bicycle Signals ........................................................................................... 20 Related Traffic Control Devices ............................................................................................................. 21 Summary ................................................................................................................................................. 24
STATE OF THE PRACTICE AND INVENTORY ............................................................................... 26
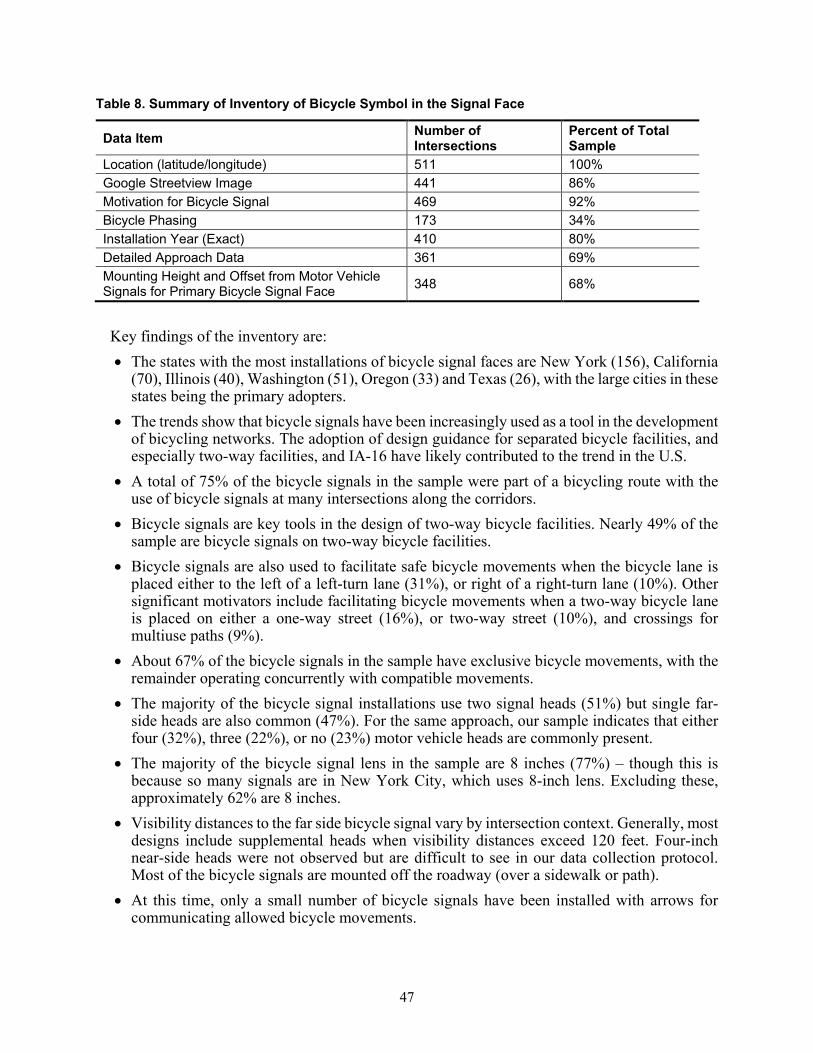
Design Guidance ..................................................................................................................................... 26 Inventory of Intersections with Bicycle Signals ..................................................................................... 28 Summary ................................................................................................................................................. 46
IDENTIFIED RESEARCH GAPS .......................................................................................................... 68
Optimal Methods to Communicate Allowable, Protected, or Permissive Movements to Bicyclists at Signalized Intersections .......................................................................................................................... 68 Evaluation of Size, Placement, and Orientation of Bicycle Signal Faces on Bicyclist and Driver Comprehension and Compliance ............................................................................................................ 69 Guidance on Visibility and Detection of Bicycle Symbols in Signal Faces by Lens Size and Distance 70
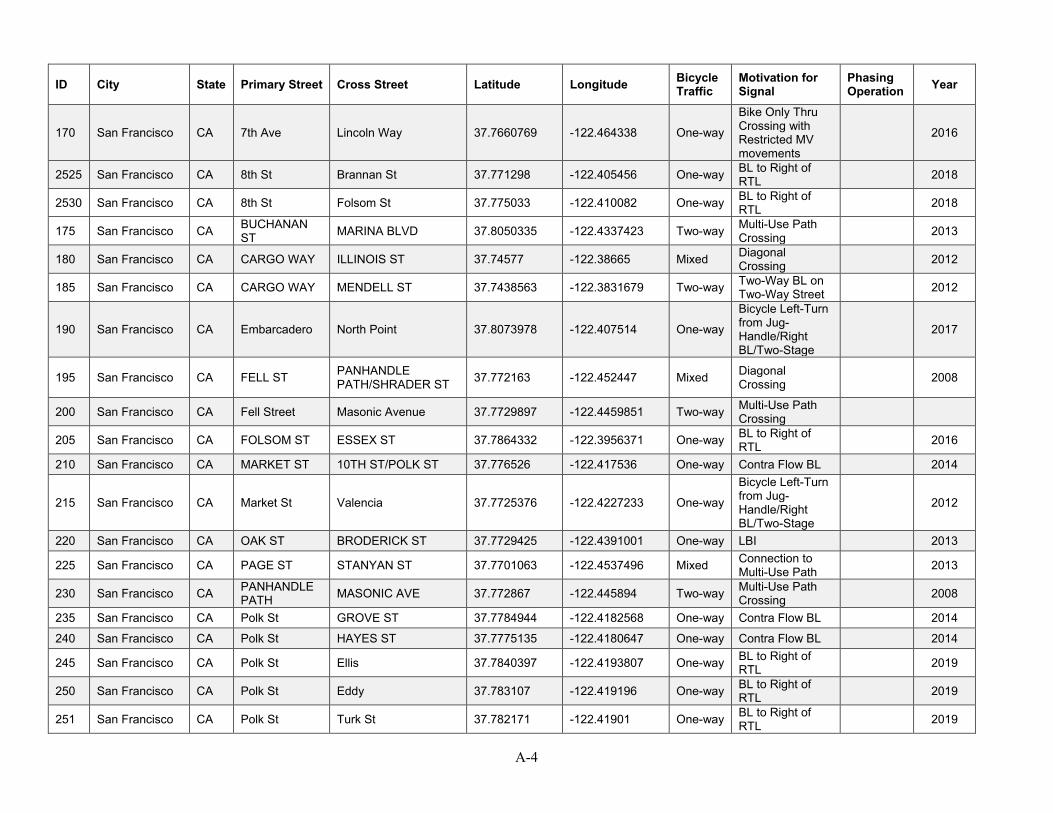
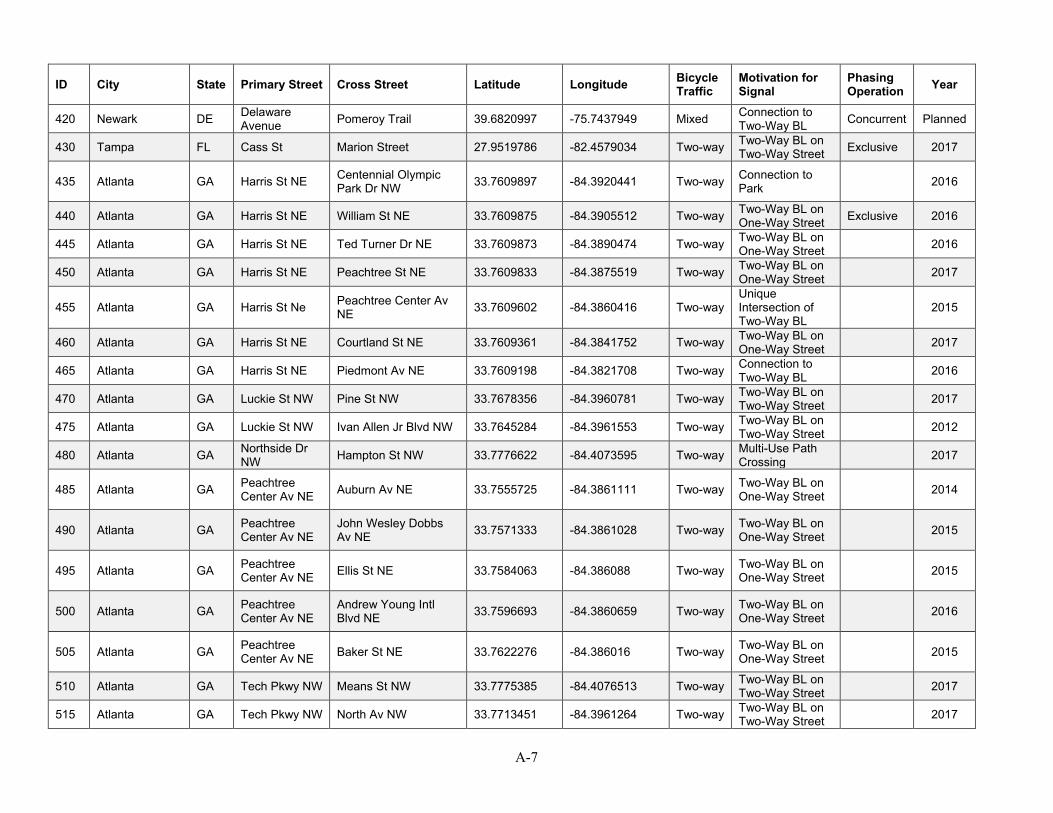
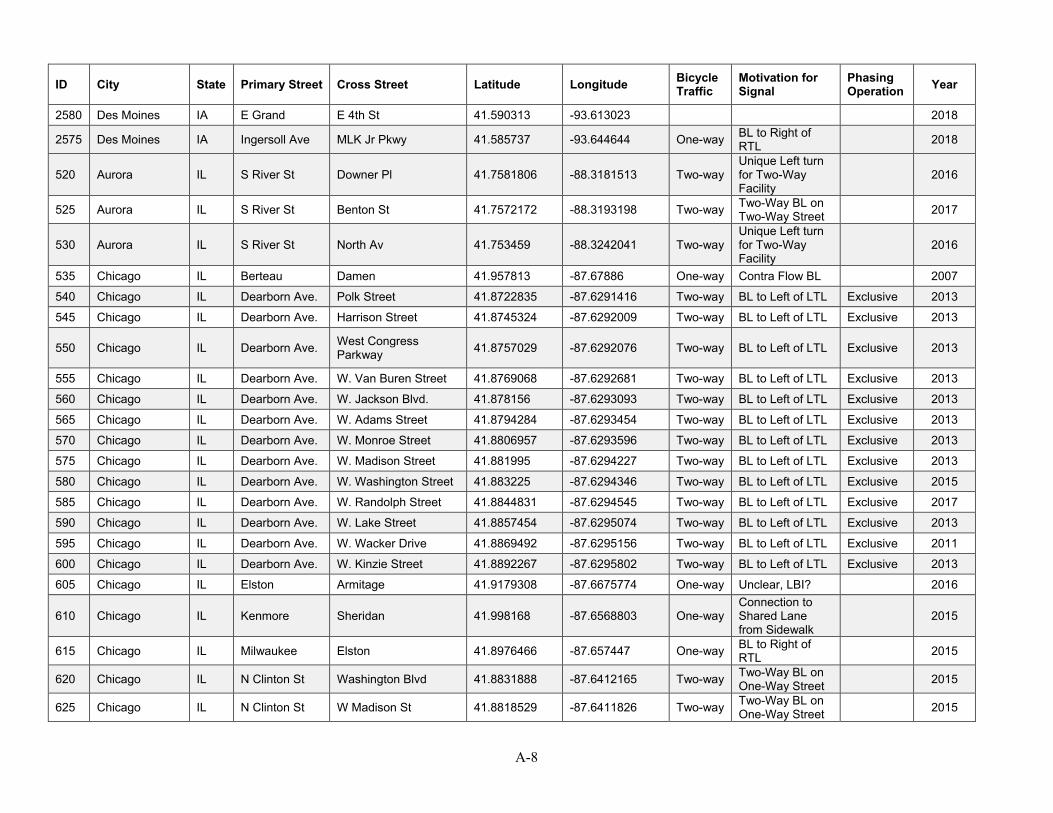
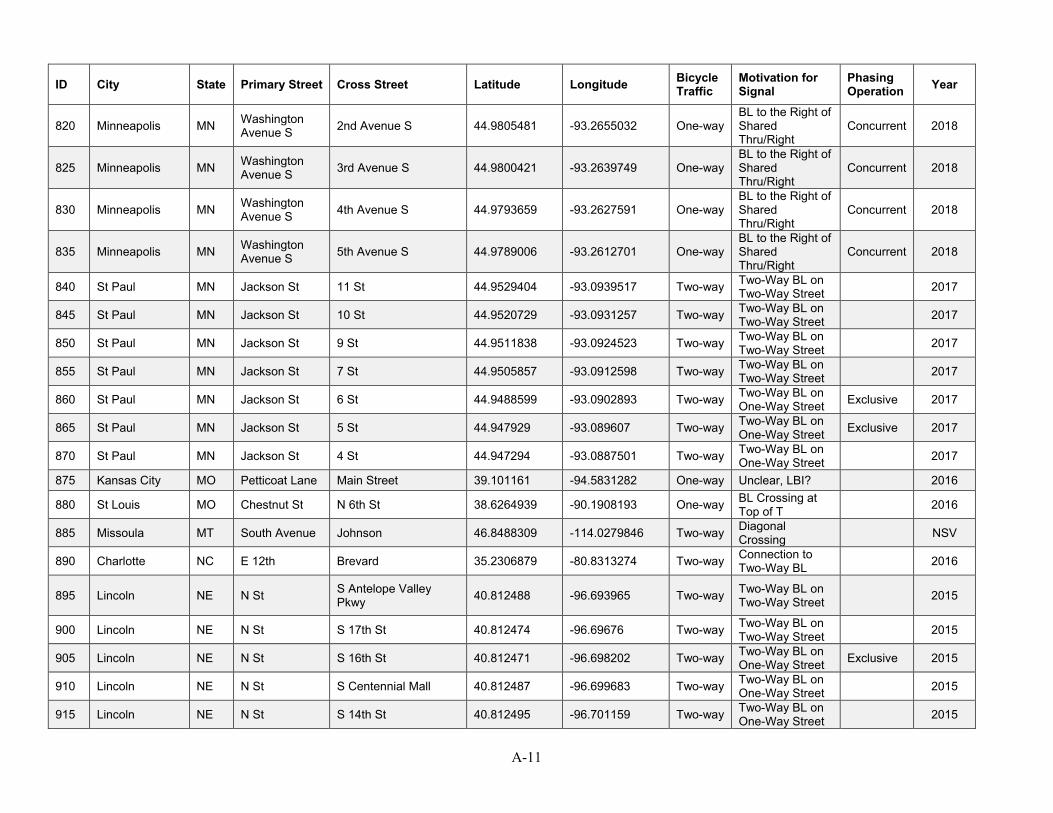
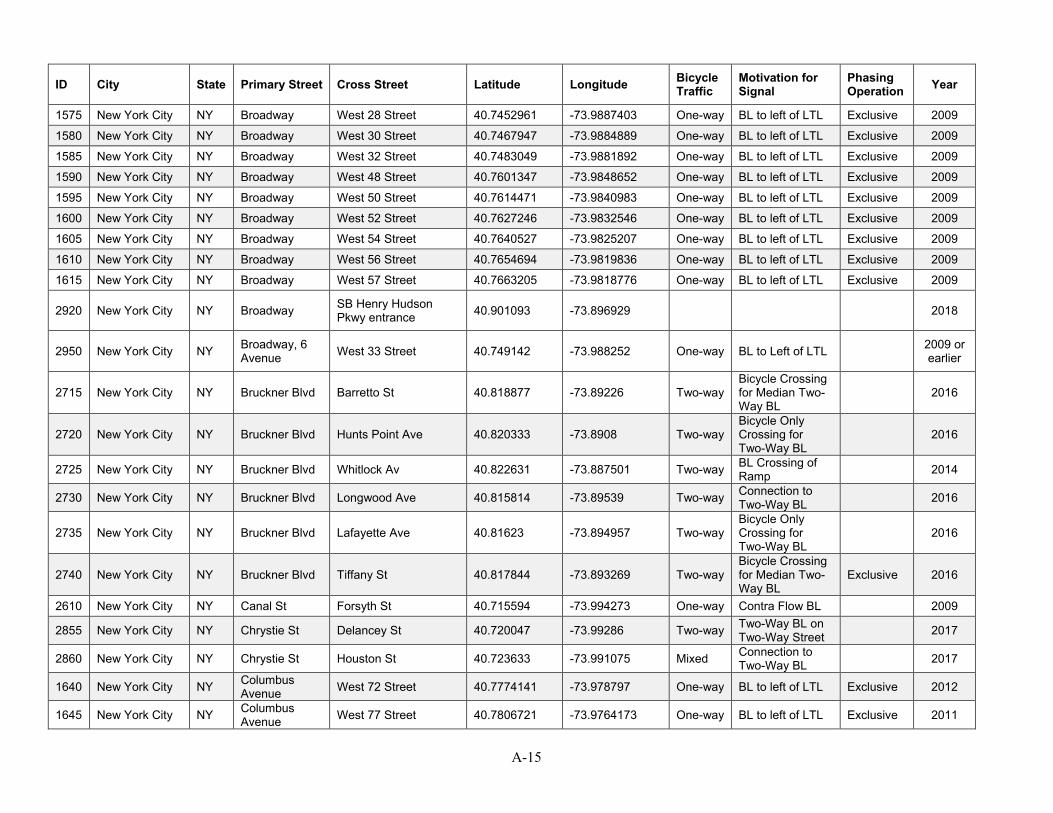
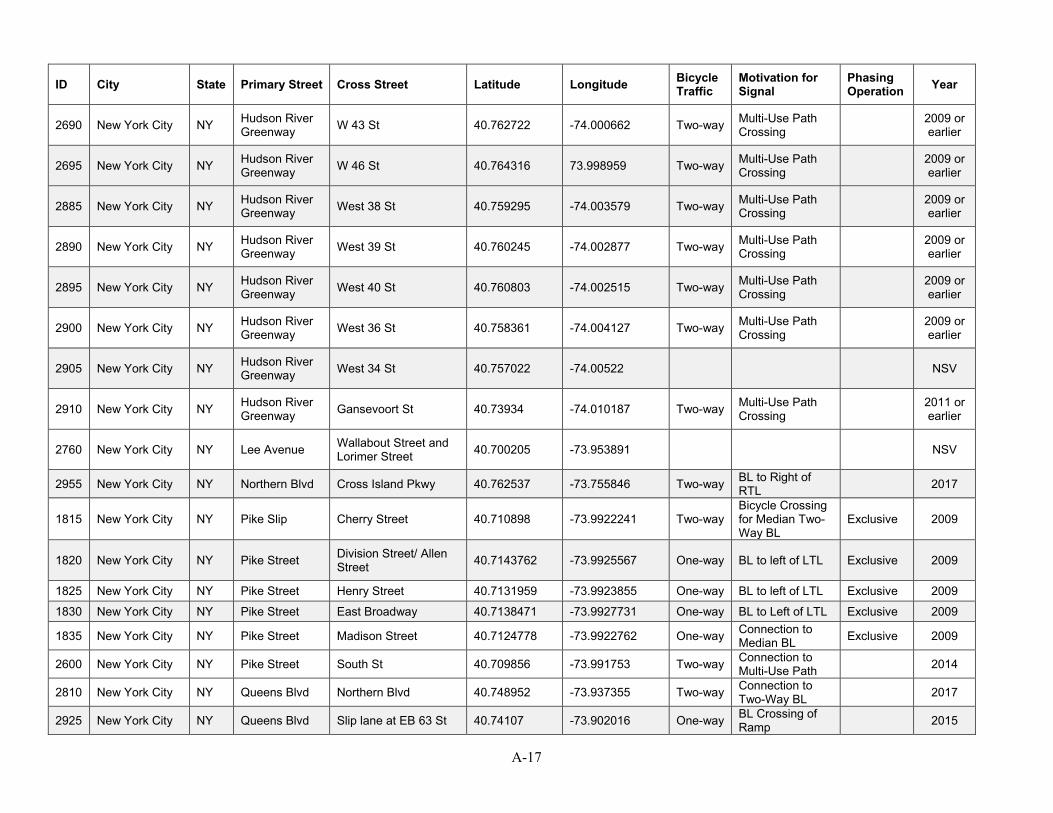
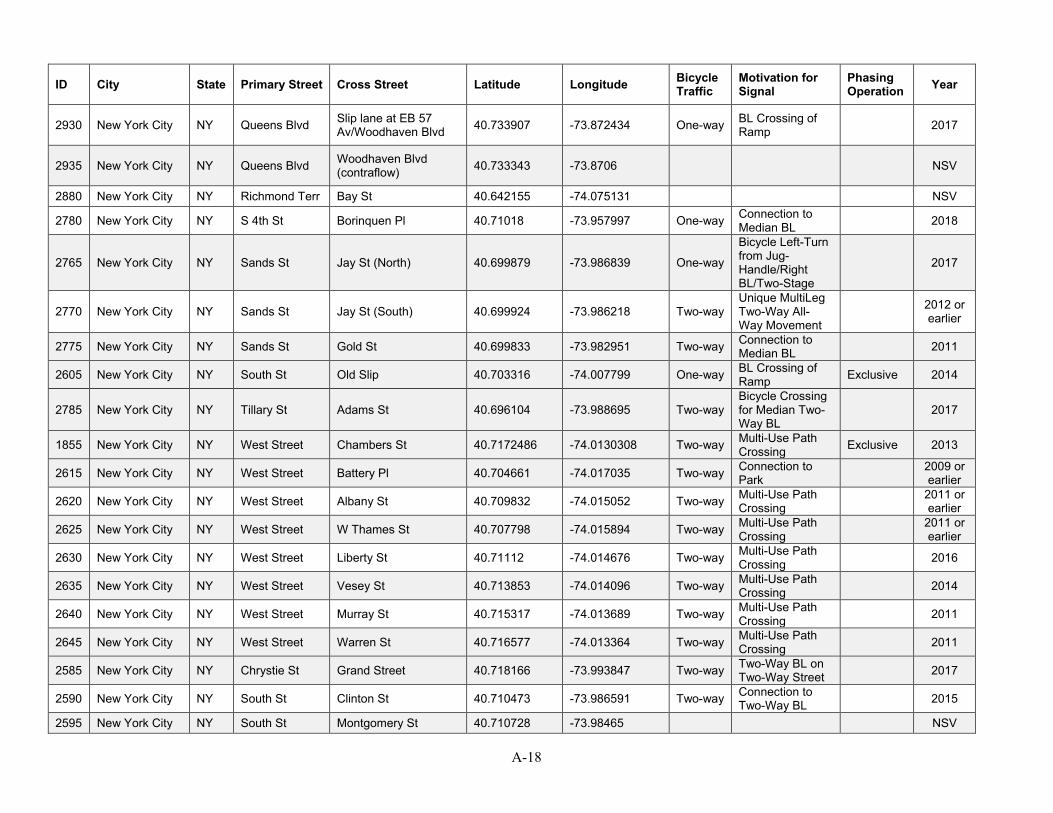
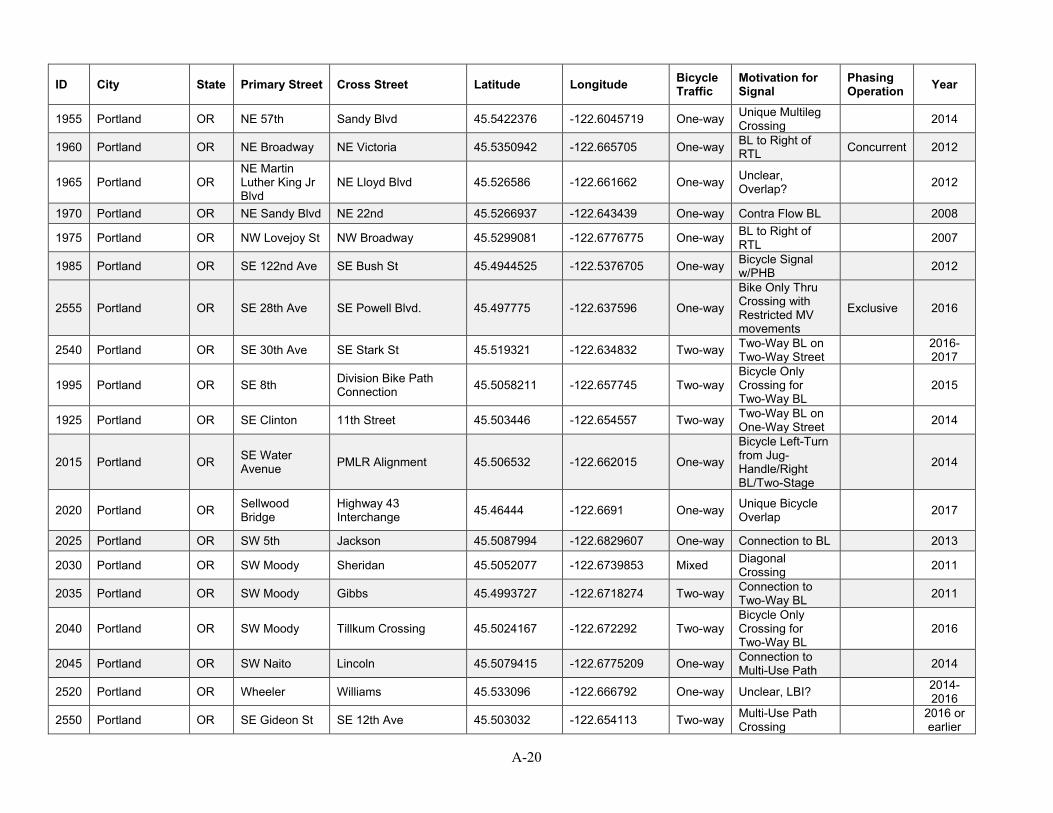
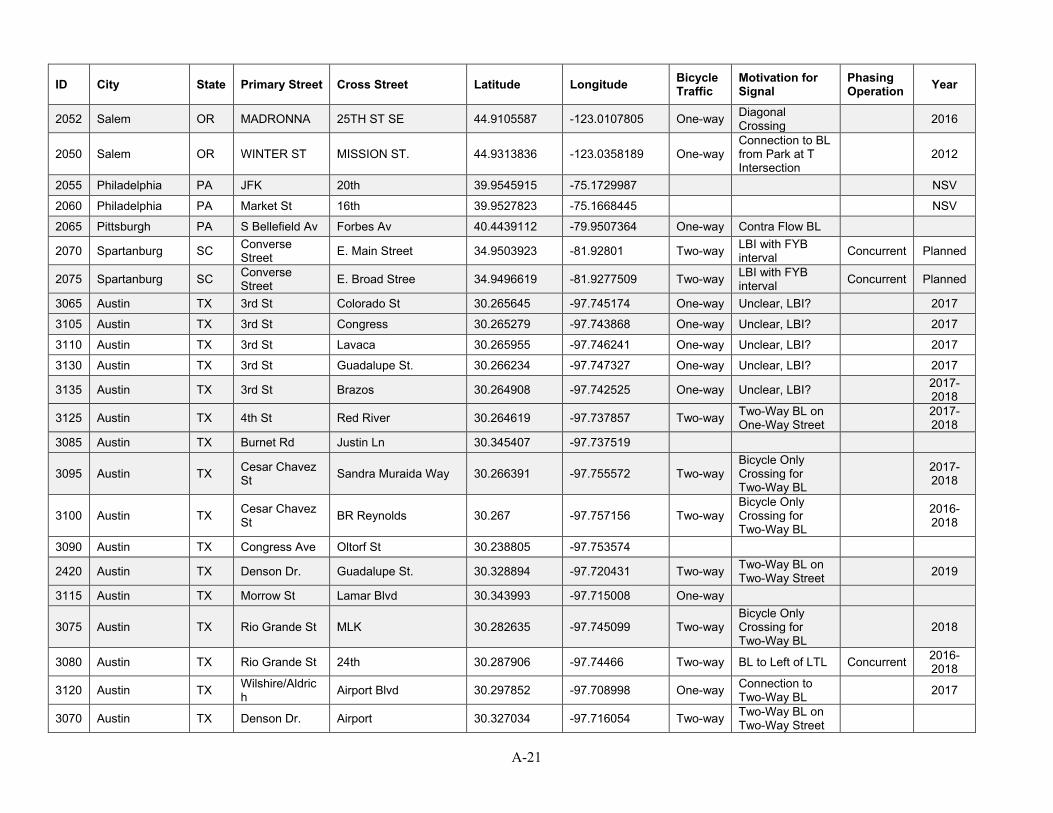
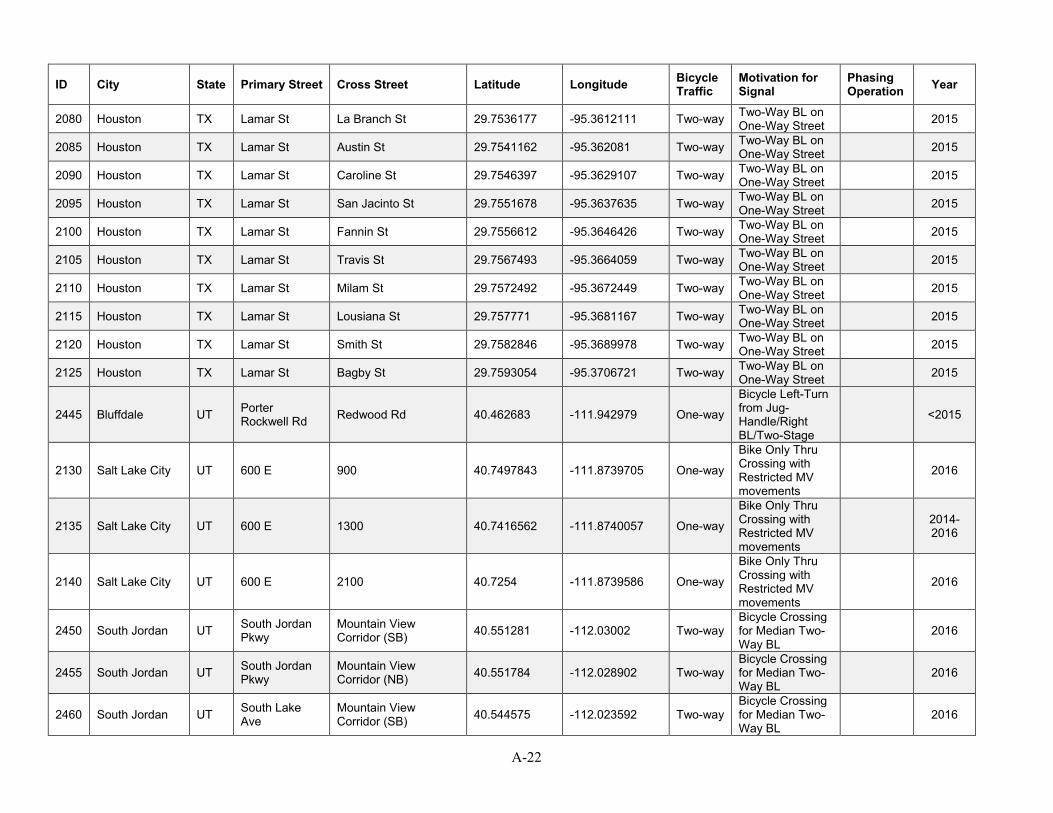
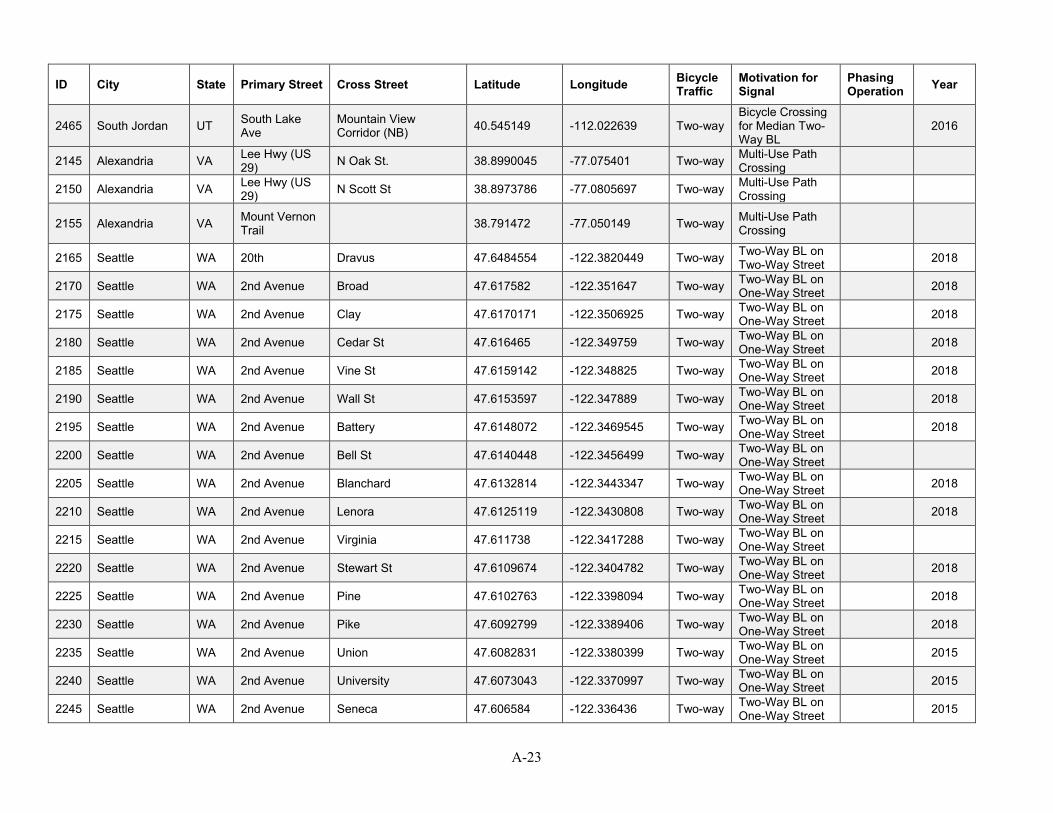
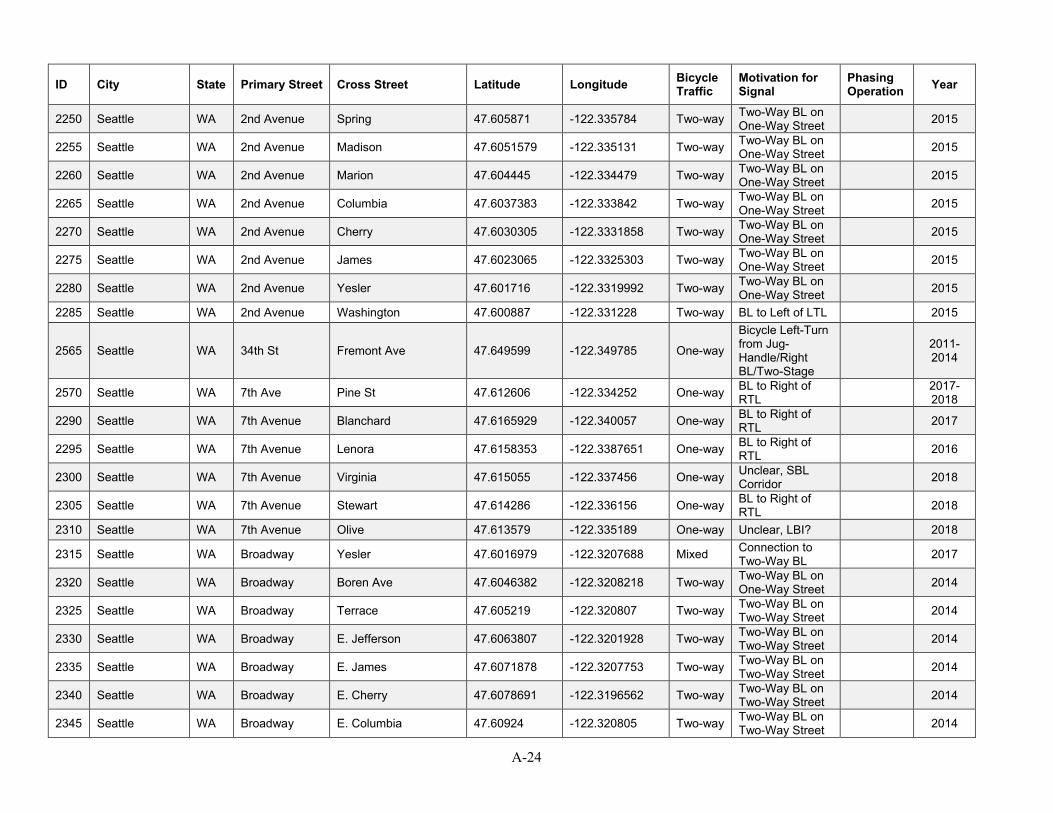
APPENDIX A – LIST OF INTERSECTIONS ..................................................................................... A-1
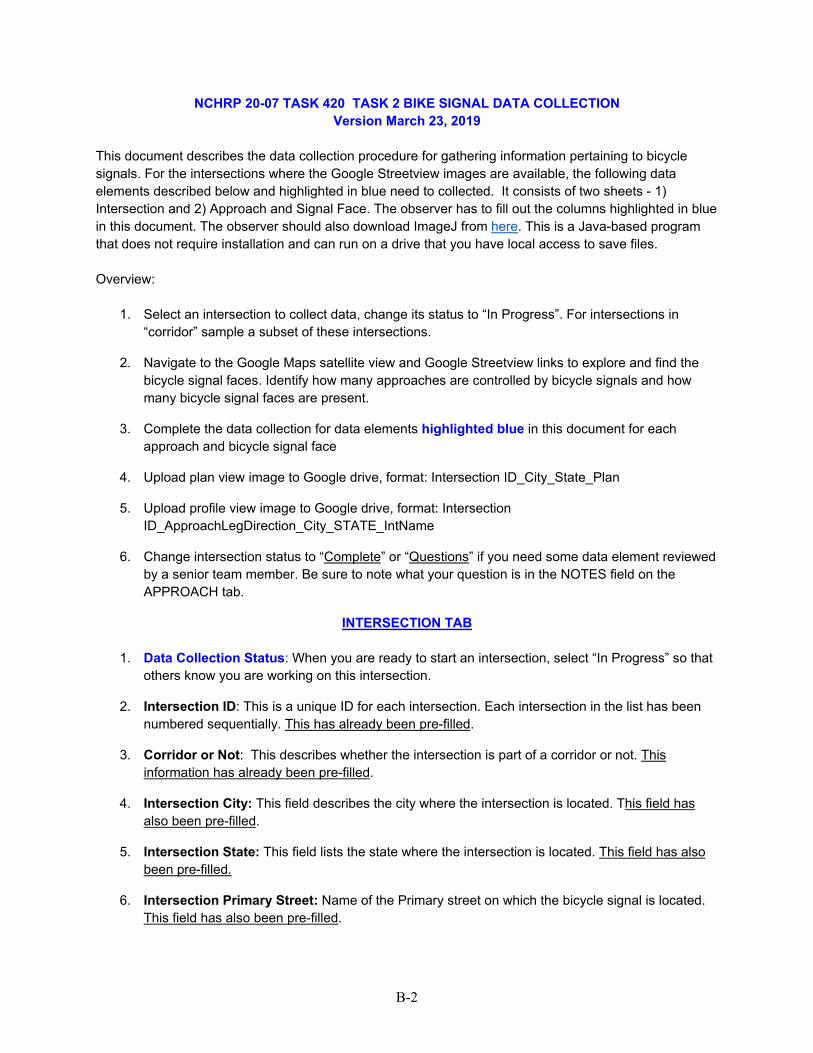
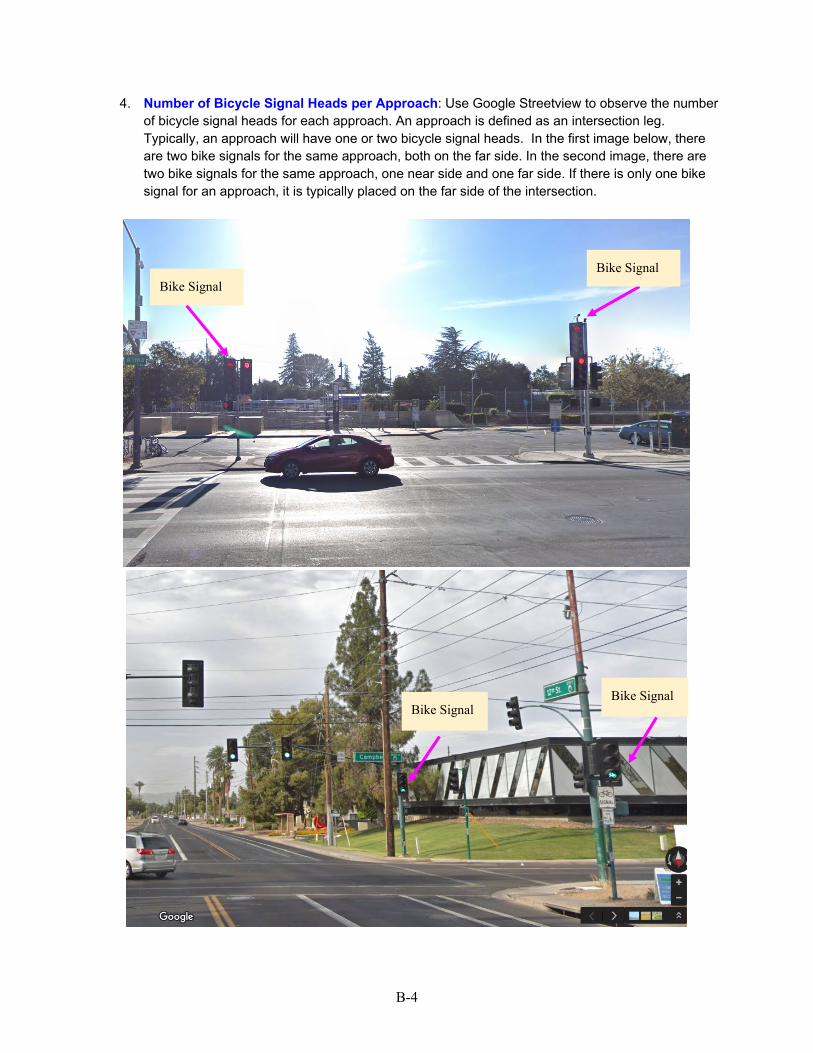
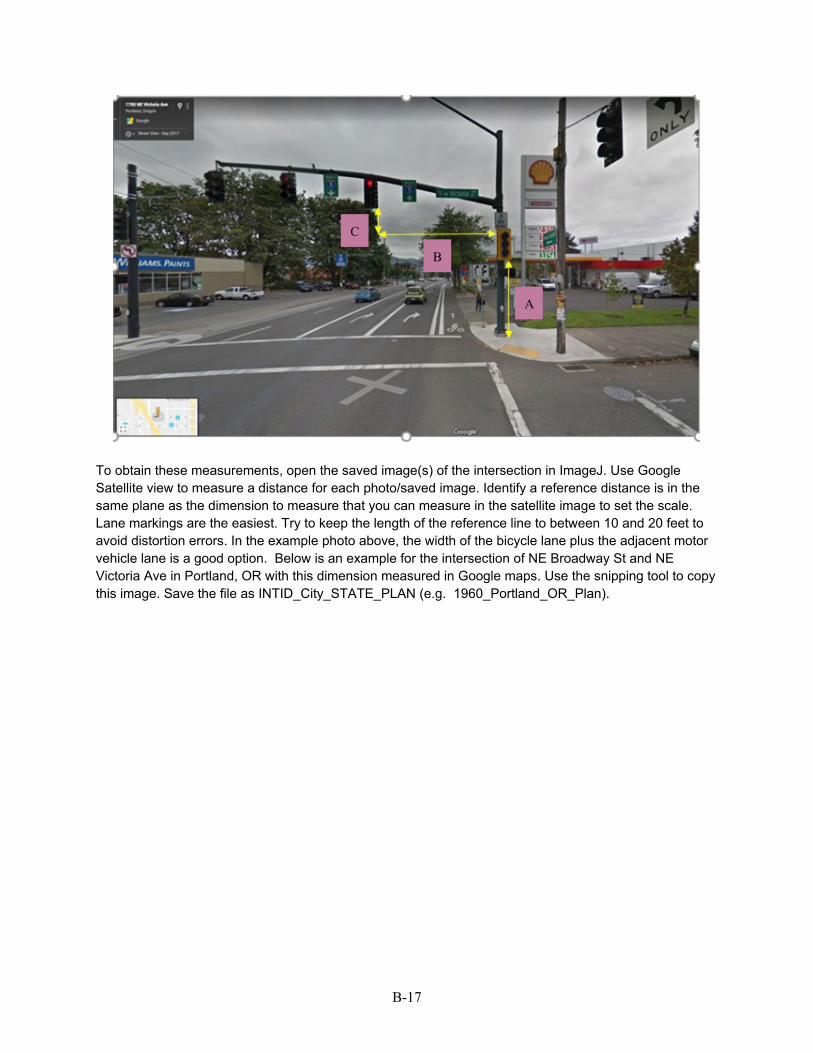
APPENDIX B – DATA COLLECTION PROTOCOL ....................................................................... B-1
APPENDIX C – RESEARCH NEEDS STATEMENTS ..................................................................... C-1
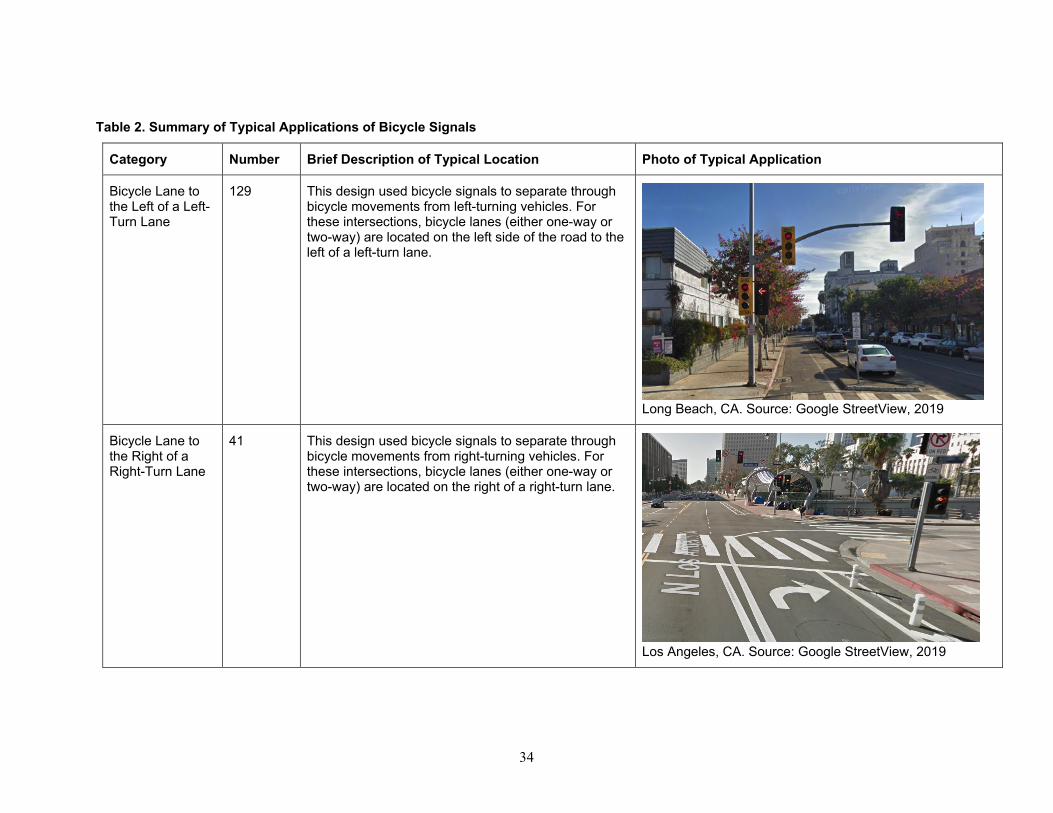
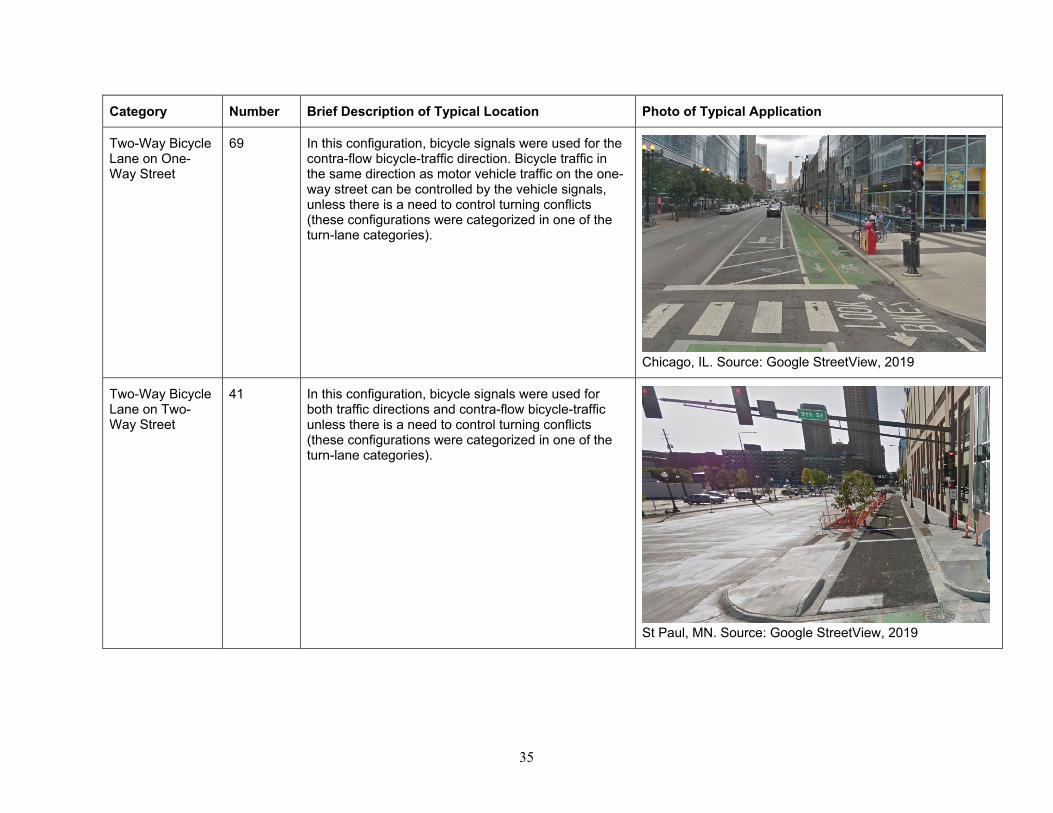
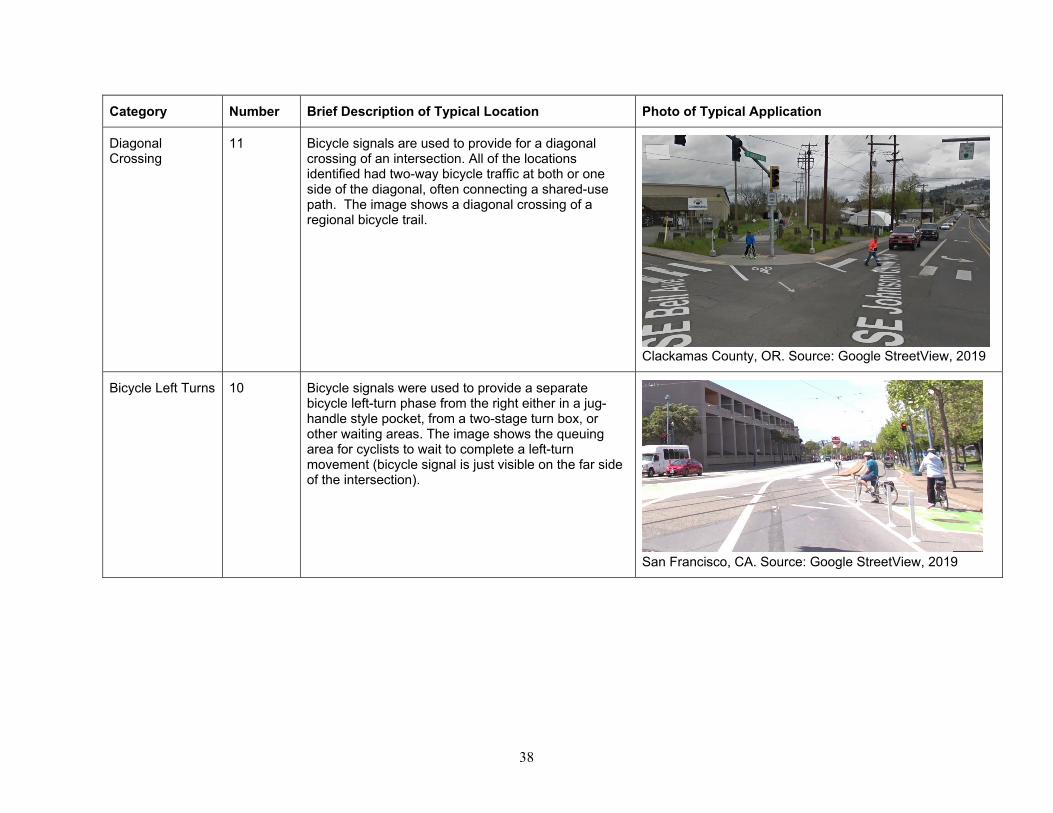
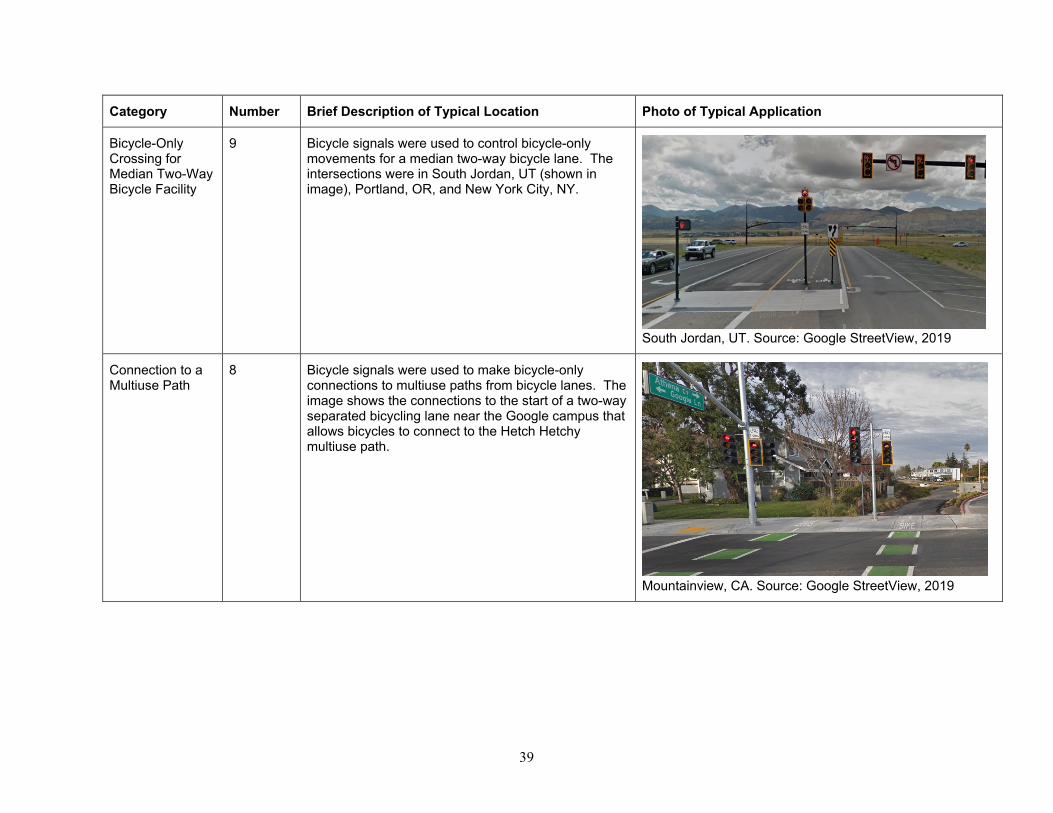
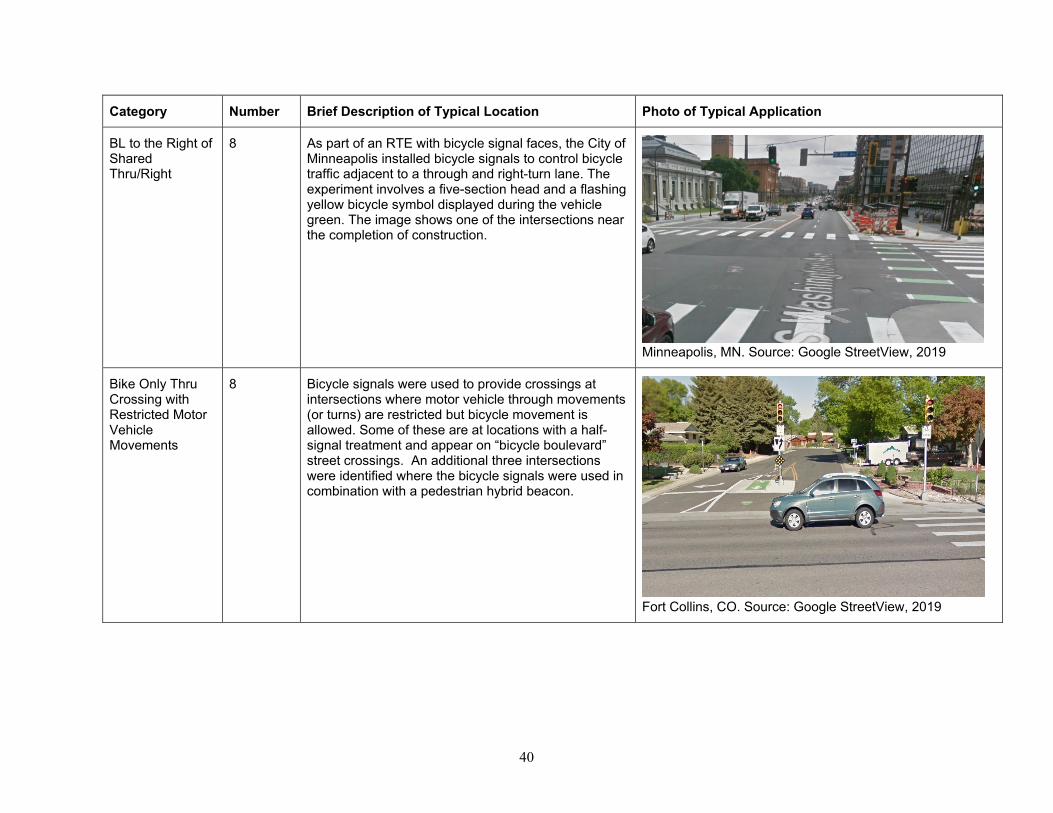
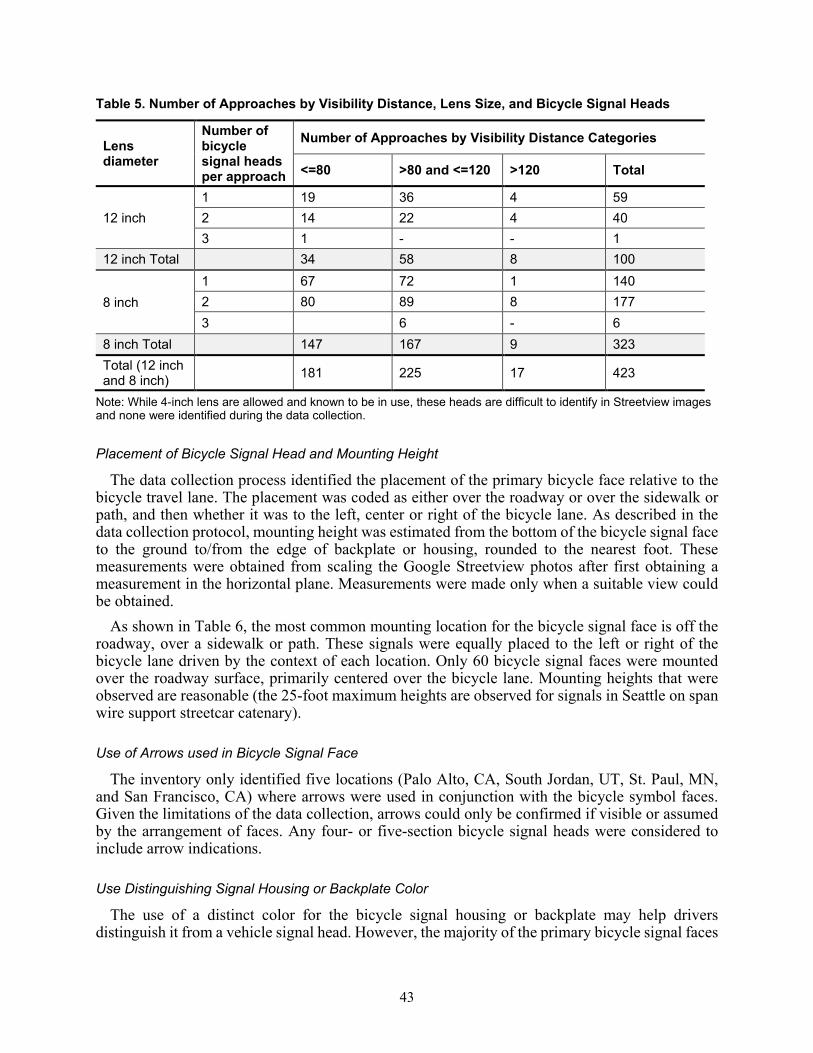
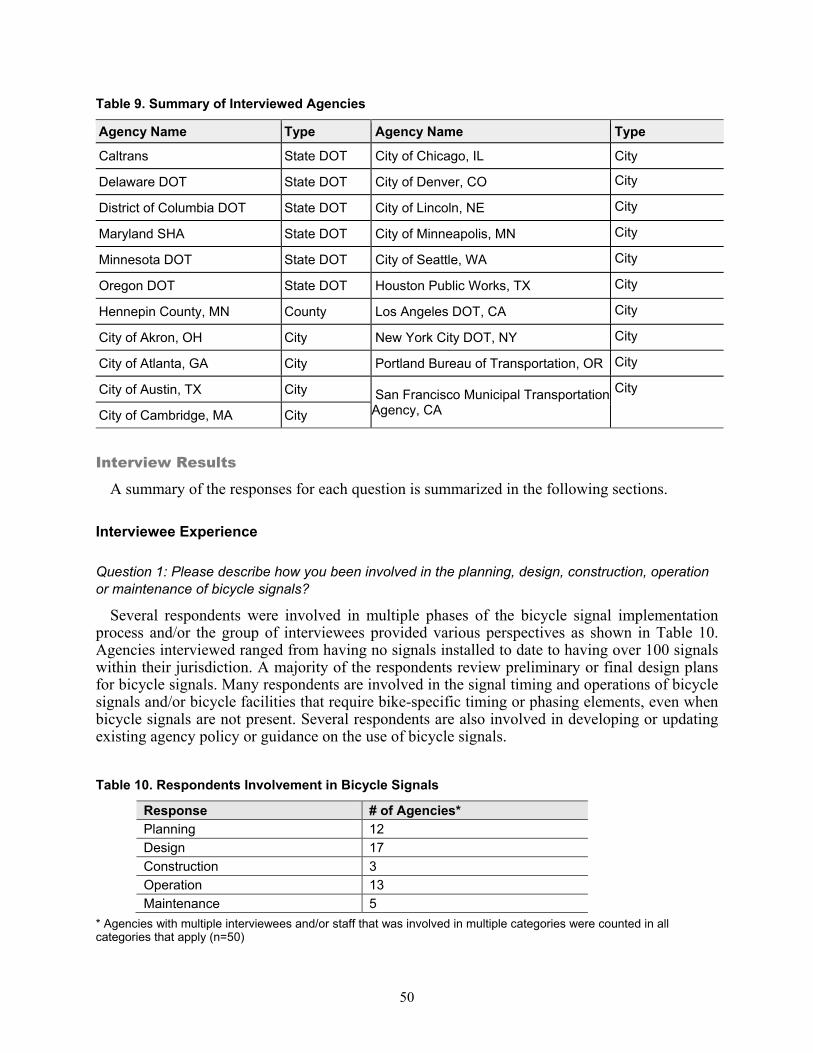
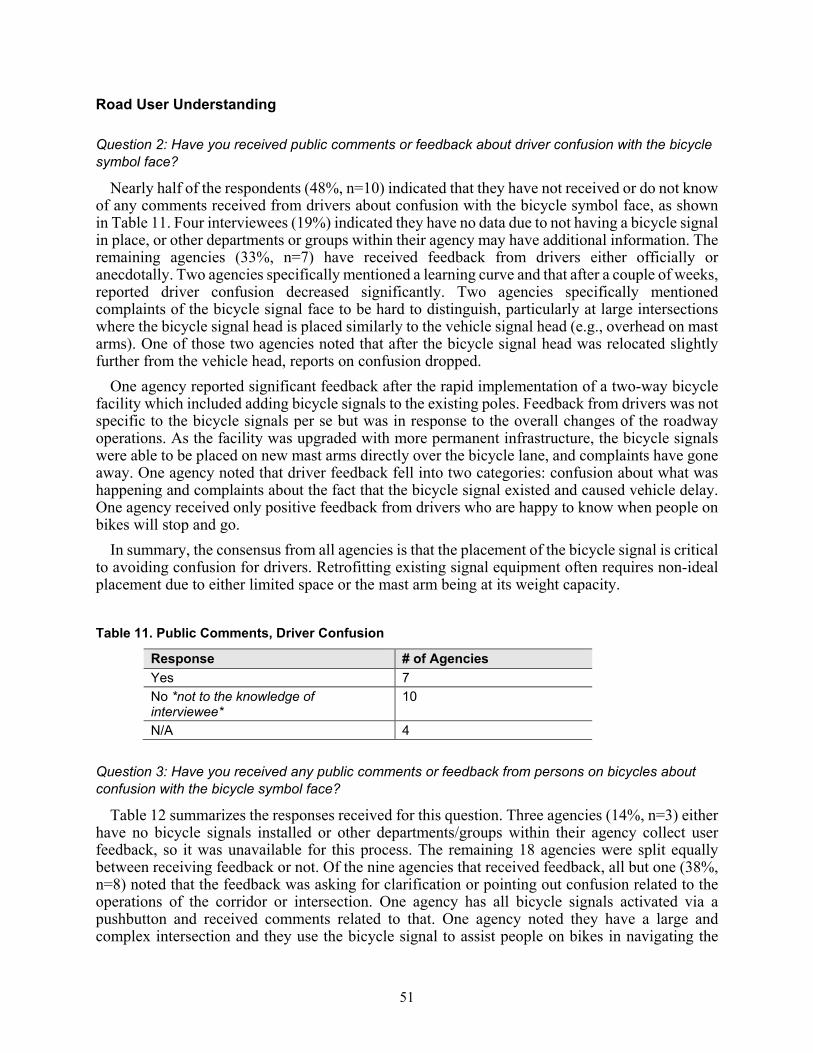
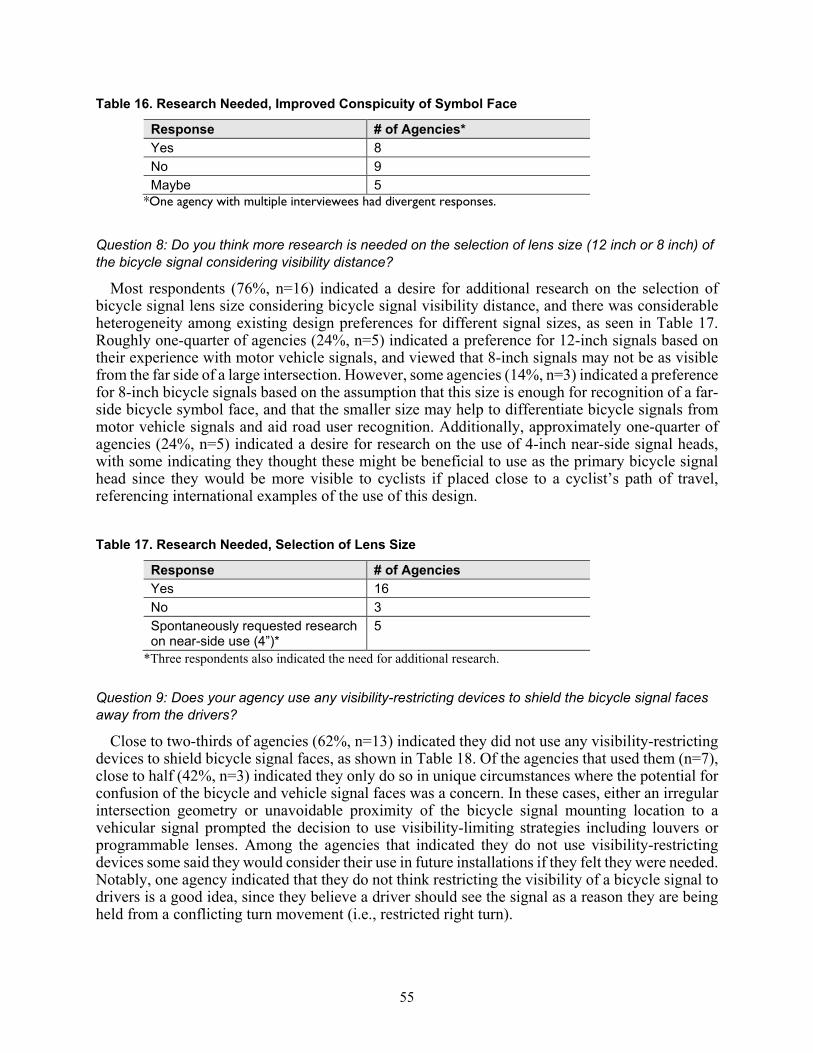
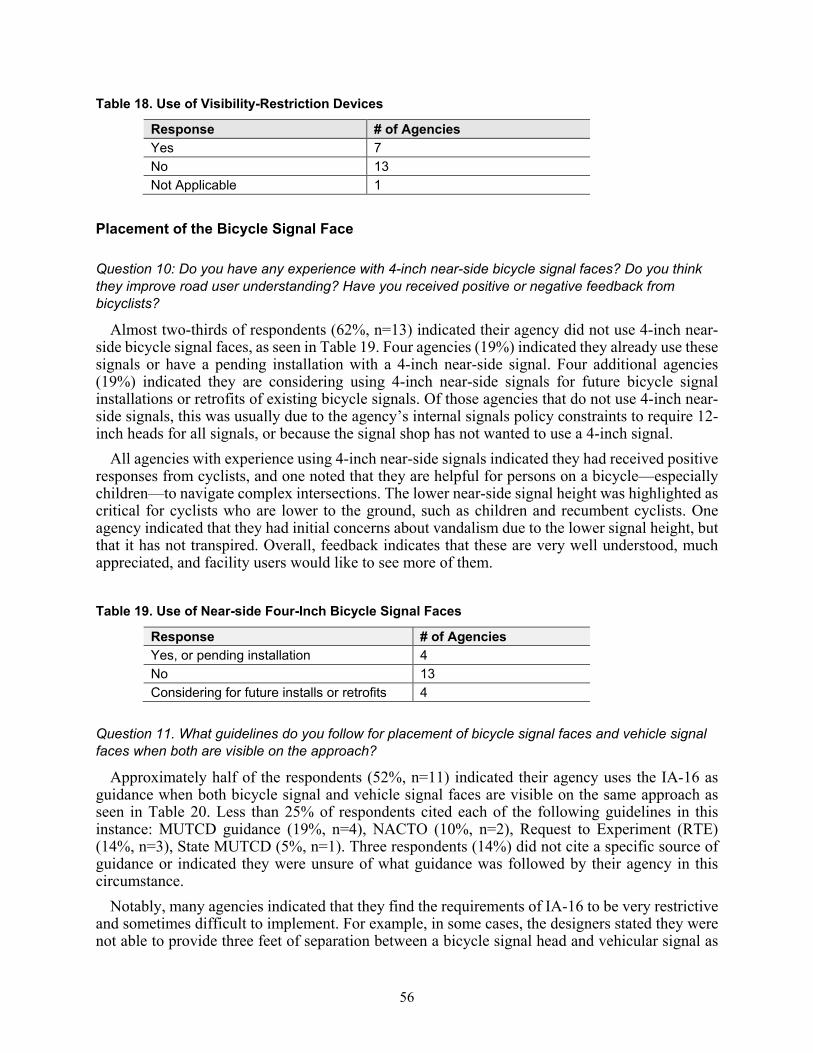
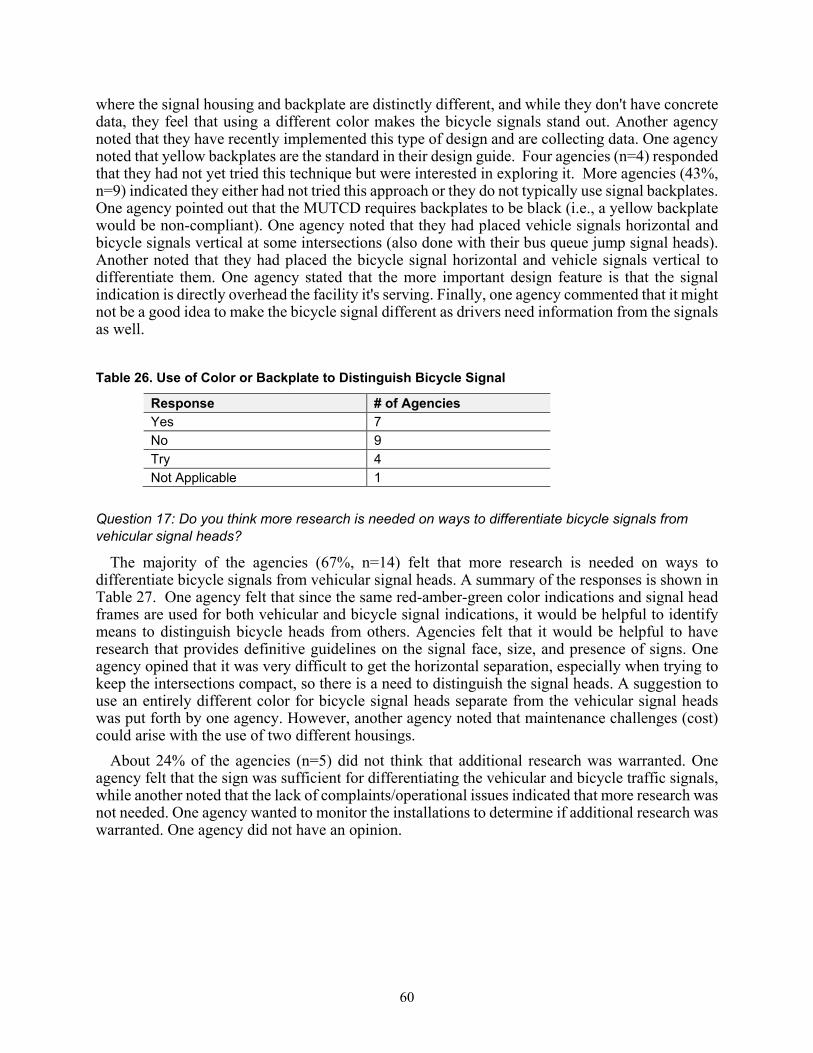
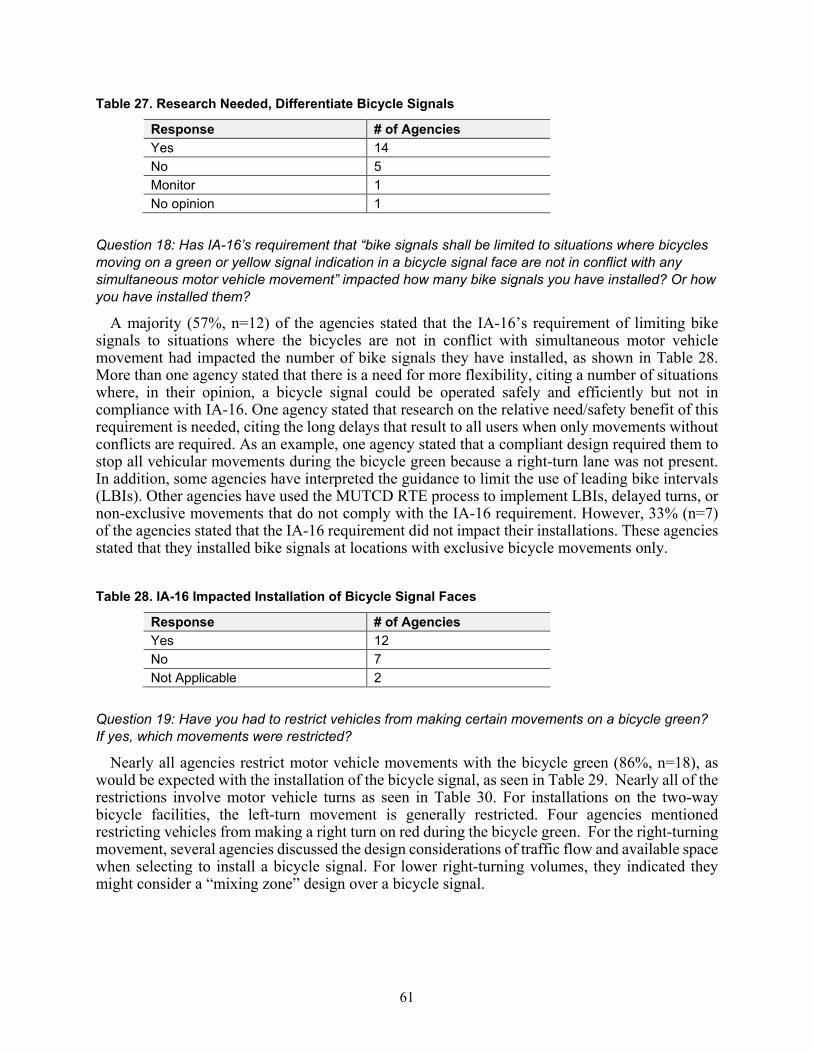
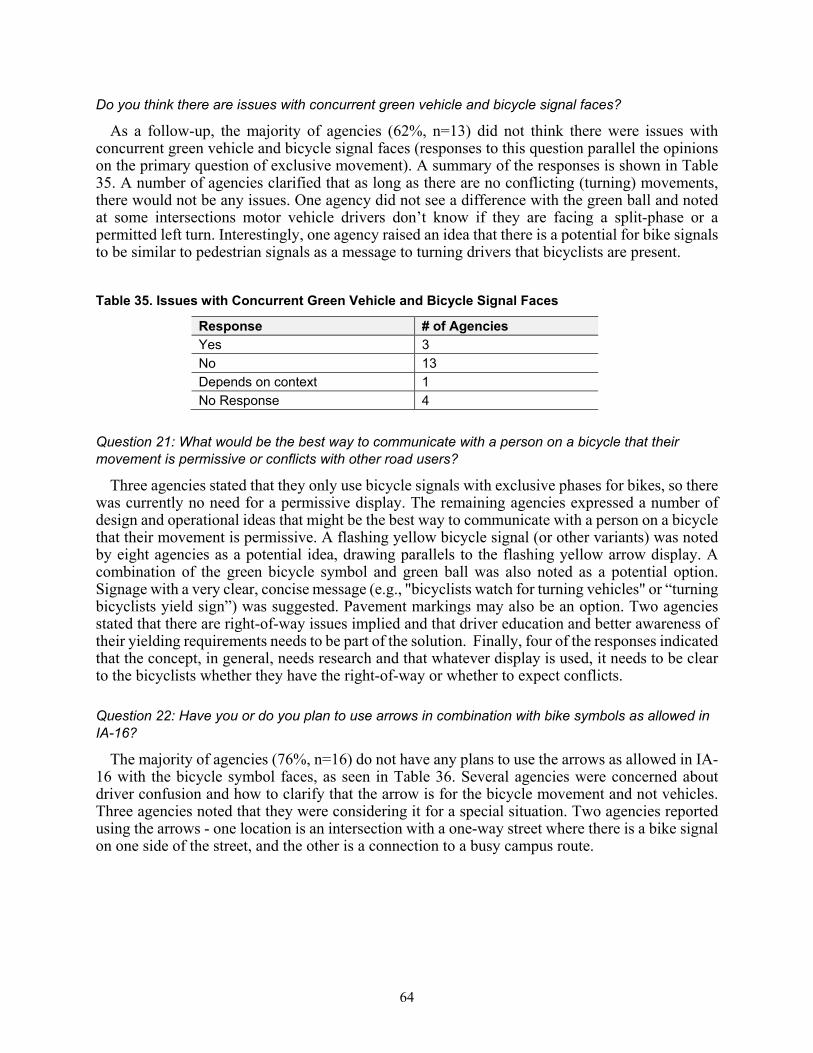
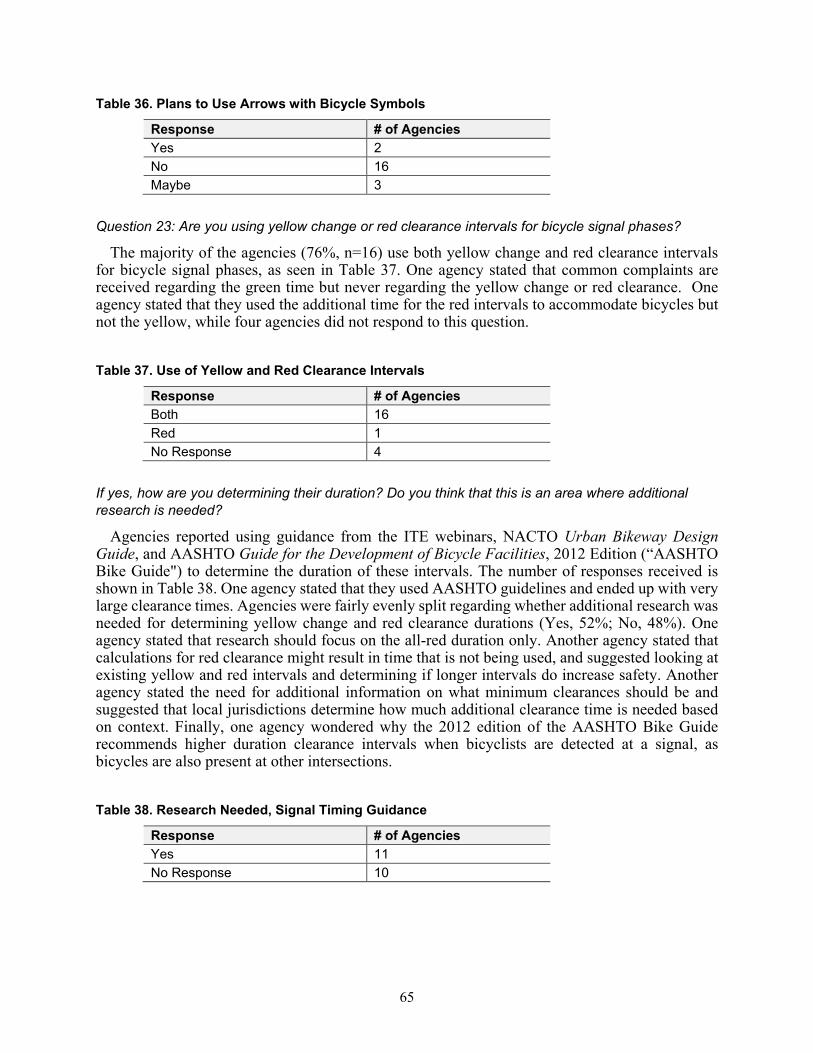
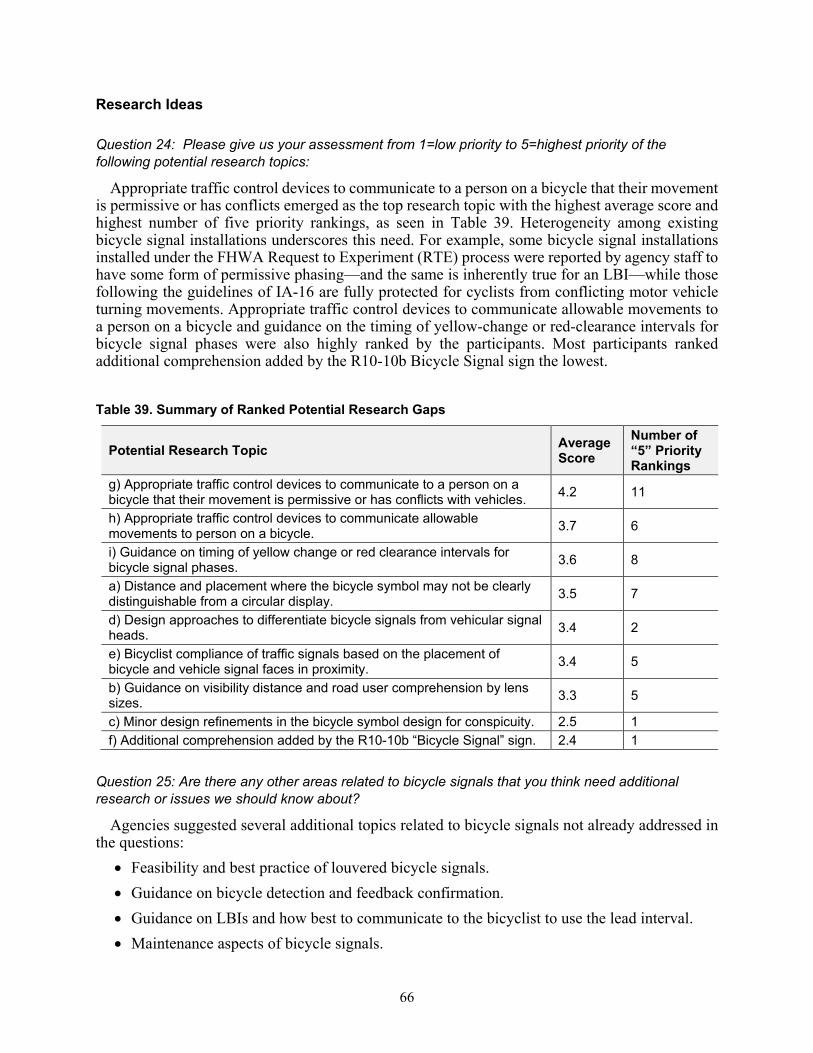
List of Tables Table 1. Intersections with Bicycle Signal Faces by State and Jurisdiction ............................................... 30 Table 2. Summary of Typical Applications of Bicycle Signals .................................................................. 34 Table 3. Number of Intersections by Phasing Type .................................................................................... 41 Table 4. Number of Approaches by Bicycle and Vehicular Signal Heads ................................................. 42 Table 5. Number of Approaches by Visibility Distance, Lens Size, and Bicycle Signal Heads ................ 43 Table 6. Number of Approaches by Placement of Bicycle Signal and Mounting ...................................... 44 Table 7. Horizontal and Vertical Placement of Bicycle Signal Face from Nearest Motor Vehicle Face ... 45 Table 8. Summary of Inventory of Bicycle Symbol in the Signal Face...................................................... 47 Table 9. Summary of Interviewed Agencies ............................................................................................... 50 Table 10. Respondents Involvement in Bicycle Signals ............................................................................. 50 Table 11. Public Comments, Driver Confusion .......................................................................................... 51 Table 12. Public Comments, Persons on Bicycle Confusion ...................................................................... 52 Table 13. Experience with Bicycle/Motor Vehicle Crashes ....................................................................... 53 Table 14. Public Education Efforts ............................................................................................................. 53 Table 15. Is Research Needed, Distance Symbol Face Visible .................................................................. 54 Table 16. Research Needed, Improved Conspicuity of Symbol Face ......................................................... 55 Table 17. Research Needed, Selection of Lens Size ................................................................................... 55 Table 18. Use of Visibility-Restriction Devices ......................................................................................... 56 Table 19. Use of Near-side Four-Inch Bicycle Signal Faces ...................................................................... 56 Table 20. Guidance Used for Placement of Signal Faces ........................................................................... 57 Table 21. Guidance Used for Signal Placement.......................................................................................... 57 Table 22. Study of Compliance Based on Placement ................................................................................. 58 Table 23. Design Constraints for Placing Bicycle Signal ........................................................................... 58 Table 24. Challenges with Installing the R10-10b “Bicycle Signal” Sign .................................................. 59 Table 25. R10-10b Sign Beneficial ............................................................................................................. 59 Table 26. Use of Color or Backplate to Distinguish Bicycle Signal ........................................................... 60 Table 27. Research Needed, Differentiate Bicycle Signals ........................................................................ 61 Table 28. IA-16 Impacted Installation of Bicycle Signal Faces ................................................................. 61 Table 29. Vehicle Movements Restricted During Bicycle Green ............................................................... 62 Table 30. Type of Vehicle Movements Restricted ...................................................................................... 62 Table 31. Duration of Phase Vehicle Movements Restricted ..................................................................... 62 Table 32. Methods for Restricting Vehicle Movements ............................................................................. 62 Table 33. Expectation of Persons on Bicycle for Exclusive Movement on Green Bicycle ........................ 63 Table 34. Confusion, Person on Bicycle with Green Bicycle and Red Vehicle ......................................... 63 Table 35. Issues with Concurrent Green Vehicle and Bicycle Signal Faces .............................................. 64 Table 36. Plans to Use Arrows with Bicycle Symbols ............................................................................... 65 Table 37. Use of Yellow and Red Clearance Intervals ............................................................................... 65 Table 38. Research Needed, Signal Timing Guidance ............................................................................... 65 Table 39. Summary of Ranked Potential Research Gaps ........................................................................... 66
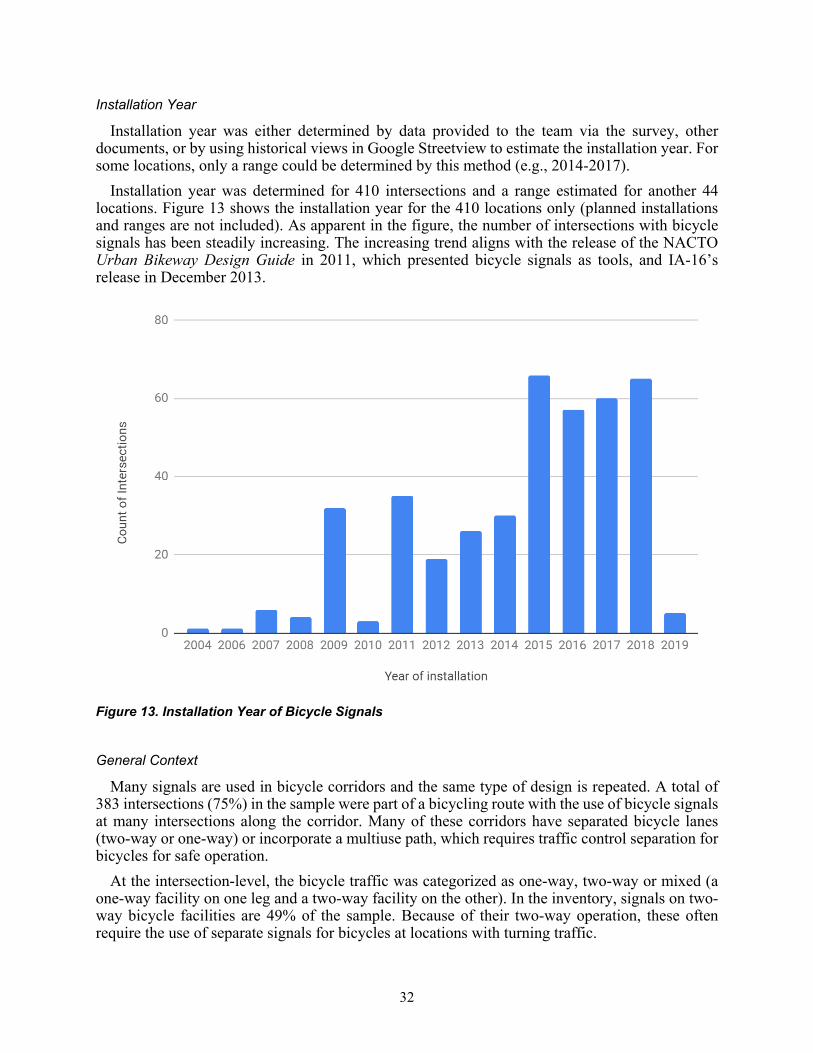
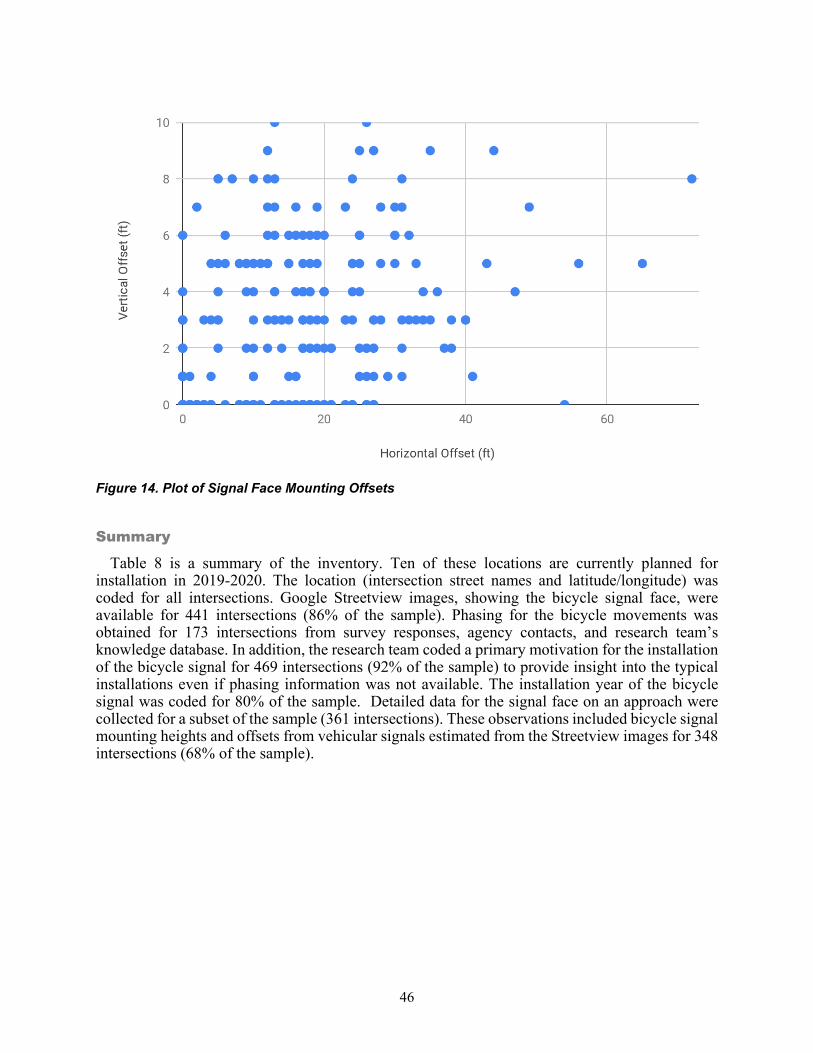
List of Figures Figure 1. Typical Red-Yellow-Green Bicycle Signal Faces (Portland, OR) ................................................ 5 Figure 2. MUTCD Figure 4D-4 on Lateral Placement and Visibility of Primary Traffic Signal Faces ....... 9 Figure 3. Human Information Processing Model. ....................................................................................... 11 Figure 4. Types of Human Factors Evaluation for Traffic Control Devices ............................................... 12 Figure 5. Examples of International Bicycle Signal Faces ......................................................................... 13 Figure 6. Signal Location and Phasing, Russell and Sycamore Lane, Davis, CA ...................................... 15 Figure 7. Traffic Signal at Third Street and Prospect Park West (Brooklyn, NY) ..................................... 16 Figure 8. Observed Cyclist Compliance with Traffic Signals .................................................................... 18 Figure 9. Annotated Image of a Cycle Gate ................................................................................................ 19 Figure 10. Supplemental Signs: Signals, Turn Prohibition, and Lane Control ........................................... 22 Figure 11. Typical Arrangements of Signal Sections in Bicycle Signal Faces ........................................... 28 Figure 12. Map of Intersections with Bicycle Signal Faces ........................................................................ 31 Figure 13. Installation Year of Bicycle Signals .......................................................................................... 32 Figure 14. Plot of Signal Face Mounting Offsets ....................................................................................... 46
1
Summary
The complexity of signalized intersections, especially in busy urban settings, requires that traffic engineers and designers think carefully about the interactions of all modes and users. Geometric and operational conditions sometimes dictate that movements of the various users be separated in time or space for safety or other reasons. While standard vehicular signals can control the movement of people on bicycles, in the U.S. and nearly every other application internationally, they most often consist of a signal with green, yellow, and red bicycle symbols in the face. Before the Federal Highway Administration (FHWA) issued Interim Approval-16 in 2013, use of the bicycle symbol in the signal face in the U.S. was limited to a few jurisdictions. In recent years, however, the number of installations has grown significantly. It is important to note that while an Interim Approval allows for the use of a traffic control device not in the Manual on Uniform Traffic Control Devices (MUTCD), jurisdictions must still submit a written request to the FHWA and comply with all provisions in order to use the bicycle symbol in the signal face. Despite the interim approval and increased use, questions remain about the road user’s understanding of the bicycle signal face. The objective of this research was to summarize and synthesize the U.S. experience with bicycle signal installations to identify any remaining gaps in understanding road user comprehension and compliance with bicycle signals that could be effectively addressed through further research.
Three primary tasks were completed to accomplish these objectives: 1) a literature review, 2) an inventory of existing bicycle signal installations, and 3) interviews with key agency staff. The relevant literature was identified by searching TRID (Transport Research International Documentation) for the appropriate keywords. This literature was supplemented with MUTCD Request to Experiment (RTE) filings (which are approved experiments with traffic control devices not in the MUTCD), and final evaluation reports submitted to FHWA. Grey literature, including evaluation reports by public agencies, blog posts, and popular press stories, were also reviewed. The locations of bicycle signals were identified from an online survey and an existing list maintained by the bicycle technical committee of the National Committee on Uniform Traffic Control Devices. For the 511 intersections where the installation of a bicycle signal was verified, the research team collected data on year of installation, number of bicycle faces, mounting heights, distance from the stop line, use of arrows, lens diameter, use of colored housing or backplates, presence of visibility restricted louvers and a few other data elements, primarily by reviewing Google Streetview images. Structured interviews were conducted with key staff at 21 agencies, which included six state DOTs, 14 cities, and one county to explore their experiences and gather their input on research needs.
The review of the literature found no published research studies that directly addressed visibility and comprehension of the bicycle signal face or the transferability of design assumptions from motor vehicle users. While the research found some anecdotal evidence of driver confusion with bicycle signals due to lack of separation between vehicular and bicycle traffic signal faces, none of the published evaluation reports found evidence of significant user confusion. Examples of research conducted for other traffic control devices such as light-rail transit signals, flashing yellow arrows, bus queue jump signals, and pedestrian countdown timers suggest methods and analysis techniques that could be applied to address research gaps related to bicycle signals.
2
The inventory documented an increasing number of installations of bicycle signals, particularly after 2013. The states with the most intersections with bicycle signals were New York (156), California (70), Illinois (40), Washington (51), Oregon (33), and Texas (26), with large cities in these states being the primary adopters. The research team assessed the primary purpose of using the signal control for bicycles. This assessment found that the most common uses of bicycle signals are to facilitate the contra-flow movement of a two-way bicycle lane and to provide separation when the bicycle lane is placed to the left of a left-turn lane or the right of a right-turn lane. Other purposes include facilitating bicycle connections to two-way facilities or paths, controlling contra-flow and diagonal bicycle movements, facilitating left-turns, and crossings for multiuse paths. Variations in practice suggest potential areas for additional guidance. Though IA-16 requires a second signal face for intersections when the primary signal face is more than 120 feet from the stop line, and suggests a second signal face for more than 80 feet, many installations used two signal heads for bicycles even when the distances to the stop bar were less than 120 feet. Most of the signal faces in the inventory met the horizontal and vertical separation from vehicular signal heads recommended in IA-16. Two-thirds of the lenses with the bicycle symbol in the inventory were 8 inches. Selection of lens size did not have an apparent relationship with visibility distance.
The structured interview consisted of 25 questions on experience with bicycle signals, road user understanding, lens visibility and conspicuity, placement of the bicycle signal face, operations, and research needs. Several clear trends emerged from the interviews as potential research ideas which included:
• Guidance on ways to communicate with a person on a bicycle that their movement is protected or permissive and whether it conflicts with other road users.
• Techniques to differentiate the bicycle signal from motor vehicle signal heads. • Placement of bicycle signals in relation to the driver line of sight. • Guidance on appropriate distance for visibility when using a bicycle signal with a bicycle
symbol face in the lens. • Refinement of the specifications for display intensity and symbol design. • Guidance on selection of lens size considering visibility distance, including 4-inch near-side
signal heads. The agency interviews also identified other research needs not related to road user comprehension, including quantifying the tradeoffs associated with signal timing and phasing strategies for bicyclists, guidance on bicycle detection and feedback confirmation, and examination of current guidelines for the inclusion and duration of yellow change and red clearance intervals.
Finally, the synthesis of the results from the literature review, inventory and interviews identified three research needs in the road user’s understanding of bicycle symbols in the signal face. In priority order, the research needs are:
• Optimal methods to communicate allowable, protected, or permissive movements to bicyclists at signalized intersections.
• Evaluation of size, placement, and orientation of bicycle signal faces on bicyclist and driver comprehension and compliance.
• Guidance on visibility and detection of bicycle symbols in signal faces by lens size and distance.
3
Research needs statements, describing the background, research objectives, and proposed tasks necessary to address the gaps were then developed.
4
C H A P T E R 1
Introduction
The complexity of signalized intersections, especially in busy urban settings, requires that traffic engineers and designers think carefully about the interactions of all modes and users. Geometric and operational conditions sometimes dictate that movements of the various users be separated in time for safety or other reasons. From a human factors perspective, road users must first identify the various signal displays in their visual field, then discriminate which displays apply to them and their movement. Human factors issues of visual acuity, contrast sensitivity, color perception, and expectations contribute to the user’s ability to understand the display (Wickens et al., 1998). Pedestrians, among the most vulnerable of users, have separate displays and timing practices. The displays, consisting of a stencil of a person walking displayed in white and solid or flashing orange with an optional numerical countdown display, is distinct from the circular and arrow red-yellow-green displays used for motor vehicles. Though evidence suggests drivers may use the countdown display for cues about the upcoming clearance time (Kitali et al., 2018), road user confusion with pedestrian signals is not an identified issue. Similarly, light rail transit (LRT) vehicles, when traveling in the right-of-way, are controlled by distinct signals using white bars and triangles. While some early designs featured red and green displays viewable by drivers, which caused confusion (Korve et al., 1996), the current displays are not a concern.
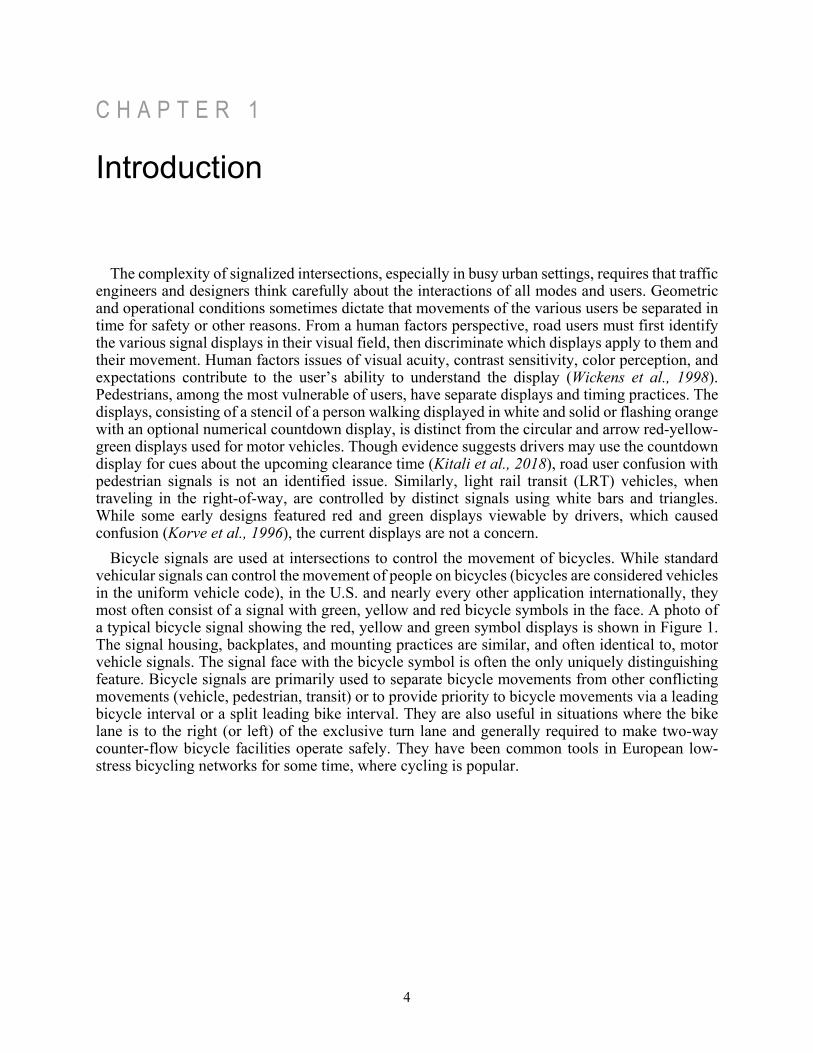
Bicycle signals are used at intersections to control the movement of bicycles. While standard vehicular signals can control the movement of people on bicycles (bicycles are considered vehicles in the uniform vehicle code), in the U.S. and nearly every other application internationally, they most often consist of a signal with green, yellow and red bicycle symbols in the face. A photo of a typical bicycle signal showing the red, yellow and green symbol displays is shown in Figure 1. The signal housing, backplates, and mounting practices are similar, and often identical to, motor vehicle signals. The signal face with the bicycle symbol is often the only uniquely distinguishing feature. Bicycle signals are primarily used to separate bicycle movements from other conflicting movements (vehicle, pedestrian, transit) or to provide priority to bicycle movements via a leading bicycle interval or a split leading bike interval. They are also useful in situations where the bike lane is to the right (or left) of the exclusive turn lane and generally required to make two-way counter-flow bicycle facilities operate safely. They have been common tools in European low-stress bicycling networks for some time, where cycling is popular.
5
Credit: P. Singleton, used by permission Figure 1. Typical Red-Yellow-Green Bicycle Signal Faces (Portland, OR)
The first application of bicycle signals in the U.S. is believed to have been in 1994 in Davis, CA, at the intersection of Russell Boulevard and Sycamore Lane (Pelz et al., 1996). Sometime later following the experiment in Davis, bicycle signals with the bicycle symbol in the face were included in the 2002 update to the California Traffic Manual (1996) and subsequently adopted in the California MUTCD (2006). Nationally, although the MUTCD contained provisions for circular signal indications to control bicycle movements, bicycle symbols in the signal face were not permitted until the “Interim Approval for Optional Use of a Bicycle Signal Face (IA-16)” issued in 2013 (FHWA, 2013). Interim Approval allows for the use of a traffic control device that is not in the MUTCD before it is considered in official rulemaking actions. Any jurisdiction that wants to use the bicycle symbol in the signal face must still submit a written request to the FHWA and comply with all provisions of the approval process as stated in in Section 1A.10 of the MUTCD.
Project Objectives
Prior to IA-16, the use of bicycle-specific signals in the U.S. was limited to a few jurisdictions (Monsere et al., 2013). However, in recent years, the number of installations has grown rapidly. This research identified over 500 intersections using bicycle signals in a variety of contexts. Despite the recent approval and practice, questions remain about the road user’s understanding of the bicycle signal face.
The objective of this research was to summarize and synthesize the U.S. experience with bicycle signal installations to identify any remaining gaps in understanding road user comprehension and compliance with bicycle signals that could be effectively addressed through further research.
Overview of Project by Tasks
To accomplish the objectives, the project had five tasks: Task 1. Review of Existing Published Research; Task 2. Collect Information on Installations of Bicycle Signal Faces;
6
Task 3. Conduct Select Interviews with Key Agency Staff; Task 4. Develop Recommendations for Targeted Research; and Task 5. Final Report.
Purpose and Organization of Report
The purpose of this report is to document the results of the project’s tasks and present the identified research gaps. The remainder of the report is organized as follows. Chapter 2: Background and Literature Review provides a brief review of the human factors concepts of visibility, comprehension, compliance, and driver error focused on traffic signal faces. Additionally, a review of the literature, including published evaluation reports and blog posts that relate to bicycle signals with a focus on comprehension and visibility of signal-type traffic control devices, is provided. Chapter 3: State of the Practice and Inventory describes the current design guidance and the results of the inventory of intersections in the U.S. with traffic signals that use the bicycle symbol. Chapter 4: Key Agency Interviews documents the results of interviews with agency staff experienced with designing and operating traffic signals for bicycles. Finally, Chapter 5: Identified Research Gaps presents the research needs that emerged to improve road user understanding of bicycle signal faces on traffic signals. Appendix A is a list of the intersections with bicycle signals that were inventoried. Appendix B is the data collection protocol and method. Appendix C is the research needs statements in the AASHTO/NCHRP format.
7
C H A P T E R 2
Background and Literature Review
Relevant literature was identified by searching TRID (Transport Research International Documentation) for the appropriate keywords. This literature was supplemented by reviewing the list of references identified for the upcoming update to the chapter on bicycle signals in the AASHTO Guide for the Development of Bicycle Facilities led by project team member Toole Design Group. The research team also contacted the MUTCD office to get access to any Request to Experiment (RTE) and final evaluation reports related to bicycle symbols in signal faces. In addition, the team searched the grey literature for published evaluations, blog posts, and popular press stories using standard Google searches.
Basic Human Factors Concepts
The MUTCD provides a variety of guidance and support associated with the principles of traffic control devices (TCDs). Explicitly, the MUTCD (FHWA, 2009) states that “The proper use of traffic control devices should provide the reasonable and prudent road user with the information necessary to efficiently and lawfully use the streets, highways, pedestrian facilities and bikeways.” This report places particular emphasis on the bicyclist as the road user of concern operating on streets and bikeways that cross through signalized intersections. The following subsections provide content on the visibility, comprehension, compliance and human error, and evaluation methods for traffic control devices focused on traffic signals.
Visibility
Traffic signals must have an acceptable legibility distance for the intended road user. Legibility distance is defined as the distance from which the road user can detect the message conveyed by the traffic signals. The distance must be sufficient for the road user to comprehend the message and initiate the correct response to classify the traffic signals. Traffic signals should be placed in a conspicuous location with a clear line of sight to the road user but also in a way that is consistent with road user expectancy (Borowsky et al., 2008a).
Many studies of visibility have dealt with characterizing the role of top-down and bottom-up attentional processes in controlling human attention under various circumstances. Wickens et al. (2001) suggested the salience, effort, expectancy, and value (SEEV) model for describing the human selective attention allocation. Wickens’s model is based on the general principle of the two attentional-perceptual processes (i.e., top-down and bottom-up). Following Wickens’s model, SEEV are the factors that explain how people allocate their selective visual attention. Salience, or capturing the properties of events, and effort, or the movement of attention across longer distances, are the bottom-up components of the model and expectancy, or the likelihood of seeing an event at a particular location, and value, or the importance and relevance of tasks served by the attended event, are the top-down components of the model (Wickens et al., 2001). This model, and its specific components (e.g., expectations) were frequently investigated in studies of driving
8
behavior (Borowsky et al., 2008b; Horrey et al., 2006; Langham et al., 2002; Richard and Lichty, 2013; Werneke and Vollrath, 2012; Wickens and McCarley, 2008).
The first step in creating a visible traffic signal relies on it being easily and rapidly detected by the road user. The signal should be positioned in such a way that would make it easy for the road user to detect and understand it. To optimize placement, both top-down and bottom-up attentional-perceptual processes should be supported. Target detection, visual search, and attention allocation are driven by both top-down and bottom-up processes. These processes are based on stimulus and sensory input, and are influenced by the user’s experience and knowledge-based, contextual, and mental schemes.
To ensure that the traffic signals are visible to the road user, designers should consider the size, design, and placement of the device. A road user’s cone of vision can be defined as excellent from three to five degrees. At 10 degrees, road users have a clear vision where texture, shape, size, color, shading, and other visibility parameters can be distinguished easily. At 20 degrees, road users maintain satisfactory vision where regulatory and warning traffic control devices can be well perceived. At 70 to 90 degrees defines the cone of peripheral vision, where road users primarily see movement (Schieber et al., 2009).
Expectation is an important factor that predicts where drivers will focus their attention while searching for valuable information on the road, such as oncoming traffic or traffic signals. A road user’s expectation can be derived from a short-term situational context or from mental schemas that are based on long-term knowledge and experience. As an example, in short-term, situational-context when a task-relevant events’ stream (e.g., stream of traveling vehicles from a specific direction) is higher in a particular place, the likelihood (i.e., expectation) of seeing a relevant event (e.g., an arriving vehicle) at that location will increase, eventually resulting in higher attention to that location (Werneke and Vollrath, 2012). The detection of traffic signals will often rely more on expectations that are derived from long-term knowledge and experience than on contextual events. Thus, placement of traffic signals faces in a way that is not consistent with drivers’ mental schemes can decrease the possibility of drivers’ correct and timely identification of traffic signals significantly. Research by Borowsky et al. found that incorrect placement of traffic signals can decrease the chance of correct identification by approximately 50% and extend the total fixation time (the total duration of time spent looking at a specific location) needed on the traffic signals until correct identification by several hundreds of milliseconds (Borowsky et al., 2008a, 2008b).
Many of these concepts are embedded in the MUTCD which describes the requirements for placement of the primary vehicular signal faces. As defined by the MUTCD (2009) on signalized intersection approaches with 85th-percentile speeds of less than 45 mph, the minimum distance of signal faces of any diameter from the stop line is 40 feet. However, the maximum distance from the stop line to an 8-inch signal face is 120 feet, and the maximum distance from the stop line to a 12-inch signal face is 180 feet. Figure 2 summarizes this information. This information has not been explored for validity or for variations when adapted for persons on a bicycle.
9
Source: MUTCD Figure 2. MUTCD Figure 4D-4 on Lateral Placement and Visibility of Primary Traffic Signal Faces
Comprehension
After the road user detects the traffic signals, the user must recognize, identify, and comprehend its meaning. With correct comprehension, the road user can initiate a correct action by complying with the directive (e.g., stop in response to a circular red indication). The comprehension of traffic signals is critical for road user safety. Thus, designing traffic signals that are easily recognized and understood is crucial, especially in the case of new, unfamiliar, or uncommon signals. To significantly increase the probability of correct recognition and comprehension, signal design should follow the ergonomic principals for display design (e.g., compatibility, familiarity, and standardization) (Sanders and McCormick, 1993; Ben-Bassat and Shinar, 2006; Shinar et al., 2003).
Comprehension of traffic signals by road users is a critical factor in compliance and, ultimately, in the device operating correctly. Even though the meaning and state of traffic signal indications
10
can be easily interpreted, they can still be misunderstood for the same reasons as traffic signs, especially uncommon or newly introduced traffic signal indications.
For traffic control devices, the comprehension of traffic signs can be more challenging than the comprehension of traffic signals and is attributed to the nontrivial meaning and greater variance of messages that are communicated through traffic signs (Dissanayake and Lu, 2001). In a cross-cultural traffic signs comparison study, Shinar et al. (2003) suggested that traffic signs that follow good ergonomic design principals are more likely to be fully comprehended than signs that violate these guidelines, which was validated in a later in-depth study (Ben-Bassat and Shinar, 2006). Ben-Bassat et al. (2006) examined relevant ergonomic design principles (Sanders and McCormick, 1993) for the purpose of increasing sign comprehension rates. This study identified physical and conceptual compatibility, standardization, and familiarity as relevant principals that, when applied correctly, can increase the comprehension of a traffic sign by road users. In accordance with those principals, a traffic sign should be consistent with what it represents to facilitate the mental associations of road users (e.g., traffic signal picture represents the presence of nearby traffic signal). A traffic sign should also follow the same norms (i.e., colors, symbols, shapes, sizes, etc.) used in existing similar traffic symbols (e.g., in a traffic signal the color red should communicate “stop” and green “go”).
Compliance and Human Error
Once the road user recognizes the traffic signals and understands their meaning, the user is required to comply with the directive information in a timely manner. For that reason, the traffic signal should encourage the desired behavior from the road user by design. Non-compliance can stem from two reasons: 1) intended violation or 2) human error (e.g., not seeing the traffic signal, misreading, misunderstanding, or mistaking it with another traffic signal.
Errors can be defined as occasions where the user’s intended performance was acceptable, but it fell short (such as intending to drive at or below the speed limit, but accidentally pressing the accelerator pedal too far (a slip), forgetting the speed limit (a lapse), or thinking that the speed limit is 70 mph when it is actually 60 mph (a mistake)). In contrast, intentional violations may be defined as occasions where the driver intended to perform the action, such as deliberately exceeding the speed limit. Driver error has been identified as a direct cause of at least two-thirds of the crashes, according to some estimations from the U.S. ( Hankey et al., 1999; Wierwille et al., 2002).
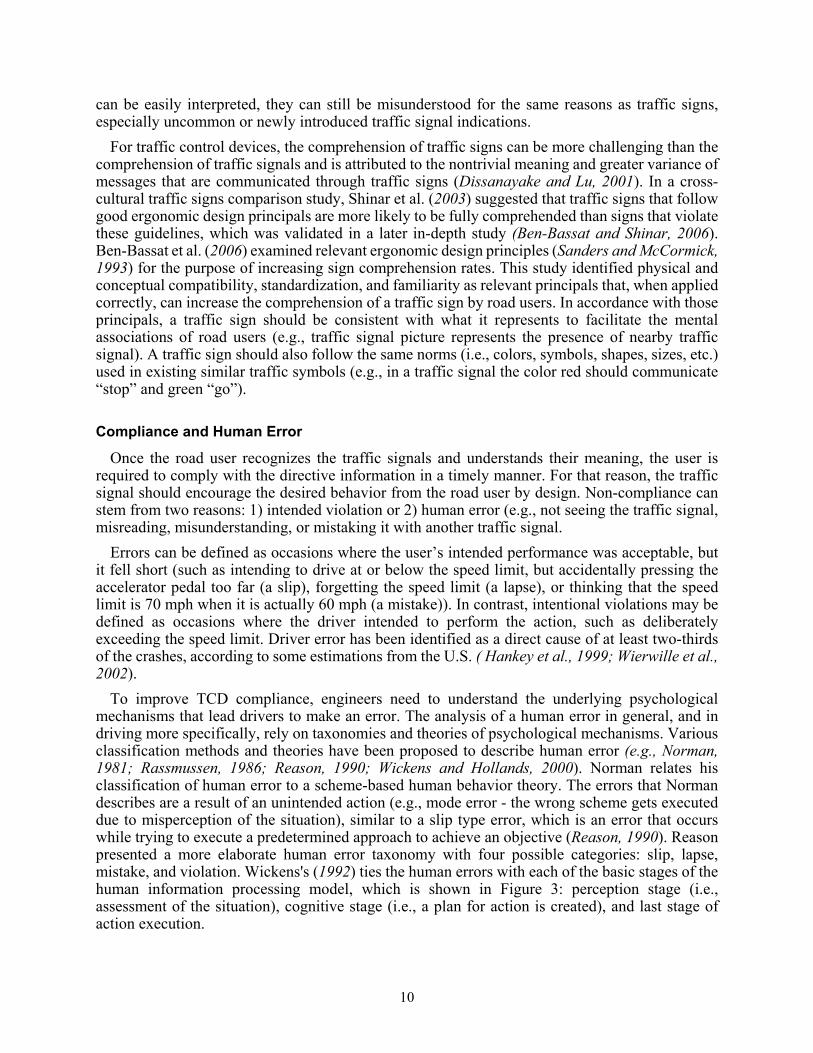
To improve TCD compliance, engineers need to understand the underlying psychological mechanisms that lead drivers to make an error. The analysis of a human error in general, and in driving more specifically, rely on taxonomies and theories of psychological mechanisms. Various classification methods and theories have been proposed to describe human error (e.g., Norman, 1981; Rassmussen, 1986; Reason, 1990; Wickens and Hollands, 2000). Norman relates his classification of human error to a scheme-based human behavior theory. The errors that Norman describes are a result of an unintended action (e.g., mode error - the wrong scheme gets executed due to misperception of the situation), similar to a slip type error, which is an error that occurs while trying to execute a predetermined approach to achieve an objective (Reason, 1990). Reason presented a more elaborate human error taxonomy with four possible categories: slip, lapse, mistake, and violation. Wickens's (1992) ties the human errors with each of the basic stages of the human information processing model, which is shown in Figure 3: perception stage (i.e., assessment of the situation), cognitive stage (i.e., a plan for action is created), and last stage of action execution.
11
Source: Wickens, C.D., Hollands, J. Banbury, S. Parasuraman, Engineering Psychology and Human Performance, Fourth Edition, Routledge, Taylor and Francis Group, 2013. Used by permission. Figure 3. Human Information Processing Model.
In this model, mistakes are a consequence of failures in the first two stages (understanding of the situation and/or planning of the action), lapses are a result of a poor cognition process (specifically, failure in retrieval from memory) and slips are a result of failures in the execution of the action. Reason (1990) also suggested that errors can be attributed to each of the three levels of the model of cognitive control. Thus, errors can be a result of failures in actions that are skill, rule, and/or knowledge-based. Tasks that the human is very skilled with, as a result of vast experience, will be executed almost automatically (i.e., no need for thought), and thus, failures would often be a result of bad execution of good intention (i.e., slips and lapses). Less common tasks will require more cognitive effort of the human, either to recall a preferred and known response (i.e., rule-based) or, in the less common case, to plan a course of action based on individual knowledge; in this case the failure can be a consequence of an incorrect assessment of the situation or bad planning (i.e., mistake).
Evaluation Methods for Traffic Control Devices
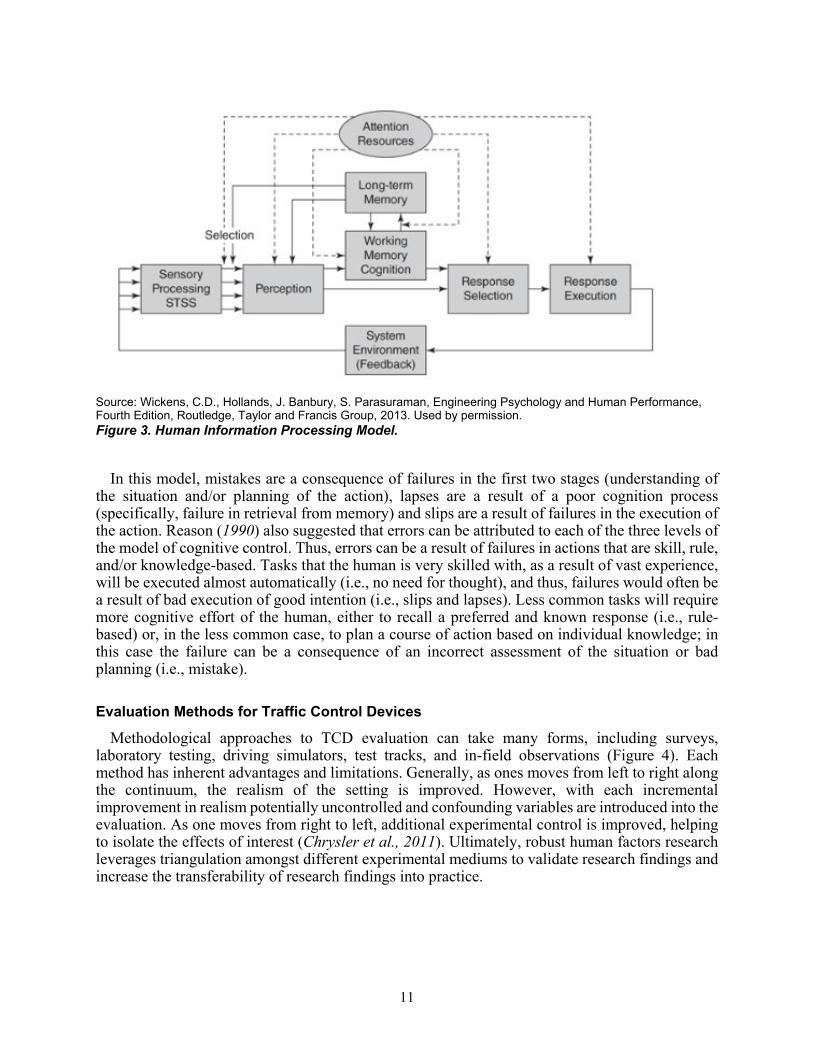
Methodological approaches to TCD evaluation can take many forms, including surveys, laboratory testing, driving simulators, test tracks, and in-field observations (Figure 4). Each method has inherent advantages and limitations. Generally, as ones moves from left to right along the continuum, the realism of the setting is improved. However, with each incremental improvement in realism potentially uncontrolled and confounding variables are introduced into the evaluation. As one moves from right to left, additional experimental control is improved, helping to isolate the effects of interest (Chrysler et al., 2011). Ultimately, robust human factors research leverages triangulation amongst different experimental mediums to validate research findings and increase the transferability of research findings into practice.
12
Source: Chrysler et al., 2011. Used by permission. Figure 4. Types of Human Factors Evaluation for Traffic Control Devices
Visibility and Comprehension of Bicycle Signal Face
No published research studies were found that have directly addressed the visibility of the bicycle signal face. Visibility includes placement for optimal detection by road users, conspicuity of the lens, and detection distances. There are two separate issues related to the comprehension of the bicycle symbol in the signal face: 1) recognizing that the symbol face denotes the signal as exclusive for bicycles, and 2) knowing which movements are allowed by the indications given by the bicycle signal. No published research studies were found that have directly addressed comprehension of the bicycle symbol in the signal face, either for bicyclist or drivers.
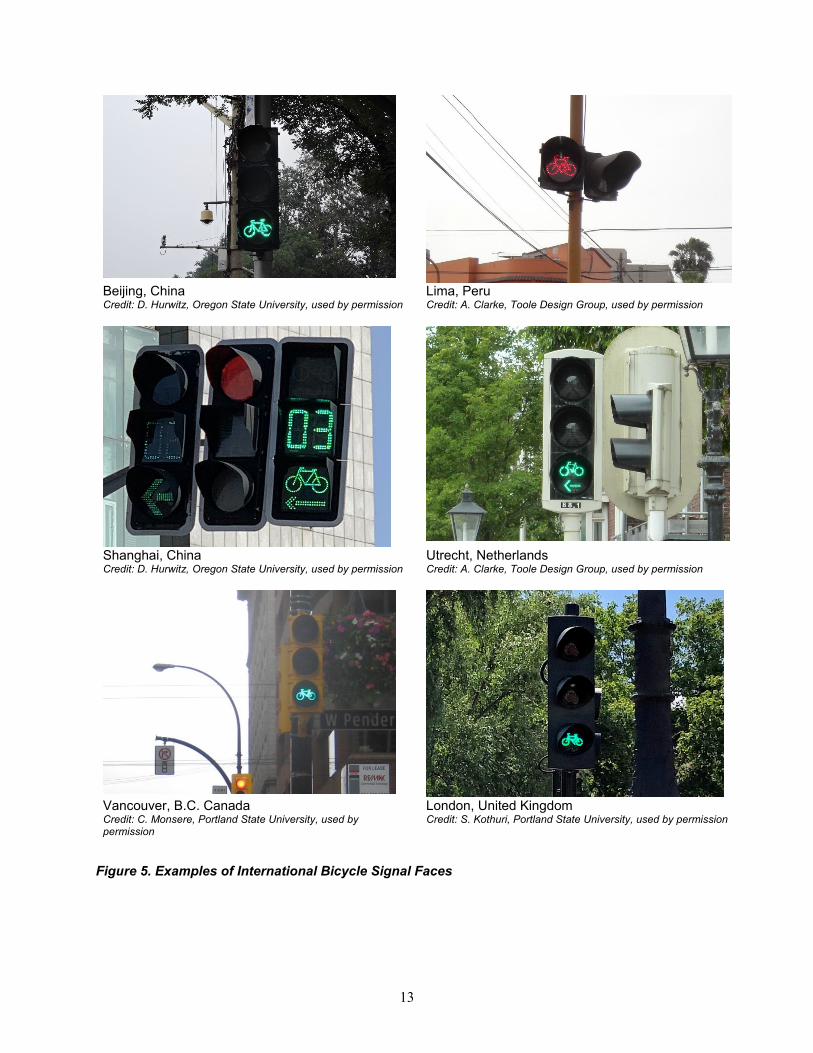
The use of the bicycle symbol in signs, pavement markings, and signal faces, however, is a widespread and international practice. In a review of signs and signals for cyclists and pedestrians in 13 countries (Austria, Belgium, Denmark, France, Germany, Italy, Norway, Poland, Russian Federation, Spain, Switzerland, United Kingdom and the U.S.) for the United Nations, Hiron et al. (2014) found that nearly all symbols feature a similar version of the bicycle (although sometimes a person is shown riding the bicycle). The study notes that most of the countries reviewed also have three-section faces with bicycle symbols in the lens.
Figure 5 shows a variety of bicycle signal faces in international use. All of the symbols are very similar, though the faces from the Utrecht, Netherlands, and Shanghai, China, include an arrow in the bicycle symbol face.
13
Beijing, China Credit: D. Hurwitz, Oregon State University, used by permission
Lima, Peru Credit: A. Clarke, Toole Design Group, used by permission
Shanghai, China Credit: D. Hurwitz, Oregon State University, used by permission
Utrecht, Netherlands Credit: A. Clarke, Toole Design Group, used by permission
Vancouver, B.C. Canada Credit: C. Monsere, Portland State University, used by permission
London, United Kingdom Credit: S. Kothuri, Portland State University, used by permission
Figure 5. Examples of International Bicycle Signal Faces
14
Published Evaluation Reports
While no published research studies were found regarding comprehension on the use of the bicycle signal indications, several published reports include brief assessments of visibility and comprehension of the bicycle signal face.
As mentioned in the introduction, the city of Davis, CA, is believed to have installed the first bicycle signal in the U.S. in 1994. A published evaluation report describing the evaluation of the Davis signal was prepared for the California Traffic Control Devices Committee by Pelz et al. (1996). The bicycle signal heads, consisting of red-yellow-green 12-inch circular displays with the bicycle symbol in the face were installed at the 3-leg intersection of Russell Boulevard and Sycamore Lane near the University of California, Davis campus. The geometry of the intersection and the location of the bicycle signal heads are shown in Figure 6. The south leg of the intersection is a multiuse path and there are no northbound vehicles. Modifications to the signal phasing provided for the exclusive north and south movement of bicycle traffic. For the southbound left- and right-turn vehicle movements and bicycle movements, both the vehicular and bicycle signal faces were visible to each road user. The evaluation included a before-after survey of users and review of crash and citation data. In the after survey, a question was asked whether the respondent thinks that “seeing the round red signal with the green bicycle signal is confusing to drivers?” A total of 191 persons responded to this question and 33% (n=64) indicated “Yes.” The crash and citation data revealed no issues. In the opinion of the authors, placing the bicycle signal in locations visible to motorists resulted in a clear understanding of the bicycle signal by motor vehicle users. The evaluation did note a learning curve for drivers (early in the evaluation period some drivers would go during the green bike phase). In conclusion, the study noted that over the long-term there were no issues and that “once the signal has become operational the signal is easy to understand by both cyclist and motorists.”
Of official Requests to Experiment (RTE) with bicycle signal faces conducted before IA-16 was issued that are listed on the MUTCD website, only the final report from the City and County of Denver was available (Denver, 2009). The experiment evaluated signal compliance at an intersection with a shared path. The evaluation consisted of three phases – pre-installation or baseline condition, post-installation, and post-removal of the bicycle traffic signal head. In the pre-installation phase, the data was collected with the presence of a conventional pedestrian signal and no bicycle signal. In the post-installation phase, data were collected after the installation of a bicycle signal. In the post-removal phase, data were collected after the removal of the bicycle signal and with the presence of a pedestrian countdown timer. Data was collected pre-installation, one week, one month and two months after the bicycle signal was installed and removed to examine changes in behavior and signal compliance. A total of 8,619 observations over 59 hours were made during the three phases. On-site observations were employed to study bicyclist behavior. The pre-and post-installation analysis revealed that bicyclists on the trail were more likely to enter the intersection during a compliant portion of the traffic signal cycle when the bicycle signal was present and the capacity of the signal to accommodate the compliant bicycles increased. No negative effects on bicyclist behavior were found due to the presence of the bicycle signal head, and pedestrians were less likely to non-comply when the bicycle signal was operating. The report writers concluded that the bicycle signal did not lead to pedestrian confusion. One conflict between motor vehicles and trail users was observed in 59 hours, therefore leading the study to conclude that the bicycle traffic signal did not lead to driver confusion. During the post-removal phase, bicyclists were observed to be more likely to enter the intersection during a non-compliant phase and the capacity of the traffic signal to accommodate the compliant bicyclists was reduced. Statistical analysis of the 8,619 observations revealed little to no change in crossing behavior for bicyclists on the trail when comparing the data from all three phases.
15
Source: Pelz, 1996 Figure 6. Signal Location and Phasing, Russell and Sycamore Lane, Davis, CA
A brief report on the installation of a bicycle signal in San Francisco at the intersection of Masonic and Fell is published on the NACTO case studies website (NACTO, n.d.). The installation, in 2008, was the first bicycle signal installed by San Francisco Municipal Transportation Agency. The signal separates left-turning vehicles from bicyclists in a left-side bicycle lane and pedestrians, the majority of whom are entering a park. The existing infrastructure at the intersection required the vehicle and bicycle signals to be placed on the same mast arm. Non-compliance of left-turning vehicles with the red turn arrow was a problem and required some phasing modifications and louvers. After these modifications, operations and compliance by motor vehicles improved.
Blog and News Posts
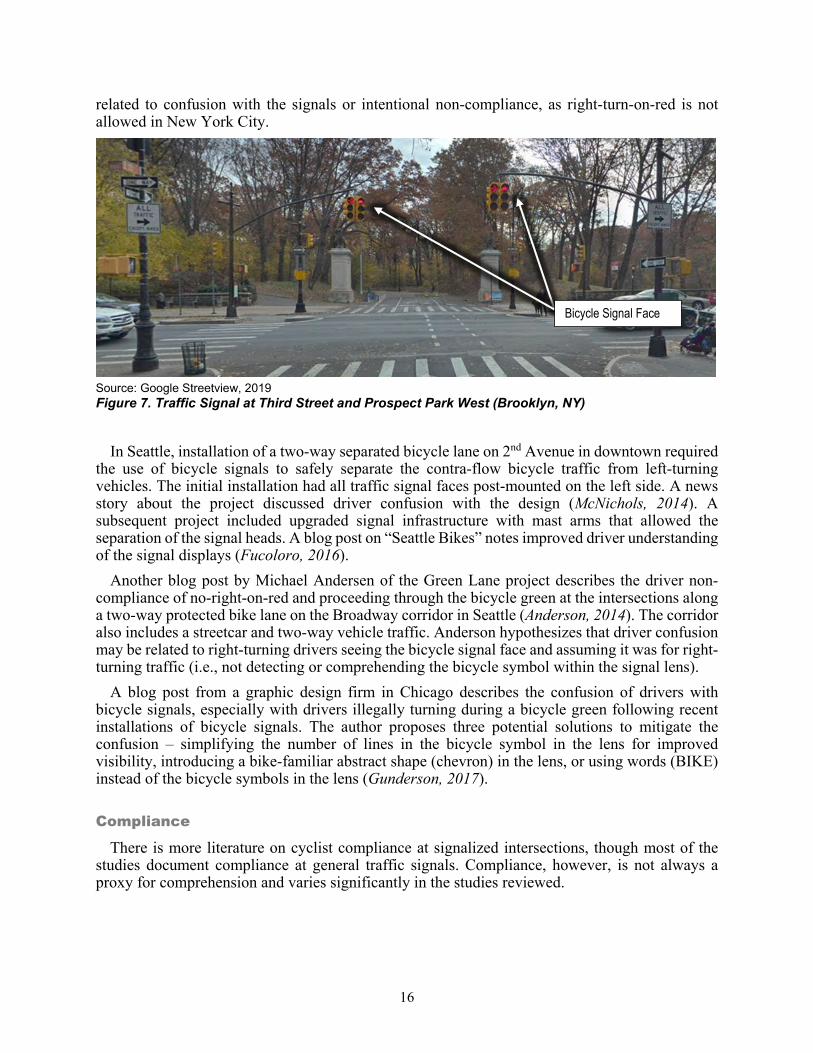
While blog and news posts are not peer-reviewed research, they do provide some anecdotal observations of potential issues. Recent installations of bicycle traffic signals in Seattle, WA, Brooklyn, NY, and Chicago, IL have drawn blog posts and news stories about driver confusion with bicycle signal displays. In Brooklyn, signal heads at Third Street and Prospect Park West are used to control vehicle right turns on to a one-way street and bicycle traffic’s connection to a park and a left-side two-way separated bike lane. The six-section signal head has vehicle and bicycle signal faces mounted adjacent to each other (Figure 7). The bicycle symbol face is the only differentiating element of the bicycle signal, as an accompanying “Bike Signal” sign is not present. A brief news story and accompanying video show drivers turning right when the vehicle signal is red and the bicycle signal is green (Mixson, 2018). It is unclear whether the non-compliance is
16
related to confusion with the signals or intentional non-compliance, as right-turn-on-red is not allowed in New York City.
Source: Google Streetview, 2019 Figure 7. Traffic Signal at Third Street and Prospect Park West (Brooklyn, NY)
In Seattle, installation of a two-way separated bicycle lane on 2nd Avenue in downtown required the use of bicycle signals to safely separate the contra-flow bicycle traffic from left-turning vehicles. The initial installation had all traffic signal faces post-mounted on the left side. A news story about the project discussed driver confusion with the design (McNichols, 2014). A subsequent project included upgraded signal infrastructure with mast arms that allowed the separation of the signal heads. A blog post on “Seattle Bikes” notes improved driver understanding of the signal displays (Fucoloro, 2016).
Another blog post by Michael Andersen of the Green Lane project describes the driver non-compliance of no-right-on-red and proceeding through the bicycle green at the intersections along a two-way protected bike lane on the Broadway corridor in Seattle (Anderson, 2014). The corridor also includes a streetcar and two-way vehicle traffic. Anderson hypothesizes that driver confusion may be related to right-turning drivers seeing the bicycle signal face and assuming it was for right-turning traffic (i.e., not detecting or comprehending the bicycle symbol within the signal lens).
A blog post from a graphic design firm in Chicago describes the confusion of drivers with bicycle signals, especially with drivers illegally turning during a bicycle green following recent installations of bicycle signals. The author proposes three potential solutions to mitigate the confusion – simplifying the number of lines in the bicycle symbol in the lens for improved visibility, introducing a bike-familiar abstract shape (chevron) in the lens, or using words (BIKE) instead of the bicycle symbols in the lens (Gunderson, 2017).
Compliance
There is more literature on cyclist compliance at signalized intersections, though most of the studies document compliance at general traffic signals. Compliance, however, is not always a proxy for comprehension and varies significantly in the studies reviewed.
Bicycle Signal Face
17
Bicycle-Specific Traffic Signals
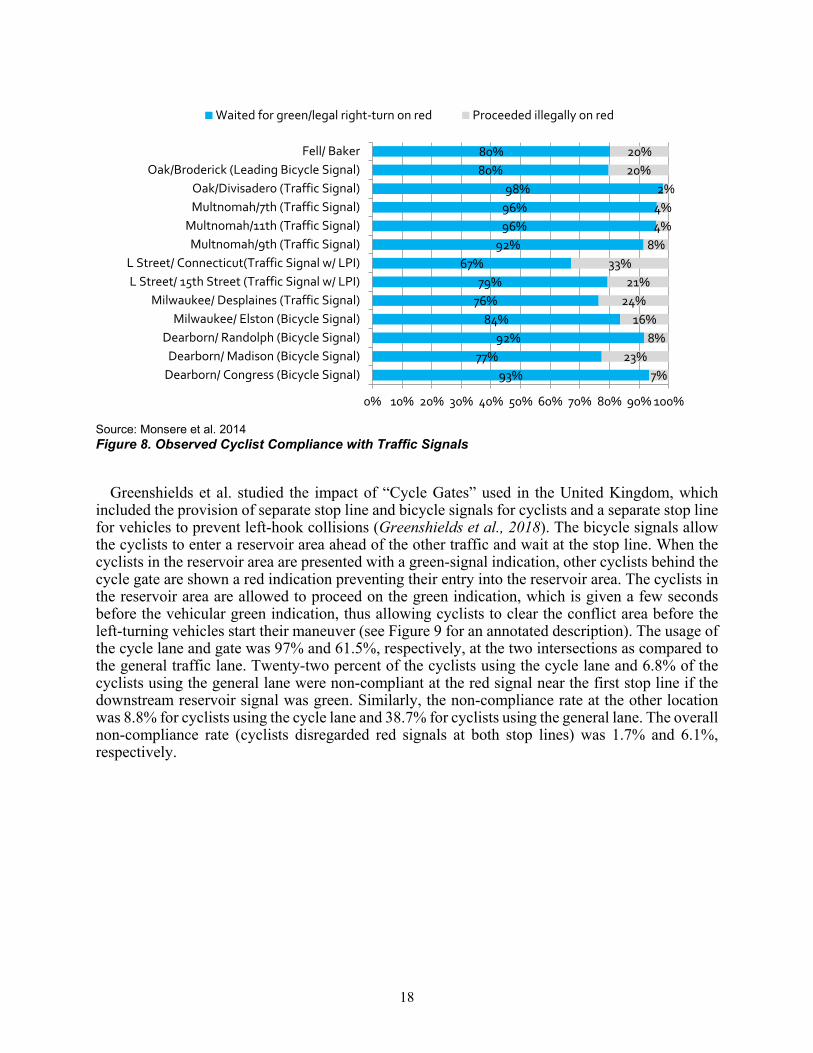
In general, most of the studies about compliance at bicycle traffic signals suggest a link to intended non-compliance rather than poor comprehension of bicycle traffic signals. Monsere et al. (2013) investigated cyclist compliance at signalized intersections equipped with and without bicycle signals in Oregon. Two types of cyclist compliance were evaluated, those that moved straight through the intersection violating the red signal or those that made an illegal right turn. Overall, there was high compliance and no difference between behaviors at bicycle signals and general traffic signals, suggesting good comprehension of the bicycle symbol in the signal face. As part of an evaluation of new bicycling facilities in Washington, D.C., Goodno et al. (2013) studied compliance at locations with bicycle-specific signals. They found compliance, which ranged from 80% to below 20% at some intersections, was strongly related to crossing traffic and somewhat related to delay or progression for cyclists (i.e., low cross traffic and delays contributed to non-compliance). Monsere et al. (2014) studied user behavior at signalized intersections as part of a larger project studying intersections in Portland, OR, San Francisco, CA, Chicago, IL and Washington D.C. Figure 8 summarizes the compliance, which ranged from 67% to 98%, of bicyclists at all of the intersections where video data collection was conducted. At the L Street locations in Washington, D.C., cyclists were using the Leading Pedestrian Interval to obtain an early start (now allowed by ordinance). At the three intersections studied in Chicago on Dearborn Avenue, road user compliance with the signals was nearly identical. A range of 77-93% of observed bicyclists complied with the bicycle signal, which compared to about 84-92% of observed motorists who complied with the left-turn signal separating their movement from the two-way bicycle traffic at the same intersections.
Clifford et al. (2018) studied the impacts of new infrastructure innovations for cyclists – “Hold the Left” and “Early Release” at signalized intersections in London, UK. Video imaging was used to observe behavior and surveys were utilized to determine user perceptions of these treatments. The “Hold the Left” treatment is implemented on a cycle track or bike lane, which is equipped with a bicycle signal for cyclists. This treatment separates the vehicular left-turning movements while cyclists and through vehicles are allowed to proceed through to minimize conflicts — the compliance rates at four intersections varied between 78% and 92%. “Early Release” is the same as a leading bicycle interval and is implemented with bicycle signals. The Early Release treatment was tested at three intersections, where bicycles were provided with four seconds early release. The proportion of cyclists who were able to take advantage of the lead interval ranged from 81% to 97%. Additionally, the behavior of drivers who also took advantage of the cyclists lead interval were also observed. When a cyclist was present during the lead interval, the proportion of vehicles that took advantage of the early release ranged from 0% to 7%. When a cyclist was not present, the proportion ranged from 0% to 4%. These represent instances of motorists taking cues from the bicycle signals.
18
Source: Monsere et al. 2014 Figure 8. Observed Cyclist Compliance with Traffic Signals
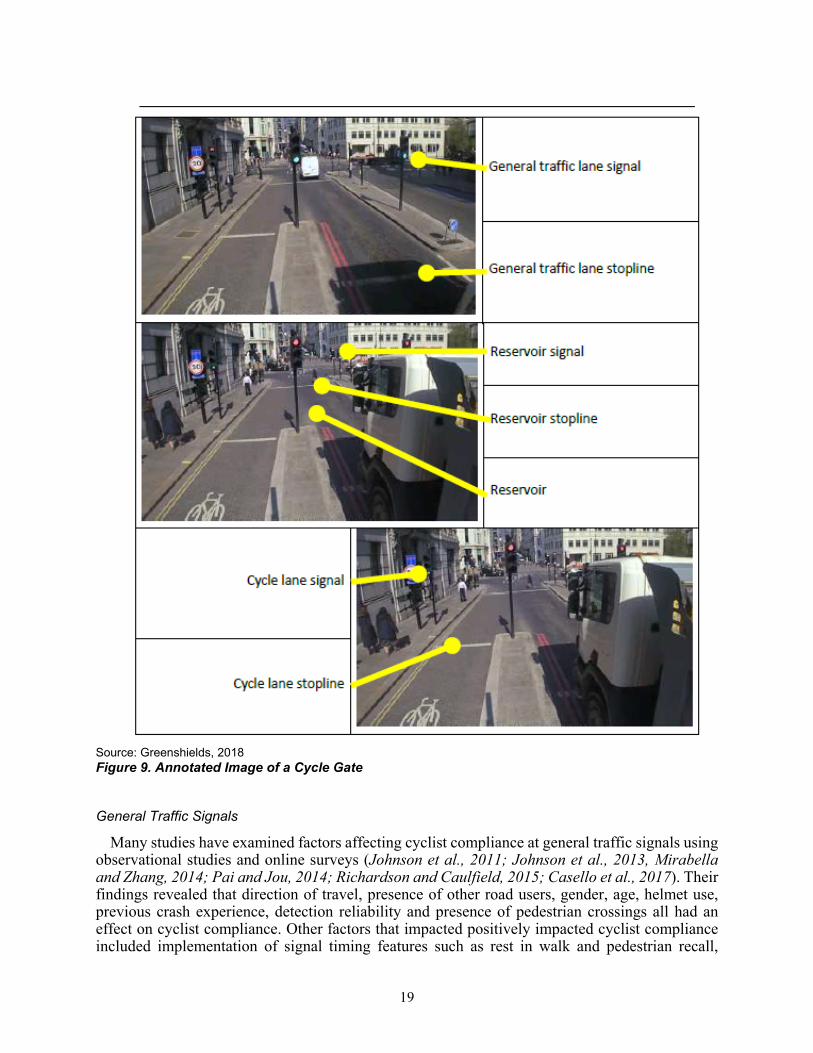
Greenshields et al. studied the impact of “Cycle Gates” used in the United Kingdom, which included the provision of separate stop line and bicycle signals for cyclists and a separate stop line for vehicles to prevent left-hook collisions (Greenshields et al., 2018). The bicycle signals allow the cyclists to enter a reservoir area ahead of the other traffic and wait at the stop line. When the cyclists in the reservoir area are presented with a green-signal indication, other cyclists behind the cycle gate are shown a red indication preventing their entry into the reservoir area. The cyclists in the reservoir area are allowed to proceed on the green indication, which is given a few seconds before the vehicular green indication, thus allowing cyclists to clear the conflict area before the left-turning vehicles start their maneuver (see Figure 9 for an annotated description). The usage of the cycle lane and gate was 97% and 61.5%, respectively, at the two intersections as compared to the general traffic lane. Twenty-two percent of the cyclists using the cycle lane and 6.8% of the cyclists using the general lane were non-compliant at the red signal near the first stop line if the downstream reservoir signal was green. Similarly, the non-compliance rate at the other location was 8.8% for cyclists using the cycle lane and 38.7% for cyclists using the general lane. The overall non-compliance rate (cyclists disregarded red signals at both stop lines) was 1.7% and 6.1%, respectively.
93%77%
92%84%
76%79%
67%92%
96%96%98%
80%80%
7%23%
8%16%
24%21%
33%8%
4%4%2%
20%20%
0% 10% 20% 30% 40% 50% 60% 70% 80% 90% 100%
Dearborn/ Congress (Bicycle Signal)Dearborn/ Madison (Bicycle Signal)
Waited for green/legal right-turn on red Proceeded illegally on red
19
Source: Greenshields, 2018 Figure 9. Annotated Image of a Cycle Gate
General Traffic Signals
Many studies have examined factors affecting cyclist compliance at general traffic signals using observational studies and online surveys (Johnson et al., 2011; Johnson et al., 2013, Mirabella and Zhang, 2014; Pai and Jou, 2014; Richardson and Caulfield, 2015; Casello et al., 2017). Their findings revealed that direction of travel, presence of other road users, gender, age, helmet use, previous crash experience, detection reliability and presence of pedestrian crossings all had an effect on cyclist compliance. Other factors that impacted positively impacted cyclist compliance included implementation of signal timing features such as rest in walk and pedestrian recall,
20
presence of bike boxes, two-phase left turns, turning lanes with advanced green phases, and arrival on green, while the presence of T-intersections and intersections with short red-phase duration negatively impacted compliance. The impact of type of bike on compliance was mixed with one study finding higher non-compliance rates among e-bike users (Pai and Jou, 2014), while another study did not find a statistically significant difference in compliance rates (Langford et al., 2015).
Another set of studies explored cyclist behavior at traffic signals equipped with a blue-light feedback confirmation device (Boudart et al., 2015; Boudart et al., 2017) using observational studies and postcard intercept surveys. Their findings revealed that while differences in comprehension of the blue-light confirmation device were observed, the device, however, did not have a statistically significant impact on compliance. A modified pavement marking was also tested and it also did not have a statistically significant impact on compliance. Another study explored compliance of cyclists at signalized intersections with the modified 9C-7 pavement marking using observational data, and results showed high compliance rates with traffic signals, excluding the right-turn-on-red (Smith et al., 2018).
Safety at Intersections with Bicycle Signals
While there is deep literature on bicycle crash frequency and severity, few studies have examined the impacts of traffic control on bicycle-motor vehicle crashes. Rahimi et al. (2013) evaluated five design elements for left-hook crashes which included mixed traffic with left-turning motorists, left turns in the intersection for the motorists, bicycle signals, advance stop lines for bicyclists, bike boxes using video observation, and surveys along a route in Japan using 10 bicyclists and four drivers. Their results revealed a higher preference for bicycle signals based on comfort and safety. Wahi et al. (2018) examined bicycle-motor vehicle crashes in Queensland, Australia, between 2002 and 2014 at uncontrolled, stop control locations and signalized intersections. At signalized intersections, age, roadway characteristics (dip, the presence of driveways) and bicyclist behavior (movements that led them to be at fault during a crash) increased injury severity, while helmet use decreased severity at signalized intersections.
Recently, the New York City DOT conducted a safety evaluation of bicycle-specific intersection treatments to provide guidance on the appropriate treatment (NYCDOT, 2018). Mixing zones, fully split phases (with bicycle signals), delayed turn (split LBI) and offset crossing (protected intersections) were evaluated in the study using crash, conflict and comfort analysis. Of these treatments, fully split phases, delayed turn and offset crossing used bicycle-specific traffic signals. While mixing zone and offset crossing are design treatments, delayed turn and fully split phase are signal timing treatments. With the delayed turn, bicyclists are provided a head start similar to a leading pedestrian interval, while turning movements are held before they are allowed to proceed concurrently with the bicyclists. In a fully split-phase treatment, the through bicyclists and turning vehicles are separated in time with bicycle signals. The study did not document any driver confusion with bicycle traffic signals. Kothuri et al. (2018) also studied the safety impacts of split LBI and mixing-zone treatments using an observational study with conflict analysis. With the split LBI treatment, while the conflicts were eliminated at the start of green, conflicts persisted during the start of the flashing yellow interval and continued through the stale green. Some user confusion (related to the merging behavior and where each entity needed to position themselves) was observed regarding the position of the bicyclists and drivers within the mixing zone. Qualitative guidance was also provided regarding the optimal treatment to use given a set of bicycle and turning vehicular volumes.
21
Related Traffic Control Devices
This section reviews research for comprehension, visibility, and compliance related to traffic control devices for vehicles, transit and pedestrian control with a focus on both research methods and issues that are similar to bicycle signal faces.
Vehicular Traffic Signals
Lens Size and Backplates for Traffic Signals
Conspicuity of traffic signals has been cited as a factor in intersection collisions and improving their visibility can improve safety. Cole and Brown (1968) found that signal visibility was insensitive to lens size and depended only on intensity. They determined that greater visibility could be achieved by using a higher intensity lens. Other studies have found that the use of a larger signal lens improved visibility (Hulscher, 1975) and the use of backplates or backboards reduced the intensity required by 25-40% at distances of 300 feet (FHWA, 2000; Hulscher, 1975). King (1981) found that signal visibility during the day was affected by signal lens size and intensity, but not at night. Sayed et al. (2005) evaluated the safety impacts of improved signal conspicuity, which resulted from the addition of yellow micro-prismatic retroreflective sheeting along the outer edge of the signal at 17 intersections.
Protected/Permissive Displays for Turns
A number of studies have explored drivers’ comprehension of flashing yellow arrow (FYA) signal display indications for left turns (Asante and Williams, 1993; Bonneson and McCoy, 1993; Noyce and Kacir, 2001, 2002; Drakopoulos and Lyles, 2001; Brehmer et al., 2003; Noyce and Smith, 2003; Knodler et al., 2005, 2006a, 2006b, 2007; Henery and Geyer, 2008; Schlattler et al., 2013; Hurwitz et al., 2013; Marnell et al., 2013; Hurwitz et al., 2014). These studies have either utilized static surveys and/or observed behavior in the driving simulator to determine comprehension rates. The surveys were typically computer-based and were either administered independently or as a follow-up after the drivers completed the experiment in the driving simulator. They consisted of static images of intersections with various signal display alternatives and the responses were usually presented as multiple-choice options. The experiments in the driving simulator usually involved subjects driving in a grid and being presented with various signal display alternatives and their actions were recorded. The results of these studies demonstrated that simultaneous displays (green arrow and green ball, green arrow and red ball) were associated with lower driver comprehension rates than single indications alone (Noyce and Kacir, 2002). The results also showed that the FYA signal display indication for left turns was well understood by drivers and led to FYA being adopted for permissive left-turn indications.
Boot et al. (2015) evaluated a new flashing pedestrian indicator (FPI) that alternated between a yellow arrow and a pedestrian symbol using online surveys. Drivers generally understood the meaning of FPI and it was associated with significantly more yielding to pedestrians; however, confusion was observed among drivers proceeding through the intersection. Though included in the MUTCD, there is minimal research on driver comprehension of the use of FYA for right turns. Recent studies have used web-based surveys, microsimulation models and driving simulator study to determine drivers’ comprehension on the use of FYA for right turns (Hurwitz et al., 2018; Ryan et al., 2018; Jashami et al., 2019). Results revealed FYA indication improves driver comprehension and behavioral responses to the permissive right-turn condition. Drivers were also
22
observed to approach the intersection at slower speeds when they encountered a FYA than a steady circular green indication in the absence of a pedestrian.
Supplemental Signs for Traffic Signal Faces
When a traffic signal face is intended to control a specific movement or vehicle type, a supplemental sign is often used for additional clarification. Figure 10 shows the supplemental signage available in the MUTCD for signals, turn prohibition and lane control. In general, many of the studies show increased comprehension with the addition of a supplemental sign. Most of the studies evaluating the comprehension of signal indications with supplemental signs studied either protected permitted left turns or right turns (PPLT or PPRT) (Bonneson and McCoy, 1993; Drakopoulos and Lyles, 2001; Henery and Geyer, 2008; Schlattler et al., 2013; Hurwitz et al., 2018). These studies used surveys to understand driver comprehension of the traffic control devices with and without supplemental signs. Results revealed that the supplemental signs were beneficial in specific situations (e.g., R10-12 during the permitted phase) (Drakopoulos and Lyles, 2000) and increased driver comprehension (Schlattler et al., 2013; Hurwitz et al. 2018). One study also revealed higher comprehension rates for the R10-12 sign (94%) than the FYA indication (72.4%) (Henery and Geyer, 2008). However, in some of these studies, the comprehension measures were biased since the supplemental sign contained the desired response to the signal indication.
R10-12 R10-10 R10-11 R10-11a
R10-10b R3-2L R3-5R
Source: MUTCD and Schlattler et al. 2013 Figure 10. Supplemental Signs: Signals, Turn Prohibition, and Lane Control
Transit Signals
Light Rail Transit Signals
Similar to bicycles, there is often a need to separate the movements of light rail vehicles from other traffic at signalized intersections. Before the adoption of the guidance in the current MUTCD, a TCRP report reviewed 10 early LRT systems in North America and found no uniformity in signal displays across the systems (Korve et al., 1996). While some systems used
23
standard traffic signals on a shared right-of-way, others used a monochrome bar, monochrome “T,” colored “T,” or colored “X” LRT signals. When these signals were installed in the motorist's line of sight they led to driver confusion, especially at night.
As part of the research, guidance on size, shape, aspect and placement of LRT signals to avoid motorist confusion was developed. The report suggests that in locations where the LRT signals could cause motorist confusion, they should be positioned and shielded in a way that they are visible only to LRT operators. The TCRP report stated that the LRT signals should use a 12-inch lens; however, an 8-inch lens may be used in urban areas where space is tight. The recommended shape was rectangular or square with a dark color (black is preferred) and a visor for each lens. A monochrome bar was the recommended display indication, and a PROCEED indication for the train included a vertical lunar white bar placed near the bottom of the signal head. The STOP indication should consist of a horizontal lunar white bar placed near the top of the signal head. Between the PROCEED and STOP indications, a flashing white triangle should be used to indicate when the LRT should PREPARE TO STOP. The report also stated the primary signal be located on the near side of the intersection and they should be separated vertically and/or horizontally by at least 8 feet from the nearest traffic signal head or the pedestrian signal head for the same approach (Korve et al. 1996). The LRT signals should also be installed within the cone of vision of the LRT operators, which is 25 degrees on each side of the center track line for a total of 50 degrees.
Bus Queue Jump Signals
Bus queue jump lanes are used to reduce transit delay and increase reliability and combine short dedicated transit facilities with either a leading bus interval or active transit signal priority to prioritize transit (NACTO, 2016). To facilitate queue jumps, buses need to have access to a lane and move to the head of the queue at the beginning of the signal cycle (NACTO, 2016). In the typical design, a bus uses a shared right-turn lane with an adjacent near-side bus stop. When the bus is first in the queue, the right-turn signal is displayed while the other through traffic is shown a red indication. In both the NACTO’s Transit Street Design Guide and the TCRP Report 118 Bus Rapid Transit Guide (Kittelson et al., 2007), the authors suggest the possibility of motorist confusion, but no quantitative evidence is presented. In practice, louvered or visibility-limited green indications are used, which is only visible to the right-most lane and often accompanied by a sign indicating the signal face is for right turns “except buses.” No other published studies on the topic were identified.
Pedestrian Signals
Pedestrian signal indications are comprised of a steady walking person symbolizing the WALK indication, a flashing upraised hand symbolizing the pedestrian clearance interval (FLASHING DON’T WALK (FDW)) and the steady upraised hand symbolizing the DON’T WALK indication. During the WALK indication, the pedestrians are permitted to start crossing. During the pedestrian clearance interval, pedestrians are not supposed to start crossing, but those that are already in the crosswalk are expected to complete their crossing. During the steady DON’T WALK, pedestrians in most jurisdictions are not supposed to enter the roadway. Research has shown the FDW is poorly understood, with comprehension levels ranging from 31% to 50% (Mahach et al., 2002; Chicago DOT, 2002). Other research has also shown that pedestrians were more likely to start crossing during FDW (which is illegal in many states), run out of time while crossing, return to the starting location, or get caught in the middle of the crosswalk when the indication changes to solid DON’T WALK (Huang and Zegeer, 2000).
24
Pedestrian Countdown Timers
Countdown timers are clocks that display the remaining time for a signal indication, thus providing users with real-time information to make better decisions. In the U.S., they are most commonly seen for pedestrian operations. The pedestrian countdown signals were first approved and included in the 2003 MUTCD (FHWA, 2003). These countdown signals show the amount of time remaining in the clearance interval (FDW). A number of studies have reported a reduction in pedestrian-motor vehicle conflicts and improved pedestrian safety as a result of the pedestrian countdown timer installation (Huang and Zegeer, 2000; Markowitz et al., 2006; Chen et al., 2015; Lambrianidou et al., 2013; Schmitz, 2011; Scott et al., 2012; Vasudevan et al., 2011; Eccles et al., 2004). The pedestrian countdown timers were also found to improve driver safety (Kwigizile et al., 2015; Kitali et al., 2018). Drivers also used the pedestrian countdown timers to make informed decisions when approaching the intersection (Chen et al., 2015; Schmitz, 2011; Elekwachi, 2010; Nambisan and Karkee, 2010). One study examined the legibility and comprehension of the countdown signals without the flashing hand using digital video displays (Van Houten et al., 2015). Results revealed that pedestrians were more likely to consider crossing if they judged they had enough time with countdown pedestrian signals alone than with countdown signals plus FDW and this effect held across gender and age.
Pedestrian Hybrid Beacons
Pedestrian hybrid beacon (PHB, HAWK) is a traffic control device used at a pedestrian crossing to control traffic on the major approach. The PHB consists of two red indications and one yellow indication. In its base state, the PHB rests in a dark mode. When a pedestrian activates a pushbutton indicating an intent to cross, the PHB displays a flashing yellow indication for the driver for a few seconds, followed by a steady yellow indication and steady red indication requiring drivers to stop. A WALK indication is displayed for the pedestrians followed by a clearance interval (FLASHING DON’T WALK). During the flashing pedestrian clearance interval, an alternating flashing red indication is displayed to the drivers. During the flashing red indication, drivers are allowed to proceed after stopping if the pedestrians have cleared half the roadway (Fitzpatrick and Pratt, 2016).
A specific PHB concern relates to driver behavior when during the dark mode and understanding of the flash mode. The concern among some professionals is that drivers may believe that the PHB is not working when it is operating in a dark mode similar to a traffic signal during a power outage and may treat it as a stop sign (Fitzpatrick and Pratt, 2016). However, two studies did not find any evidence of this behavior (Nassi and Barton, 2008; Fitzpatrick and Pratt, 2016). Some studies have demonstrated improved pedestrian safety and driver yielding in response to PHB installation (Turner et al., 2006; Nassi and Burton, 2008; Fitzpatrick and Park, 2009; Godavarthy and Russell, 2010; Hunter-Zaworski and Mueller, 2012; Fitzpatrick et al., 2013, 2014; Lincoln and Tremblay, 2014; Brewer et al., 2015; Pulugurtha and Self, 2015; Fitzpatrick and Pratt, 2016).
Summary
This chapter reviewed literature pertaining to basic human factors concepts of visibility, comprehension, and compliance, which are all critical characteristics associated with proper use of traffic control devices. Road users first need to see the traffic control device, correctly comprehend its meaning and respond accordingly.
A review of bicycle-focused literature showed no published research studies that directly addressed visibility and comprehension of the bicycle signal face or the transferability of design
25
assumptions from motor vehicle users. This reveals gaps in research that need to be further examined. Varying anecdotal reports have documented driver confusion with bicycle signals due to lack of separation between vehicular and bicycle traffic signal faces, and not recognizing that the bicycle signal indications were exclusive for bicycles. However, none of the more formal published evaluation reports found evidence of significant user confusion. Research on safety impacts at intersections with and without bicycle signals is also very limited. Safety of cyclists at intersections with and without bicycle signals may also warrant further research.
Review of literature pertaining to traffic control devices for vehicles revealed the importance of visibility and conspicuity of traffic signals in reducing collisions. Studies also revealed extensive testing of various signal display alternatives to determine optimal displays and signal head configurations to communicate protected/permissive movements. These studies highlight the importance of substantial research into effective ways to communicate allowable movements for vehicles. In contrast, little to no research was found on tests for comprehension and best ways to communicate allowable movements by the bicycle traffic signal. Similarly, many studies have explored pedestrian comprehension and safety impacts for drivers and pedestrians with pedestrian countdown timers. Other studies have explored potential driver confusion when the pedestrian hybrid beacon is operating in a dark mode and found no evidence. Studies evaluating light rail transit signals found evidence of driver confusion due to non-standardization and use of different types of signals. This led to guidance on size, shape, aspect and placement of transit signals to avoid motorist confusion. In contrast, no research studies were found which explored bicyclist and driver comprehension and compliance based on size, placement, and orientation of bicycle signal faces. Research is therefore needed to understand this gap.
26
C H A P T E R 3
State of the Practice and Inventory
Design Guidance
Before IA-16 was approved, Thompson et al. (2013) summarized the state of the practice for bicycle signals, reviewing design guidance current at that time: Guide for the Development of Bicycle Facilities (AASHTO, 2012), California Manual on Uniform Traffic Control Devices (MUTCD) (Caltrans, 2012), Urban Bikeway Design Guide (NACTO, 2011), Traffic Signal Guidelines for Bicycles (Transportation Association of Canada (TAC), 2004), Design Manual for Bicycle Traffic (CROW, 2007) and the Manual of Uniform Traffic Control Devices for Canada, 2008 update (TAC, 2008). The review found similar design guidance on lens size, use of the bicycle symbol, and the use of optical shielding. There was variance in mounting heights, housing color, and signal timing parameters. The research also collected detailed information about bicycle signal installations such as the presence and color of backplates, signal housing color, lens size, the presence of visibility-limiting lens or louvers, near-side or far-side placement, mounting height, phasing, restriction on vehicle movements, and supplemental signage.
After the release of IA-16, which provided much needed guidance on the use of bicycle symbols in the signal face, NACTO updated the Urban Bikeway Design Guide (2014), Caltrans updated its MUTCD to incorporate IA-16 (2018), and Massachusetts DOT released the Separated Bike Lane Planning and Design Guide (2015). These documents substantially reflect the guidance in IA-16. IA-16, NACTO, and the MassDOT guide require that the bicycle signal faces be placed to maximize visibility to bicyclists, minimize visibility to users of other modes, and encourage the use of visibility-limited bicycle signal faces. It is important to note that even with IA-16, jurisdictions must still submit a written request to the FHWA and comply with all provisions to use the bicycle symbol in the signal face as described in Section 1A.10 of the MUTCD.
IA-16 states that the bicycle signal face should be placed at least three feet away (horizontally or vertically) from the nearest motor vehicle traffic signal. The MassDOT design guide recommends that the bike signal face should be located at the far side of the intersection within five feet of the edge of the bike lane, mounted right of the bike lane, and that the bike signal faces not be placed between the vehicle signal faces (MassDOT, 2015).IA-16 requires at least one signal face be provided for controlling bicycle movements. The primary bicycle signal faces must be either 8 or 12-inches, even if they are placed on the near side of the intersection. A secondary signal head is required near side when the primary signal head is located more than 120 feet upstream of the stop line and is recommended when the primary signal head is located more than 80 feet beyond the stop line. A 4-inch supplemental near-side signal face may be used. The required dimensions of the lens are similar to the Canadian guidance (200 or 300 mm) and the United Kingdom’s (200 mm primary, 90-110 mm for supplemental) (TAC, 2004; Department of Transport, 2016). For a signal not over the roadway, IA-16 requires that the bottom of the signal face must be seven feet above the ground or sidewalk. The 4-inch post-mounted signal must more than four feet and less than eight feet above the ground or sidewalk.
27
Except for the 4-inch signal heads, IA-16 suggests that the illumination and light distribution for the 8-inch and 12-inch signal heads should be similar to the motor vehicle signal heads. The interim approval permits the use of backplates without the presence of any legends. A supplemental sign (R10-10b, see Figure 10) noting the signal face for bicycles is required.
IA-16 defines the meaning of the bicycle symbol indications as the same as vehicular indications. Turning after stopping is allowed with the RED BICYCLE indication, except for bicyclists positioned left of the adjacent motor vehicle traffic, who are prohibited from turning right on red, and bicyclists positioned to the right of the motor vehicle traffic on the same approach are prohibited from turning left on red. A YELLOW BICYCLE is used to indicate the change interval. A steady GREEN BICYCLE indication is displayed when traffic is allowed to proceed in any direction that is lawful and practical, provided that bicyclists are not in conflict with any simultaneous motor vehicle movements, including turning movements, and the bicycle movements are not modified based on turn prohibition signs, pavement markings, separate turn signal indications, and other control devices. Implied in the IA-16 definition is that a bicyclist interprets the GREEN BICYCLE indication as allowing any movement from the lane controlled by bicycle symbol (including a left turn from a bicycle lane positioned to the right of all traffic lanes or a right turn from a bicycle lane positioned to the left of all traffic lanes).
In ruling 9(09)-47(I), FHWA clarified that the intent of IA-16 is to limit the use of a bicycle signal face to operations where the bicycle movement is “protected from any simultaneous motor vehicle movement at the signalized intersections (FHWA, 2014).” At many intersections, compliance with this provision requires the installation of fully protected left and right turns across the bicycle facility. Most often, separate turning lanes are also required. Note that NACTO also requires restricting right turns on red across the bicycle facility if the signal is used to separate through bicycles from right-turning traffic. IA-16 further requires that bicycle turning movements can only be prohibited with the use of arrows (i.e., movement prohibition signs are not sufficient). NACTO only states that the use of arrows should be considered.
To use a bicycle symbol in the signal face that does not comply with the provisions of IA-16 requires that a jurisdiction submit and obtain approval through the “Request to Experiment (RTE)” process described in Section 1A.10 of the MUTCD (FHWA, 2009). All of the active Requests to Experiment involving IA-16 filed at the time of this project involve exceptions to the requirement of protection from any simultaneous motor vehicle movements. Evanston, IL, and Boston, MA, are experimenting with a GREEN BICYCLE allowing permissive right turns across the bicycle facility at multiple intersections in these locations. Minneapolis, MN, and Newark, DE, are experimenting with a FLASHING YELLOW BICYCLE to indicate a permissive bicycle movement. St. Paul, MN, is experimenting with both the FYA for vehicles and FLASHING YELLOW BICYCLE.
The interim approval also describes the provisions for the layout of the bicycle symbol and the signal faces (see Figure 11). The approval requires that the bicycle symbol in the Standard Highway Signs (FHWA, 2004) be used for the bicycle signal indications and the symbol be positioned horizontally and face to the left. The bicycle signal faces themselves may be placed horizontally or vertically, in the same order as motor vehicle applications. The use of arrows in the bicycle signal faces is allowed in situations when it is necessary to prohibit certain turning movements by bicyclists due to conflicts with motor vehicles. While circular and bicycle signal indications are not allowed to be used on the same traffic signal face, arrow and bicycle signal indications can be used together.
28
Source: MUTCD Figure 11. Typical Arrangements of Signal Sections in Bicycle Signal Faces
Inventory of Intersections with Bicycle Signals
To describe the state of the practice, the research team conducted an inventory of intersections with bicycle signals limited to those signals with the bicycle symbol in the face. The research team assembled the inventory of 511 intersections from a variety of sources in the following sequence:
• An initial list of 411 intersections with bicycle signals in the U.S., dated January 2019, was obtained from the NCUTCD’s bicycle technical committee. The information had a varying level of detail for each intersection.
• The PSU team’s prior bicycle signal inventory (Monsere et al., 2013) had 18 intersections that were not on the NCUTCD’s list.
• All the current Requests to Experiment (RTE) with bicycle signal faces were obtained from FHWA. These applications describe 33 intersections (some of which were on the other lists).
• An online survey to collect location information for additional bicycle signals was sent by email to the Association of Pedestrian and Bicycle Professionals (APBP) discussion group, TRB’s Traffic Signal Systems Committee and Bicycle Committee, and we posted a request on social media (Twitter) asking respondents to identify locations with bicycle signals not in our inventory. The Twitter post received 4,612 impressions and 196 engagements. The survey and Twitter post generated 142 new intersections (and removed 60 locations from the original NCUTCD list which were initially planned signals in New York but were never installed).
As part of the cataloging process, each of the locations from all sources was mapped and signal face verified either in Streetview or by the jurisdiction in their survey response. Any intersections where the bicycle signal did not contain the bicycle symbol in the face were removed from the list (i.e., some signal faces were for controlling bicycle traffic but did not use symbols). The complete list of intersections is presented in Appendix A.
29
Method for Data Collection
The research team developed a list of data elements to be collected about each intersection, approach, and bicycle signal face. Initially, the research team proposed gathering information from each jurisdiction; however, a large percentage of the locations identified had Google Streetview images available. Thus, nearly all of the data was collected by visual inspection of Google Streetview.
The data was collected by six research assistants at PSU and OSU following a brief training session. The training was conducted online and reviewed the document containing detailed instructions (Appendix B) and explained how to code the data in a shared spreadsheet. Most data were collected directly from the Streetview image. Visibility distance from the stop line was measured using Google Maps. Mounting heights, separation from other signal faces was measured using on open source imageJ software. The software estimates distances in images based on a known reference distance. In the pilot testing of the data collection, these measurements were compared with previously field measured data or design plans for three locations. Data were within one foot of known distances for field measured or plan documents. Finally, the research team identified a set of intersections for data collection by multiple coders to check for accuracy and agreement. The approach data was cleaned and validated following the data collection.
Results
For brevity, the results of the data collection are summarized for the primary bicycle signal face by intersection and approach in this report unless noted.
Locations of Intersections Using Bicycle Symbol Signal Faces
The locations of all 511 signals were mapped and verified. Table 1 shows a summary of locations and Figure 12 maps these locations. The states with the most installations are New York (156), California (70), Illinois (40), Washington (51), Oregon (33) and Texas (26). The large cities in those states are the primary locations for these installations including New York City, NY (154), Seattle, WA (51), Chicago, IL (32), Portland, OR (25), San Francisco, CA (24), Long Beach, CA (18), Los Angeles, CA (17) and Austin, TX (16). The cities of Denver, CO (14), Atlanta, GA (17), Lincoln, NE (10), and Boston, MA (12) also have a number of installations. Most other jurisdictions have a small number of installations. As shown on the map, with the exception of Atlanta, GA, Houston, TX, and Austin, TX, our inventory did not identify many locations in the southeast part of the country.
30
Table 1. Intersections with Bicycle Signal Faces by State and Jurisdiction
State City Intersections State City Intersections AZ Phoenix 1 MI Detroit 1
Tucson 1 MO Kansas City 1
CA Davis 2 St Louis 1
Long Beach 18 MT Missoula 1
Los Angeles 17 NC Charlotte 1
Mountainview 2 NE Lincoln 10
Palo Alto 1 NY Buffalo 1
Redondo Beach 3 Ithaca 1
Sacramento 1* New York City 154
San Diego 1 OH Cleveland 2
San Francisco 24 Columbus 7
San Jose 1 Xenia 1
CO Boulder 1 OR Ashland 1
Denver 14 Bend 1
Fort Collins 3 Clackamas Co. 1
DC Washington DC 8 Dundee 1
DE Newark 7* Eugene 2
FL Tampa 1 Portland 25
GA Atlanta 17 Salem 2
IA Des Moines 2 PA Philadelphia 2
IL Aurora 3 Pittsburgh 1
Chicago 32 SC Spartanburg 2*
Evanston 5 TX Austin 16
IN Indianapolis 2 Houston 10
MA Arlington 1 UT Bluffdale 1
Boston 12 Salt Lake City 3
Cambridge 1 South Jordan 4
Lexington 1 VA Alexandria 3
Newton 1 WA Seattle 51
MN Minneapolis 7 WI Madison 7
St Paul 7 *planned installations
31
Source: Google Fusion Maps, 2019 Figure 12. Map of Intersections with Bicycle Signal Faces
32
Installation Year
Installation year was either determined by data provided to the team via the survey, other documents, or by using historical views in Google Streetview to estimate the installation year. For some locations, only a range could be determined by this method (e.g., 2014-2017).
Installation year was determined for 410 intersections and a range estimated for another 44 locations. Figure 13 shows the installation year for the 410 locations only (planned installations and ranges are not included). As apparent in the figure, the number of intersections with bicycle signals has been steadily increasing. The increasing trend aligns with the release of the NACTO Urban Bikeway Design Guide in 2011, which presented bicycle signals as tools, and IA-16’s release in December 2013.
Figure 13. Installation Year of Bicycle Signals
General Context
Many signals are used in bicycle corridors and the same type of design is repeated. A total of 383 intersections (75%) in the sample were part of a bicycling route with the use of bicycle signals at many intersections along the corridor. Many of these corridors have separated bicycle lanes (two-way or one-way) or incorporate a multiuse path, which requires traffic control separation for bicycles for safe operation.
At the intersection-level, the bicycle traffic was categorized as one-way, two-way or mixed (a one-way facility on one leg and a two-way facility on the other). In the inventory, signals on two-way bicycle facilities are 49% of the sample. Because of their two-way operation, these often require the use of separate signals for bicycles at locations with turning traffic.
33
Motivation for Bicycle Signal
For each intersection, the research team assigned a primary motivation for the bicycle signal. As many designs serve multiple purposes this was an iterative process. After first describing the motivation in detail, the team condensed coding to arrive at descriptions that could be grouped in categories. Table 2 describes the typical installations of bicycle signal faces. Note that 14 locations were unique applications that could not be grouped and are not presented in the table. Further, the research team could not code 29 locations due to missing Streetview images or documentation. Finally, the motivation for an installation could not be determined for an additional 13 intersections. The table is ordered by the most frequent category.
34
Table 2. Summary of Typical Applications of Bicycle Signals
Category Number Brief Description of Typical Location Photo of Typical Application
Bicycle Lane to the Left of a Left-Turn Lane
129 This design used bicycle signals to separate through bicycle movements from left-turning vehicles. For these intersections, bicycle lanes (either one-way or two-way) are located on the left side of the road to the left of a left-turn lane.
Long Beach, CA. Source: Google StreetView, 2019
Bicycle Lane to the Right of a Right-Turn Lane
41 This design used bicycle signals to separate through bicycle movements from right-turning vehicles. For these intersections, bicycle lanes (either one-way or two-way) are located on the right of a right-turn lane.
Los Angeles, CA. Source: Google StreetView, 2019
35
Category Number Brief Description of Typical Location Photo of Typical Application
Two-Way Bicycle Lane on One-Way Street
69 In this configuration, bicycle signals were used for the contra-flow bicycle-traffic direction. Bicycle traffic in the same direction as motor vehicle traffic on the one-way street can be controlled by the vehicle signals, unless there is a need to control turning conflicts (these configurations were categorized in one of the turn-lane categories).
Chicago, IL. Source: Google StreetView, 2019
Two-Way Bicycle Lane on Two-Way Street
41 In this configuration, bicycle signals were used for both traffic directions and contra-flow bicycle-traffic unless there is a need to control turning conflicts (these configurations were categorized in one of the turn-lane categories).
St Paul, MN. Source: Google StreetView, 2019
36
Category Number Brief Description of Typical Location Photo of Typical Application
Multiuse Path Crossings
36 Where multiuse paths cross roadways, bicycle traffic signals are used to provide a better indication of the crossing time for bicycles (rather than using the pedestrian timing).
Seattle, WA. Source: Google StreetView, 2019
Bicycle-Only Connections to Parks, Train Stations, or Center Bike Lanes
17 Bicycle signals were used to provide bicycle-only connections to specific facilities such as parks or median bicycle lanes. There are a variety of configurations as these are somewhat unique designs. The image shows a bicycle-only crossing to an intersection island which connects to the downtown transit mall.
Denver, CO. Source: Google StreetView, 2019
37
Category Number Brief Description of Typical Location Photo of Typical Application
Connection to a Two-Way Bicycle Lane
15 The connection to the start of two-way facilities is another typical application of bicycle signals. The signals provide a means to transition from one-way operations to two-way. The sample image shows the connections to the start of the two-way separated bicycling lane in that allows contra-flow bicycles to depart from two-way bicycle lane and connect to a traditional one-way facility.
Charlotte, NC. Source: Google StreetView, 2019
Contra-Flow Bicycle Lane
14 Another common use of the bicycle signal was to accommodate a contra-flow bicycle movement. In most cases, the bicycle signal face is only visible to the bicyclist. The sample image, however, shows an intersection where vehicles must turn left but cyclists are allowed to proceed through.
Boulder, CO. Source: Google StreetView, 2019
38
Category Number Brief Description of Typical Location Photo of Typical Application
Diagonal Crossing
11 Bicycle signals are used to provide for a diagonal crossing of an intersection. All of the locations identified had two-way bicycle traffic at both or one side of the diagonal, often connecting a shared-use path. The image shows a diagonal crossing of a regional bicycle trail.
Clackamas County, OR. Source: Google StreetView, 2019
Bicycle Left Turns 10 Bicycle signals were used to provide a separate bicycle left-turn phase from the right either in a jug-handle style pocket, from a two-stage turn box, or other waiting areas. The image shows the queuing area for cyclists to wait to complete a left-turn movement (bicycle signal is just visible on the far side of the intersection).
San Francisco, CA. Source: Google StreetView, 2019
39
Category Number Brief Description of Typical Location Photo of Typical Application
Bicycle-Only Crossing for Median Two-Way Bicycle Facility
9 Bicycle signals were used to control bicycle-only movements for a median two-way bicycle lane. The intersections were in South Jordan, UT (shown in image), Portland, OR, and New York City, NY.
South Jordan, UT. Source: Google StreetView, 2019
Connection to a Multiuse Path
8 Bicycle signals were used to make bicycle-only connections to multiuse paths from bicycle lanes. The image shows the connections to the start of a two-way separated bicycling lane near the Google campus that allows bicycles to connect to the Hetch Hetchy multiuse path.
Mountainview, CA. Source: Google StreetView, 2019
40
Category Number Brief Description of Typical Location Photo of Typical Application
BL to the Right of Shared Thru/Right
8 As part of an RTE with bicycle signal faces, the City of Minneapolis installed bicycle signals to control bicycle traffic adjacent to a through and right-turn lane. The experiment involves a five-section head and a flashing yellow bicycle symbol displayed during the vehicle green. The image shows one of the intersections near the completion of construction.
Minneapolis, MN. Source: Google StreetView, 2019
Bike Only Thru Crossing with Restricted Motor Vehicle Movements
8 Bicycle signals were used to provide crossings at intersections where motor vehicle through movements (or turns) are restricted but bicycle movement is allowed. Some of these are at locations with a half-signal treatment and appear on “bicycle boulevard” street crossings. An additional three intersections were identified where the bicycle signals were used in combination with a pedestrian hybrid beacon.
Fort Collins, CO. Source: Google StreetView, 2019
41
Type of Phasing Operation
The type of phasing for the bicycle signal cannot generally be obtained from an image or photo, so there are fewer intersections where this information is available. The phasing information was obtained via the survey, RTE documentation, or the team’s knowledge of some locations. Table 3 summarizes the phasing information for 173 intersections with bicycle signals. While most signals operate with an exclusive movement for bicycles, there are some that operate concurrently. At the locations where phasing information is available, 67% of the bicycle signals are used for exclusive bicycle movements where the bicycles do not conflict with vehicle movements. Most of the RTE sites requested permission to experiment at locations with conflicting vehicular traffic by allowing the bicycle traffic to proceed concurrently with the vehicular traffic. In Minneapolis, a Flashing Yellow Bicycle symbol is used with a four-section head to indicate permissive movements while in Boston, MA, the green bicycle symbol is used. A number of installations prior to IA-16 feature concurrent phasing.
Bicycle signals have also been used to provide leading intervals via leading bicycle interval (LBI) (6%) or a Split LBI (14%). In an LBI, all parallel traffic is held during the lead interval, following which the operation reverts to concurrent timing and turning vehicles must yield to bicycles. In the Split LBI, the through and bicycle traffic is allowed to proceed during the lead interval, while the turning traffic is held. After the lead interval, the operation reverts to concurrent timing, where the turning vehicles have to yield to bicycles. At the NYC locations with the Split LBI, an FYA is used for the turning vehicular movements during the permissive phase.
Table 3. Number of Intersections by Phasing Type
Phasing operation for bicycle movement
Number of Intersections Percent
Concurrent 22 13%
Exclusive 116 67%
LBI 11 6%
Split LBI 24 14%
Total 173 100%
42
Number and Location of Bicycle and Vehicular Signal Heads per Approach
Table 4 summarizes the number of bicycle signal faces on each approach that was sampled, cross-tabulated by the number of vehicle heads that were visible in the direction of bicycle travel. Overall, 221 of the 432 approaches (51%) presented two bicycle signal faces, typically in a far-side/near-side arrangement. A total of 204 approaches used a singular bicycle face. Finally, seven intersections were identified with three bicycle signal faces. As shown, 98 of the bicycle signal faces were presented for bicycle-only movements and no vehicle signal heads were visible. A total of 79 approaches had the minimum number of vehicle heads (two). The remainder (255) had three or more vehicle signal heads per approach.
Table 4. Number of Approaches by Bicycle and Vehicular Signal Heads
Visibility Distance, Lens Diameter and Number of Bicycle Signal Heads
Using the satellite maps and the Google measuring tool, the visibility distance from the stop line for bicycle traffic to the primary bicycle signal face was measured. For presentation in the table, distances were grouped by the IA-16 recommendations: <=80 feet, >80 feet and <=120 feet, and >120 feet. Appendix B pg B-5 shows an example of the measurement distance protocol. For each approach, the lens size of the bicycle signal was estimated when a sufficient quality Streetview image was present. While 4-inch lenses are allowed and known to be in use, these heads are difficult to spot in Streetview images and none were identified during the data collection.
Table 5 presents the visibility distance category tabulated by lens size and the number of bicycle signal faces on the approach. Overall, the majority of bicycle signal lenses in the sample is 8 inches (77%). There is some jurisdictional consistency in lens size as design choices tend to be replicated. Note that IA-16 requires a supplemental signal face when the visibility distance is greater than 120 feet and suggests (“should”) for distances greater than 80 feet. As shown in Table 6, only five intersections have visibility distance more than 120 feet without a supplemental near-side head. A total of 108 approaches (33%) are in the recommended distance (>=80 but less than 120 feet).
43
Table 5. Number of Approaches by Visibility Distance, Lens Size, and Bicycle Signal Heads
Lens diameter
Number of bicycle signal heads per approach
Number of Approaches by Visibility Distance Categories
<=80 >80 and <=120 >120 Total
12 inch 1 19 36 4 59 2 14 22 4 40 3 1 - - 1
12 inch Total 34 58 8 100
8 inch 1 67 72 1 140 2 80 89 8 177 3 6 - 6
8 inch Total 147 167 9 323 Total (12 inch and 8 inch) 181 225 17 423
Note: While 4-inch lens are allowed and known to be in use, these heads are difficult to identify in Streetview images and none were identified during the data collection.
Placement of Bicycle Signal Head and Mounting Height
The data collection process identified the placement of the primary bicycle face relative to the bicycle travel lane. The placement was coded as either over the roadway or over the sidewalk or path, and then whether it was to the left, center or right of the bicycle lane. As described in the data collection protocol, mounting height was estimated from the bottom of the bicycle signal face to the ground to/from the edge of backplate or housing, rounded to the nearest foot. These measurements were obtained from scaling the Google Streetview photos after first obtaining a measurement in the horizontal plane. Measurements were made only when a suitable view could be obtained.
As shown in Table 6, the most common mounting location for the bicycle signal face is off the roadway, over a sidewalk or path. These signals were equally placed to the left or right of the bicycle lane driven by the context of each location. Only 60 bicycle signal faces were mounted over the roadway surface, primarily centered over the bicycle lane. Mounting heights that were observed are reasonable (the 25-foot maximum heights are observed for signals in Seattle on span wire support streetcar catenary).
Use of Arrows used in Bicycle Signal Face
The inventory only identified five locations (Palo Alto, CA, South Jordan, UT, St. Paul, MN, and San Francisco, CA) where arrows were used in conjunction with the bicycle symbol faces. Given the limitations of the data collection, arrows could only be confirmed if visible or assumed by the arrangement of faces. Any four- or five-section bicycle signal heads were considered to include arrow indications.
Use Distinguishing Signal Housing or Backplate Color
The use of a distinct color for the bicycle signal housing or backplate may help drivers distinguish it from a vehicle signal head. However, the majority of the primary bicycle signal faces
44
are the same color as vehicular signal heads (84%). A total of 61 primary signal faces were identified that used a different color for the bicycle signal housing or backplate in Denver, CO, Long Beach, CA, Portland, OR, and Minneapolis, MN. Finally, slightly more than half (56%) of the primary bicycle signals selected did not use a backplate.
Table 6. Number of Approaches by Placement of Bicycle Signal and Mounting
Over Roadway (OR) or Over Sidewalk/Path (OS/P)
Left, Center or Right of Bicycle Lane
Number of Approaches
Bicycle Signal Mounting Height (ft)
Minimum Average Maximum
OR
Center 51 10 18 25
Left 4 14 19 23
Right 5 16 16 17
OR Total 60 10 18 25
OS/P Left 188 5 11 22
Right 184 6 11 19
OS/P Total 372 5 11 22
Total 432
Presence of R10-10b sign
A total of 231 of the primary signal faces (53%) were identified with the R10-10b sign present. Sign dimensions were not confirmed though it was apparent that smaller dimensioned signs were in use at some locations. The placement of the R10-10b “Bicycle Signal” sign, required by IA-16, can be challenging at some intersections due to pole and space limitations. An additional 18 signal faces in Long Beach, CA, were accompanied by backplates with “BIKE SIGNAL” lettering on the signal housing and without the actual accompanying sign (an image shown in Table 2). Many of the signals in Denver incorporate the R10-10b text and legend in a horizontal arrangement in the backplate (also shown in Table 2).
Presence of Louvers or Visibility-Restricting Device on Bicycle Signal Face
Louvers or visibility-restricting devices are used on bicycle signals to prevent motorists from seeing the bicycle specific symbol indications from other lanes. The presence of these restrictions is difficult to detect in Google Streetview. Only six of the primary signal faces (1%) were identified in the sample as having louvers or visibility-restricting device.
Horizontal and Vertical Separation to Nearest Vehicular Signal Face
The horizontal and vertical distance between the far-side primary bicycle signal face and the nearest vehicular signal face were estimated from/to the edge of backplate or housing of each
45
signal head, rounded to the nearest foot. If the signal heads were adjacent, a measurement of <1ft was entered.
The horizontal offset was measured between the edge (either the signal housing or the backplate) of the bicycle signal face to the nearest motor vehicle signal face. The protocol for the vertical measurement is not specified in IA-16. For these data, the distance was measured from the top edge of the bicycle signal face to the bottom edge of the motor vehicle signal. These measurements were obtained from scaling the Google Streetview photos, after first obtaining a measurement in the horizontal plane. Measurements were made only when a suitable view could be obtained.
The research team collected these measurements since the placement of the bicycle signal face in the vicinity of the motor vehicle signal may contribute to driver confusion. Further, IA-16 suggests that a bicycle signal face be separated vertically or horizontally from the nearest motor vehicle traffic signal face for the same approach by at least three feet. Table 7 shows the measured estimates of horizontal and vertical separation. A total of 53 (19%) of the bicycle signals measured in our sample had less than the recommended horizontal and vertical separation, respectively (separation < 3ft). To simplify the presentation, the measured offsets were grouped into three categories: <=3 feet, >3 feet and less <= 8 feet and > 8 feet. The detailed measurements of the horizontal and vertical offsets are plotted together in Figure 14.
Table 7. Horizontal and Vertical Placement of Bicycle Signal Face from Nearest Motor Vehicle Face
Horizontal Separation Category
Vertical Separation Category
<=3 ft. >3 and <=8 ft. >8 ft. Total
<3 53 7 - 60
>3 and <=8 15 13 - 28
>8 77 98 7 182
Total 145 118 7 270
46
Figure 14. Plot of Signal Face Mounting Offsets
Summary
Table 8 is a summary of the inventory. Ten of these locations are currently planned for installation in 2019-2020. The location (intersection street names and latitude/longitude) was coded for all intersections. Google Streetview images, showing the bicycle signal face, were available for 441 intersections (86% of the sample). Phasing for the bicycle movements was obtained for 173 intersections from survey responses, agency contacts, and research team’s knowledge database. In addition, the research team coded a primary motivation for the installation of the bicycle signal for 469 intersections (92% of the sample) to provide insight into the typical installations even if phasing information was not available. The installation year of the bicycle signal was coded for 80% of the sample. Detailed data for the signal face on an approach were collected for a subset of the sample (361 intersections). These observations included bicycle signal mounting heights and offsets from vehicular signals estimated from the Streetview images for 348 intersections (68% of the sample).
47
Table 8. Summary of Inventory of Bicycle Symbol in the Signal Face
Data Item Number of Intersections
Percent of Total Sample
Location (latitude/longitude) 511 100% Google Streetview Image 441 86% Motivation for Bicycle Signal 469 92% Bicycle Phasing 173 34% Installation Year (Exact) 410 80% Detailed Approach Data 361 69% Mounting Height and Offset from Motor Vehicle Signals for Primary Bicycle Signal Face 348 68%
Key findings of the inventory are: • The states with the most installations of bicycle signal faces are New York (156), California
(70), Illinois (40), Washington (51), Oregon (33) and Texas (26), with the large cities in these states being the primary adopters.
• The trends show that bicycle signals have been increasingly used as a tool in the development of bicycling networks. The adoption of design guidance for separated bicycle facilities, and especially two-way facilities, and IA-16 have likely contributed to the trend in the U.S.
• A total of 75% of the bicycle signals in the sample were part of a bicycling route with the use of bicycle signals at many intersections along the corridors.
• Bicycle signals are key tools in the design of two-way bicycle facilities. Nearly 49% of the sample are bicycle signals on two-way bicycle facilities.
• Bicycle signals are also used to facilitate safe bicycle movements when the bicycle lane is placed either to the left of a left-turn lane (31%), or right of a right-turn lane (10%). Other significant motivators include facilitating bicycle movements when a two-way bicycle lane is placed on either a one-way street (16%), or two-way street (10%), and crossings for multiuse paths (9%).
• About 67% of the bicycle signals in the sample have exclusive bicycle movements, with the remainder operating concurrently with compatible movements.
• The majority of the bicycle signal installations use two signal heads (51%) but single far-side heads are also common (47%). For the same approach, our sample indicates that either four (32%), three (22%), or no (23%) motor vehicle heads are commonly present.
• The majority of the bicycle signal lens in the sample are 8 inches (77%) – though this is because so many signals are in New York City, which uses 8-inch lens. Excluding these, approximately 62% are 8 inches.
• Visibility distances to the far side bicycle signal vary by intersection context. Generally, most designs include supplemental heads when visibility distances exceed 120 feet. Four-inch near-side heads were not observed but are difficult to see in our data collection protocol. Most of the bicycle signals are mounted off the roadway (over a sidewalk or path).
• At this time, only a small number of bicycle signals have been installed with arrows for communicating allowed bicycle movements.
48
• A majority of the primary bicycle signal faces are the same color as vehicular signals head (84%) and 56% of the primary bicycle signal installations did not use a backplate for the bicycle signal.
• The R10-10b sign was observed at 53% of the primary bicycle signal installations. • Only six bicycle signal faces were found with visibility-restricting devices. This is a
challenging data element to collect by our method. • Only 19% of the signal faces had less than the recommended three feet of horizontal and
vertical separation distances in the interim approval from the nearest vehicular signal. There are some limitations to the data collection protocol. Data was collected for the primary
approach that contained the bicycle signal face at all locations, where the Streetview image was available. In most locations, data was also collected for other approaches at the intersection that had bicycle signal faces. However, at some locations, it is possible that the data collectors may have missed collecting information on additional approaches due to limitations of the Streetview images. Finally, the accuracy of measuring mounting height, horizontal, and vertical separation using the imageJ software was validated against a small set of known distances, and the measurements obtained should be viewed as estimates.
49
C H A P T E R 4
Key Agency Interviews
The objective of conducting agency interviews was to interview key agency staff to gain insights about the challenges in the design and placement of bicycle signal faces to mitigate road user (driver and bicyclist) confusion. This chapter summarizes the results of these interviews.
Methodology and Recruitment
The interview protocol was reviewed by the PSU Human Research Protection Program (HRPP) and received an exemption rating (certificate number 196468-18). The research team sent recruiting emails to individuals at agencies that were identified by the inventory with experience with bicycle signal faces. The invitation email included a brief description of the project objectives and a request to schedule a time for the interview that would take between 30 and 60 minutes to complete.
Individuals were invited to include others in their organization with expertise who might contribute to the interview. After confirming availability, an email was sent in advance of the interview that included the research objectives, a list of questions and topics, and details of informed consent. The research team asked for consent to record the interview for ease in transcribing the results, and it was noted that the summary results would not be associated with individual names. Persons were notified that they could skip over any question and could let the team know if any answers were to be kept confidential.
Following the interview, the research team transcribed the responses to the questions and synthesized the results. The research team interviewed 21 agencies, including six state DOTs, 14 city agencies, and one county, as summarized in Table 9. A number of interviews included multiple professionals at an agency. Due to confidentiality requirements for human subjects as approved by the PSU HRPP, the synthesis does not report the names of those interviewed or associate individuals or agencies with their responses.
50
Table 9. Summary of Interviewed Agencies
Agency Name Type Agency Name Type
Caltrans State DOT City of Chicago, IL City
Delaware DOT State DOT City of Denver, CO City
District of Columbia DOT State DOT City of Lincoln, NE City
Maryland SHA State DOT City of Minneapolis, MN City
Minnesota DOT State DOT City of Seattle, WA City
Oregon DOT State DOT Houston Public Works, TX City
Hennepin County, MN County Los Angeles DOT, CA City
City of Akron, OH City New York City DOT, NY City
City of Atlanta, GA City Portland Bureau of Transportation, OR City
City of Austin, TX City San Francisco Municipal Transportation Agency, CA
City
City of Cambridge, MA City
Interview Results
A summary of the responses for each question is summarized in the following sections.
Interviewee Experience
Question 1: Please describe how you been involved in the planning, design, construction, operation or maintenance of bicycle signals?
Several respondents were involved in multiple phases of the bicycle signal implementation process and/or the group of interviewees provided various perspectives as shown in Table 10. Agencies interviewed ranged from having no signals installed to date to having over 100 signals within their jurisdiction. A majority of the respondents review preliminary or final design plans for bicycle signals. Many respondents are involved in the signal timing and operations of bicycle signals and/or bicycle facilities that require bike-specific timing or phasing elements, even when bicycle signals are not present. Several respondents are also involved in developing or updating existing agency policy or guidance on the use of bicycle signals.
Table 10. Respondents Involvement in Bicycle Signals
Response # of Agencies* Planning 12 Design 17 Construction 3 Operation 13 Maintenance 5
* Agencies with multiple interviewees and/or staff that was involved in multiple categories were counted in all categories that apply (n=50)
51
Road User Understanding
Question 2: Have you received public comments or feedback about driver confusion with the bicycle symbol face?
Nearly half of the respondents (48%, n=10) indicated that they have not received or do not know of any comments received from drivers about confusion with the bicycle symbol face, as shown in Table 11. Four interviewees (19%) indicated they have no data due to not having a bicycle signal in place, or other departments or groups within their agency may have additional information. The remaining agencies (33%, n=7) have received feedback from drivers either officially or anecdotally. Two agencies specifically mentioned a learning curve and that after a couple of weeks, reported driver confusion decreased significantly. Two agencies specifically mentioned complaints of the bicycle signal face to be hard to distinguish, particularly at large intersections where the bicycle signal head is placed similarly to the vehicle signal head (e.g., overhead on mast arms). One of those two agencies noted that after the bicycle signal head was relocated slightly further from the vehicle head, reports on confusion dropped.
One agency reported significant feedback after the rapid implementation of a two-way bicycle facility which included adding bicycle signals to the existing poles. Feedback from drivers was not specific to the bicycle signals per se but was in response to the overall changes of the roadway operations. As the facility was upgraded with more permanent infrastructure, the bicycle signals were able to be placed on new mast arms directly over the bicycle lane, and complaints have gone away. One agency noted that driver feedback fell into two categories: confusion about what was happening and complaints about the fact that the bicycle signal existed and caused vehicle delay. One agency received only positive feedback from drivers who are happy to know when people on bikes will stop and go.
In summary, the consensus from all agencies is that the placement of the bicycle signal is critical to avoiding confusion for drivers. Retrofitting existing signal equipment often requires non-ideal placement due to either limited space or the mast arm being at its weight capacity.
Table 11. Public Comments, Driver Confusion
Response # of Agencies Yes 7 No *not to the knowledge of interviewee*
10
N/A 4
Question 3: Have you received any public comments or feedback from persons on bicycles about confusion with the bicycle symbol face?
Table 12 summarizes the responses received for this question. Three agencies (14%, n=3) either have no bicycle signals installed or other departments/groups within their agency collect user feedback, so it was unavailable for this process. The remaining 18 agencies were split equally between receiving feedback or not. Of the nine agencies that received feedback, all but one (38%, n=8) noted that the feedback was asking for clarification or pointing out confusion related to the operations of the corridor or intersection. One agency has all bicycle signals activated via a pushbutton and received comments related to that. One agency noted they have a large and complex intersection and they use the bicycle signal to assist people on bikes in navigating the
52
intersection. They noted that if it were a more standard intersection, a bicycle signal would not be needed. One agency noted that they have mounted bicycle signals at a lower height in response to feedback at one location where the original placement was too high. One agency noted that they receive questions on how to use a two-stage crossing.
The one agency that received comments unrelated to confusion noted that their feedback has all been positive and generally are requests for more bicycle signals. This same agency has received feedback specifically on how helpful the bicycle signals are for riding with children, and requests that more 4-inch near-side signal heads be added at child-height to help navigate more complex intersections.
Table 12. Public Comments, Persons on Bicycle Confusion
Response # of Agencies Yes 9 No *not to the knowledge of interviewee*
9
N/A 3
Question 4: Please describe your experience (if any) with bicycle-motor vehicle crashes/collisions at intersections with bicycle signals?
Over half of the respondents (52%, n=11) were not aware of any crashes or patterns at intersections with bicycle signals, as shown in Table 13. Two of those agencies commented on the fact that official crash datasets are very delayed; often one to four years behind the current year. Three agencies (14%, n=3) were aware of crashes at intersections with bicycle signals, but it was known that they were not related to the bicycle signal in any way and either occurred in a different lane or were due to driver behavior (i.e., running a red light). Two agencies (10%, n=2) are planning future bike signals in response to crash history along a corridor or at an intersection. One agency (5%, n=1) had an intersection with a high crash rate but installed a bicycle signal and is not aware of any subsequent crashes. If there have been any, they were minor and unknown to agency staff. One agency (5%, n=1) had seen crashes after the implementation of a pilot two-way bike facility – primarily due to the driver or person on a bike violating the display indication. Under the previous design, people on bikes had been in the lane and were used to watching the vehicle signal, but with the pilot project are being stopped in their own space, which caused some confusion. That has been addressed with an upgraded design to include mast arms that position vehicle and bicycle displays over the correct lanes and include 4-inch near-side display for increased visibility. Respondents from the remaining three agencies (14%, n=3) either did not have personal experience or knowledge of relevant crash analyses or knew that other departments within their agency had information, but the interviewee did not have access to information on crashes.
One agency conducted a protected bike lane study and found that crashes at fully split intersections were higher than expected and that was due to signal violations, which is a behavioral issue more than a confusion issue. Their analysis of the issue is that they have bike signals at places where there is a need for split phasing and the delays become greater leading to non-compliance.
53
Table 13. Experience with Bicycle/Motor Vehicle Crashes
Response # of Agencies* No experience, or no data access 3 Not aware of any crashes or patterns 11 Known crash(es) – unrelated to bicycle signal 3 Known crash(es) – design tweaked to mitigate concern 1
Known crash(es) - future bike signal planned in response to crash history
2
Known crash(es) - existing bike signal present in response to crash history
1
Known crash(es) – unknown relation to bicycle signal 1 *One agency had responses that fall under two “Known crash(es)” categories
Question 5: Have there been any public education efforts undertaken by your agency for bicycle signals?
Just under half of the respondents (43%, n=9) said they are not aware of any public education efforts related to bicycle signals at their agency, as shown in Table 14. Eight agencies (38%, n=8) shared information about public education efforts related to bicycle signals. Of those eight, one is for a planned intersection and was conducted by the consultant; agency staff was not sure if they would be doing additional education after the construction. For all others that have documented education efforts, strategies included informational videos, informational fliers, volunteers/ambassadors on the ground at new facilities, poster boards installed at new facilities, and online websites. Two agencies (10%, n=2) mentioned there might have been educational efforts in the past when bike signals were first implemented in the agency, but that nothing has been done recently. One agency (5%, n=1) did not know. A couple of agencies mentioned they do have education efforts for other bicycle facilities, but nothing specifically geared towards signals.
Table 14. Public Education Efforts
Response # of Agencies Yes 8 No 10 Not aware of any - possible in past 2 Not Applicable 1
Lens Visibility and Conspicuity
Question 6: At some distances and lens display intensity, the bicycle symbol may not be clearly distinguishable from a circular display. Do you think this is an issue that needs more research?
Among the 21 agencies interviewed, just over half (53%, n=11) indicated they thought additional research was needed to make bicycle signal symbols more distinguishable from a circular display, as seen in Table 15. Six agencies (29%, n=6) did not believe additional research was needed and the remaining respondents (19%, n=4) indicated they thought it might be, but did not have enough information to form a definitive opinion. Several agencies that indicated there was no need for further research mentioned that they exclusively use 12-inch signal heads for
54
various reasons (agency policy, agency practice, concerns about acquiring/maintaining more than one signal head size). One agency has all bicycle signals mounted horizontally and with a yellow backplate and have seen no issues to date. Two agencies that are in dense urban areas mentioned they don’t think they have issues because their intersections are quite small, but could see the need for additional research based on larger intersections or higher approach speeds. Among agencies that responded in favor of additional research, the following potential topics emerged:
• Nearly all mentioned specifically that guidance on the appropriate distance would be most helpful; the research question of interest is: “How far is too far?”
• Two agencies shared anecdotes of visibility tests. One mentioned that the NCUTCD committee visited an existing bicycle signal and was not able to distinguish the bicycle symbol from a standard green ball until they were up to the stop line. The other agency set up a bicycle signal in their office and started to lose visibility at about 100 feet away.
• One additional agency highlighted the safety concern that when a driver is not able to clearly distinguish their signal from a bicycle signal, the misunderstanding can cause significant safety concerns for all users.
• Two agencies specifically noted that guidance on when to use an 8-inch head versus a 12-inch head and when to use far-side, near-side or a combination would be helpful.
Table 15. Is Research Needed, Distance Symbol Face Visible
Response # of Agencies Yes 11 No 6 Maybe 4
Question 7: It has also been suggested that there could be minor design refinements in the bicycle symbol design for conspicuity that would make it easier to view at a distance. Do you think this is a research need?
There were mixed perspectives on the need for further research about possible minor refinements to the bicycle signal symbol design to enhance conspicuity, as shown in Table 16. Among the 21 agencies interviewed, roughly the same number of representatives indicated they thought this was an area in need of further research (38%, n=8) as those that did not (43%, n=9), while approximately one-quarter of respondents (24%, n=5) indicated they thought it might be, but did not have enough information to form a definitive opinion. Notably, in one agency there was disagreement among staff highly knowledgeable in bicycle signal design about the importance of this area for further research, with some staff indicating that the symbol is intuitive as-is, and others indicating that at certain distances and intersection sizes, it may be confused for a green ball by motorists. In all but three agencies, responses to this question were correlated with answers to question 6, indicating that research on the display intensity, distance, and symbol may be valuable to pursue collectively to determine the relative influence of each factor on overall bicycle signal recognition. The lack of consensus on the need for future research on this topic indicates that future research may be beneficial.
55
Table 16. Research Needed, Improved Conspicuity of Symbol Face
Response # of Agencies* Yes 8 No 9 Maybe 5
*One agency with multiple interviewees had divergent responses.
Question 8: Do you think more research is needed on the selection of lens size (12 inch or 8 inch) of the bicycle signal considering visibility distance?
Most respondents (76%, n=16) indicated a desire for additional research on the selection of bicycle signal lens size considering bicycle signal visibility distance, and there was considerable heterogeneity among existing design preferences for different signal sizes, as seen in Table 17. Roughly one-quarter of agencies (24%, n=5) indicated a preference for 12-inch signals based on their experience with motor vehicle signals, and viewed that 8-inch signals may not be as visible from the far side of a large intersection. However, some agencies (14%, n=3) indicated a preference for 8-inch bicycle signals based on the assumption that this size is enough for recognition of a far-side bicycle symbol face, and that the smaller size may help to differentiate bicycle signals from motor vehicle signals and aid road user recognition. Additionally, approximately one-quarter of agencies (24%, n=5) indicated a desire for research on the use of 4-inch near-side signal heads, with some indicating they thought these might be beneficial to use as the primary bicycle signal head since they would be more visible to cyclists if placed close to a cyclist’s path of travel, referencing international examples of the use of this design.
Table 17. Research Needed, Selection of Lens Size
Response # of Agencies Yes 16 No 3 Spontaneously requested research on near-side use (4”)*
5
*Three respondents also indicated the need for additional research.
Question 9: Does your agency use any visibility-restricting devices to shield the bicycle signal faces away from the drivers?
Close to two-thirds of agencies (62%, n=13) indicated they did not use any visibility-restricting devices to shield bicycle signal faces, as shown in Table 18. Of the agencies that used them (n=7), close to half (42%, n=3) indicated they only do so in unique circumstances where the potential for confusion of the bicycle and vehicle signal faces was a concern. In these cases, either an irregular intersection geometry or unavoidable proximity of the bicycle signal mounting location to a vehicular signal prompted the decision to use visibility-limiting strategies including louvers or programmable lenses. Among the agencies that indicated they do not use visibility-restricting devices some said they would consider their use in future installations if they felt they were needed. Notably, one agency indicated that they do not think restricting the visibility of a bicycle signal to drivers is a good idea, since they believe a driver should see the signal as a reason they are being held from a conflicting turn movement (i.e., restricted right turn).
56
Table 18. Use of Visibility-Restriction Devices
Response # of Agencies Yes 7 No 13 Not Applicable 1
Placement of the Bicycle Signal Face
Question 10: Do you have any experience with 4-inch near-side bicycle signal faces? Do you think they improve road user understanding? Have you received positive or negative feedback from bicyclists?
Almost two-thirds of respondents (62%, n=13) indicated their agency did not use 4-inch near-side bicycle signal faces, as seen in Table 19. Four agencies (19%) indicated they already use these signals or have a pending installation with a 4-inch near-side signal. Four additional agencies (19%) indicated they are considering using 4-inch near-side signals for future bicycle signal installations or retrofits of existing bicycle signals. Of those agencies that do not use 4-inch near-side signals, this was usually due to the agency’s internal signals policy constraints to require 12-inch heads for all signals, or because the signal shop has not wanted to use a 4-inch signal.
All agencies with experience using 4-inch near-side signals indicated they had received positive responses from cyclists, and one noted that they are helpful for persons on a bicycle—especially children—to navigate complex intersections. The lower near-side signal height was highlighted as critical for cyclists who are lower to the ground, such as children and recumbent cyclists. One agency indicated that they had initial concerns about vandalism due to the lower signal height, but that it has not transpired. Overall, feedback indicates that these are very well understood, much appreciated, and facility users would like to see more of them.
Table 19. Use of Near-side Four-Inch Bicycle Signal Faces
Response # of Agencies Yes, or pending installation 4 No 13 Considering for future installs or retrofits 4
Question 11. What guidelines do you follow for placement of bicycle signal faces and vehicle signal faces when both are visible on the approach?
Approximately half of the respondents (52%, n=11) indicated their agency uses the IA-16 as guidance when both bicycle signal and vehicle signal faces are visible on the same approach as seen in Table 20. Less than 25% of respondents cited each of the following guidelines in this instance: MUTCD guidance (19%, n=4), NACTO (10%, n=2), Request to Experiment (RTE) (14%, n=3), State MUTCD (5%, n=1). Three respondents (14%) did not cite a specific source of guidance or indicated they were unsure of what guidance was followed by their agency in this circumstance.
Notably, many agencies indicated that they find the requirements of IA-16 to be very restrictive and sometimes difficult to implement. For example, in some cases, the designers stated they were not able to provide three feet of separation between a bicycle signal head and vehicular signal as
57
required by the interim approval, although they try to do so whenever possible. Another agency stated that when considering a new bicycle signal installation, they are faced with the choice of a more seamless process by following the IA-16 requirements or a more arduous process by using an RTE with the design they feel is most appropriate.
Table 20. Guidance Used for Placement of Signal Faces
Response # of Agencies* IA-16 11 MUTCD 4 Request to Experiment (RTE) 3 None cited/not sure 3 NACTO 2 State MUTCD 1
*Some agencies use more than one source of guidance.
Question 12. What other guidelines does your agency follow for bicycle signal placement?
Seven agencies (33%, n=7) indicated their agency uses state or local guidance as a supplemental source of signal placement guidance, as seen in Table 21. Aside from state and local guidance, the MUTCD and NACTO guidance were the most commonly cited (19%, n=4, and 14%, n=3, respectively) in the circumstances aside from those prescribed in Question 11. One agency (5%, n=1) indicated it uses the FHWA Separated Bicycle Lane Planning and Design Guide as a supplemental source of guidance, and six agencies (29%, n=6) did not indicate an additional source of guidance. Of those who responded to the follow-up question asking if an agency thinks its placement of bicycle signals is effective, eight of nine agencies (89%) indicated they thought it was effective or stated that they had not received any complaints to the contrary.
Table 21. Guidance Used for Signal Placement
Response # of Agencies* State/Local Signal Guidance 7 None 6 MUTCD 4 NACTO 3 FHWA Separated Bicycle Lane Planning and Design Guide
1
*Some agencies use more than one source of other guidance.
Question 13. Have you studied the motorist or bicyclist compliance of traffic signals based on the placement of bicycle and vehicle signal faces in proximity to each other?
A summary of the responses is shown in Table 22. Only four agencies (19%, n=4) indicated they studied bicyclist or motorist compliance based on the placement of the bicycle and vehicle signals in proximity to each other. One jurisdiction studied the difference in compliance between bicycle and vehicle signals placed approximately three and eight feet apart, finding no significant difference in compliance between the two configurations. Another measured if drivers stopped at the stop line or encroached the bicyclist area, and did not observe many violations, but saw some
58
encroachment creating some discomfort. Another informally observed bicyclist signal compliance and found that some comply with the signal, while others do not. Finally, one jurisdiction conducted formal before-and-after studies and found that driver compliance increased when signals were positioned over their lane.
Table 22. Study of Compliance Based on Placement
Response # of Agencies*
Yes 4 No/ Not Applicable /No Response 17
Question 14: What are the design issues or constraints you face for placement of bicycle signal and vehicle signal faces when both are visible on the approach?
Except for one, all agencies indicated some design issues or constraints for the placement of the bicycle signal, as seen in Table 23. Over half of the respondents (52%, n=11) mentioned that finding the right location for the bicycle signal face is most difficult. Mast arms often do not have the capacity for an additional signal head and/or sign and pedestal poles often have conflicting existing equipment. A similar concern is the concept of traffic control clutter. Just under half of the respondents (43%, n=9) identified this as a concern related to user misunderstanding as opposed to physical constraints. A quarter of the agencies (24%, n=5) identified right-of-way issues. Under a quarter of the agencies (19%, n=4) mentioned that outdated signal infrastructure is a concern, primarily related to overhead wires (i.e., no mast arms), conduits at capacity in existing equipment, or conduits being inaccessible/degraded and unable to update. Three agencies (14%, n=3) described achieving adequate sight distance as an issue, mainly pointing to placement constraints impacting sight distance. One agency mentioned controller constraints and that they had issues figuring out the conflict monitor and how to add a bike phase to an already eight-phase intersection. One agency mentioned detection being an issue.
Table 23. Design Constraints for Placing Bicycle Signal
Response # of Agencies* Hard to place 11 Traffic control clutter 9 Not enough right of way (ROW) 5 Outdated signal infrastructure 4 Sight distance 3 Detection 1 Phasing/Controller constraints 1 Unsure 1
* Most agencies mentioned multiple design issues.
Question 15: Have you had any challenges in installing the R10-10b “Bicycle Signal” sign with bike signals face?
A third of the respondents (33%, n=7) indicated that they had not experienced any challenges with installing the R10-10b bicycle signal sign, as seen in Table 24. Another third (n=6) expressed
59
challenges in installing the sign. Two agencies mentioned issues or concerns about the additional wind load presented by the sign on mast arm installations. Two respondents noted that it was often challenging to find a location for the sign adjacent to the bicycle symbol face. Five of the agencies were not using the sign on most installations. A couple of the respondents expressed the opinion that the sign was redundant to the information provided by the bicycle symbol in the signal face. One agency has developed a design for the sign that incorporates the signal head (similar to a backplate but as a sign).
Table 24. Challenges with Installing the R10-10b “Bicycle Signal” Sign
Response # of Agencies No challenges with the sign 6 Do not use 8 Challenges* 7 Additional wind load 2 Close enough to the bicycle signal 1 Space / sign clutter / size of sign 2 No specific detail 2
* Some agencies mentioned multiple design issues.
Do you think these signs are beneficial? Why or why not?
Of the 16 agencies that were asked this follow-up question, five (35%, n=5) agencies indicated that they thought the sign was beneficial, as seen in Table 25. Two agencies clarified their response was for signals without the bicycle symbol in the face. When the bicycle symbol is used in the face, they thought the sign might not be needed. A number of agencies noted that the sign is an additional communication (primarily for motor vehicle drivers), is intuitive and doesn't require that the user recognize the bicycle symbol. However, the majority (57%, n=8) of agencies do not think the sign is necessary/beneficial. One agency noted that if they were not required to use them, they would not to avoid clutter. Two agencies commented that traffic control devices should not need a sign to explain them and generally felt the bicycle symbol signal alone was understood.
Table 25. R10-10b Sign Beneficial
Response # of Agencies Yes 5 No 8 Maybe / Unsure 1
Operations
Question 16: Some jurisdictions make the bike signal housing and/or backplate different from the motor vehicles signals. If you have used this technique, at which locations, and do you think it was effective?
There were mixed responses concerning differentiating the bicycle signal housing and/or backplate from the vehicle signals, as shown in Table 26. A third (33%, n=7) of agencies indicated that they had used this approach with some anecdotal success. One agency identified a location
60
where the signal housing and backplate are distinctly different, and while they don't have concrete data, they feel that using a different color makes the bicycle signals stand out. Another agency noted that they have recently implemented this type of design and are collecting data. One agency noted that yellow backplates are the standard in their design guide. Four agencies (n=4) responded that they had not yet tried this technique but were interested in exploring it. More agencies (43%, n=9) indicated they either had not tried this approach or they do not typically use signal backplates. One agency pointed out that the MUTCD requires backplates to be black (i.e., a yellow backplate would be non-compliant). One agency noted that they had placed vehicle signals horizontal and bicycle signals vertical at some intersections (also done with their bus queue jump signal heads). Another noted that they had placed the bicycle signal horizontal and vehicle signals vertical to differentiate them. One agency stated that the more important design feature is that the signal indication is directly overhead the facility it's serving. Finally, one agency commented that it might not be a good idea to make the bicycle signal different as drivers need information from the signals as well.
Table 26. Use of Color or Backplate to Distinguish Bicycle Signal
Response # of Agencies Yes 7 No 9 Try 4 Not Applicable 1
Question 17: Do you think more research is needed on ways to differentiate bicycle signals from vehicular signal heads?
The majority of the agencies (67%, n=14) felt that more research is needed on ways to differentiate bicycle signals from vehicular signal heads. A summary of the responses is shown in Table 27. One agency felt that since the same red-amber-green color indications and signal head frames are used for both vehicular and bicycle signal indications, it would be helpful to identify means to distinguish bicycle heads from others. Agencies felt that it would be helpful to have research that provides definitive guidelines on the signal face, size, and presence of signs. One agency opined that it was very difficult to get the horizontal separation, especially when trying to keep the intersections compact, so there is a need to distinguish the signal heads. A suggestion to use an entirely different color for bicycle signal heads separate from the vehicular signal heads was put forth by one agency. However, another agency noted that maintenance challenges (cost) could arise with the use of two different housings.
About 24% of the agencies (n=5) did not think that additional research was warranted. One agency felt that the sign was sufficient for differentiating the vehicular and bicycle traffic signals, while another noted that the lack of complaints/operational issues indicated that more research was not needed. One agency wanted to monitor the installations to determine if additional research was warranted. One agency did not have an opinion.
61
Table 27. Research Needed, Differentiate Bicycle Signals
Response # of Agencies Yes 14 No 5 Monitor 1 No opinion 1
Question 18: Has IA-16’s requirement that “bike signals shall be limited to situations where bicycles moving on a green or yellow signal indication in a bicycle signal face are not in conflict with any simultaneous motor vehicle movement” impacted how many bike signals you have installed? Or how you have installed them?
A majority (57%, n=12) of the agencies stated that the IA-16’s requirement of limiting bike signals to situations where the bicycles are not in conflict with simultaneous motor vehicle movement had impacted the number of bike signals they have installed, as shown in Table 28. More than one agency stated that there is a need for more flexibility, citing a number of situations where, in their opinion, a bicycle signal could be operated safely and efficiently but not in compliance with IA-16. One agency stated that research on the relative need/safety benefit of this requirement is needed, citing the long delays that result to all users when only movements without conflicts are required. As an example, one agency stated that a compliant design required them to stop all vehicular movements during the bicycle green because a right-turn lane was not present. In addition, some agencies have interpreted the guidance to limit the use of leading bike intervals (LBIs). Other agencies have used the MUTCD RTE process to implement LBIs, delayed turns, or non-exclusive movements that do not comply with the IA-16 requirement. However, 33% (n=7) of the agencies stated that the IA-16 requirement did not impact their installations. These agencies stated that they installed bike signals at locations with exclusive bicycle movements only.
Table 28. IA-16 Impacted Installation of Bicycle Signal Faces
Response # of Agencies Yes 12 No 7 Not Applicable 2
Question 19: Have you had to restrict vehicles from making certain movements on a bicycle green? If yes, which movements were restricted?
Nearly all agencies restrict motor vehicle movements with the bicycle green (86%, n=18), as would be expected with the installation of the bicycle signal, as seen in Table 29. Nearly all of the restrictions involve motor vehicle turns as seen in Table 30. For installations on the two-way bicycle facilities, the left-turn movement is generally restricted. Four agencies mentioned restricting vehicles from making a right turn on red during the bicycle green. For the right-turning movement, several agencies discussed the design considerations of traffic flow and available space when selecting to install a bicycle signal. For lower right-turning volumes, they indicated they might consider a “mixing zone” design over a bicycle signal.
62
Table 29. Vehicle Movements Restricted During Bicycle Green
Response # of Agencies Yes 18 No 1 Not Applicable 2
Table 30. Type of Vehicle Movements Restricted
Response # of Agencies All movements 2 Turns (Left or Right) 13 Through 1
Are they restricted throughout the phase, or only during a certain portion of the phase?
While 33% of the agencies (n=7) stated that they restrict vehicles throughout the bicycle green, 38% of the agencies restricted vehicles only for a part of the bicycle green phase, as shown in Table 31. One agency stated that the part-time restrictions for vehicles are in place only during the lead interval.
Table 31. Duration of Phase Vehicle Movements Restricted
Response # of Agencies All 7 Part 8 No response 6
Do you use traffic signals, signal arrow faces, signs, or a combination of these to restrict movements?
A total of 57% of the agencies stated that they use a combination of traffic signals, signal arrow faces, and signs to restrict vehicle movements, as shown in Table 32. Ten percent of the agencies (n=2) stated that they use arrows only, while 5% of the agencies stated they used signals or signs only (n=1). Twenty-three percent (n=5) of the agencies did not respond to this question.
Table 32. Methods for Restricting Vehicle Movements
Response # of Agencies Combo 12 Arrows 2 Signals 1 Signs 1 No response 5
63
Question 20: Do you think the person on a bicycle expects to have an exclusive movement on a green bicycle symbol?
The opinions of the agencies interviewed were split on whether the person on a bicycle expects to have an exclusive movement on a green bicycle symbol (Yes, n=9; No, n=7). Note that as used here and in the rest of the text, exclusive means “not in conflict with other users” rather than phasing. A summary of the responses is presented in Table 33. One agency thinks that bicyclists expect to have exclusive movement because at most of their installations arrow signals are present on the same mast arm as the bike signal, and the bicyclists are able to view their green indication along with the red indication for vehicles. Another agency stated that bicyclists expect exclusivity because typically people expect that green indication means that they have the right-of-way. Another agency stated that because bicyclists expect exclusive movement, this leads to confusion during the delayed turn (LBI/ Split LBI). One agency has a mix of bike signals, some of which allowed exclusive movements while others did not, so there is no way for the bicyclists to know. Another agency thought that bicyclists interpret the green bicycle symbol as a green ball and therefore do not expect the movement to be exclusive. Three agencies stated that the expectation of exclusivity depended on context.
Table 33. Expectation of Persons on Bicycle for Exclusive Movement on Green Bicycle
Response # of Agencies Yes 9 No 7 Depends on context 3 Not Applicable / No Response 2
Do you think the person on a bicycle is confused by a green vehicle signal when their bicycle signal face is red?
As a follow-up, 28% of the agencies felt that a person on a bicycle would be confused by a green vehicle signal when their bicycle signal face is red, while 43% of the agencies did not think the situation would be confusing, as shown in Table 34. One agency stated that the vehicular green signal could be confusing because bicycles can behave as vehicles if they choose to. Another agency stated that the confusion might not exist if bicycles can see the conflicting movement, but it may lead to confusion if they cannot see the conflicting movement. One agency which thought that the bicyclist would not be confused by the green vehicle signal when their bicycle signal is red stated that the parallel walk indication would frustrate the bicyclists, especially if they have to remain stopped.
Table 34. Confusion, Person on Bicycle with Green Bicycle and Red Vehicle
Response # of Agencies Yes 6 No 9 Maybe 4 Not Applicable / No Response 2
64
Do you think there are issues with concurrent green vehicle and bicycle signal faces?
As a follow-up, the majority of agencies (62%, n=13) did not think there were issues with concurrent green vehicle and bicycle signal faces (responses to this question parallel the opinions on the primary question of exclusive movement). A summary of the responses is shown in Table 35. A number of agencies clarified that as long as there are no conflicting (turning) movements, there would not be any issues. One agency did not see a difference with the green ball and noted at some intersections motor vehicle drivers don’t know if they are facing a split-phase or a permitted left turn. Interestingly, one agency raised an idea that there is a potential for bike signals to be similar to pedestrian signals as a message to turning drivers that bicyclists are present.
Table 35. Issues with Concurrent Green Vehicle and Bicycle Signal Faces
Response # of Agencies Yes 3 No 13 Depends on context 1 No Response 4
Question 21: What would be the best way to communicate with a person on a bicycle that their movement is permissive or conflicts with other road users?
Three agencies stated that they only use bicycle signals with exclusive phases for bikes, so there was currently no need for a permissive display. The remaining agencies expressed a number of design and operational ideas that might be the best way to communicate with a person on a bicycle that their movement is permissive. A flashing yellow bicycle signal (or other variants) was noted by eight agencies as a potential idea, drawing parallels to the flashing yellow arrow display. A combination of the green bicycle symbol and green ball was also noted as a potential option. Signage with a very clear, concise message (e.g., "bicyclists watch for turning vehicles" or “turning bicyclists yield sign”) was suggested. Pavement markings may also be an option. Two agencies stated that there are right-of-way issues implied and that driver education and better awareness of their yielding requirements needs to be part of the solution. Finally, four of the responses indicated that the concept, in general, needs research and that whatever display is used, it needs to be clear to the bicyclists whether they have the right-of-way or whether to expect conflicts.
Question 22: Have you or do you plan to use arrows in combination with bike symbols as allowed in IA-16?
The majority of agencies (76%, n=16) do not have any plans to use the arrows as allowed in IA-16 with the bicycle symbol faces, as seen in Table 36. Several agencies were concerned about driver confusion and how to clarify that the arrow is for the bicycle movement and not vehicles. Three agencies noted that they were considering it for a special situation. Two agencies reported using the arrows - one location is an intersection with a one-way street where there is a bike signal on one side of the street, and the other is a connection to a busy campus route.
65
Table 36. Plans to Use Arrows with Bicycle Symbols
Response # of Agencies Yes 2 No 16 Maybe 3
Question 23: Are you using yellow change or red clearance intervals for bicycle signal phases?
The majority of the agencies (76%, n=16) use both yellow change and red clearance intervals for bicycle signal phases, as seen in Table 37. One agency stated that common complaints are received regarding the green time but never regarding the yellow change or red clearance. One agency stated that they used the additional time for the red intervals to accommodate bicycles but not the yellow, while four agencies did not respond to this question.
Table 37. Use of Yellow and Red Clearance Intervals
Response # of Agencies Both 16 Red 1 No Response 4
If yes, how are you determining their duration? Do you think that this is an area where additional research is needed?
Agencies reported using guidance from the ITE webinars, NACTO Urban Bikeway Design Guide, and AASHTO Guide for the Development of Bicycle Facilities, 2012 Edition (“AASHTO Bike Guide") to determine the duration of these intervals. The number of responses received is shown in Table 38. One agency stated that they used AASHTO guidelines and ended up with very large clearance times. Agencies were fairly evenly split regarding whether additional research was needed for determining yellow change and red clearance durations (Yes, 52%; No, 48%). One agency stated that research should focus on the all-red duration only. Another agency stated that calculations for red clearance might result in time that is not being used, and suggested looking at existing yellow and red intervals and determining if longer intervals do increase safety. Another agency stated the need for additional information on what minimum clearances should be and suggested that local jurisdictions determine how much additional clearance time is needed based on context. Finally, one agency wondered why the 2012 edition of the AASHTO Bike Guide recommends higher duration clearance intervals when bicyclists are detected at a signal, as bicycles are also present at other intersections.
Table 38. Research Needed, Signal Timing Guidance
Response # of Agencies Yes 11 No Response 10
66
Research Ideas
Question 24: Please give us your assessment from 1=low priority to 5=highest priority of the following potential research topics:
Appropriate traffic control devices to communicate to a person on a bicycle that their movement is permissive or has conflicts emerged as the top research topic with the highest average score and highest number of five priority rankings, as seen in Table 39. Heterogeneity among existing bicycle signal installations underscores this need. For example, some bicycle signal installations installed under the FHWA Request to Experiment (RTE) process were reported by agency staff to have some form of permissive phasing—and the same is inherently true for an LBI—while those following the guidelines of IA-16 are fully protected for cyclists from conflicting motor vehicle turning movements. Appropriate traffic control devices to communicate allowable movements to a person on a bicycle and guidance on the timing of yellow-change or red-clearance intervals for bicycle signal phases were also highly ranked by the participants. Most participants ranked additional comprehension added by the R10-10b Bicycle Signal sign the lowest.
Table 39. Summary of Ranked Potential Research Gaps
Potential Research Topic Average Score
Number of “5” Priority Rankings
g) Appropriate traffic control devices to communicate to a person on a bicycle that their movement is permissive or has conflicts with vehicles. 4.2 11
h) Appropriate traffic control devices to communicate allowable movements to person on a bicycle. 3.7 6
i) Guidance on timing of yellow change or red clearance intervals for bicycle signal phases. 3.6 8
a) Distance and placement where the bicycle symbol may not be clearly distinguishable from a circular display. 3.5 7
d) Design approaches to differentiate bicycle signals from vehicular signal heads. 3.4 2
e) Bicyclist compliance of traffic signals based on the placement of bicycle and vehicle signal faces in proximity. 3.4 5
b) Guidance on visibility distance and road user comprehension by lens sizes. 3.3 5
c) Minor design refinements in the bicycle symbol design for conspicuity. 2.5 1 f) Additional comprehension added by the R10-10b “Bicycle Signal” sign. 2.4 1
Question 25: Are there any other areas related to bicycle signals that you think need additional research or issues we should know about?
Agencies suggested several additional topics related to bicycle signals not already addressed in the questions:
• Feasibility and best practice of louvered bicycle signals. • Guidance on bicycle detection and feedback confirmation. • Guidance on LBIs and how best to communicate to the bicyclist to use the lead interval. • Maintenance aspects of bicycle signals.
67
• Thresholds for bicycle signal warrants and associated criteria. • Criteria for the use of near-side 4-inch indication and associated benefits (if any). • Guidance on the number of bicycle signal heads (is one indication sufficient?). • Guidance on signal timing (including minimum green), phasing, and progression techniques. • Techniques for driver education and inclusion of bicycle-focused educational material in
driver licensing materials.
Summary
The interview questionnaire consisted of 25 questions that were divided into six categories. These categories included questions on experience with bicycle signals, road user understanding, lens visibility and conspicuity, placement of the bicycle signal face, operations, and research ideas. A number of clear trends emerged from the interviews as potential research gaps (not all related to road user understanding):
• Placement of bicycle signals in relation to the driver line of sight. • Guidance on appropriate distance for visibility when using a bicycle signal with a bicycle
symbol face in the lens. • Refinement of the specifications for display intensity and symbol design. • Guidance on selection of lens size considering visibility distance, including 4-inch near-side
signal heads. • Techniques to differentiate the bicycle signal from motor vehicle signal heads. • Tradeoffs associated with signal timing and phasing strategies for bicycles (exclusive
phasing, LBI, delayed turn). • Guidance on ways to communicate with a person on a bicycle that their movement is
protected or permissive and conflicts with other road users. • Examining current guidelines for yellow change and red clearance and determining if longer
intervals increase safety.
68
C H A P T E R 5
Identified Research Gaps
Three gaps in the knowledge were identified following the literature review, inventory of existing bicycle symbol signal faces, and interviews with stakeholders. In priority order, these research gaps are specific to a road user’s understanding of bicycle symbols in the signal are:
• Optimal methods to communicate allowable, protected, or permissive movements to bicyclists at signalized intersections.
• Evaluation of size, placement, and orientation of bicycle signal faces on bicyclist and driver comprehension and compliance.
• Guidance on visibility and detection of bicycle symbols in signal faces by lens size and distance.
The following subsections briefly describe the research gaps and associated contexts. Full research needs statements, in the NCHRP format, were developed and are included in Appendix C. It should be noted that there are aspects of the research gaps that somewhat overlap; however, they are formulated as distinct research statements. It would be possible to combine elements of each statement into a larger research project.
Optimal Methods to Communicate Allowable, Protected, or Permissive Movements to Bicyclists at Signalized Intersections
The Interim Approval for the use of bicycle signals faces (IA-16) in the U.S. limits their use where the bicycle movement is “protected from any simultaneous motor vehicle movement at signalized intersections (FHWA, 2014).” This requirement suggests that the GREEN BICYCLE display indicates to a person on a bicycle that their movement is protected. Compliance with this provision requires the installation of fully protected phases for bicyclists, and often requires exclusive turn lanes for left and right turns for motor vehicle movements that cross the bicycle lane or signal timing strategies which limit the available green time for bicyclists to proceed while all adjacent vehicle traffic is stopped. IA-16 also prohibits the use of signs alone to restrict bicycle movements. If it is necessary, turn arrows on the bicycle signal face can be used to communicate allowable movements and to restrict conflicting bicycle movements.
No published research was found on the best ways to communicate with a person on a bicycle or other road users which movements are allowable from the bicycle lane and whether those movements are protected or permissive. A number of agencies are experimenting, through the MUTCD experimental process, with allowing permissive motor vehicle turns across the bicycle facility when bicyclists have displayed the GREEN BICYCLE symbol. Other agencies are using a FLASHING YELLOW BICYCLE to indicate a permissive bicycle movement. In some jurisdictions, the GREEN BICYCLE symbol varies from protected to permissive depending on installation date as discussed in the agency in interviews for this research. In the stakeholder interviews, the need for this research was often discussed and ranked highest in need.
69
Further research is needed to identify or confirm the best method to communicate with a person on a bicycle and other road users through traffic control devices. The primary research objective would be to develop an understanding of actual bicyclist movements while facing the GREEN BICYCLE symbol from typical intersection configurations, including what movements are allowable from the bicycle lane. This could be completed through observational methods. A human factors experiment would be designed and executed in a controlled lab or field research study to quantify comprehension of the existing GREEN BICYCLE symbol, comprehension of alternative traffic control devices such as four section heads with the green ball for permissive phases, flashing signals, signs, or pavement markings. In addition, while the use of arrow displays to control bicycle movements is likely intuitive, there has not been any human factors research to verify this understanding or explore alternatives. As part of this research, some consideration would be given to the comprehension of people driving and using electric mobility devices (e.g., scooters, hoverboards, etc.).
Evaluation of Size, Placement, and Orientation of Bicycle Signal Faces on Bicyclist and Driver Comprehension and Compliance
Interim Approval of bicycle signals faces (IA-16) provides guidance on the design and placement of bicycle signals at intersections and relative to other vehicular traffic signal indications. NACTO’s Urban Bikeway Design Guide and the MassDOT Separated Bike Lane Planning and Design Guide provide additional guidance. Cities, however, have implemented a wide variety of bicycle signal designs and there is limited information on how the design and placement positively or negatively affect bicycle operations and safety. For example, there is no consensus on the horizontal and vertical distance from vehicular traffic signals or the use of near-side signal heads. Of the approximately 500 bicycle signal installations surveyed in the U.S. as part of this project, a majority (51%) use two or more bicycle signal heads per approach but there is no standard requiring more than one signal head. Locations that had two or more bicycle signal heads per approach typically used a far-side/near-side arrangement. With more bicyclists and bicycle traffic signals, there is greater variability in how these traffic control devices are designed and implemented. Ultimately, this impacts how they command respect from roadway users.
There is limited research on how a bicyclist’s behavior is affected by the size, placement, and orientation of bicycle traffic signals. Current bicycle signal designs mirror vehicular signals in many ways, which may cause confusion and raises questions about the transferability of these design assumptions. For example, motor vehicle traffic signal indications are placed within a driver’s cone of vision as they approach an intersection. Does the bicyclist cone of vision differ from a driver’s cone of vision? Is there a benefit to overall operations of allowing the motor vehicle driver to see the bicycle signal face? Finally, the interview with agency practitioners revealed questions about whether bicycle signal design affects user comprehension and, ultimately, traffic signal compliance. In all, there is limited information on which bicycle signal design best meets MUTCD traffic control device principles and which strategies support uniformity principles for all users under different bikeway design configurations.
The primary research objective would be to determine optimal design and placement of bicycle signals and how compliance with bicycle signal relates to comprehension. The research would consider the influence of the number of bicycle signal heads per approach; near- and far-side installations; size of indication (4-, 8-, or 12-inch); horizontal and vertical distance of bicycle signals to vehicle signals; presence of louvers and backplates; and the distance from bicycle stop line to bicycle signal. Potential research methods could include a) video data collection, b)
70
intercept and group survey, and c) naturalistic eye-tracking study, d) simulator tests, and e) closed-course test tracks.
Guidance on Visibility and Detection of Bicycle Symbols in Signal Faces by Lens Size and Distance
Conspicuity and the distance at which the bicycle symbol in the signal face is distinguishable is key to the safety of bicyclists and other road users. IA-16 currently requires far-side bicycle signals to use 8- or 12-inch lenses, while near-side lenses can be 4-, 8-, or 12-inch.
No published research studies were found that have directly addressed the visibility of the bicycle symbol in the signal lens. Visibility includes placement for optimal detection by road users, conspicuity of the lens, and detection distances. There are two separate issues related to the comprehension of the bicycle symbol in the signal face: 1) recognizing that the symbol face denotes the signal as exclusive for bicycles, and 2) knowing which movements are allowed by the displayed indications. No published research studies were found that have directly addressed comprehension of the bicycle symbol in the signal face, either for bicyclists or drivers. The guidance for signal face sizing (lens size) by distance appears to be derived primarily from the guidance for motor vehicle signals. In the agency interviews, lack of clear guidance was often cited as a need.
No human factors research on the size of the signal lens or the design of the bicycle symbol within the lens, and longitudinal placement of the signal head to optimize the detection distance from the stop line for cyclists were identified in the literature. In addition to the detection distance of the bicycle symbol in the signal face, the design of the bicycle symbol within the lens face itself plays a significant role in both motorist and bicyclist comprehension. While there are slight variations in the symbol presented internationally, little research or guidance has been provided on the optimal design of the signal face. Because the bicycle symbol plays a significant role in distinguishing between separate user controls at an intersection, refining the design of existing symbols could improve the conspicuity of the signal. Finally, a source of potential driver confusion is that the color of the bicycle signal indications is the same as vehicular signal indications and at some distances and LED intensities, the bicycle symbol may not be distinguishable from a circular display, causing additional confusion. A similar issue was identified in the first light-rail transit signals, which led to the adoption of a monochromatic and unique symbol (Korve, 1996).
The primary objective of the research would be to develop guidelines for the overall bicycle symbol design in the signal face, including size and brightness to improve conspicuity, improved design of bicycle symbol in the signal face for optimal detection, and determination of bicycle signal face detection distance. The research would explore lens size for various applications of far-side and near-side placement. The research would include a survey of design practice to identify approaches that are used in the U.S. and internationally. Following the review, research would conduct a controlled lab or field study to determine optimal lens size, bicycle symbol design, and detection distances based on the data analysis. Consideration should be given to methods that address potential driver confusion with bicycle symbols and green ball at certain distances.
71
References
AASHTO. 2012. Guide for the Development of Bicycle Facilities. Anderson, M. 2014. “7 lessons from Seattle’s spectacular protected bike lanes on Broadway” http://peopleforbikes.org/blog/7-lessons-from-seattles-spectacular-broadway-protected-bike-lanes/ Arhin, S.A., N. Errol, L. Mesfin, and W. McGuirk. 2011. “Comparative Study of Countdown Pedestrian Signal Displays – A Case Study in the District of Columbia.” Presented at the 90th Annual Meeting of the Transportation Research Board, Washington D.C. Asante, S.A., S.A. Ardekani, and J.C. Williams. 1993. Selection Criteria for Left-Turn Phasing, Indication Sequence, and Auxiliary Sign. Report 1256-1F, Civil Engineering Department, University of Texas at Arlington, Arlington, TX. Ben-Bassat, T., and D. Shinar. 2006. “Ergonomic Guidelines for Traffic Sign Design Increase Sign Comprehension.” Human Factors: The Journal of Human Factors and Ergonomics Society. 48 1 , pp. 182–195. DOI:10.1518/001872006776412298 Bonneson, J.A., and P.T. McCoy. 1993. Evaluation of Protected/Permitted Left-Turn Traffic Signal Displays. Report TRP-02-27-92. Civil Engineering Department, University of Nebraska-Lincoln, Lincoln, NE. Boot, W., N. Charness, N. Roque, K. Barajas, J. Dirghalli, J. and A. Mitchum. 2015. The Flashing Right Turn Signal with Pedestrian Indication: Human Factor Studies to Understand the Potential of a New Signal to Increase Awareness of and Attention to Crossing Pedestrians. Final Report. Florida Department of Transportation. Borowsky, A., D. Shinar, and Y. Parmet. 2008a. “The Relation Between Driving Experience and Recognition of Road Signs Relative to Their Locations.” Human Factors: The Journal of Human Factors and Ergonomics Society. 50 2 , 173–182. Borowsky, A., D. Shinar, and Y. Parmet. 2008b. “Sign Location, Sign Recognition, and Driver Expectancies.” Transportation Research Part F Traffic Psychology and Behavior. 11 6 , pp. 459–465. DOI:10.1016/j.trf.2008.06.003 Boudart, J., N. Foster, P. Koonce, J. Maus, and L. Okimoto. 2017. “Improving Bicycle Detection Pavement Marking Symbols to Increase Comprehension at Traffic Signals.” ITE Journal, pp.29-34. Boudart, J., R. Liu, P. Koonce, and L. Okimoto. 2015. “Assessment of Bicyclist Behavior at Traffic Signals with a Detector Confirmation Feedback Device.” Transportation Research Record: Journal of the Transportation Research Board, No. 2520, pp. 61–66. Brehmer, C.L., K.C. Kacir, D.A. Noyce, and M.P. Manser. 2003. NCHRP Report 493: Evaluation of Traffic Signal Displays for Protected/Permissive Left-Turn Control, Transportation Research Board of the National Academies, Washington, D.C.
Brewer, M.A., K. Fitzpatrick, and R. Avelar. 2015. “Rectangular Rapid Flashing Beacons and Pedestrian Hybrid Beacons: Pedestrian and Driver Behavior Before and After Installation.” Transportation Research Record: Journal of the Transportation Research Board, Vol. 2519, pp. 1–9. California Department of Transportation. 1996. California Traffic Manual. 2002 update. California Department of Transportation. 2006. California MUTCD. California Department of Transportation. 2012. California MUTCD. California Department of Transportation. 2018. California MUTCD. 2018 Update Casello, J.M., A. Fraser, A. Mereu, and P. Fard. 2017. “Enhancing Cycling Safety at Signalized Intersections: Analysis of Observed Behavior.” Transportation Research Record: Journal of the Transportation Research Board, Vol. 2662, pp. 59–66. Chen, P., C. Pai, R. Jou, W. Saleh, and M. Kuo. 2015. “Exploring motorcycle red-light violation in response to pedestrian green signal countdown device.” Accident Analysis and Prevention, Vol. 75, pp. 128–136.
Chicago Department of Transportation. 2002. Countdown Pedestrian Signal Study. Final Report, Chicago, Ill. Chrysler, S., K. Fitzpatrick, M. Brewer, and M. Cynecki. 2011. Pedestrian and Bicyclist Traffic Control Device Evaluation Methods. FHWA-HRT-11-035, Federal Highway Administration. Clifford, S., K. Millard, S. Greenshields, and A. Wells. 2018. Low-Level Cycle Signals. On-Street Observations of Early Release and Hold the Left. Project Report PPR856, Transport for London. Cole, B., and B. Brown. 1968. “Specification of Road Traffic Signal Light Intensity,” Human Factors: The Journal of the Human Factors and Ergonomics Society, Vol. 10, No. 3. CROW. 2007. Design Manual for Bicycle Traffic. Department of Transport. 2016. The Traffic Signs Regulations and General Directions. Denver, CO - City and County. (2009). Bicycle Traffic Signal Behavior Study. By Ordonez and Vogelsang, LLC & Jacobs Engineering.
Dissanayake, S. and J. J. Lu. 2001. “Traffic Control Device Comprehension: Differences between Domestic and International Drivers in USA.” IATSS Research, Vol. 25, No. 2, pp. 80-87.
Drakopoulos, A. and R.W. Lyles. 2001. “Use of Multivariate Multiple Response Analysis of Variance Models to Evaluate Driver Comprehension Errors of Flashing Traffic Signal Operations.” Journal of Safety Research, Vol. 32, No. 1, pp. 85-106. Eccles, K. A., R. Tao, and B.C. Mangum. 2004. “Evaluation of Pedestrian Countdown Signals in Montgomery County, Maryland.” Transportation Research Record: Journal of the Transportation Research Board, Vol. 1878, pp. 36–41.
Elekwachi, O. L. 2010. Empirical Investigation of the Effect of Countdown Pedestrian Signals on Driver Behavior and Capacity at Urban Signalized Intersections. Ph.D. dissertation, Morgan State University, Baltimore.
73
FHWA. 2000. Manual of Uniform Traffic Control Devices for Streets and Highways. Millennium Edition. FHWA. 2004. Standard Highway Signs. https://mutcd.fhwa.dot.gov/ser-shs_millennium_eng.htm FHWA. 2009. Manual of Uniform Traffic Control Devices for Streets and Highways. https://mutcd.fhwa.dot.gov/kno_2009r1r2.htm FHWA. 2013. Interim Approval for Optional Use of a Bicycle Signal Face (IA-16). https://mutcd.fhwa.dot.gov/resources/interim_approval/ia16/ FHWA. 2014. Official Interpretation #9(09)-47 (I) on Clarification of IA-16. https://mutcd.fhwa.dot.gov/resources/interpretations/9_09_47.htm Fitzpatrick, K., and E.S. Park. 2009. “Safety Effectiveness of HAWK Pedestrian Treatment.” Transportation Research Record: Journal of the Transportation Research Board, Vol. 2140, pp. 214–223. Fitzpatrick, K., and M. P. Pratt. 2016. “Road User Behaviors at Pedestrian Hybrid Beacons.” Transportation Research Record: Journal of the Transportation Research Board, Vol. 2586, pp. 9–16. Fitzpatrick, K., M. Brewer, and R. Avelar. 2014. “Driver Yielding at Traffic Control Signals, Pedestrian Hybrid Beacons, and Rectangular Rapid-Flashing Beacons in Texas.” Transportation Research Record: Journal of the Transportation Research Board, Vol. 2463, pp. 46–54. Fitzpatrick, K., V. Iragavarapu, M.A. Brewer, D. Lord, J. Hudson, R. Avelar, and J. Robertson. 2014. Characteristics of Texas Pedestrian Crashes and Evaluation of Driver Yielding at Pedestrian Treatments, Report No. FHWA/TX-14/0-6702-1, Texas Department of Transportation, Austin, TX. Fucoloro, T. 2016. “New 2nd Ave Traffic Signals Clear Up Confusion.” https://www.seattlebikeblog.com/2016/01/19/new-2nd-ave-traffic-signals-clear-up-confusion/ Gunderson, S. 2017. “Bike Signals Made Better by Design.” http://yoursimpletruth.com/blog/better-by-design/. Godavarthy, R.P. and E.R. Russell, Sr. 2010. “Effectiveness of a HAWK Beacon Signal at Mid-Block Pedestrian Crossings in Decreasing Unnecessary Delay to the Drivers.” Presented at 89th Annual Meeting of the Transportation Research Board, Washington, D.C. Goodno, M., N. McNeil, J. Parks, and S. Dock. 2013. “Evaluation of Innovative Bicycle Facilities in Washington, D.C.: Pennsylvania Avenue Median Lanes and 15th Street Cycle Track.” Transportation Research Record: Journal of the Transportation Research Board, Vol. 2387, pp. 139–148. Greenshields, S., M. Gupta, and A. Wells. 2018. Cycle Gates. Understanding Bicycle Movements at Traffic Light Controlled Cycle Gates. Project Report PPR857, Transport for London. Hankey, J.M., W.W.Wierwille, W.J. Cannell, C.A. Kieliszewski, A. Medina, T.A. Dingus, and L.M. Cooper. 1999. Identification and evaluation of driver errors: Task C Report, Driver Error Taxonomy Development, Project No. Dtfh-61-97-c-00051, Virginia Tech Transportation Institute, Blacksburg, VA.
Henery, S. and R. Geyer. 2008. Assessment of Driver Recognition of Flashing Yellow Left-Turn Arrows in Missouri. Final Report. Missouri Department of Transportation. Hiron, B, A. Isler, and F. Tortel. 2014. “Signs and signals for cyclists and pedestrians: comparison of rules and practices in 13 countries.” Transport Research Arena (TRA) 5th Conference: Transport Solutions from Research to Deployment, Institut Francais des Sciences et Technologies des Transports, de l'amacnagement et des Racseaux (IFSTTAR). Horrey, W.J., C.D. Wickens, and K.P Consalus. 2006. “Modeling drivers’ visual attention allocation while interacting with in-vehicle technologies.” Journal of Experimental Psychology 12(2) , pp. 67–78. DOI:10.1037/1076-898X.12.2.67 Huang, H., and C. Zeeger. 2000. “The Effects of Pedestrian Countdown Signals in Lake Buena Vista.” University of North Carolina, Chapel Hill, NC.
Hulscher, F. 1975. “Photometric Requirements for Long-Range Road Traffic Light Signals” Journal of the Australian Road Research, 5(7). Hunter-Zaworski, K. and J. Mueller. 2012. Evaluation of Alternative Pedestrian Traffic Control Devices. Report No. FHWA –OR -RD-12-09, Oregon Department of Transportation, Salem, OR. Hurwitz D., C. Monsere, H. Tuss, K. Paulsen, and P. Marnell. 2013. Improved Pedestrian Safety at Signalized Intersections Operating the Flashing Yellow Arrow. Oregon Transportation Research and Education Consortium (OTREC), OTREC-RR-13-02, Portland, OR. Hurwitz, D.S., C.M. Monsere, P. Marnell, and K. Paulsen. 2014. “Three- or Four-Section Displays for Permissive Left Turns? Some Evidence from a Simulator-Based Analysis of Driver Performance.” Transportation Research Record: Journal of the Transportation Research Board, Vol. 2463, pp. 1–9. DOI 10.3141/2463-01. Hurwitz, D., H. Jashami, K. Buker, C. Monsere, S. Kothuri, and A. Kading. 2018. Towards Safer Protected/Permitted Right-Turn Phasing for Drivers, Bicyclists and Pedestrians. Final Report, SPR 789, Oregon Department of Transportation. Jashami, H., D.S. Hurwitz, C. Monsere, and S. Kothuri. 2019. “Evaluation of Driver Comprehension and Visual Attention of the Flashing Yellow Arrow Display for Permissive Right Turns.” Transportation Research Record: Journal of the Transportation Research Board, Vol. 2673, pp. 397–407.
Johnson, M., S. Newstead, J. Charlton, and J. Oxley. 2011. “Riding Through Red Lights: The Rate, Characteristics and Risk Factors of Non-Compliant Urban Commuter Cyclists.” Accident Analysis and Prevention, Vol. 43, (1), pp. 323-328.
Johnson, M., S. Newstead, J. Charlton, and J. Oxley. 2013. “Why do Cyclists Infringe at Red Lights? An Investigation of Australian Cyclists’ Reasons for Red Light Infringement.” Accident Analysis and Prevention, Vol. 50, pp. 840-847. King, G.F. 1981. “Visibility of Circular Traffic-Signal Indications.” Transportation Research Record 811, pp. 7–14. Kitali, A., T. Sando, A. Castro, D. Kobelo, and J. Mwakalonge. 2018. “Using Crash Modification Factors to Apprise the Safety Effects of Pedestrian Countdown Signals for Drivers.” Journal of Transportation Engineering, Part A: Systems, Vol. 144, No. 5.
75
Kittelson & Associates, Inc., Herbert S. Levinson Transportation Consultants, and DMJM+Harris. 2007. TCRP Report 118: Bus Rapid Transit Practitioner’s Guide. Transportation Research Board.
Knodler, M.A. Jr., D.A. Noyce, K.C. Kacir, and C.L. Brehmer. 2005. “Evaluation of Flashing Yellow Arrow in Traffic Signal Displays with Simultaneous Permissive Indications.” Transportation Research Record: Journal of the Transportation Research Board, Vol. 1918, pp. 46–55. Knodler, M.A. Jr., D.A. Noyce, K.C. Kacir, and C.L. Brehmer. 2006a. “Analysis of Driver and Pedestrian Comprehension of Requirements for Permissive Left-Turn Applications.” Transportation Research Record: Journal of the Transportation Research Board, Vol. 1982, pp. 65–75. Knodler, M.A. Jr., D.A. Noyce, K.C. Kacir, and C.L. Brehmer. 2006b.” Potential Application of Flashing Yellow Arrow Permissive Indication in Separated Left-Turn Lanes.” Transportation Research Record: Journal of the Transportation Research Board, Vol. 1973, pp. 10–17. Knodler, M.A. Jr., D.A. Noyce, K.C. Kacir, and C.L. Brehmer. 2007. “An Evaluation of Driver Comprehension of Solid Yellow Indications Resulting from Implementation of Flashing Yellow Arrow”. Presented at the 86th Annual Meeting of the Transportation Research Board, Washington, D.C. Korve, H., J. Farran, and D. Mansel. 1996. TCRP Report 17: Integration of Light Rail Transit into City Streets, Transportation Research Board, National Research Council. Kothuri, S., A. Kading, A. Schrope, K. White, E. Smaglik, C. Aquilar, and W. Gil. 2018. Addressing Bicycle-Vehicle Conflicts with Signal Control Strategies. Final Report. National Institute for Transportation and Communities. Kwigizile, V., J-S Oh, R.V. Houten, D. Prieto, R. Boateng, L. Rodriguez, A. Ceifetz, J. Yassin, J. Bagdade, and P. Andridge. 2015. Evaluation of Michigan’s Engineering Improvements for Older Drivers.” Final Report, Michigan Department of Transportation.
Lambrianidou, P., S. Basbas, and I. Politis. 2013. “Can pedestrians’ crossing countdown signal timers promote green and safe mobility?” Sustainable Cities Society, Vol. 6, pp. 33–39.
Langford, B.C., J. Chen, and C.R. Cherry. 2015. “Risky Riding: Naturalistic Methods Comparing Safety Behavior from Conventional Bicycle Riders and Electric Bike Riders.” Accident Analysis & Prevention, Vol. 82, pp. 220–226. Langham, M., G. Hole, J. Edwards, and C. O’Neil. 2002. “An analysis of “looked but failed to see” accidents involving parked police vehicles.” Ergonomics, Vol. 45, No. 3, pp. 167–185. DOI:10.1080/00140130110115363 Lincoln, O. and J.P. Tremblay. 2014. Pedestrian Hybrid Beacon Crosswalk System (PHB) or High-Intensity Activated Crosswalk (HAWK) Evaluation. Initial Report, Vermont Agency of Transportation, Montpelier, VT. Mahach, K., A.J. Nedzesky, L. Atwater, L. and R. Saunders. 2002. A Comparison of Pedestrian Signal Heads. Proceedings of the ITE Annual Meeting and Exhibit, ITE, Washington, D.C.
76
Markowitz, F., S. Sciortion, J.L. Fleck, and B.M. Yee. 2006. “Pedestrian countdown signals: Experience with an extensive pilot installation.” ITE Journal, Vol.76, pp. 43–48.
Massachusetts DOT. 2015. Separated Bike Lane Planning and Design Guide.
Mirabella, J.A., and Y. Zhang. 2014. “Understanding Pedestrian and Bicyclist Compliance and Safety Impacts of Walk Modes at Signalized Intersections for a Livable Community.” Transportation Research Record: Journal of the Transportation Research Board, Vol. 2464, pp. 77–85. McNichols J. 2014. “Seattle's New Bike Lane Wows Cyclists, Confuses Cars” http://archive.kuow.org/post/seattles-new-bike-lane-wows-cyclists-confuses-cars Mixon, C. 2018. “Not so bright: Slope’s six-signal traffic light creates chaos at intersection, locals claim” https://www.brooklynpaper.com/stories/41/24/dtg-confusing-park-slope-traffic-signal-2018-06-15-bk.html Monsere, C., M. Figliozzi, S. Thompson, and K. Paulsen. 2013. Operational Guidance for Bicycle-Specific Traffic Signals in the United States. Final Report, SPR 747/OTREC 2012FG, Oregon Department of Transportation and Oregon Research and Education Consortium. Monsere, C., J. Dill, N. McNeil, K. Clifton, N. Foster, T. Goddard, M.Berkow, J.Gilpin, K. Voros, D.van Hengel, J.Parks. Lessons From The Green Lanes: Evaluating Protected Bike Lanes In The U.S. Final Report, National Institute for Transportation and Communities (NITC), NITC-RR583, June 2014. NACTO. 2011. Urban Bikeway Design Guide, 1st Edition. New York, N.Y. NACTO. 2014. Urban Bikeway Design Guide, 2nd Edition. New York, N.Y. NACTO. 2016. Transit Street Design Guide. NACTO. n.d. Case Study: Fell-Masonic Bicycle Signal, San Francisco, CA https://nacto.org/case-study/fell-masonic-bicycle-signal-san-francisco-ca/ (As of January 2, 2019).
Nambisan, S.S., and G.J. Karkee. 2010. “Do Pedestrian Countdown Signals Influence Vehicle Speeds?” Transportation Research Record: Journal of the Transportation Research Board, Vol. 2149, pp. 70–76.
Nassi, R.B. and M. J. Barton. 2008. “New Traffic Control for an Old Pedestrian Crossing Safety Problem,” APWA Reporter, 75 (6), pp. 44–49. New York City Department of Transportation. 2018. Cycling at Crossroads. The Design Future of New York City Intersections. http://www.nyc.gov/html/dot/downloads/pdf/cycling-at-a-crossroads-2018.pdf
Norman, D.A., 1981. “Categorization of action slips.” Psychological Review, 88(1), pp. 1-15. DOI:10.1037/0033-295X.88.1.1 Noyce, D.A. and K.C. Kacir. 2001. “Drivers’ Understanding of Protected-Permitted Left-Turn Signal Displays.” Transportation Research Record: Journal of the Transportation Research Board, Vol. 1754, pp. 1–10.
Noyce, D.A. and K.C. Kacir. 2002. “Driver Understanding of Simultaneous Traffic Signal Indications in Protected Left Turns.” Transportation Research Record: Journal of the Transportation Research Board, Vol. 1801, pp. 18–26. Noyce, D.A., and C.R. Smith. 2003. “Driving Simulators Evaluation of Novel Traffic-Control Devices: Protected-Permissive Left-Turn Signal Display Analysis”. Transportation Research Record: Journal of the Transportation Research Board, Vol. 1844, pp. 25–34. Marnell, P., H. Tuss, D. Hurwitz, K. Paulsen, and C. Monsere. 2013. “Permissive Left-Turn Behavior at the Flashing Yellow Arrow in the Presence of Pedestrians.” In Conference Proceedings of the 7th International Driving Symposium on Human Factors in Driver Assessment, Training, and Vehicle Design, Bolton Landing, N.Y., pp. 488–494. Pai, C-W. and R-C. Jou. 2014. “Cyclists’ Red-Light Running Behaviors: An Examination of Risk-Taking Opportunistic, and Law-Obeying Behaviors.” Accident Analysis & Prevention, Vol. 682, pp. 191-198. Pelz, D., T. Bustos, and J. Flecker, J. 1996. The Use of Bicycle Signal Heads at Signalized Intersections. Davis, Calif.
Pulugurtha, S.S. and D.R. Self. 2015. “Pedestrian and Motorists’ Actions at Pedestrian Hybrid Beacon Sites: Findings from a Pilot Study.” International Journal of Injury Control and Safety Promotion, Vol. 22, No. 2, pp. 143–152. Rahimi, A.R.A, A. Kojima, and H. Kubota. 2013. “Experimental Research on Bicycle Safety Measures at Signalized Intersections.” Journal of the Eastern Asia Society for Transportation Studies, Vol. 10, pp. 1426-1445. Rassmussen, J. 1979. On the structure of knowledge: A morphology of mental models in a man-machine system context. Report No. RISWM-2192, Roskilde, Denmark Risa National Lab. Rassmussen, J. 1986. Information Processing and Human-Machine Interaction: An Approach to Cognitive Engineering. North-Halland Series in System Science and Engineering, Amsterdam. Reason, J. 1990. Human Error, Cambridge University Press. Richard, C.M., and M.G. Lichty. 2013. Driver Expectations When Navigating Complex Interchanges. Final Report, FHWA-HRT-13-048, Federal Highway Administration. Richardson, M. and B. Caulfield. 2015. “Investigating Traffic Light Violations by Cyclists in Dublin City Center.” Accident Analysis & Prevention, Vol. 84, pp. 65-73. Ryan, A., E. Casola, M. Knodler, and C. Fitzpatrick. 2018. “Flashing Yellow Arrow for Right Turns: A Driving Simulator Study.” European Transport Conference, Dublin, Ireland. Sanders, M.S., and E.J. McCormick. 1993. Human Factors in Engineering and Design. New York McGraw-Hill. DOI:10.1108/ir.1998.25.2.153.2 Sayed, T., P. de Leur, and J. Pump. 2005. “Safety Impact of Increased Traffic Signal Backboards Conspicuity.” Presented at 85th Annual Meeting of the Transportation Research Board, Washington, D.C. Schlattler, K.L., A. Rietgraf, B. Burdett, and W. Lorton. 2013. Driver Comprehension and Operations Evaluation of Flashing Yellow Arrows. Final Report, Illinois Center for Transportation.
Schieber, F., B. Schlorholtz, and R.McCall. 2009. Chapter 2: Visual Requirements of Vehicular Guidance. In Human Factors of Visual and Cognitive Performance in Driving. CRC Press Taylor & Francis Group. Schmitz, J. N. 2011. The effects of Pedestrian Countdown Timers on Safety and Efficiency of Operations at Signalized Intersections. University of Nebraska, Lincoln.
Scott, A. C., K. N. Atkins, B.L. Bentzen, and J. M. Barlow. 2012. “Perception of Pedestrian Traffic Signals by Pedestrians with Varying Levels of Vision.” Transportation Research Record: Journal of the Transportation Research Board, Vol. 2299, pp. 57–64.
Shinar, D., R.E. Dewar, H. Summala, L. Zakowska. 2003. “Traffic Sign Symbol Comprehension: A Cross-Cultural Study.” Ergonomics, Vol. 46, No. 15 , pp. 1549–1565. DOI:10.1080/0014013032000121615 Smith, O., P. Koonce, and D. Soto Padín. 2018. “Bicyclist Positioning Behavior at Signalized Intersections in Portland, Oregon.” Presented at 97th Annual Meeting of the Transportation Research Board, Washington, D.C. Thompson, S., C.M. Monsere, M. Figliozzi, P. Koonce, and G. Obery. 2013. “Bicycle-Specific Traffic Signals: Results from a State-of-the-Practice Review.” Transportation Research Record: Journal of the Transportation Research Board, Vol. 2387, pp. 1–9. Transportation Association of Canada (TAC). 2004. Traffic Signal Guidelines for Bicycles. Transportation Association of Canada (TAC). 2008. Manual on Uniform Traffic Control Devices for Canada. 2008 update. Turner, S., K. Fitzpatrick, K., M. Brewer, M., and E.S. Park. 2006. “Motorist Yielding to Pedestrians at Unsignalized Intersections Findings from a National Study on Improving Pedestrian Safety.” Transportation Research Record: Journal of the Transportation Research Board, Vol. 1982, pp. 1–12. Van Houten, V., G. DeLaere, J. Morgan, and J. Shurbutt. 2015. “Countdown Pedestrian Signals: Legibility and Comprehension without Flashing Hand.” Transportation Research Record: Journal of the Transportation Research Board, Vol. 2519, pp. 10–16. DOI: 10.3141/2519-02 Vasudevan, V., S. Pulugurtha, S., S. Nambisan, and M. Dangeti. 2011. “Effectiveness of Signal-Based Countermeasures for Pedestrian Safety: Findings from Pilot Study.” Transportation Research Record: Journal of the Transportation Research Board, Vol. 2264, pp. 44–53.
Wahi, R.R., N. Haworth, A. Debnath, and M. King. 2018. “Influence of Type of Traffic Control on Injury Severity in Bicycle–Motor Vehicle Crashes at Intersections.” Transportation Research Record: Journal of the Transportation Research Board, Vol. 2672, pp. 199–209. DOI: 10.1177/0361198118773576. Werneke, J., and M. Vollrath. 2012. “What does the Driver look at? The Influence of Intersection Characteristics on Attention Allocation and Driving Behavior. Accident Analysis and Prevention, Vol. 45, pp. 610–619. DOI:10.1016/j.aap.2011.09.048 Wickens, C.D., 1992. Engineering Psychology and Human Performance. 2nd Edition. doi:10.1146/annurev.ps.27.020176.001513 Wickens, C.D., J. Helleberg, J. Goh, X. Xu and W.J. Horrey. 2001. Pilot Task Management:
79
Testing an Attentional Expected Value Model of Visual Scanning. Technical Report ARL-01-14/NASA-01-7. University of Illinois, Aviation Research Lab, Savoy. Wickens, C.D., and J.S. McCarley. 2008. Applied Attention Theory. Taylor & Francis, Boca Raton. Wickens, C.D., Hollands, J. Banbury, S. Parasuramans, 2013. Engineering Psychology and Human Performance, Fourth Ediition, Routledge, Taylor and Francis Group. Wierwille, W.W., R.J. Hanowski, J.M. Hankey, C.A. Kieliszewski, S.E. Lee, A. Medina, A.S. Keisler, and T.A. Dingus. 2002. Identification of Driver Errors: Overview and Recommendations. Final Report, Virginia Polytechnic Institute and State University.
80
Acronyms
APBP – Association of Pedestrian and Bicycle Professionals AASHTO – American Association of State Highway and Transportation Officials FHWA – Federal Highway Administration FPI – Flashing Pedestrian Indicator FYA – Flashing Yellow Arrow LBI –Leading Bicycle Interval LRT – Light Rail Transit MUTCD – Manual of Uniform Traffic Control Devices NACTO – North American City Transportation Officials RTE – Request to Experiment TCD – Traffic Control Devices TCRP – Transit Cooperative Research Program TRID – Transport Research International Documentation UVC – Uniform Vehicle Code
A-1
Appendix A – List of Intersections
A-2
ID City State Primary Street Cross Street Latitude Longitude Bicycle Traffic
Motivation for Signal
Phasing Operation Year
10 Phoenix AZ 12th Campbell 33.5019736 -112.0562945 One-way LBI LBI
15 Tucson AZ Country Club Rd 3 St 32.2318649 -110.9267316 One-way
Bike Only Thru Crossing with Restricted MV movements
Exclusive
20 Davis CA Pole Line Loyola 38.5574909 -121.7276866 Mixed Connection to Multi-Use Path Exclusive
25 Davis CA Russell Blvd Sycamore 38.5462809 -121.7618145 Mixed Connection to Multi-Use Path Exclusive
55 Long Beach CA E. Broadway Elm Ave 33.769275 -118.187685 One-way BL to Left of LTL Exclusive 2011
60 Long Beach CA E. Broadway Linden Ave 33.769272 -118.18637 One-way BL to Left of LTL Exclusive 2011
65 Long Beach CA E. Broadway Atlantic Ave 33.769279 -118.185045 One-way BL to Left of LTL Exclusive 2011
70 Long Beach CA E. Broadway Lime Ave 33.769277 -118.183685 One-way BL to Left of LTL Exclusive 2011
75 Long Beach CA E. Third Street Atlantic Ave 33.770492 -118.185047 One-way BL to Left of LTL Exclusive 2011
80 Long Beach CA E. Third Street Linden Ave 33.770497 -118.186375 One-way BL to Left of LTL Exclusive 2011
85 Long Beach CA E. Third Street Elm Ave 33.770497 -118.1877 One-way BL to Left of LTL Exclusive 2011
90 Long Beach CA E. Third Street Promenade 33.7705 -118.190588 One-way BL to Left of LTL Exclusive 2011
30 Long Beach CA W. Broadway W. Trade Center Drive 33.769266 -118.199365 One-way BL to Left of LTL Exclusive 2011
35 Long Beach CA W. Broadway Magnolia 33.769273 -118.198059 One-way BL to Left of LTL Exclusive 2011
40 Long Beach CA W. Broadway Chestnut 33.769273 -118.196381 One-way BL to Left of LTL Exclusive 2011
45 Long Beach CA W. Broadway Cedar Ave 33.769277 -118.195069 One-way BL to Left of LTL Exclusive 2011
50 Long Beach CA W. Broadway Pine Ave 33.769268 -118.192381 One-way BL to Left of LTL Exclusive 2011
95 Long Beach CA W. Third Street Pine Ave 33.770502 -118.192404 One-way BL to Left of LTL Exclusive 2011
100 Long Beach CA W. Third Street Cedar Ave 33.770509 -118.195055 One-way BL to Left of LTL Exclusive 2011
105 Long Beach CA W. Third Street Chestnut Ave 33.770518 -118.196356 One-way BL to Left of LTL Exclusive 2011
110 Long Beach CA W. Third Street Magnolia Ave. 33.770507 -118.198059 One-way BL to Left of LTL Exclusive 2011
115 Long Beach CA W. Third Street Maine Ave. 33.770523 -118.20061 One-way BL to Left of LTL Exclusive 2011
2985 Los Angeles CA Figueroa St. USC Mccarthy Way 34.020414 -118.280959 One-way BL to Right of RTL 2018
2990 Los Angeles CA Figueroa St. Jefferson Blvd. 34.021882 -118.279969 One-way BL to Right of RTL 2018
2995 Los Angeles CA Figueroa St. 32nd St 34.023532 -118.278989 One-way BL to Right of RTL 2018
3000 Los Angeles CA Figueroa St. 30th St 34.021882 -118.279969 One-way BL to Right of RTL 2018
A-3
ID City State Primary Street Cross Street Latitude Longitude Bicycle Traffic
Motivation for Signal
Phasing Operation Year
3005 Los Angeles CA Figueroa St. 28th St 34.026089 -118.277351 One-way BL to Right of RTL 2018
3010 Los Angeles CA Figueroa St. Adams Blvd. 34.028153 -118.276033 One-way BL to Right of RTL 2018
3015 Los Angeles CA Figueroa St. 23rd St 34.030787 -118.274399 One-way BL to Right of RTL 2018
3020 Los Angeles CA Figueroa St. Olympic Blvd. 34.04499 -118.263957 One-way BL to Right of RTL 2018
3025 Los Angeles CA Figueroa St. 9th St 34.046234 -118.262841 One-way BL to Right of RTL 2018
3030 Los Angeles CA Figueroa St. Wilshire Blvd. 34.05006 -118.25927 One-way BL to Right of RTL 2018
125 Los Angeles CA Los Angeles St Arcadia Street 34.0552946 -118.2392088 One-way BL to Right of RTL Exclusive 2014-
2017
130 Los Angeles CA Los Angeles St Temple Street 34.0534487 -118.2409436 One-way BL to Right of RTL Exclusive 2012
3035 Los Angeles CA Spring St 3rd St 34.050266 -118.246977 One-way BL to Left of LTL 2018
3040 Los Angeles CA Spring St 4th St 34.048825 -118.24832 One-way BL to Left of LTL 2018
3045 Los Angeles CA Spring St 6th St 34.045967 -118.25099 One-way BL to Left of LTL 2018
3050 Los Angeles CA Spring St 7th St 34.044545 -118.252315 One-way BL to Left of LTL 2018
3055 Los Angeles CA Spring St 9th St 34.041601 -118.255026 One-way BL to Left of LTL 2018
2500 Mountainview CA Hetch Hetchy Trail Whisman Rd 37.400448 -122.058398 One-way Connection to
Multi-Use Path Exclusive 2017
2495 Mountainview CA Shorebird Way Shorebird Blvd 37.418524 -122.077938 One-way BL to Right of RTL Exclusive 2015
140 Palo Alto CA Alma Street Lytton 37.4442604 -122.165301 One-way
Connection to BL and Train Stations from Bike Box
2016
145 Redondo Beach CA Harbor Drive Portofino Way 33.8460659 -118.3935114 Two-way Two-Way BL on
Two-Way Street
150 Redondo Beach CA Harbor Drive Marina Way 33.8492556 -118.3955843 Two-way Two-Way BL on
Two-Way Street
155 Redondo Beach CA Harbor Drive Yachat Club Way 33.8520012 -118.3970871 Two-way Two-Way BL on
Two-Way Street
160 Sacramento CA Carlson Dr H Street 38.567805 -121.429153 One-way
Bicycle Left-Turn from Jug-Handle/Right BL/Two-Stage
2014
165 San Diego CA I-15 NB Cam Del Rio S 32.777499 -117.110045 Two-way Multi-Use Path Crossing
A-4
ID City State Primary Street Cross Street Latitude Longitude Bicycle Traffic
Motivation for Signal
Phasing Operation Year
170 San Francisco CA 7th Ave Lincoln Way 37.7660769 -122.464338 One-way
Bike Only Thru Crossing with Restricted MV movements
2016
2525 San Francisco CA 8th St Brannan St 37.771298 -122.405456 One-way BL to Right of RTL 2018
2530 San Francisco CA 8th St Folsom St 37.775033 -122.410082 One-way BL to Right of RTL 2018
175 San Francisco CA BUCHANAN ST MARINA BLVD 37.8050335 -122.4337423 Two-way Multi-Use Path
Crossing 2013
180 San Francisco CA CARGO WAY ILLINOIS ST 37.74577 -122.38665 Mixed Diagonal Crossing 2012
185 San Francisco CA CARGO WAY MENDELL ST 37.7438563 -122.3831679 Two-way Two-Way BL on Two-Way Street 2012
190 San Francisco CA Embarcadero North Point 37.8073978 -122.407514 One-way
Bicycle Left-Turn from Jug-Handle/Right BL/Two-Stage
2017
195 San Francisco CA FELL ST PANHANDLE PATH/SHRADER ST 37.772163 -122.452447 Mixed Diagonal
Crossing 2008
200 San Francisco CA Fell Street Masonic Avenue 37.7729897 -122.4459851 Two-way Multi-Use Path Crossing
205 San Francisco CA FOLSOM ST ESSEX ST 37.7864332 -122.3956371 One-way BL to Right of RTL 2016
210 San Francisco CA MARKET ST 10TH ST/POLK ST 37.776526 -122.417536 One-way Contra Flow BL 2014
215 San Francisco CA Market St Valencia 37.7725376 -122.4227233 One-way
Bicycle Left-Turn from Jug-Handle/Right BL/Two-Stage
2012
220 San Francisco CA OAK ST BRODERICK ST 37.7729425 -122.4391001 One-way LBI 2013
225 San Francisco CA PAGE ST STANYAN ST 37.7701063 -122.4537496 Mixed Connection to Multi-Use Path 2013
230 San Francisco CA PANHANDLE PATH MASONIC AVE 37.772867 -122.445894 Two-way Multi-Use Path
Crossing 2008
235 San Francisco CA Polk St GROVE ST 37.7784944 -122.4182568 One-way Contra Flow BL 2014
240 San Francisco CA Polk St HAYES ST 37.7775135 -122.4180647 One-way Contra Flow BL 2014
245 San Francisco CA Polk St Ellis 37.7840397 -122.4193807 One-way BL to Right of RTL 2019
250 San Francisco CA Polk St Eddy 37.783107 -122.419196 One-way BL to Right of RTL 2019
251 San Francisco CA Polk St Turk St 37.782171 -122.41901 One-way BL to Right of RTL 2019
A-5
ID City State Primary Street Cross Street Latitude Longitude Bicycle Traffic
Motivation for Signal
Phasing Operation Year
252 San Francisco CA Polk St Golden Gate Ave 37.781259 -122.418829 One-way BL to Right of RTL 2019
255 San Francisco CA Scott St Fell 37.7742917 -122.4359679 One-way LBI 2016
260 San Francisco CA Scott St MARINA BLVD 37.8058201 -122.4422327 Two-way Multi-Use Path Crossing 2013
2535 San Francisco CA Scott St Oak St 37.77338 -122.435783 One-way Connection from Bike Box to Center BL
Concurrent 2016-2017
265 San Jose CA Sunset Ave Story Rd 37.3434721 -121.8379845 One-way
Unique Bicycle Crossing at Offset T Intersection
2017
2515 Boulder CO 13th St Walnut St 40.01715 -105.278339 One-way Contra Flow BL 2012-2014
275 Denver CO 18th St Arapahoe St 39.7497306 -104.9932615 One-way BL to Right of RTL Exclusive 2015
280 Denver CO Alameda Ave S. Knox Ct 39.711127 -105.032462 2017
285 Denver CO Bannock St 14th Ave 39.738449 -104.9902579 One-way Contra Flow BL 2011
290 Denver CO Broadway Arapahoe St 39.7542889 -104.9873709 One-way Contra Flow BL 2015
295 Denver CO Broadway 16th Ave 39.7428813 -104.9887145 One-way Connection to Ped Mall 2016
300 Denver CO Colfax Ave Steele St 39.740171 -104.950077 One-way Connection to Shared Lane from Sidewalk
2016
305 Denver CO Larimer St 14th St 39.7473345 -104.9998245 One-way Contra Flow BL 2017
310 Denver CO Lawrence 15th St 39.7476177 -104.9977517 One-way Unclear, SBL Corridor 2013
315 Denver CO S. Broadway Bayuad Ave 39.7147817 -104.9875194 Two-way
Bicycle Left-Turn from Jug-Handle/Right BL/Two-Stage
2016
320 Denver CO S. Broadway Cedar Ave 39.7130036 -104.9875446 Two-way Two-Way BL on One-Way Street 2016
325 Denver CO S. Broadway Alameda Ave 39.7111482 -104.9875582 Two-way Two-Way BL on One-Way Street 2016
330 Denver CO S. Broadway Virginia Ave 39.7075359 -104.9875948 One-way BL to Left of LTL 2016
335 Denver CO Speer Blvd (SB) Lawrence St 39.7379396 -104.9980131 One-way Connection to BL
from Sidewalk 2016
340 Denver CO Wynkoop 16th St 39.7518818 -105.00092 One-way Unclear, LBI? 2013
345 Fort Collins CO Pitkin Av Lemay Av 40.5702877 -105.0579055 One-way Bike Only Thru Crossing with 2012
A-6
ID City State Primary Street Cross Street Latitude Longitude Bicycle Traffic
Motivation for Signal
Phasing Operation Year
Restricted MV movements
355 Fort Collins CO S Shields St Springfield Dr 40.5704581 -105.0959901 One-way
Bike Only Thru Crossing with Restricted MV movements
2017
350 Fort Collins CO W Laurel St S Mason St 40.5781105 -105.0788614 One-way Unique Shared Lane with BRT Bicycle Left Turn
2012
360 Washington DC DC 15th V St 38.9181171 -77.0345326 Two-way BL to Left of LTL 2009
365 Washington DC DC 15th W St 38.9191619 -77.034716 Two-way
Unique Bicycle Crossing at Multileg Intersection
2009
370 Washington DC DC 15th New Hamsphire 38.9189875 -77.0346601 Two-way
Unique Bicycle Crossing at Multileg Intersection
2009
375 Washington DC DC 16th U and New Hampshire 38.9169982 -77.036513 One-way Unique Crossing to Bike Box 2011
2510 Washington DC DC First St Massachusetts Ave 38.897397 -77.007646 Two-way Two-Way BL on One-Way Street 2014-
2017
380 Washington DC DC M St 22nd 38.9052599 -77.0488049 One-way BL to Right of RTL 2016
2475 Washington DC DC Rhode Island Ave NW/M St Connecticut Ave NW 38.905678 -77.041117 One-way
Unique LBI across Multi-Leg Intersection
2015
385 Washington DC DC White House Driveway E Street, NW 38.895497 -77.033665 Two-way Connection to
Median BL
390 Newark DE Delaware Avenue Orchard Road 39.6816321 -75.755219 Two-way LBI with FYB
interval LBI Planned
395 Newark DE Delaware Avenue South College Avenue 39.681661 -75.7536277 Two-way LBI with FYB
interval LBI Planned
400 Newark DE Delaware Avenue Academy Street 39.6819899 -75.7494915 Two-way LBI with FYB
interval LBI Planned
405 Newark DE Delaware Avenue South Chapel Street 39.6822029 -75.7451842 Two-way LBI with FYB
interval LBI Planned
410 Newark DE Delaware Avenue Tyre Avenue 39.6810035 -75.7417034 One-way LBI with FYB
interval LBI Planned
415 Newark DE Delaware Avenue
University of Delaware Green 39.6752704 -75.7519121 Two-way LBI with FYB
interval LBI Planned
A-7
ID City State Primary Street Cross Street Latitude Longitude Bicycle Traffic
Motivation for Signal
Phasing Operation Year
420 Newark DE Delaware Avenue Pomeroy Trail 39.6820997 -75.7437949 Mixed Connection to
Two-Way BL Concurrent Planned
430 Tampa FL Cass St Marion Street 27.9519786 -82.4579034 Two-way Two-Way BL on Two-Way Street Exclusive 2017
435 Atlanta GA Harris St NE Centennial Olympic Park Dr NW 33.7609897 -84.3920441 Two-way Connection to
Park 2016
440 Atlanta GA Harris St NE William St NE 33.7609875 -84.3905512 Two-way Two-Way BL on One-Way Street Exclusive 2016
445 Atlanta GA Harris St NE Ted Turner Dr NE 33.7609873 -84.3890474 Two-way Two-Way BL on One-Way Street 2016
450 Atlanta GA Harris St NE Peachtree St NE 33.7609833 -84.3875519 Two-way Two-Way BL on One-Way Street 2017
455 Atlanta GA Harris St Ne Peachtree Center Av NE 33.7609602 -84.3860416 Two-way
Unique Intersection of Two-Way BL
2015
460 Atlanta GA Harris St NE Courtland St NE 33.7609361 -84.3841752 Two-way Two-Way BL on One-Way Street 2017
465 Atlanta GA Harris St NE Piedmont Av NE 33.7609198 -84.3821708 Two-way Connection to Two-Way BL 2016
470 Atlanta GA Luckie St NW Pine St NW 33.7678356 -84.3960781 Two-way Two-Way BL on Two-Way Street 2017
475 Atlanta GA Luckie St NW Ivan Allen Jr Blvd NW 33.7645284 -84.3961553 Two-way Two-Way BL on Two-Way Street 2012
480 Atlanta GA Northside Dr NW Hampton St NW 33.7776622 -84.4073595 Two-way Multi-Use Path
Crossing 2017
485 Atlanta GA Peachtree Center Av NE Auburn Av NE 33.7555725 -84.3861111 Two-way Two-Way BL on
One-Way Street 2014
490 Atlanta GA Peachtree Center Av NE
John Wesley Dobbs Av NE 33.7571333 -84.3861028 Two-way Two-Way BL on
One-Way Street 2015
495 Atlanta GA Peachtree Center Av NE Ellis St NE 33.7584063 -84.386088 Two-way Two-Way BL on
One-Way Street 2015
500 Atlanta GA Peachtree Center Av NE
Andrew Young Intl Blvd NE 33.7596693 -84.3860659 Two-way Two-Way BL on
One-Way Street 2016
505 Atlanta GA Peachtree Center Av NE Baker St NE 33.7622276 -84.386016 Two-way Two-Way BL on
One-Way Street 2015
510 Atlanta GA Tech Pkwy NW Means St NW 33.7775385 -84.4076513 Two-way Two-Way BL on Two-Way Street 2017
515 Atlanta GA Tech Pkwy NW North Av NW 33.7713451 -84.3961264 Two-way Two-Way BL on Two-Way Street 2017
A-8
ID City State Primary Street Cross Street Latitude Longitude Bicycle Traffic
Motivation for Signal
Phasing Operation Year
2580 Des Moines IA E Grand E 4th St 41.590313 -93.613023 2018
2575 Des Moines IA Ingersoll Ave MLK Jr Pkwy 41.585737 -93.644644 One-way BL to Right of RTL 2018
520 Aurora IL S River St Downer Pl 41.7581806 -88.3181513 Two-way Unique Left turn for Two-Way Facility
2016
525 Aurora IL S River St Benton St 41.7572172 -88.3193198 Two-way Two-Way BL on Two-Way Street 2017
530 Aurora IL S River St North Av 41.753459 -88.3242041 Two-way Unique Left turn for Two-Way Facility
2016
535 Chicago IL Berteau Damen 41.957813 -87.67886 One-way Contra Flow BL 2007
540 Chicago IL Dearborn Ave. Polk Street 41.8722835 -87.6291416 Two-way BL to Left of LTL Exclusive 2013
545 Chicago IL Dearborn Ave. Harrison Street 41.8745324 -87.6292009 Two-way BL to Left of LTL Exclusive 2013
550 Chicago IL Dearborn Ave. West Congress Parkway 41.8757029 -87.6292076 Two-way BL to Left of LTL Exclusive 2013
555 Chicago IL Dearborn Ave. W. Van Buren Street 41.8769068 -87.6292681 Two-way BL to Left of LTL Exclusive 2013
560 Chicago IL Dearborn Ave. W. Jackson Blvd. 41.878156 -87.6293093 Two-way BL to Left of LTL Exclusive 2013
565 Chicago IL Dearborn Ave. W. Adams Street 41.8794284 -87.6293454 Two-way BL to Left of LTL Exclusive 2013
570 Chicago IL Dearborn Ave. W. Monroe Street 41.8806957 -87.6293596 Two-way BL to Left of LTL Exclusive 2013
575 Chicago IL Dearborn Ave. W. Madison Street 41.881995 -87.6294227 Two-way BL to Left of LTL Exclusive 2013
580 Chicago IL Dearborn Ave. W. Washington Street 41.883225 -87.6294346 Two-way BL to Left of LTL Exclusive 2015
585 Chicago IL Dearborn Ave. W. Randolph Street 41.8844831 -87.6294545 Two-way BL to Left of LTL Exclusive 2017
590 Chicago IL Dearborn Ave. W. Lake Street 41.8857454 -87.6295074 Two-way BL to Left of LTL Exclusive 2013
595 Chicago IL Dearborn Ave. W. Wacker Drive 41.8869492 -87.6295156 Two-way BL to Left of LTL Exclusive 2011
600 Chicago IL Dearborn Ave. W. Kinzie Street 41.8892267 -87.6295802 Two-way BL to Left of LTL Exclusive 2013
605 Chicago IL Elston Armitage 41.9179308 -87.6675774 One-way Unclear, LBI? 2016
610 Chicago IL Kenmore Sheridan 41.998168 -87.6568803 One-way Connection to Shared Lane from Sidewalk
2015
615 Chicago IL Milwaukee Elston 41.8976466 -87.657447 One-way BL to Right of RTL 2015
620 Chicago IL N Clinton St Washington Blvd 41.8831888 -87.6412165 Two-way Two-Way BL on One-Way Street 2015
625 Chicago IL N Clinton St W Madison St 41.8818529 -87.6411826 Two-way Two-Way BL on One-Way Street 2015
A-9
ID City State Primary Street Cross Street Latitude Longitude Bicycle Traffic
Motivation for Signal
Phasing Operation Year
630 Chicago IL N Clinton St Monroe St 41.8805484 -87.6411711 Two-way Two-Way BL on One-Way Street 2015
635 Chicago IL N Clinton St Adams St 41.8792826 -87.641101 Two-way Two-Way BL on One-Way Street 2015
640 Chicago IL N Clinton St Jackson Blvd 41.8780339 -87.641055 Two-way BL to Left of LTL 2015
645 Chicago IL N Clinton St W Van Buren St 41.8767405 -87.6410139 Two-way BL to Left of LTL 2015
650 Chicago IL N Clinton St W Lake St 41.8857044 -87.6413047 Two-way BL to Left of LTL 2015
655 Chicago IL N Clinton St W Randolf St 41.884426 -87.6412605 Two-way Two-Way BL on One-Way Street 2015
660 Chicago IL Randolf St State St 41.8844882 -87.627896 One-way BL to Right of RTL 2017
665 Chicago IL Randolf St Dearborn St 41.8844831 -87.6294545 One-way BL to Right of RTL 2016
670 Chicago IL Randolf St N LaSaelle St 41.8844783 -87.632491 One-way BL to Right of RTL 2017
675 Chicago IL W Division St N Orleans St 41.9037967 -87.6374692 One-way BL to Right of RTL 2016
680 Chicago IL W Washington St N. Wells St 41.8832277 -87.6338765 One-way BL to Right of
RTL 2015
685 Chicago IL W Washington St N. Clark St 41.883214 -87.630911 One-way BL to Right of
RTL
690 Chicago IL W Washington St Michigan Ave 41.883227 -87.624529 One-way
Bicycle Left-Turn from Jug-Handle/Right BL/Two-Stage
695 Evanston IL Chicago Av Clark St 42.0494477 -87.6780929 Two-way Two-Way BL on Two-Way Street Concurrent
700 Evanston IL Chicago Av Church St 42.0477278 -87.6789163 Two-way Two-Way BL on Two-Way Street Exclusive
705 Evanston IL Chicago Av Sheridan Rd or Lincoln Street 42.0510741 -87.677307 Two-way Two-Way BL on
Two-Way Street Concurrent 2017
710 Evanston IL Chicago Av Davis St 42.0462024 -87.6796557 Two-way Connection to Two-Way BL 2017
715 Evanston IL Sheridan Rd Northwestern Univ Place 42.0556438 -87.6771733 Two-way Two-Way BL on
Two-Way Street 2017
720 Indianapolis IN Morris Shelby St 39.7516301 -86.139779 Two-way Two-Way BL on Two-Way Street 2014
725 Indianapolis IN Virginia Av Prospect St 39.7522661 -86.1400343 Two-way Two-Way BL on Two-Way Street Concurrent 2015
2415 Seattle WA Yesler 8th Ave 47.601704 -122.322454 One-way BL to the Right of Shared Thru/Right
2018
2965 Madison WI Atwood Ave Dunning St 43.093198 -89.349528 Two-way Diagonal Crossing Exclusive 2016
2960 Madison WI Cottage Grove Dempsey Rd 43.083895 -89.316262 Two-way Diagonal Crossing Exclusive 2017
2485 Madison WI E Mifflin St S Blair St 43.079392 -89.379862 One-way Bicycle signal w/PHB
2490 Madison WI Monroe St Regent St 43.067813 -89.412853 Two-way Multi-Use Path Crossing 2007-
2011
2975 Madison WI Spring St N Charter St 43.069603 -89.40569 Two-way Diagonal Crossing 2014-
2017
2970 Madison WI University Ave Spring Harbor Dr 43.0801 -89.472509 Two-way Two-Way BL on Two-Way Street 2015
2980 Madison WI University Ave N Bassett St 43.073222 -89.394021 One-way Unique Connection/Turns to BL/Paths
2017
B-1
Appendix B – Data Collection Protocol
B-2
NCHRP 20-07 TASK 420 TASK 2 BIKE SIGNAL DATA COLLECTION Version March 23, 2019
This document describes the data collection procedure for gathering information pertaining to bicycle signals. For the intersections where the Google Streetview images are available, the following data elements described below and highlighted in blue need to collected. It consists of two sheets - 1) Intersection and 2) Approach and Signal Face. The observer has to fill out the columns highlighted in blue in this document. The observer should also download ImageJ from here. This is a Java-based program that does not require installation and can run on a drive that you have local access to save files. Overview:
1. Select an intersection to collect data, change its status to “In Progress”. For intersections in “corridor” sample a subset of these intersections.
2. Navigate to the Google Maps satellite view and Google Streetview links to explore and find the bicycle signal faces. Identify how many approaches are controlled by bicycle signals and how many bicycle signal faces are present.
3. Complete the data collection for data elements highlighted blue in this document for each approach and bicycle signal face
4. Upload plan view image to Google drive, format: Intersection ID_City_State_Plan
5. Upload profile view image to Google drive, format: Intersection ID_ApproachLegDirection_City_STATE_IntName
6. Change intersection status to “Complete” or “Questions” if you need some data element reviewed by a senior team member. Be sure to note what your question is in the NOTES field on the APPROACH tab.
INTERSECTION TAB
1. Data Collection Status: When you are ready to start an intersection, select “In Progress” so that others know you are working on this intersection.
2. Intersection ID: This is a unique ID for each intersection. Each intersection in the list has been numbered sequentially. This has already been pre-filled.
3. Corridor or Not: This describes whether the intersection is part of a corridor or not. This information has already been pre-filled.
4. Intersection City: This field describes the city where the intersection is located. This field has also been pre-filled.
5. Intersection State: This field lists the state where the intersection is located. This field has also been pre-filled.
6. Intersection Primary Street: Name of the Primary street on which the bicycle signal is located. This field has also been pre-filled.
7. Intersection Cross Street: Name of the Cross street at the intersection where the bicycle signal is located. This field has also been pre-filled.
8. Latitude: Latitude of the intersection where the bike signal is located. This field has also been pre-filled.
9. Longitude: Longitude of the intersection where the bike signal is located. This field has also been pre-filled.
10. Link to Point Map: The link shows the satellite view of the intersection where the bike signal is located. The satellite image is useful for measuring the distances (i.e. Visibility distance to far side bike signal in the Approach and Signal Face sheet). This field has also been pre-filled.
11. Google StreetView Link: This link leads to the Google Streetview view of the intersection where the bike signal is located. This field has been pre-filled if it is available. If the Google Streetview showing the bike signal is not available and this field is left blank, then skip the intersection and move on to the next one in the list.
12. Phasing Operation: This field indicates the phasing for the bicycle movements. This cannot be collected from Google Streetview, skip this column. Some of the cells have been pre-filled. Do not fill this field or change information that is already present.
13. Type of Bicycle Crossing: Select all of the bicycle crossings present at the intersection from the drop-down list – One-way, two-way, multi-use path, multi-use path to one-way crossing, two-way to one-way. For some rows, it has been pre-filled. For others, the senior researchers will complete.
14. Date/Year of Installation: This field has been pre-filled if it is available. To determine the installation year, note the year when the bike signal is first seen in Streetview. In some cases, it may be possible to note down the exact year (especially if the Google Streetview images are available at regular intervals). In other cases, it may only be possible to narrow it down to a time period (e.g. 2014-2017). In such a case, note the last year when the bike signal is not seen in Streetview and the first year when the bike signal is seen.
APPROACH & SIGNAL FACE TAB The following data elements should be collected only if a Google Streetview view link is available. Each column contains information about the approach leg and data about any bicycle signal faces. There may be multiple approaches with bicycle signals. It is best to explore in Streetview to determine how many approaches have bicycle signal faces before you start entering data.
1. Observer: Enter the initials of the observer reviewing the intersection.
2. Intersection ID: Enter the unique ID for the intersection from the Intersection tab. If you know there are multiple approaches, “reserve” the necessary columns by typing in the ID for each approach before you complete the remaining data collection.
3. Approach Leg Direction: Enter the direction of the approach leg which has the bike signal from the dropdown list. The image below shows the possible options at an intersection, which are N, S, E, W, NE, NW, SE, and SW. This can be determined from Google maps.
B-4
4. Number of Bicycle Signal Heads per Approach: Use Google Streetview to observe the number of bicycle signal heads for each approach. An approach is defined as an intersection leg. Typically, an approach will have one or two bicycle signal heads. In the first image below, there are two bike signals for the same approach, both on the far side. In the second image, there are two bike signals for the same approach, one near side and one far side. If there is only one bike signal for an approach, it is typically placed on the far side of the intersection.
Bike Signal Bike Signal
Bike Signal Bike Signal
B-5
5. Number of Vehicular Signal Heads per Approach: For each approach that has bike signals, note the number of vehicular signals on that same approach. For example, in the image below, there are 3 vehicular signal heads on the approach that has 2 bike signal heads.
6. Number of Vehicular Signal Faces by Signal Head: Note the number of signal faces for each signal head moving from left to right. Signals typically have, 3, 4 or 5 faces. In the image above, each of the vehicular signal heads has three faces, so one would enter 3,3,3.
7. Visibility Distance to Far Side Bicycle Signal Face: Using the satellite view (click on the
column “Link to Point Map” in the Intersection tab). Zoom in and use the measuring tool in Google to measure the distance from the stop bar (often also the crosswalk line) to the far side bicycle signal face. The measuring tool is accessed by right clicking in the map and selecting “Measure Distance”. An example is shown the image below. If there are more than 1 far side signal heads, measure to the nearest. Round to the nearest foot in reporting measurement. The objective is to describe how far away the signal head is for the bicyclist.
Vehicular Signal Heads
B-6
8. Lane Type for Bicycle Traffic: Note the bicycle lane type for the approach. ● Bicycle lane means that the lane is only for bicycles (bicycle markings in the lane). ● Shared path means that the person on a bicycle sees the signal face from a path. ● Share lane means that both bicycles and vehicles can use the lane (should not exist).
9. Direction of Bicycle Traffic: Select if the bicycle traffic on the approach is one-way or two-way.
If it is two-way, there will be a yellow centerline and indications that bicycles can travel in both directions as shown in the picture:
Stop bar location for bicycles
Location of the bicycle signal face
Visibility distance
N
B-7
10. Direction of Motor Vehicle Traffic: Select if the motor vehicle traffic on the approach is one-way or two-way. If no MV traffic on approach, code NA.
11. Lane Utilization for Vehicle Traffic in the Same Direction: Note the number and type of
vehicular lanes on the approach excluding the bike lane. Bike lane is 0. Lanes to the left of the bike lane should be denoted by (-) followed by a number (1,2,3; lane next to the bike lane is 1 and so on), followed by the direction (L=left, T=thru, R=right). Lanes to the right of the bike lane should be denoted as +, followed by a number (1,2,3; lane next to the bike lane is 1 and so on), followed by the direction (L=left, T=thru, R=right). In the first image below, there are two lanes left of the bike lane that are denoted as -1TR, and -2L. In the second image, there is one lane on either side of the bike lane. The lane to the right of the bike lane is denoted as 1R, and the lane left to the bike lane is denoted as -1LT.
B-8
-1TR
-2L
Bike Lane
1R
-1TL
Bike Lane
B-9
SIGNAL FACE DATA Next for each signal face on each approach, record the following data elements. The signal face data should be recorded directly below the approach data, in the same column. If an approach has two signal faces, first enter the information for signal face 1, followed by signal face 2.
1. Intersection ID: Cell formula links to previous entry, no entry needed
2. Approach Leg Direction: Cell formula links to previous entry, no entry needed
3. Signal Face ID: Enter a Unique ID for each signal face per approach. Number sequentially using 1 – far side primary bicycle signal face and 2 – near side bicycle signal face. If there is a second far side head, this will be signal face 3. The first image below shows two bicycle signals with 1- far side, and 2-near side. The second image shows two far side bicycle signals, with 1 -right far side bike signal and 2-left far side bike signal.
1
2
1 2
Note there is a near side head at this location not shown in photo
B-10
4. Are Arrows used in Bicycle Signal Face? Most bicycle signal heads will have 3 faces with the
R-Y-G bicycle symbol in them. Enter YES if it has 4 faces (one must be an arrow) or if you can see a green arrow illuminated in the bottom face. If you can see image with GREEN bicycle symbol and the signal is 3 faces, enter NO. Otherwise select “UNK”.
5. Placement Far Side or Near Side: For each bicycle signal face, note if it is placed on the near side (NS) or far side (FS). The image below shows near side and far side bike signals.
NS
FS
B-11
6. Placement - Left, Center or Right of Bicycle Lane: Note if the bike signal face is placed left or
right of the bicycle lane. In the first image below, both far side bike signals are placed left of the bike lane. In the second image, the far side bike signal is to the right of the bicycle lane.
Bike Lane
Left
Left
Right
Bike Lane
B-12
7. Placement -Over Roadway or Sidewalk Path: Note if the bike signal is placed over roadway (OR) or over the sidewalk/path (OS/P). In the image first below, the bike signal is placed over the sidewalk path. In the second, it is over the roadway.
Over Sidewalk
Over roadway
B-13
8. Does the bicycle signal have a back plate? Note “Y” if the bicycle signal has a back plate and “N” if no.
9. Is signal housing or backplate a different color than vehicle heads? Note Y if the bicycle signal housing or back plate is a different color than the vehicle heads and “N” if they are the same color. For example, in the image below, since the bicycle signal housing is yellow and the vehicle signals are black, “Y” should be selected. In the second image below, since the bike signal housing is the same color as the vehicular signals, select “N”.
Backplate
Yes, since the bicycle signal is yellow and the vehicular signals are black.
B-14
10. Presence of R10-10b sign: For each bike signal using Google Streetview, note if a bike signal sign is present (see images below). Mark “Y” if the sign is present, and “N” if not. In the first image below, a bike signal sign is visible, so mark “Y”. In the second image, the sign is absent, so select “N”. If an alternate sign or wording is presented that
No, since bicycle signal heads are the same color as vehicle heads.
Yes, the sign is present (but it is small you might make a note of this in the “notes” field
B-15
11. Presence of louvers or visibility restricting device on bicycle signal face: Louvers are used on bicycle signals to prevent motorists from seeing the bicycle specific signal indications from other lanes. For each bike signal, using Google Streetview, mark “Y” if you can see louvers or visibility restricting device is present on the bicycle signal face. Mark “N” if you can tell from the image that louvers are not present. Zooming into the bicycle signal can help in determining the presence of louvers. Select “UNK” otherwise. This element may be difficult to collect. If you are not sure, select “UNK”
No sign is present
N, since you can see the symbol clearly
B-16
12. Lens diameter: Estimate the diameter of the lens for each bicycle signal. For US installations, the diameter of the near side signal lens can be 4”, 8” or 12”. The far side signal face is typically 8” or 12”. If you have a good photo, you may be able to measure this (see final section). If you are unsure, leave blank and others will complete.
13. For the PRIMARY Far-Side Signal Heads Only - Measuring mounting height and offset distances For the following metrics, using Google Streetview view link, navigate to each approach with bike signal. It is important that the photo is as orthogonal as possible for the dimensions we are attempting measure. Once you have identified the “best” view of the signal faces to be measured, use screen capture or the “Snipping Tool” in Windows to save the image. Save the image with Intersection ID_ApproachLegDirection_City_State_IntName as the file name. For example, if you are saving N leg of intersection ID 100, the file name will be 100_N_Portland_OR_BroadwayVictoria.jpg. If no measurements can be obtained due to poor image or positioning options, enter an “X” in the measurement fields and complete a brief note in the “NOTES” field.
14. Bicycle signal face mounting height (bottom of signal to ground): Measure the height from the bottom of the bicycle signal face to the ground (A in the image below). Measure to/from the edge of backplate or housing. Round dimension to nearest foot.
15. Horizontal separation between nearest vehicular signal face & bicycle signal face: Measure
the distance between the nearest vehicular signal face and bicycle signal face (B in the image below). Measure to/from the edge of backplate or housing. Round dimension to nearest foot. If signal heads are adjacent, enter <1 ft.
16. Vertical separation between nearest vehicular signal face & bicycle signal face: Measure
the distance between the nearest vehicular signal face and bicycle signal face (C in the image below).Measure to/from the edge of backplate or housing. Round dimension to nearest foot. If signal heads are adjacent, enter <1 ft.
B-17
To obtain these measurements, open the saved image(s) of the intersection in ImageJ. Use Google Satellite view to measure a distance for each photo/saved image. Identify a reference distance is in the same plane as the dimension to measure that you can measure in the satellite image to set the scale. Lane markings are the easiest. Try to keep the length of the reference line to between 10 and 20 feet to avoid distortion errors. In the example photo above, the width of the bicycle lane plus the adjacent motor vehicle lane is a good option. Below is an example for the intersection of NE Broadway St and NE Victoria Ave in Portland, OR with this dimension measured in Google maps. Use the snipping tool to copy this image. Save the file as INTID_City_STATE_PLAN (e.g. 1960_Portland_OR_Plan).
A
B
C
B-18
Open Image J. You will see a toolbar open as shown in the image below. Open the file that you just saved.
Using the line tool, draw a line on the distance you measured in satellite view as the reference distance. Then, navigate to Analyze-Set Scale. Enter the distance you measured in the “Known Distance” box. Global sets the scale for all images until you close ImageJ or reset the scale. Now the scale has been set (will convert pixels to feet). The example is shown below.
This dimension was measured as the reference dimension. 16.96 feet
B-19
Now, use the drawing tool to draw a rectangle so that the top of the rectangle will be used to measure the vertical offset between signal faces. Then, navigate to Analyze->Tools->Scale Bar. Select OK. The estimated distance will now be displayed on the top of the rectangle.
Now, select the line tool and draw a line to measure one of the two remaining dimensions. In Image J, select Analyze->Measure or use the shortcut “CTRL-M”. The measured distance will appear in another Image J window. Repeat the process for the other measurement.
B-20
C-1
Appendix C – Research Needs Statements
C-2
1. Problem Title Optimal Methods to Communicate Allowable Protected, or Permissive Movements to Bicyclists at Signalized Intersections
2. Background Bicycle signals provide the opportunity to fully or partially separate bicyclists from conflicting motor vehicle movements. The Interim Approval for bicycle signals (IA-16) in the U.S. was issued by FHWA in 2013 (FHWA, 2013). A recent NCHRP report, “Road User Understanding of Bicycle Signal Faces,” identified over 500 intersections with bicycle signals in use in the U.S. (Monsere et al. 2019). IA-16 limits the use of a bicycle signal face to operations where the bicycle movement is “protected from any simultaneous motor vehicle movement at signalized intersections (FHWA, 2014)”. This requirement suggests that the GREEN BICYCLE display indicates to a person on a bicycle that their movement is protected.
Compliance with this provision requires the installation of fully-protected phases and turn lanes for left and right-turns for motor vehicle movements that cross the bicycle lane or signal timing strategies, which limit the available green time for bicyclists to proceed while all adjacent vehicle traffic is stopped. IA-16 also prohibits the use of signs alone to restrict bicycle movements. If it is necessary, turn arrows on the bicycle signal face can be used to communicate allowable movements and to restrict conflicting bicycle movements. This guidance has limited the application of bicycle signals due to lack of road space for turning lanes or concerns about efficiencies and delays for all users. A number of agencies are experimenting with allowing permissive motor vehicle turns across the bicycle facility when bicyclists have displayed the GREEN BICYCLE symbol. Other agencies are using a FLASHING YELLOW BICYCLE to indicate a permissive bicycle movement. In some jurisdictions, the GREEN BICYCLE symbol varies from protected to permissive depending on installation date. Comprehension requires that a road user understand what movements are allowed or required from their position on the roadway. While IA-16 established the GREEN BICYCLE symbol to be a protected movement, some cyclists may interpret the signal similar to the green ball (i.e., yield to other conflicting traffic). The mechanism to communicate whether movements are fully protected or permissive needs further research, as evidenced by ongoing experiments with FLASHING YELLOW BICYCLE indications. Finally, while the use of arrow displays is likely intuitive, there has not been any human factors research to verify this understanding or explore alternatives.
3. Literature Search Summary No research studies were found that examined how to communicate with a person on a bicycle or other road users which movements are allowable from the bicycle lane. With respect to permissive indications, all of the active Request to Experiment on IA-16 involve exceptions to the requirement of protection from any simultaneous motor vehicle movements. Evanston, IL, and Boston, MA, are experimenting with a GREEN BICYCLE allowing permissive right turns across the bicycle facility at multiple intersections in these locations. Minneapolis, MN, Newark, DE are experimenting with a FLASHING YELLOW BICYCLE to indicate a permissive bicycle movement. St. Paul, MN is experimenting with both the FLASHING YELLOW ARROW (FYA) for vehicles and FLASHING YELLOW BICYCLE.
Road user understanding of permissive displays for vehicles has focused on left and right turning movements. There are many studies that have explored drivers’ comprehension of FYA signal display indications for left-turns (Asante and Williams, 1993; Bonneson and McCoy, 1993; Noyce and Kacir, 2001, 2002; Drakopoulos and Lyles, 2001; Brehmer et al. 2003; Noyce and Smith, 2003; Knodler et al. 2005, 2006a, 2006b, 2007; Hurwitz et al., 2013; Marnell et al., 2013; Hurwitz et al., 2014). The results also showed that the FYA signal display indication for left-turns was well understood by drivers and led to FYA being adopted for permissive left-turn indications. Though included in the 2009 MUTCD, there is less research on driver comprehension of the use of FYA for right-turns though results from the surveys and driving simulators found the FYA for right-turns was well understood by the drivers (Hurwitz et al., 2018, Jashami et al., 2019, Ryan et al. 2019).
Research on the use of FLASHING YELLOW displays for bicycle control is minimal. Recently, the New York City DOT conducted a safety evaluation of bicycle-specific intersection treatments to provide guidance on the appropriate treatment (NYCDOT, 2018). Mixing zones, fully split phases (with bicycle
C-3
signals), delayed turn with FYA for vehicles (split LBI), and offset crossing (protected intersections) were evaluated in the study using crash, conflict, and comfort analysis. Of these treatments, fully split phases, delayed turn, and offset crossing used bicycle-specific traffic signals. The study did not document any driver confusion with bicycle traffic signals. Kothuri et al. also studied the safety impacts of Split LBI (FYA for vehicles with GREEN BICYCLE symbol) and mixing zone treatments using an observational study with conflict analysis (Kothuri et al. 2018). Some user confusion (related to the merging behavior and where each entity needed to position themselves) was observed regarding the position of the bicyclists and drivers within the mixing zone.
While permissive traffic signal indications for vehicular movements have been well researched, there is a critical need for research to understand how bicyclists comprehend what the allowable movements are at an intersection, and how to best display protected or protected/permissive indications to the bicyclist.
4. Research Objective The objective of the proposed research is to determine how best to communicate with a person on a bicycle and other road users through traffic control devices:
• the allowable movements from the bicycle facility; • whether the movement is protected from all simultaneous motor vehicle movements or if the
bicyclist should expect conflicts; and • whether the motor vehicle driver should expect to yield to other traffic (i.e., defining the right of
way).
The following sequence of tasks are needed to complete this research:
Task 1 – Review of Literature and State of Practice that includes vehicle codes about legal movements from the bicycle lane and informs the range of traffic signal displays options (arrows, flashing yellow bicycle symbol), pavement markings, signs that have been used in practice. A review of international practices is recommended.
Task 2 – Prepare a detailed work plan to determine optimal ways to communicate to the bicyclist allowable, permissive, or protected movements. Depending on the results of Task 1 and input from the panel, the research could consider traffic control designs that are not currently used in U.S. practice. Current guidance and practice assume signal indications designed for motor vehicle drivers can be applied to cycle users generally, unlike pedestrians or light rail transit vehicles that have unique messages. At a minimum, the research should explore comprehension of both drivers and cyclists and give some consideration to people using electric mobility devices (e.g. e-scooters, hoverboards) who might be in the bicycle lane (noting that who is allowed in the bicycle lane varies by jurisdiction). It is anticipated that the following tasks would be required: a) Survey of comprehension – conduct a human factors survey to develop an understanding of actual
movements of bicyclists while facing the GREEN BICYCLE symbol from typical intersection configurations, including if they perceive the GREEN BICYCLE symbol to mean that they can only proceed straight through.
b) Video data collection and analysis – develop a robust sample of bicyclists interacting with different bicycle traffic signal configurations identified in Task 1. The data collection should be designed to explain the current behaviors of road user.
c) Human factors experiment – design of a human factors experiment (controlled lab or field research study) to build a detailed representation of behavioral response to understand comprehension of existing GREEN BICYCLE symbol, comprehension of alternative devices (e.g., BICYCLE symbols for protected movements and 4-section heads with green ball for permissive phases). Consideration should be given to the driver’s understanding and requirements for movements across bikeways.
Task 3 – Execute the work plan developed in Task 2 and approved by the NCHRP panel.
Task 4 – Prepare final deliverables documenting the results of the various ways to communicate the range of allowable movements to the bicyclists.
C-4
Task 5 – Develop guidance documentation for practitioners for inclusion in the MUTCD and other design guidance.
5. Urgency and Potential Benefits The guidance from this research will help practitioners improve safety and operations at intersections where bicyclists are present. This research will aid traffic engineers in the design and development of new signal timing strategies that promote safer interactions between bicyclists and vehicles and improve comprehension by clearly communicating to bicyclists about their movements. Clearly defining who has the right of way is a fundamental principle of safe intersection design; this research would contribute to this definition.
6. Implementation Considerations and Supporters Traffic control devices to communicate allowable movements and signal display indications to indicate protected/permissive movements should be implemented in the field after rigorous human factors research and a thorough understanding of how bicyclists and drivers perceive these devices and display indications. These recommendations could be proposed for review and possible adoption by the Federal Highway Administration and the National Committee on Uniform Traffic Control Devices. City-level transportation officials, represented by NACTO, would also have an interest in the results of this research.
7. Recommended Research Funding and Research Period Recommended Funding: $350,000 Research Period: 24 months
8. Problem Statement Author(s) Chris Monsere, Portland State University, 503-725-9746, [email protected] David Hurwitz, Oregon State University, 541-737-9242, [email protected] Sirisha Kothuri, Portland State University, 503-725-4208, [email protected] Christina Fink, Toole Design Group, 301-927-1900, [email protected]
9. Others Supporting the Problem Statement To be completed.
10. Potential Panel Members To be completed.
11. Person Submitting the Problem Statement To be completed.
C-5
1. Problem Title Evaluation of Size, Placement, and Orientation of Bicycle Signal Faces on Bicyclist and Driver Comprehension and Compliance
2. Background As cycling rates continue to rise in North America, implementing bicycle-oriented traffic control devices has become increasingly necessary. Cities are installing bicycle signals at existing intersections with motor vehicle traffic, which increases intersection complexity. Increasing intersection complexity may affect fundamental MUTCD principles of traffic control devices; these devices must: fulfill a need; command attention; convey a clear, simple meaning; command respect from road users, and give adequate time for a proper response. If the devices do not meet these aims, operations, and safety for people riding bicycles as well as other travelers may be negatively affected.
FHWA’s Interim Approval of bicycle signals faces (IA-16) provides guidance on the design and placement of bicycle signals at intersections and relative to other vehicular traffic signal indications. NACTO’s Urban Bikeway Design Guide and the MassDOT Separated Bike Lane Planning and Design Guide provide additional guidance. Cities, however, have implemented a wide variety of bicycle signal designs, and there is limited information on how the design and placement of signal faces positively or negatively affect bicycle operations and safety. For example, there is no consensus on the horizontal and vertical distance from vehicular traffic signals or the use of nearside signal heads. In a recent inventory of approximately 500 bicycle signal installations in the U.S. cited in the NCHRP report “Road User Understanding of Bicycle Signal Faces” a majority (51%) use two or more bicycle signal heads per approach. However, there is no standard for the placement of the supplemental face. In the inventory, locations that had two or more bicycle signal heads per approach typically used a farside/nearside arrangement.
There are concerns that motorists may be confused by the green bicycle signal indication and proceed despite the vehicular signal heads displaying a red indication. Therefore, some jurisdictions have installed louvers to restrict motorist visibility for bicycle signal indications. From the standpoint of uniformity, existing practices for communicating to bicyclists operating is anything but uniform as they are often directed to follow traffic signals, pedestrian signals, and bicycle signals at subsequent signalized intersections within a single corridor.
Overall, there is limited information on which bicycle signal design best meets MUTCD traffic control device principles and which strategies support uniformity principles for all users under different bikeway design configurations. With an increase in the use of bike lanes by people using electric mobility devices (e.g., e-scooters, hoverboards), there are also questions of comprehension and applicability of signal faces with bicycle symbols to these users. Will they understand these signals are applicable to them?
Finally, practitioners question whether bicycle signal design affects user comprehension and, ultimately traffic signal compliance. Noncompliant behavior, like running red signals, is generally unacceptable behavior for motorists, but does the bicycle signal design affect bicycle user signal compliance? There is an acute need to understand how bicycle signal indications should be designed, positioned, and installed to inform this option for providing safe and comfortable bicycle facilities at intersections.
3. Literature Search Summary There is limited research previously performed on how a bicyclist’s behavior is affected by the size, placement, and orientation of bicycle traffic signals. Bicycle signals have been designed and installed based on principles of vehicle traffic signal installations. Now with more bicyclists and bicycle traffic signals, there is greater variability in how these traffic control devices are designed and implemented. Ultimately, this impacts how they command respect from roadway users.
Although some research has been performed to test supplementary functions of traffic control devices, such as the blue light feedback detector device, little to no research has been performed on how bicycle traffic signals themselves are perceived (Boudart et al. 2015). Additionally, while much research has explored compliance in general (Johnson et al., 2011, Johnson et al. 2013, Monsere et al., 2013, Monsere et al. 2014, Richardson et al. 2015), little research has been performed on the factors for bicyclist compliance at bicycle-specific signals as it relates to size, placement, and orientation of signal faces. If research is
C-6
performed on the design and placement of bicycle traffic signals, then solutions can be devised to improve traffic control device compliance for bicycle users.
4. Research Objective The objective of this research is to determine how the design (e.g., lens size, placement, number, orientation) of bicycle signal heads influences both motorists’ and bicyclists’ comprehension of bicycle signals. The research should explore discernable differences in visual comprehensions, such as the relationship between the proximity of bicycle and vehicular traffic signal indications and comprehension, the interaction between the bicyclist and the signal/intersection based on the near/far side installations, and the appropriateness of supplemental bicycle signage. At a minimum, the research should explore comprehension of both drivers and cyclists and give some consideration to people using electric mobility devices (e.g. e-scooters, hoverboards) who might be in the bicycle lane (noting that who is allowed in the bicycle lane varies by jurisdiction). The following sequence of tasks are needed to complete this research:
Task 1 – Review of Literature and State of Practice on the design and placement of bicycle signals at intersections with consideration for international design. European countries tend to use smaller indications and height differences to distinguish bicycle signal controls. One outcome of this task will be to identify the existing standards, gaps in practice, and the potential configurations to explore in the research.
Task 2 – Prepare a detailed work plan to determine optimal design and placement of bicycle signals and how compliance with a bicycle signal relates to comprehension. At a minimum, the research should evaluate the number of bicycle signal heads per approach, nearside or farside installations, size of indication (12”, 8”, 4”), horizontal and vertical distance of bicycle signals to vehicle signals (includes louvers, backplates, and distance from bicycle stop line to bicycle signal. It is anticipated that the following experimental tasks may be required: a) Observed behaviors and responses in the field using a robust sample of design options identified in Task 1.
The observational data should seek to establish behaviors and responses of road users using naturalistic data collection techniques such as eye-tracking.
b) Driving and bicycling simulator experiments of a set of scenarios to be developed in a virtual built environment in which both bicyclists and motorists should interact with a variety of bicycle signal configurations. The simulator experiment should be based on information gathered from the field data. At least 30 drivers and 30 bicyclists should participate in the experiments and performance measures such as visual attention, compliance with right-of-way conventions, and time-to-conflict measures can be collected and analyzed.
c) Closed-course test tracks that seek to validate the design characteristics that perform best through a usability study to confirm the recommended design solutions meet the desired motorist and bicyclist responses.
Task 3 – Execute the work plan developed in Task 2 and approved by the NCHRP panel.
Task 4 – Prepare a final report documenting the results of the work plan. The final report will distill the key findings of the research and identify best practices for bicycle signal design and installation.
Task 5 – Develop guidance documentation for practitioners based on the final report findings. 5. Urgency and Potential Benefits
This research should produce a best practice study that practitioners can use to design intersections with bicycle signals that users on bicycles or in vehicles can easily understand. A vast amount of information is conveyed to users approaching intersections in addition to traffic signal heads, including signs (e.g., regulatory, warning, informational) and pavement markings. This research should provide guidance on how to convey only the necessary information for bicyclists to clearly assist all users through the intersection safely.
Bicycle signals mirror vehicular signals in many ways, which may cause confusion. For example, vehicular traffic signal indications are placed within a driver’s cone of vision as they approach an intersection. Does the bicyclist cone of vision differ from a driver’s cone of vision? Is there a benefit to the overall operations of allowing the motor vehicle driver to see the bicycle signal face? The research will
C-7
help practitioners design bicycle traffic signals that clearly communicate to people riding bicycles as well as people driving, and allow users to navigate safely through intersections. The results of this research may also increase compliance with red bicycle signals. as there are many factors that influence someone’s decision to run a red light (Wu, 2011 and Fietsberaad, 2003). The design and placement of bicycle signals is one critical factor that needs to be studied.
6. Implementation Considerations and Supporters Within a state DOT, the results of this research would likely affect the workflow of the state
traffic engineer, the program manager responsible for signalized intersections, and the coordinator for active transportation modes. To implement the findings, policy and design guides concerned with traffic control devices and signalized intersection design would need to be revised and distributed to engineers across the state responsible for implementing the new standards. These recommendations could be proposed for review and possible adoption by the Federal Highway Administration and the National Committee on Uniform Traffic Control Devices. City-level transportation officials, represented by NACTO, would also have interest in the results of this research.
7. Recommended Research Funding and Research Period Recommended Funding: $350,000. Research Period: 24 months.
8. Problem Statement Author(s) David Hurwitz, Oregon State University, 541-737-9242, [email protected] Chris Monsere, Portland State University, 503-725-9746, [email protected] Douglas Cobb, Oregon State University, 540-533-6560, [email protected] Sirisha Kothuri, Portland State University, 503-725-4208, [email protected] Christina Fink, Toole Design Group, 301-927-1900, [email protected]
9. Others Supporting the Problem Statement To be completed.
10. Potential Panel Members To be completed.
11. Person Submitting the Problem Statement To be completed.
C-8
1. Problem Title Guidance on Visibility and Detection of Bicycle Symbols in Signal Faces by Lens Size and Distance
2. Background According to the Manual on Uniform Traffic Control Devices (MUTCD), in addition to fulfilling a need, traffic control devices should command attention, convey a clear, simple meaning, command respect from road users, and give adequate time for proper response. For these four criteria to be met, any and all traffic control devices should be optimized for comprehension, legibility, and conspicuity. If a traffic control device does not adequately provide these three elements, road users will not effectively interact with surface transportation infrastructure, which can negatively impact roadway safety. This is especially important as the number of vulnerable users increases on roadways. To accommodate this trend in roadway cycling, bicycle signals with the bicycle symbol in the face have begun to appear in cities across the United States.
Since bicycle signals were introduced in Davis, California in 1994, they have served to provide both specific indications and to communicate priority to cyclists within the functional area of signalized intersections. While visual awareness of these bicycle signals plays a crucial role in a cyclist’s decision making and riding practices, it also influences driver comprehension and behavior. Of particular concern is a driver’s or bicyclist’s ability to detect, identify, and discern bicycle symbols in signal faces at an intersection. Conspicuity and the distance at which the bicycle symbol in the signal face is distinguishable is key to the safety of bicyclists and other road users. For example, one source of potential driver confusion is that the color of the bicycle signal’s indications is the same as vehicular signals. Additionally, at some distances and LED intensities, the bicycle symbol may not be distinguishable from a circular display, causing additional confusion. A similar issue was identified in the first light-rail transit (LRT) signals, which led to the adoption of a monochromatic and unique signal symbol (Korve, 1996).
IA-16 currently requires far side bicycle signals to use 8- or 12-inch lenses, while near side lenses can be 4-, 8-, or 12-in. The guidance for signal face sizing (lens size) by distance appears to be derived primarily from the guidance for motor vehicle signals. There are many more details regarding the design of the bicycle symbol that could contribute to visibility challenges for some drivers, especially in low-light or nighttime conditions. While optimal placement, shielding, and supplemental signs can address some of these issues, research should be conducted to establish guidance on detection distances by lens size and intensity.
In addition to the detection distance of the bicycle symbol in the signal face, the design of the bicycle symbol within the lens face itself plays a significant role in both motorist and bicyclist comprehension. Research on bicycle signal face design and detection distance should be conducted to fill this knowledge gap.
3. Literature Search Summary No published research studies were found that have directly addressed the visibility of the bicycle symbol in the signal lens. Visibility includes placement for optimal detection by road users, conspicuity of the lens, and detection distances. There are two separate issues related to the comprehension of the bicycle symbol in the signal face: 1) recognizing that the symbol face denotes the signal as exclusive for bicycles, and 2) knowing which movements are allowed by the displayed indications. No published research studies were found that have directly addressed comprehension of the bicycle symbol in the signal face, either for the bicyclist or drivers.
While no published research studies were found on the visibility and comprehension of the bicycle signal face, many practice reports include brief assessments thereof. A published evaluation was conducted in 1996 in response to the installation of the bicycle signal face in Davis, California by Pelz et al. (1996). The study, which included a before-after survey and review of crash data, noted that a large percentage (66%) of participants found that the inclusion of the bicycle signal face with the standard signal head was not confusing. Additionally, crash data did not reveal the presence of safety issues.
While there are slight variations in the symbol presented internationally, little research or guidance has been provided on the optimal design of the signal face. There is no published human factors research on the currently approved bicycle symbol. In a review of signs and signals for cyclists and
C-9
pedestrians in thirteen countries (Austria, Belgium, Denmark, France, Germany, Italy, Norway, Poland, Russian Federation, Spain, Switzerland, United Kingdom and the U.S.) for the United Nations, Hiron et al. (2014) found that nearly all symbols feature a similar version of the bicycle (although sometimes a person is shown riding the bicycle). The study notes that most of the countries reviewed also have three-section faces with bicycle symbols in the lens. Similarly, while many researchers have evaluated the conspicuity of standard traffic signals, no studies have been conducted regarding lens detection and conspicuity of bicycle signal faces.
Currently, there is no comprehensive research on the size of the signal lens (4-, 8-, or 12-inch), the design of the bicycle symbol within the lens, and longitudinal placement of the signal head to optimize the detection distance from the stop line for cyclists. Since the symbol plays a significant role in distinguishing between separate user controls at an intersection, refining the design of existing symbols could improve the conspicuity of the signal.
4. Research Objective The proposed research will develop guidelines for the overall design of the bicycle symbol in the signal lens including lens size and brightness to improve conspicuity, improved bicycle symbol design in the signal face for optimal detection, and determination of bicycle signal face detection distance for safer driving/cycling practices and bicycle lens size for various applications of far side and near side placement. The following sequence of tasks are needed to complete this research:
Task 1 – Review of literature on signal placement and visibility distance, including research methods and analysis techniques. Task 2 – Review of design practice for bicycle signal lens size selection and other factors as they relate to visibility distances. The review should identify current practices of both national and international agencies to determine a target range of options for the research to explore for lens size, bicycle symbol design, and detection distances.
Task 3 – Human factors experiment to establish visibility distances, likely using a sign simulator or a closed test-track environment. The experiments should include measurements for the parameters identified in Tasks 1 and 2. Both persons driving and cycling should be included in the subject tests. At a minimum, visibility and detection should be studied during daylight and low light conditions and for modifications to the current bicycle symbol.
Task 4 – Prepare a final report documenting the key findings of the research and identify best practices for bicycle signal design and installation.
Task 5 – Develop guidance language for inclusion in the MUTCD and other design guides. 5. Urgency and Potential Benefits
The conspicuity of traffic signals has been cited as a factor in intersection collisions, so improving their visibility can contribute to improved safety. Additional research on the design and placement of bicycle signals has the potential to expand existing knowledge and state of practice to determine the ideal bicycle symbol design for detection and visibility distance for bicyclists. These efforts would allow researchers and practitioners to optimize safety and minimize the conflicts experienced for people on bikes while they approach and proceed through the intersection. Research findings could also help to expand MUTCD guidance on bicycle signal lens placement within the intersection.
6. Implementation Considerations and Supporters When evaluating new traffic control devices or technologies, it is important to remember that new requirements or guidance can only be introduced once they have been evaluated through research and adopted by the MUTCD through FHWA. For example, it is typically easy to develop new designs and symbols that are intended to appear simple and, therefore, effective. However, what seems to be effective in design may not necessarily result in effective driver comprehension and behavioral reaction. Therefore, research of traffic control devices, and even more so with signals that will be interacted with by various road users, requires precise and detailed research. The results of this research can not only be used to establish a foundation for bicycle signal usage guidelines and recommendations but also be used to improve bicyclist safety along highly used corridors. These recommendations could be proposed for
C-10
review and possible adoption by the Federal Highway Administration and the National Committee on Uniform Traffic Control Devices. City-level transportation officials, represented by NACTO, would also have an interest in the results of this research.
7. Recommended Research Funding and Research Period Research Funding: $200,000 Research Period: 18 months
8. Problem Statement Author(s) Christina Fink, Toole Design Group, 301-927-1900, [email protected] Chris Monsere, Portland State University, 503-725-9746, [email protected] David Hurwitz, Oregon State University, 541-737-9242, [email protected] Sirisha Kothuri, Portland State University, 503-725-4208, [email protected]
9. Others Supporting the Problem Statement To be completed.
10. Potential Panel Members To be completed.
11. Person Submitting the Problem Statement To be completed.
C-11
References Cited in Research Needs Statements Optimal Methods to Communicate Allowable Protected, or Permissive Movements to Bicyclists at Signalized Intersections
Asante, S.A., S.A. Ardekani, and J.C. Williams. 1993. Selection Criteria for Left-Turn Phasing, Indication Sequence, and Auxiliary Sign. Report 1256-1F, Civil Engineering Department, University of Texas at Arlington, Arlington, TX.
Bonneson, J.A., and P.T. McCoy. 1993. Evaluation of Protected/Permitted Left-Turn Traffic Signal Displays. Report TRP-02-27-92. Civil Engineering Department, University of Nebraska- Lincoln, Lincoln, NE.
Brehmer, C. L., K. C. Kacir, D. A. Noyce, and M. P. Manser. 2003. NCHRP Report 493: Evaluation of Traffic Signal Displays for Protected/Permissive Left-Turn Control. Transportation Research Board of the National Academies, Washington, D.C.
Drakopoulos, A., and R.W. Lyles. 2001. “Use of Multivariate Multiple Response Analysis of Variance Models to Evaluate Driver Comprehension Errors of Flashing Traffic Signal Operations.” Journal of Safety Research, 32 (1), 85-106.
FHWA. 2013. Interim Approval for Optional Use of a Bicycle Signal Face (IA-16). https://mutcd.fhwa.dot.gov/resources/interim_approval/ia16/
FHWA. 2014. Official Interpretation #9(09)-47 (I) on Clarification of IA-16. https://mutcd.fhwa.dot.gov/resources/interpretations/9_09_47.htm
Hurwitz, D., C. Monsere, H. Tuss, K. Paulsen, and P. Marnell. 2013a. Improved Pedestrian Safety at Signalized Intersections Operating the Flashing Yellow Arrow. Oregon Transportation Research and Education Consortium (OTREC), OTREC-RR-13-02, Portland, OR.
Hurwitz, D., H. Jashami, K. Buker, C. Monsere, S. Kothuri, and A. Kading. 2018. Towards Safer Protected/Permitted Right-Turn Phasing for Drivers, Bicyclists and Pedestrians. Final Report, SPR 789, Oregon Department of Transportation.
Hurwitz, D. S., C. M. Monsere, P. Marnell, and K. Paulsen. 2014. Three- or Four-Section Displays for Permissive Left-Turns? Transportation Research Record: Journal of the Transportation Research Board, Vol. 2463, pp. 1–9. https://doi.org/10.3141/2463-01.
Jashami, H., D.S. Hurwitz, C. Monsere, and S. Kothuri. 2019. “Evaluation of Driver Comprehension and Visual Attention of the Flashing Yellow Arrow Display for Permissive Right Turns.” Transportation Research Record: Journal of the Transportation Research Board, Vol. 2673, pp. 397–407.
Knodler, M.A. Jr., D.A. Noyce, K.C. Kacir, and C.L. Brehmer. 2005. ”Evaluation of Flashing Yellow Arrow in Traffic Signal Displays with Simultaneous Permissive Indications.” Transportation Research Record: Journal of the Transportation Research Board, Vol. 1918, pp. 46–55.
Knodler, M. A., D. A. Noyce, K. C. Kacir, and C. L. Brehmer. Analysis of Driver and Pedestrian Comprehension of Requirements for Permissive Left-Turn Applications. “Transportation Research Record: Journal of the Transportation Research Board, Vol. 1982, pp. 65–75.
Knodler, M.A. Jr., D.A. Noyce, K.C. Kacir, and C.L. Brehmer. 2006b.” Potential Application of Flashing Yellow Arrow Permissive Indication in Separated Left-Turn Lanes.” Transportation Research Record: Journal of the Transportation Research Board, Vol. 1973, pp. 10–17.
Knodler, M.A. Jr., D.A. Noyce, K.C. Kacir, and C.L. Brehmer. 2007. “An Evaluation of Driver Comprehension of Solid Yellow Indications Resulting from Implementation of Flashing Yellow Arrow”. Presented at the 86th Annual Meeting of the Transportation Research Board, Washington, D.C.
Kothuri, S., A. Kading, A. Schrope, K. White, E. Smaglik, C. Aquilar, and W. Gil. 2018. Addressing Bicycle-Vehicle Conflicts with Signal Control Strategies. Final Report. National Institute for Transportation and Communities.
Marnell, P., H. Tuss, D. Hurwitz, K. Paulsen, and C. Monsere. 2013. “Permissive Left-Turn Behavior at the Flashing Yellow Arrow in the Presence of Pedestrians.” In Conference Proceedings of the 7th International Driving Symposium on Human Factors in Driver Assessment, Training, and Vehicle Design, Bolton Landing, NY, pp. 488-494.
New York City Department of Transportation. 2018. Cycling at Crossroads. The Design Future of New York City Intersections. http://www.nyc.gov/html/dot/downloads/pdf/cycling-at-a-crossroads-2018.pdf
Noyce, D.A. and K.C. Kacir. 2001. “Drivers’ Understanding of Protected-Permitted Left-Turn Signal Displays.” Transportation Research Record: Journal of the Transportation Research Board, Vol. 1754, pp. 1–10.
Noyce, D.A. and K.C. Kacir. 2002. “Driver Understanding of Simultaneous Traffic Signal Indications in Protected Left Turns.” Transportation Research Record: Journal of the Transportation Research Board, Vol. 1801, pp. 18–26.
Noyce, D.A., and C.R. Smith. 2003. “Driving Simulators Evaluation of Novel Traffic-Control Devices: Protected-Permissive Left-Turn Signal Display Analysis”. Transportation Research Record: Journal of the Transportation Research Board, Vol. 1844, pp. 25–34.
Ryan A., E. Casola, C. Fitzpatrick, M. Knodler, “Flashing yellow arrows for right turn applications: A driving simulator study and static evaluation analysis,” Transportation Research Part F: Traffic Psychology and Behaviour, Volume 66, 2019, Pages 324-338, https://doi.org/10.1016/j.trf.2019.09.013
Evaluation of Size, Placement, and Orientation of Bicycle Signal Faces on Bicyclist and Driver Comprehension and Compliance
Boudart, J., R. Liu, P. Koonce, and L. Okimoto. 2015. Assessment of Bicyclist Behavior at Traffic Signals with a Detector Confirmation Feedback Device. Transportation Research Record: Journal of the Transportation Research Board, Vol. 2520, pp. 61–66. https://doi.org/10.3141/2520-08.
Fietsberaad. The Bicycle Friendliness of Traffic Control Systems. Fietsberaad, Amsterdam, 2003.
Guo, Y., Z. Li, P. Liu, and Y. Wu. 2015. Analysis of Red-Light Running Behaviors of Bicycle Riders at Signalized Bicycle Crossing Facilities in China. Presented at 93rd Annual Meeting of the Transportation Research Board, Washington D.C.
Johnson, M., S. Newstead, J. Charlton, and J. Oxley. 2011. “Riding Through Red Lights: The Rate, Characteristics and Risk Factors of Non-Compliant Urban Commuter Cyclists.” Accident Analysis and Prevention, 43(1), pp. 323-328.
Johnson, M., S. Newstead, J. Charlton, and J. Oxley. 2013. “Why do Cyclists Infringe at Red Lights? An Investigation of Australian Cyclists’ Reasons for Red Light Infringement.” Accident Analysis and Prevention, Vol. 50, pp. 840-847.
Monsere, C., M. Figliozzi, S. Thompson, and K. Paulsen. 2013. Operational Guidance for Bicycle-Specific Traffic Signals in the United States. Final Report, SPR 747/OTREC 2012FG, Oregon Department of Transportation and Oregon Research and Education Consortium.
Monsere, C., J. Dill, N. McNeil, K. Clifton, N. Foster, T. Goddard, M.Berkow, J.Gilpin, K. Voros, D.van Hengel, J.Parks. Lessons From The Green Lanes: Evaluating Protected Bike Lanes In The U.S. Final Report, National Institute for Transportation and Communities (NITC), NITC-RR583, June 2014.
Pelz, D., T. Bustos, and J. Flecker, J. 1996. The Use of Bicycle Signal Heads at Signalized Intersections. Davis California.
Richardson, M. and B. Caulfield. 2015. “Investigating Traffic Light Violations by Cyclists in Dublin City Center.” Accident Analysis & Prevention, Vol. 84, pp. 65-73.
Wu, C., L. Yao, and K. Zhang. The Red-Light Running Behavior of Electric Bike Riders and Cyclists at Urban Intersections in China: An Observational Study. Accident Analysis and Prevention. 2011.
Guidance on Visibility and Detection of Bicycle Symbols in Signal Faces by Lens Size and Distance
Hiron, B, A. Isler, and F. Tortel. 2014. “Signs and signals for cyclists and pedestrians: comparison of rules and practices in 13 countries.” Transport Research Arena (TRA) 5th Conference: Transport Solutions from Research to Deployment, Institut Francais des Sciences et Technologies des Transports, de l'amacnagement et des Racseaux (IFSTTAR).
Korve, H., J. Farran, and D. Mansel. 1996. Integration on Light Rail Transit into City Streets. TCRP Report 17, Transportation Research Board, National Research Council.
Pelz, D., T. Bustos, and J. Flecker, J. 1996. The Use of Bicycle Signal Heads at Signalized Intersections. Davis California.