21
Demand driven research in Dutch organic food chains Wijnand Sukkel, Paris March 4, 2010

Demand driven research in
Dutch organic food chains
Wijnand Sukkel, Paris March 4, 2010

Organic agriculture in the Netherlands
� Import (2007): € 250#300 million
� Export (2007): € 500#550 million. (70% is exported)
2.1%1.1%n.d.Share of total consumption
583235160Sales organic food (€ million)
14731216n.d.Number of org. farms
2.6%1.2%0.7%Percentage of total agricultural area
50,43522,99712,500Area organic farming (ha)
200819991996
Policy priority area’s (2008�2011)
� Stimulation demand en chain connections
� Knowledge and innovation
� No production, area or conversion subsidies for organic
� Total stimulation budget 2008 – 2011: € 49.2 million
Policy background organic research
� Organic agriculture considered to have high potential for sustainable agriculture
� Inspiration source for conventional agriculture
� 10% of the public research budget for agriculture is to be spent for organic agriculture
� Organic sector ‘owns’ the research
� Preferred research suppliers: Wageningen UR (85%) and Louis BolkInstitute (15%)
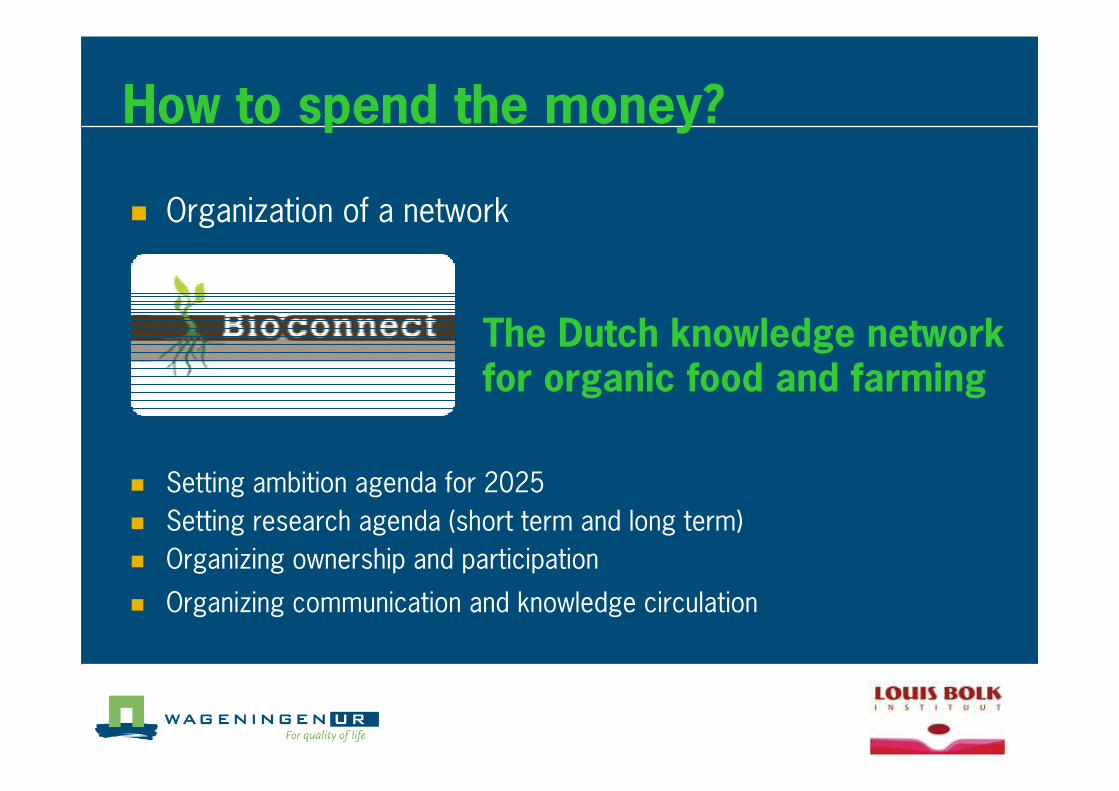
How to spend the money?
� Organization of a network
� Setting ambition agenda for 2025
� Setting research agenda (short term and long term)
� Organizing ownership and participation
� Organizing communication and knowledge circulation
The Dutch knowledge network for organic food and farming

Important research issues
� Healthy varieties, seeds and propagation material
� Sustainable soil management
� Resilient production systems
� Management of weeds, pests and diseases
� Animal welfare and animal health
� Minimizing emission and accumulation
� Healthy, safe and tasteful food
� Enhancement Biodiversity, Nature and Landscape
� Connections to consumers and society

Research food chain
� Consumer preferences
� Shelf presentation
� Branding and certification
� Sustainability in the food chain
� Creating new added values
� Cost price reduction
� Contamination risks in the total chain
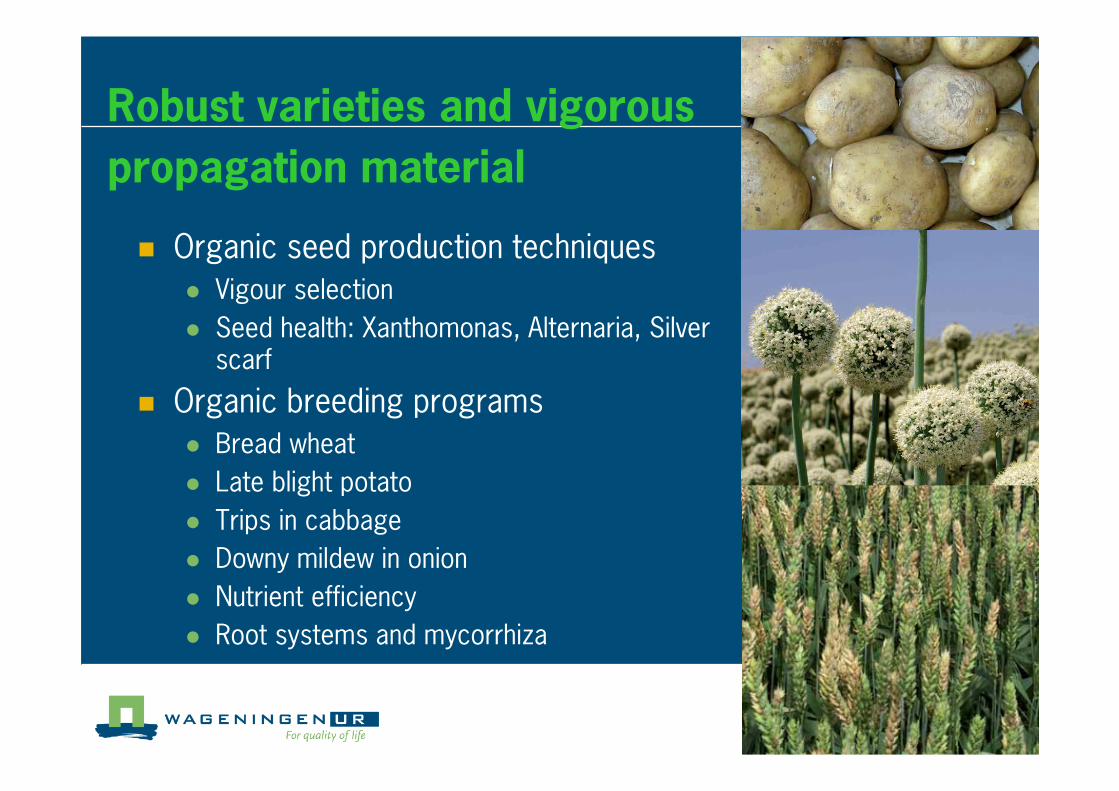
Robust varieties and vigorous
propagation material
� Organic seed production techniques
� Vigour selection
� Seed health: Xanthomonas, Alternaria, Silver scarf
� Organic breeding programs
� Bread wheat
� Late blight potato
� Trips in cabbage
� Downy mildew in onion
� Nutrient efficiency
� Root systems and mycorrhiza
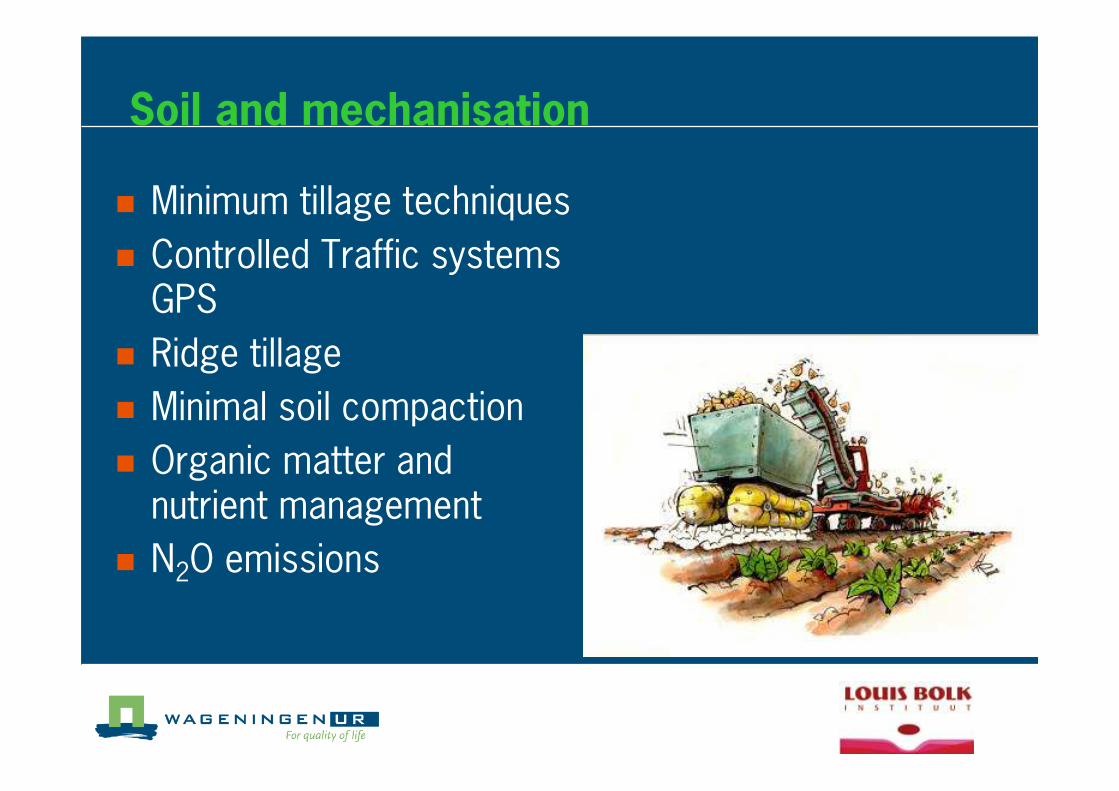
Soil and mechanisation
� Minimum tillage techniques
� Controlled Traffic systems GPS
� Ridge tillage
� Minimal soil compaction
� Organic matter and nutrient management
� N2O emissions
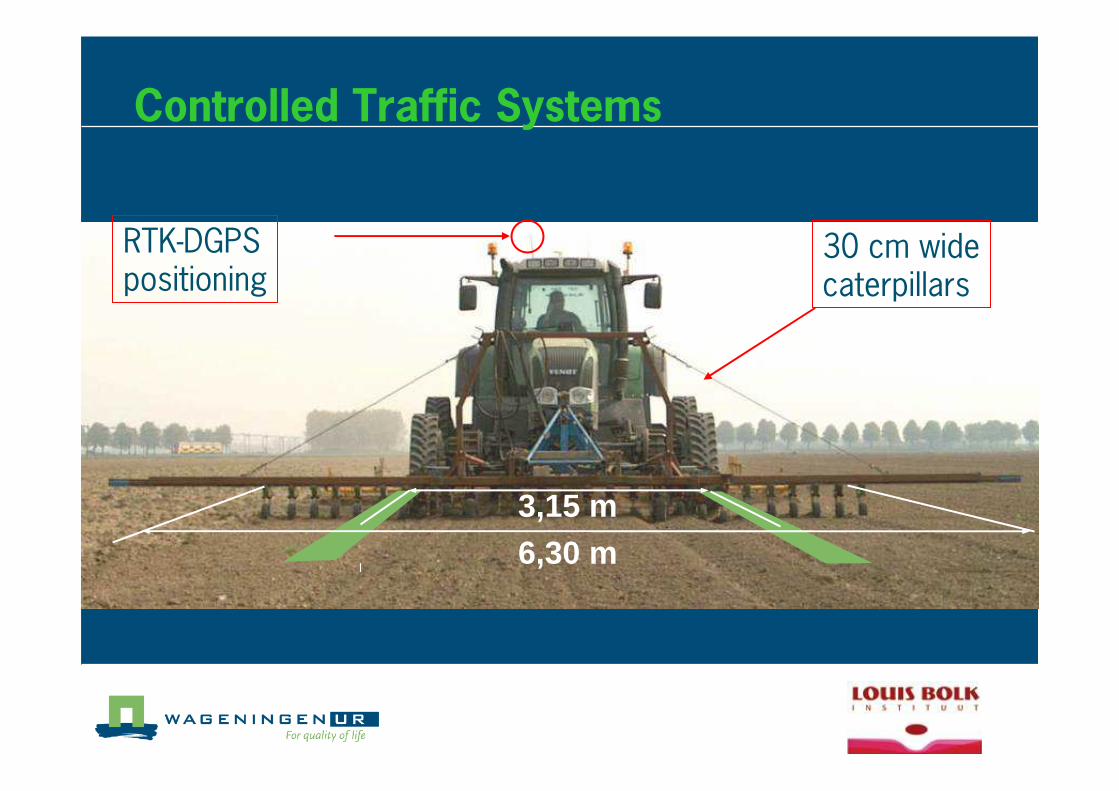
Controlled Traffic Systems
3,15 m6,30 m
30 cm widecaterpillars
RTK#DGPSpositioning
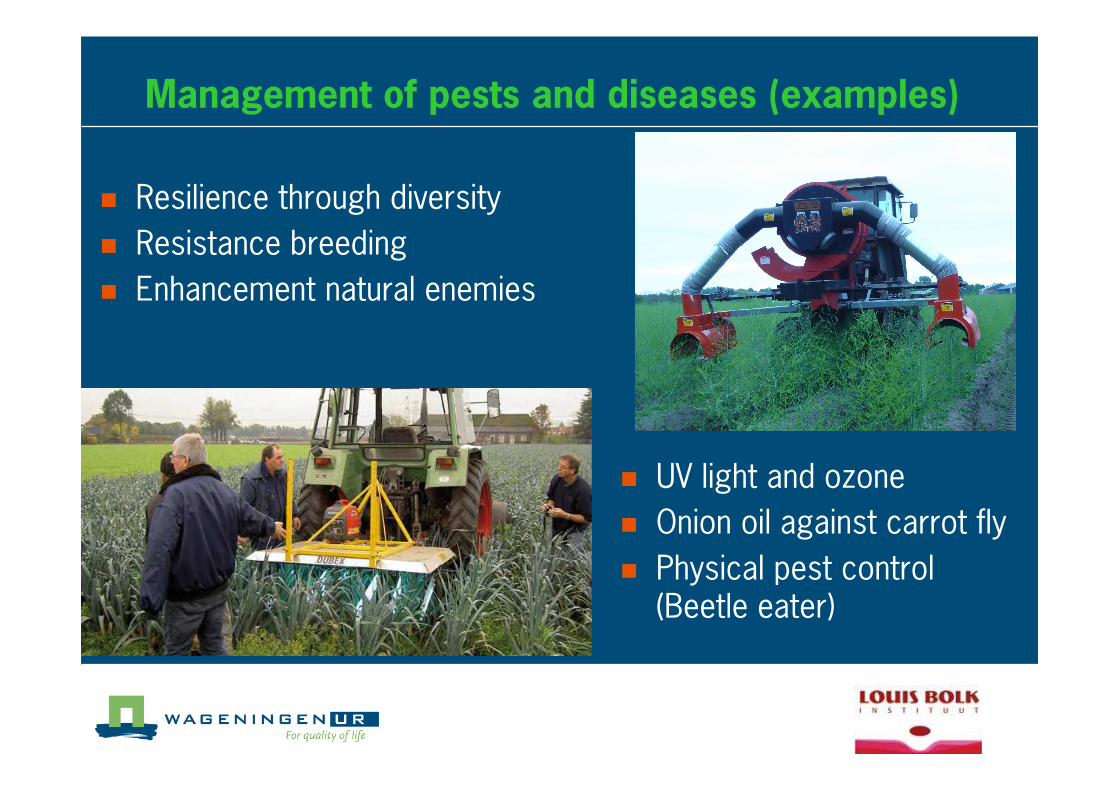
Management of pests and diseases (examples)
� UV light and ozone
� Onion oil against carrot fly
� Physical pest control (Beetle eater)
� Resilience through diversity
� Resistance breeding
� Enhancement natural enemies

Weed management

Animal health and welfare (examples)
Space for natural behaviour, animal friendly stables
Ecology#welfare#economy
� Herb therapy
� Fly control
� Worm prevention
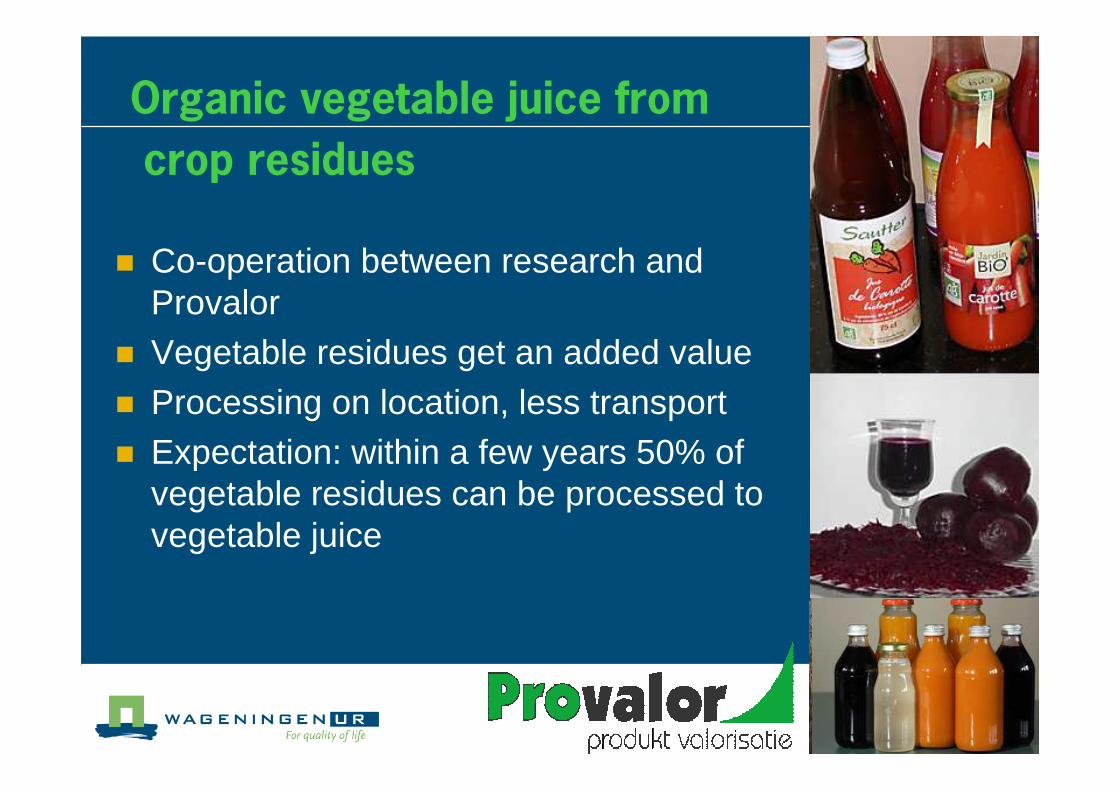
Organic vegetable juice from
crop residues
� Co-operation between research and Provalor
� Vegetable residues get an added value� Processing on location, less transport � Expectation: within a few years 50% of
vegetable residues can be processed to vegetable juice
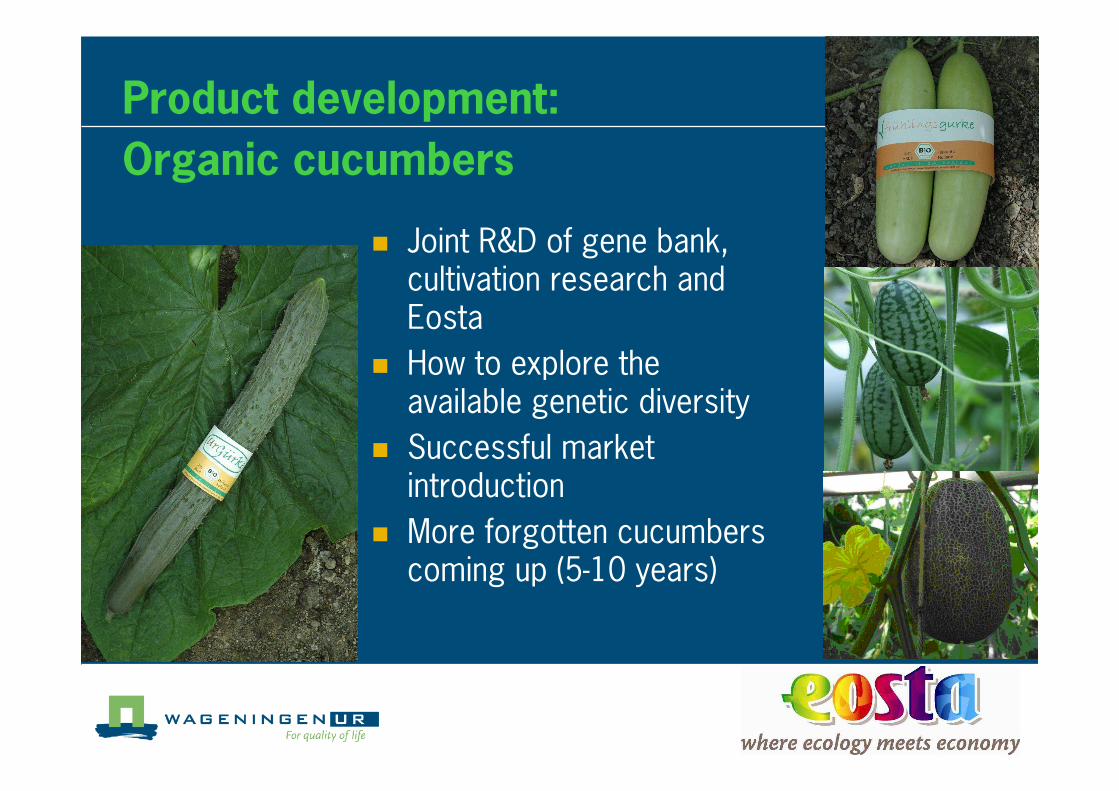
Product development:
Organic cucumbers
� Joint R&D of gene bank, cultivation research and Eosta
� How to explore the available genetic diversity
� Successful market introduction
� More forgotten cucumbers coming up (5#10 years)
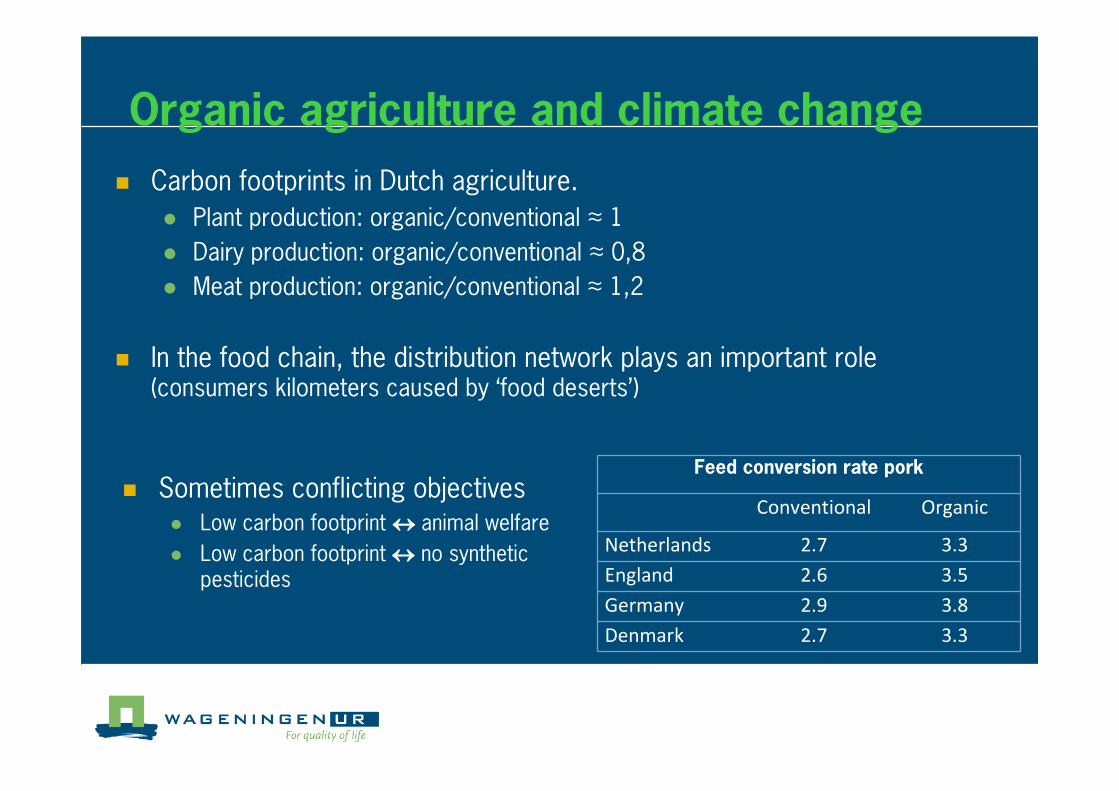
Organic agriculture and climate change
� Carbon footprints in Dutch agriculture.
� Plant production: organic/conventional ≈ 1
� Dairy production: organic/conventional ≈ 0,8
� Meat production: organic/conventional ≈ 1,2
� In the food chain, the distribution network plays an important role (consumers kilometers caused by ‘food deserts’)
Feed conversion rate pork
Conventional Organic
Netherlands 2.7 3.3
England 2.6 3.5
Germany 2.9 3.8
Denmark 2.7 3.3
� Sometimes conflicting objectives � Low carbon footprint ↔ animal welfare
� Low carbon footprint ↔ no synthetic pesticides
Organic agriculture and climate change
� For organic primary production two key factors
� Sustainable Soil Management (mitigation, adaptation, resilience
and long term production capacity)
� Organic matter cycles and management (storage, energy
production, composting, carbon sequestration etc)
Future challenges for research
� Resilient systems: Soil, Organic matter and (functional) Biodiversity in focus
� Development non chemical weed, pest and disease management
� Staying fore#runners in sustainability
� Developing standards, branding and consumer information (Fair trade, biodiversity, carbon footprint, sustainable soil management, ……)
� Involve mainstream research and practice
� International research agenda and cooperation in research
Thank you very much
for your attention!!

Spare slide
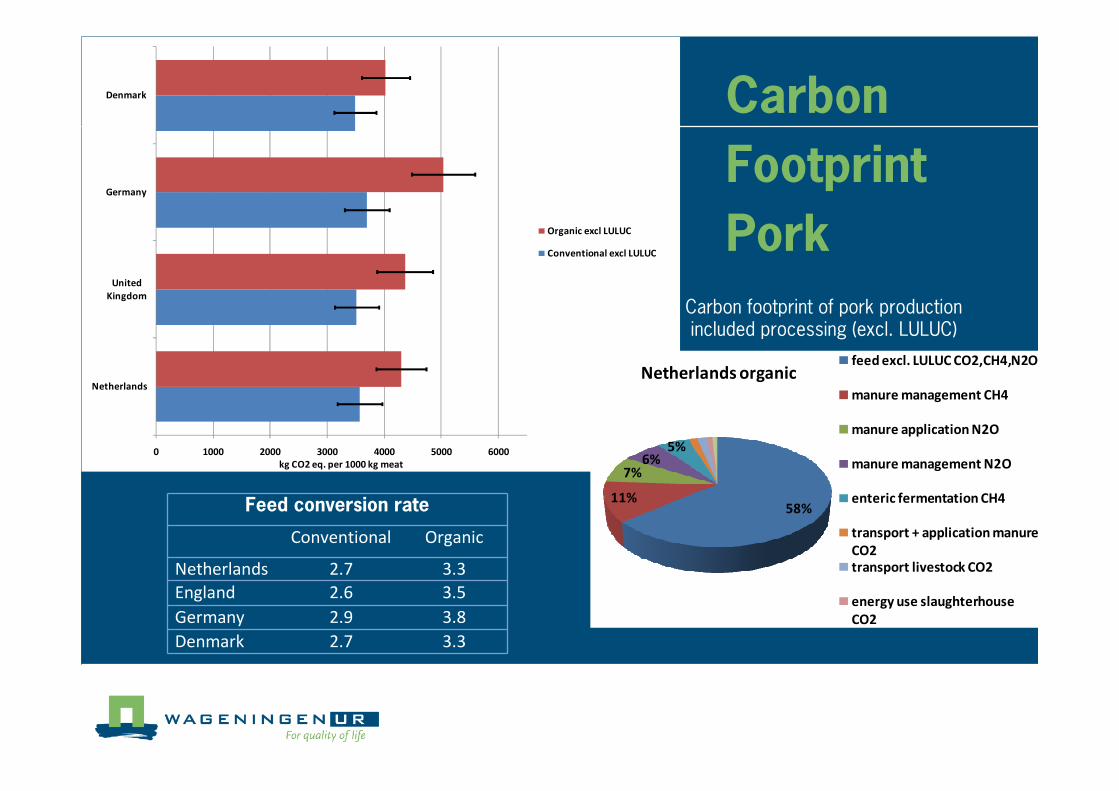
0 1000 2000 3000 4000 5000 6000
Netherlands
United
Kingdom
Germany
Denmark
kg CO2 eq. per 1000 kg meat
Organic excl LULUC
Conventional excl LULUC
Carbon
Footprint
Pork
58%11%
7%6%
5%
Netherlands organicfeed excl. LULUC CO2,CH4,N2O
manure management CH4
manure application N2O
manure management N2O
enteric fermentation CH4
transport + application manure
CO2
transport livestock CO2
energy use slaughterhouse
CO2
Carbon footprint of pork production included processing (excl. LULUC)
Feed conversion rate
Conventional Organic
Netherlands 2.7 3.3
England 2.6 3.5
Germany 2.9 3.8
Denmark 2.7 3.3


