Page 1
1
Contribution of HONO to the atmospheric oxidation capacity in an industrial zone 1
in the Yangtze River Delta region of China 2
Jun Zheng1*, Xiaowen Shi1, Yan Ma1,2, Xinrong Ren3,4,5, Halim Jabbour1, Yiwei Diao1,6, Weiwei Wang6, Yifeng 3
Ge1, Yuchan Zhang1, and Wenhui Zhu1 4
1Collaborative Innovation Center of Atmospheric Environment and Equipment Technology, Nanjing University 5
of Information Science & Technology, Nanjing 210044, China 6
2NUIST Reading Academy, Nanjing University of Information Science & Technology, Nanjing 210044, China 7
3Air Resources Laboratory, National Oceanic and Atmospheric Administration, College Park, Maryland, USA 8
4Department of Atmospheric and Oceanic Science, University of Maryland, College Park, Maryland, USA 9
5Cooperative Institute for Satellite Earth System Studies, University of Maryland, College Park, Maryland, USA 10
6Key Laboratory for Aerosol-Cloud-Precipitation of China Meteorological Administration, Department of 11
Atmospheric Physics, Nanjing University of Information Science and Technology, Nanjing 210044, China 12
13
Correspondence to: Dr. Jun Zheng ([email protected] )� 14
Address: School of Environmental Science and Engineering, Nanjing University of Information 15
Science & Technology, Nanjing 210044, China 16
Tel.: +86-18251919852 17
Fax: +86-25-58731090 18
19
https://doi.org/10.5194/acp-2019-944Preprint. Discussion started: 9 December 2019c© Author(s) 2019. CC BY 4.0 License.
Page 2
2
Key points: 20
• High levels of HONO, with an average of 1.32 ± 0.92 ppbv, were observed near one of the largest industrial 21
zone in the YRD region of China. 22
• HONO photolysis and alkene ozonolyses contributed the most of OH production and hence the atmospheric 23
oxidation capacity. 24
• High HONO concurred with high loading of PM2.5, indicating potential synergetic effects. 25
• Heterogeneous formation mechanisms were the most important daytime HONO sources and were further 26
enhanced by sunlight. 27
Abstract 28
A suite of instruments were deployed to simultaneously measure nitrous acid (HONO), nitrogen oxides (NOx 29
= NO + NO2), carbon monoxide (CO), ozone (O3), volatile organic compounds (VOCs, including formaldehyde 30
(HCHO)) and meteorological parameters near a typical industrial zone in Nanjing of the Yangtze River Delta region, 31
China. High levels of HONO were detected using a wet chemistry-based method. HONO ranged from 0.03-7.04 32
ppbv with an average of 1.32 ± 0.92 ppbv. Elevated daytime HONO was frequently observed with a minimum of 33
several hundreds of pptv on average, which cannot be explained by the homogeneous OH + NO reaction (POH+NO) 34
alone, especially during periods with high loadings of particulate matters (PM2.5). The HONO chemistry and its 35
impact on atmospheric oxidation capacity in the study area were further investigated using a MCM-box model. The 36
results show that the average hydroxyl radical (OH) production rate was dominated by the photolysis of HONO 37
(7.13×10⁶ molecules cm-3 s-1), followed by ozonolysis of alkenes (3.94×10⁶ molecules cm-3 s-1), photolysis of O3 38
(2.46×10⁶ molecules cm-3 s-1) and photolysis of HCHO (1.60×10⁶ molecules cm-3 s-1), especially within the plumes 39
originated from the industrial zone. The observed similarity between HONO/NO2 and HONO in diurnal profiles 40
strongly suggests that HONO in the study area was likely originated from NO2 heterogeneous reactions. The 41
https://doi.org/10.5194/acp-2019-944Preprint. Discussion started: 9 December 2019c© Author(s) 2019. CC BY 4.0 License.
Page 3
3
average nighttime NO2 to HONO conversion rate was determined to be ~0.9% hr-1. Good correlation between 42
nocturnal HONO/NO2 and the products of particle surface area density (S/V) and relative humidity (RH), S/V×RH, 43
supports the heterogeneous NO2/H2O reaction mechanism. The other HONO source, designated as Punknonwn, was 44
about twice as much as POH+NO on average and displayed a diurnal profile with an evidently photo-enhanced feature, 45
i.e., photosensitized reactions of NO2 may be an important daytime HONO source. Nevertheless, our results suggest 46
that daytime HONO formation was mostly due to the light-induced conversion of NO2 on aerosol surfaces but 47
heterogeneous NO2 reactions on ground surface dominated nocturnal HONO production. Concurred elevated 48
HONO and PM2.5 levels strongly indicate that high HONO may increase the atmospheric oxidation capacity and 49
further promote the formation of secondary aerosols, which may in turn synergistically boost NO2/HONO 50
conversion by providing more heterogeneous reaction sites. 51
1 introduction 52
Nitrous acid (HONO) plays an important role in tropospheric photochemistry because its fast photolysis 53
contributes to the formation of hydroxyl (OH) radical, which is an essential atmospheric oxidant that initiates the 54
oxidation of volatile organic compounds (VOC) to form organic peroxy radicals (RO2) and hydroperoxyl radical 55
(HO2). In the present of nitrogen oxides (NOx = NO + NO2), these free radicals are the fundamental driving force 56
of photochemical reaction cycles that lead to the formation of ground-level ozone (O3) and secondary organic 57
aerosols (SOA) (Finlayson-Pitts and Pitts, 1999; Xue et al., 2016). Besides HONO photolysis (R1), the major 58
known OH radical initiation sources include photolysis of O3 (R2 and R3) and formaldehyde (HCHO) (R4 to R8), 59
and ozonolysis of alkenes (R9) (Finlayson-Pitts and Pitts, 1999). Nevertheless, many field studies have 60
demonstrated that HONO may strongly affect atmospheric oxidation capacity in various environments (Bernard et 61
al., 2016; Elshorbany et al., 2009; Elshorbany et al., 2010; Zhou et al., 2002). In early studies, HONO was believed 62
to be only important as NOx reservoir during nighttime, when HONO can accumulate in the atmosphere and give 63
https://doi.org/10.5194/acp-2019-944Preprint. Discussion started: 9 December 2019c© Author(s) 2019. CC BY 4.0 License.
Page 4
4
a boost of photochemistry in the following early morning (Platt et al., 1980). However, recent field studies have 64
demonstrated that high concentrations of HONO are often present in the relatively polluted urban areas during the 65
day. Because of high levels of HONO, the photolysis of HONO becomes an important OH source not only in the 66
early morning but also throughout the day and can contribute up to 30-90% of OH radical during daytime (Acker 67
et al., 2006; Hendrick et al., 2014; Kleffmann et al., 2005; Neftel et al., 1996; Spataro et al., 2013; Su et al., 2008; 68
Zhou et al., 2002). 69
HONO + hv (300 nm < l < 405 nm) ® OH + NO (R1) 70
O3 + hv (l < 319 nm) ® O(1D) + O2 (R2) 71
O(1D) + H2O ® 2OH (R3) 72
HCHO + hv (l < 330 nm) ® H + HCO (R4) 73
HCHO + hv (l < 361 nm) ® H2 + CO (R5) 74
H + O2 ® HO2 (R6) 75
HCO + O2 ® HO2 + CO (R7) 76
HO2 + NO ® NO2 + OH (R8) 77
Alkenes + O3 ® OH + other products (R9) 78
Despite the significance of HONO in daytime photochemistry, the sources and formation mechanisms of 79
HONO, especially during daytime, are still uncertain. Traditionally, the reaction between NO and OH was thought 80
to be the most important homogeneous source for HONO (Perner and Platt, 1979): 81
OH + NO + M ® HONO (R10) 82
However, reaction R10 alone cannot sustain the high HONO level observed during daytime in many studies, in 83
which the observed HONO levels were often an order of magnitude greater than the modeled HONO with only 84
homogeneous HONO source (R10) included in the model (Ren et al., 2010; Tang et al., 2015). Nevertheless, higher 85
than expected OH observed in several studies (Hofzumahaus et al., 2009) may explain partially observed higher 86
https://doi.org/10.5194/acp-2019-944Preprint. Discussion started: 9 December 2019c© Author(s) 2019. CC BY 4.0 License.
Page 5
5
than model predicted HONO levels. It has been suggested that HONO may be emitted directly by incomplete 87
combustion processes, such as vehicle exhaust (Kirchstetter et al., 1996; Kurtenbach et al., 2001; Liang et al., 2017; 88
Nakashima and Kajii, 2017; Trinh et al., 2017; Xu et al., 2015) and biomass burning (Müller et al., 2016; Neuman 89
et al., 2016; Nie et al., 2015; Rondon and Sanhueza, 1989). However, such strong but sporadic point sources could 90
not account for the widely observed daytime HONO in the polluted areas (Elshorbany et al., 2012; Wang et al., 91
2017). Recently, many other HONO formation pathways have been proposed. Su et al. (2011) pointed out that 92
HONO can be released from soil nitrite, which was formed through biological nitrification and denitrification 93
processes. Recent studies demonstrated that the pH and organic content of soil could influence the HONO emission 94
rate (Scharko et al., 2017; Sörgel et al., 2015). In addition, vertical profiles of HONO measurements indicated that 95
HONO was very likely originated from the ground surface (Kleffmann et al., 2003; VandenBoer et al., 2013; Wong 96
et al., 2011; Wong et al., 2013). However, the presence of in-situ HONO sources in the air masses aloft cannot be 97
ruled out (Wong et al., 2013; Zhang et al., 2009). 98
Several heterogeneous processes have been drawn substantial attention and are proposed as the major HONO 99
sources, including: (1) heterogeneous conversion of NO2 on wet surface (Finlayson-Pitts et al., 2003), which could 100
be an important nocturnal HONO source; (2) NO2 heterogeneous reaction with fresh soot particles (Ammann et al., 101
1998; Gerecke et al., 1998; Han et al., 2017a; Monge et al., 2010) and semi-volatile organic compound emitted 102
from diesel exhausts (George et al., 2005; Gutzwiller et al., 2002), which could be an important process becasue it 103
is 1 to 2 orders of magnitude faster than the typically proposed heterogeneous reaction of 2NO2 + H2O; (3) 104
photosensitized reaction of NO2 on surfaces of mineral dust (Ndour et al., 2008), humic acid (Han et al., 2017b; 105
Wall and Harris, 2016), and ground surface (i.e., certain reactions such as NO2 + humic acids on ground surfaces) 106
(Wong et al., 2012), which has been considered as an important daytime HONO source (Lee et al., 2016); (4) 107
photolysis of adsorbed nitric acid (HNO3) and nitrate (NO3-) (Ye et al., 2016; Ye et al., 2017; Zhou et al., 2002; 108
Zhou et al., 2003; Zhou et al., 2011; Ziemba et al., 2010); (5) VOC-mediated conversion of HNO3 into HONO 109
https://doi.org/10.5194/acp-2019-944Preprint. Discussion started: 9 December 2019c© Author(s) 2019. CC BY 4.0 License.
Page 6
6
(Gall et al., 2016). 110
Since the first atmospheric HONO measurement by Nash (1974) and the first use of long path differential UV 111
absorption technique (LP-DOAS) to measure atmospheric HONO (Perner and Platt, 1979), various measurement 112
techniques for HONO have been developed, such as spectroscopic techniques, wet chemistry-based techniques, 113
and chemical ionization mass spectrometry (CIMS). Besides DOAS technique, other spectroscopic techniques such 114
as the cavity ring-down spectroscopy (Rairoux et al., 2002), the incoherent broadband cavity-enhanced absorption 115
spectroscopy (IBBCEAS) (Gherman et al., 2008), and the cavity-enhanced absorption spectrometer (CEAS) 116
(Scharko et al., 2017) were applied in the HONO measurements. Wet chemistry techniques have the advantages of 117
higher sensitivity and lower detection limit, including long path absorption photometer (LOPAP) (Heland et al., 118
2001; Kleffmann et al., 2003; Kleffmann et al., 2005; Kleffmann et al., 2006; Kleffmann and Wiesen, 2008; Vecera 119
and Dasgupta, 1991), AIM-IC analysis system and wet-rotating-denuder (WRD) method (Makkonen et al., 2012). 120
Very recently, CIMS techniques have been developed for fast on-line HONO measurements (Bernard et al., 2016; 121
Pinto et al., 2014; Ren et al., 2010). 122
Yangtze River Delta (YRD) region is the largest industrial zone in China and is experiencing ever increasing 123
air pollution events, characterized with high ozone (O3) and fine particulate matters (PM2.5) concentrations (Ding 124
et al., 2013). Despite of the great efforts in reducing sulfur dioxide (SO2) and NOx emissions from industrial 125
activities, high level of NOx along with ammonia/amines have been observed near an industrial park (Zheng et al., 126
2015b). In addition, high levels of HCHO have been frequently observed near industrial zones in China (Ma et al., 127
2016; Wang et al., 2015b), providing an extra radical source. HONO concentrations calculated using a 128
photostationary state (PSS) approach that included homogeneous sources were found much less HONO than the 129
measured values during daytime (Kleffmann et al., 2005; Michoud et al., 2014). Lee et al. (2016) conducted a 130
detailed analysis of HONO budget and proposed that the missing daytime HONO source was related to NO2 and 131
sunlight. A four-season measurement campaign was carried out in an urban site of Beijing and the results showed 132
https://doi.org/10.5194/acp-2019-944Preprint. Discussion started: 9 December 2019c© Author(s) 2019. CC BY 4.0 License.
Page 7
7
monthly averaged HONO concentrations between 1.05 and 2.27 ppbv with pronounced seasonal profile (Wang et 133
al., 2017). In a recent study, Nie et al. (2015) revealed the influence of biomass burning on HONO formation at a 134
suburban site of Nanjing and demonstrated that the contribution of heterogeneous conversion of NO2 to HONO 135
formation. However, so far, no comprehensive study on the oxidizing capability, i.e., the major contributors of OH 136
radicals, has ever been conducted in the industrial zone of YRD region. 137
In this work, we have performed HONO measurements using a custom-built wet chemistry-based method at 138
an industrial site in December 2015 in Nanjing, China. In addition, HCHO, O3, photolysis frequencies, and other 139
trace gases and meteorological parameters were also measured. The contributions of HONO along with other OH 140
sources to OH budget were investigated using a box model based on Master Chemical Mechanism (MCM). The 141
mechanisms of possible daytime HONO formation and the consequent impacts on air pollutants formation were 142
explored. 143
144
2 Experimental and Model Description 145
2.1 HONO Measurement 146
The field measurements were carried out from 1 to 31 December 2015 on the campus of Nanjing University 147
of Information Science and Technology (NUIST) in Nanjing, China. More details about the observation site have 148
been provided in our previous work (Ma et al., 2016; Zheng et al., 2015b). Briefly, the site is located to the west of 149
clusters of steel mills and petrochemical refinery facilities and is about 15 km to the north of the downtown Nanjing. 150
All instruments were placed inside an air-conditioned trailer. In this study, a custom-built wet chemistry-based 151
HONO instrument was utilized for HONO measurements, which was originally developed by Ren et al. (2010). 152
Figure 1 is the schematics of the HONO instrument, consisting of two sample collection glass coils connected 153
https://doi.org/10.5194/acp-2019-944Preprint. Discussion started: 9 December 2019c© Author(s) 2019. CC BY 4.0 License.
Page 8
8
successively, a 10-port injection valve (Valco Instruments Co. Inc.), a 1-m long liquid waveguide capillary cell 154
(LWCC, World Precision Instruments), and a mini spectrometer (Ocean optics, USB4000). 155
To minimize the sampling artifacts, the sampling coils were set up about 3.5 m above the ground (1.5 m above 156
the trailer rooftop) and no inlet was used. Ambient air was pulled through the coils by a vacuum pump at 1 L min-157
1, which was controlled by a mass flow controller (MKS, model M100B). In the first coil, HONO along with some 158
interfering species in the air sample were separated from the gas phase and transformed into nitrite solution by a 159
1.0 mmol L−1 phosphate buffer scrubbing solution. Potential interfering species (e.g., NO2) would also interact with 160
scrubbing solution in the second coil in a similar way as in the first coil. The nitrite solutions from the two coils 161
were then respectively mixed with sulfanilamide/N-(1-naphthyl) ethylene-diamine (SA/NED) reagents in Teflon 162
derivatization tubing and nitrite was converted via the two reactions (SR1 and SR2, see the SI for details) (Huang 163
et al., 2002). The aqueous sample was injected into the LWCC and the produced azo dye was quantified by its 164
absorption at 560 nm with a mini USB spectrometer. The difference between the absorbance signals of the two 165
coils was treated as the actual HONO signal. The HONO mixing ratio in ambient air was calculated using Eq. (1): 166
[HONO]pptv = !"#"$%#&'
´ 1012 (1) 167
where, Cl is nitrite concentration (mol L−1) in the scrubbing solution, Fl is the liquid flow rate (mL min−1) of the 168
scrubbing solution, Fg is the sampling air flow rate (L min−1), R is the ideal gas constant (8.314 m3 Pa K−1mol−1), 169
and T and P are the ambient temperature (294 K) and atmospheric pressure (101325 Pa), respectively, under which 170
the mass flow controller (MFC) that was used to control the sample flow rate was calibrated (Ren et al., 2010). The 171
HONO instrument was calibrated every four days using sodium nitrite standard solutions. According to the 172
calibration curve, HONO mixing ratio in ambient air can be quantified. The detection limit of the HONO instrument 173
was about 3 pptv with a time resolution of 2 min. The measurement accuracy was about ±15% at a 95% confidence 174
level (Ren et al., 2010). 175
https://doi.org/10.5194/acp-2019-944Preprint. Discussion started: 9 December 2019c© Author(s) 2019. CC BY 4.0 License.
Page 9
9
2.2 Other measurements 176
As the observation site was part of a national standard meteorology observatory facility, meteorology 177
parameters, including wind direction, wind speed, ambient temperature, pressure and RH were continuously 178
measured. Trace gases, CO (Thermo Scientific, Model 48i), O3 (Thermo Scientific, Model 49i), SO2 (Thermo 179
Scientific, Model 43i) and NOx (Thermo Scientific, Model 17i) were also measured at the observation site. The 180
Thermo Scientific 17i is designed as an ammonia (NH3) analyzer. It basically consists of a typical NOx analyzer 181
and an external high temperature (700°C) NH3 converter, which is disabled and bypassed in this work. Therefore, 182
it was used as a typical NOx analyzer. It is well known that a NO-NOx analyzer with a molybdenum-based converter 183
can convert portion of NOz (=NOy-NOx) to NO, which can then be detected as NO2 causing an interference in NO2 184
measurement (Villena et al., 2012). However, an aircraft study conducted in the eastern US in the winter 2015 185
found that within 6 hours of transport time, NOx account for more than 90% of NOy in an urban outflow (Salmon 186
et al., 2018). A sensitivity analysis showed that by decreasing the NO2 level of 10% (an upper limit assuming all 187
NOz were converted into NO with an efficiency of 100%), the modeled HONO decreased only by 5.3%, indicating 188
that the possible small interference in NO2 measurement did not impact significantly on the modeled HONO results. 189
The details about the operation and calibrations of these instruments were described in previous work (Zheng et al., 190
2015b). PM2.5 was observed by an online PM2.5 measuring instrument (METONE, BAM-1020) with a time 191
resolution of 1 hour. Aerosol surface area density was calculated using data from an WPS (wide particle 192
spectrometer , MSP model 1000XP) with a time resolution of 5 min. HCHO was measured with the DNPH method 193
from 19 to 30 December 2015 and the sampling time was 2 hours during the campaign. Detailed operation 194
procedures about the DNPH method in this study can refer to our previous work (Ma et al., 2016). Photolysis 195
frequencies (J values), including J(O1D), J(NO2), J(HONO), J(H2O2), J(HCHO), and J(NO3), were calculated based 196
on measurements by an ultra-fast charged coupled device (CCD) detector spectrometer (Meteorology Consult 197
Gmbh, Germany). The acquisition time for J values was 1 min. Other photolysis frequencies (such as carbonyls 198
https://doi.org/10.5194/acp-2019-944Preprint. Discussion started: 9 December 2019c© Author(s) 2019. CC BY 4.0 License.
Page 10
10
with more than two carbons) used in the model were calculated by Eq. (2) (Jenkin et al., 1997): 199
Ji = Li cos(c) Mi exp(-Ni sec(c)) (2) 200
where χ is the solar zenith angle; Li, Mi, and Ni are photolysis parameters and are taken from (Jenkin et al., 1997), 201
for clear sky conditions. The calculated photolysis frequencies were then scaled by the measured J(NO2) for 202
cloudiness correction. 203
Volatile organic compounds (VOC) measurements were conducted using a commercial gas chromatograph 204
equipped with a flame ionization detector (AMA, GC5000). Sixty VOC species including C2-C12 hydrocarbons 205
were detected with a time resolution of 1 hr. Ten of the most reactive alkenes were used in the ozonolysis reaction 206
in the box model simulations. 207
2.3 Box Model 208
To evaluate the effect of HONO on daytime atmospheric oxidation capacity, a chemical box model with the 209
Master Chemical Mechanism (MCMv3.2) (Jenkin et al., 2012) was applied to calculate the concentrations of OH, 210
HO2 radicals and their production and loss rates using the FACSIMILE software package (UES Software Inc.). 211
Kinetic rate coefficients were taken from the MCM website (http://mcm.leeds.ac.uk/MCM/). In this study, the 212
model simulation was constrained with hourly averaged measurement results, including HONO, O3, NO, NO2, CO, 213
SO2, HCHO, VOC, as well as water vapor, temperature, pressure, and photolysis frequencies. 214
Monte Carlo sensitivity analyses were conducted to assess the model performance. In each Monte Carlo 215
simulation, the input variables of the model, including HONO, O3, NO, NO2, CO, SO2, HCHO, VOCs, reaction 216
rate constants, and photolysis frequencies, were independently set to vary within ±10% of the mean value of 217
individual variable with a normal probability distribution. 218
219
https://doi.org/10.5194/acp-2019-944Preprint. Discussion started: 9 December 2019c© Author(s) 2019. CC BY 4.0 License.
Page 11
11
3 Results and Discussion 220
3.1 Data Overview 221
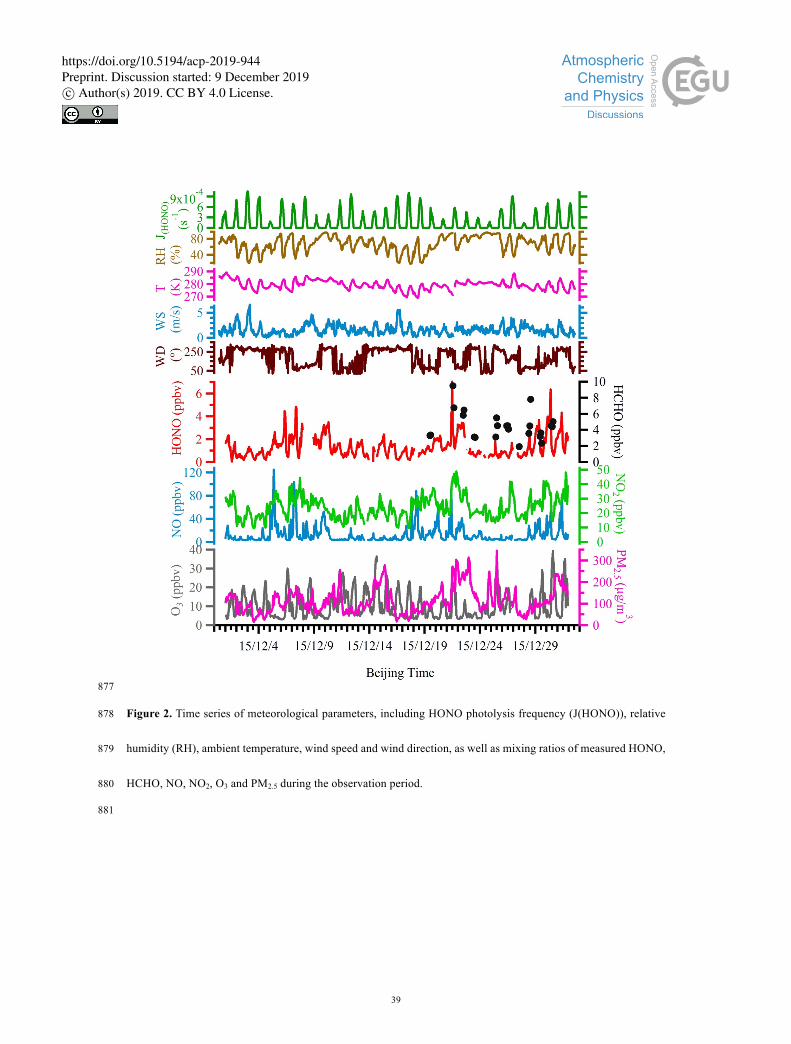
Figure 2 shows the time series of NO, NO2, O3, PM2.5, HONO, HCHO, J(HONO), and meteorological 222
parameters, including wind direction, wind speed, temperature, and RH. During the entire campaign period, the 223
wind speed ranged from 0.1 to 8.1 m s-1 with an average of 1.7 m s-1. The temperature varied between -4.1 °C and 224
16.1 °C with an average of 6.1 °C; RH varied between 17 % and 96 % with an average of 68 %. 225
During the entire measurement period, the HONO mixing ratios ranged from 0.03 ppbv to 7.04 ppbv with a 226
mean value of 1.32 ± 0.92 ppbv. Table 1 lists recent HONO observations conducted in China. Our result was 227
comparable to HONO observed in Xinken (Su et al., 2008) and Beijing (Spataro et al., 2013; Wang et al., 2017) 228
but higher than Xianghe, Beijing (Hendrick et al., 2014), Jinan (Wang et al., 2015a), Hong Kong (Xu et al., 2015) 229
and Shanghai (Wang et al., 2013). Clearly, the general trend of HONO was closely following that of NO2, which is 230
the dominant precursor of HONO. More markedly, building up of HONO frequently proceeded the accumulations 231
of PM2.5, e.g., on the 7th and from the 21st - 22nd of December 2015, indicating that HONO may promote the 232
formation of secondary aerosol by contributing to OH production, which will be further analyzed in details in the 233
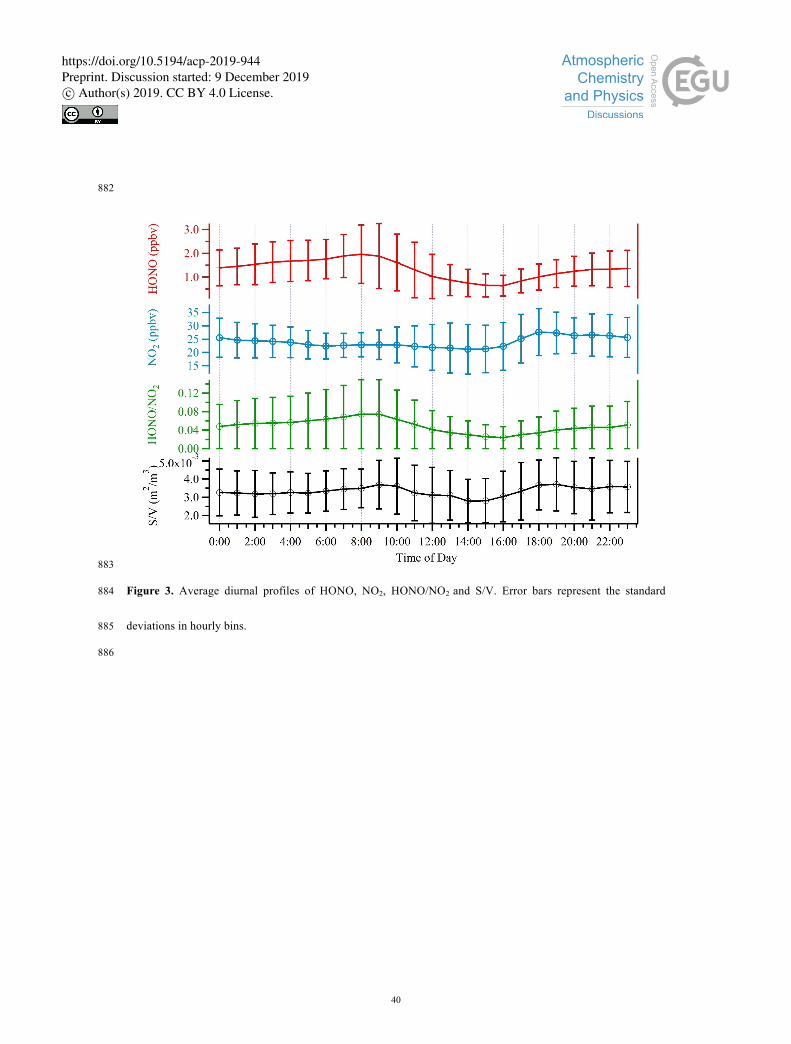
following sections. The campaign averaged diurnal variations of HONO, NO2, HONO/NO2 ratio and aerosol S/V 234
are showed in Fig. 3. HONO started to accumulate after sunset and reached its daily maxima of ~2.0 ppbv at 08:00 235
local time (LT). Later the day, the HONO mixing ratio decreased rapidly due to its fast photolysis and increase of 236
the planetary boundary layer (PBL) height. Evidently, daytime HONO was sustained at a relatively high level. The 237
minimum of ~0.6 ppbv was observed around 16:00 LT. The mixing ratio of NO2 varied from 9.5 ppbv to 48.7 ppbv 238
with an average of 23.9 ± 7.5 ppbv and a maximum of 27.7 ± 8.8 ppbv. NO, O3 and PM2.5 mixing ratios were in 239
the range of 2.7 ppbv - 124.9 ppbv, 3 ppbv - 39 ppbv and 15 µg m-3 - 345 µg m-3, respectively. Meanwhile, the 240
HONO-to-NO2 ratios ranged from 0.02 to 0.07, with an average of 0.05 ± 0.03. The observed similarity between 241
https://doi.org/10.5194/acp-2019-944Preprint. Discussion started: 9 December 2019c© Author(s) 2019. CC BY 4.0 License.
Page 12
12
the diurnal profile of HONO/NO2 ratio and that of HONO suggested that HONO was likely originated from NO2 242
heterogeneous reactions. 243
3.2 OH Simulation 244
Although atmosphere oxidation capacity is determined by the levels of all major oxidants in the atmosphere 245
(e.g., OH, O3, and NO3), OH radical is the primary oxidant in the atmosphere and series of reactions initiated by 246
OH radical can lead to the formation of other major secondary oxidants, such as O3 and NO3. Fully understanding 247
the budget of OH radical especially the sources of OH radical is of paramount importance for the purpose of 248
controlling the atmosphere oxidation capacity and hence to establish effective air pollution mitigation strategies. 249
In-situ measurement of OH radical is often limited by the availability of suitable measurement techniques, 250
which are often suffered from large amount of unresolved uncertainties (Tanner and Eisele, 1995) and the 251
observation often disagree with the modeling results to a large extent. Nevertheless, theoretically some critical 252
parameters to govern the OH radical budget in the atmosphere are difficult to measure directly, such as the 253
formation rates of OH. Accordingly, a box model is often utilized to simulate these highly reactive species to 254
investigate their photochemistry. 255
In order to assess the relative contributions of potential OH sources in this study, we have utilized a box model 256
based on the Master Chemical Mechanism (MCMv3.2) (Jenkin et al., 2012) to simulate the OH concentration and 257
the OH formation rates from various sources. The model simulation was constrained by the measurement results, 258
including HONO, O3, NO, NO2, CO, SO2, VOCs, as well as water vapor, temperature, pressure, and photolysis 259
frequencies. Since HCHO measurement was only available from 19 to 30 December, simulated HCHO was used 260
for the entire campaign period. We found that the ratio between simulated to measured HCHO was 1.4 with a 261
correlation coefficient of R2 = 0.6. Therefore, we applied a factor of 1.4 to the simulated HCHO in the model to 262
better represent the HCHO concentration in the atmosphere. 263
https://doi.org/10.5194/acp-2019-944Preprint. Discussion started: 9 December 2019c© Author(s) 2019. CC BY 4.0 License.
Page 13
13
The simulated OH time series during the campaign period is shown in Fig. 4. Because the simulation is 264
constrained by the observations, only within periods when all data are available simulation were conducted. 265
Simulated OH concentration was in the range of 1.06×10⁶ molecules cm-3 - 5.26×10⁶ molecules cm-3, similar to the 266
concentration observed in London (Emmerson et al., 2007), but lower than that measured in New York City (3×10⁶-267
3.3×10⁷) (Ren et al., 2003) and Guangzhou (1.5×10⁷-2.6×10⁷) (Lu et al., 2012). 268
It should be noted that the absolute values of the simulated OH may differ from the actual ambient 269
concentration. However, the general trend of OH evidently followed the solar radiation intensity, indicating its 270
photochemical production origin. Clearly, the diurnal variation of OH profile is more complicated than that of 271
photolysis rates becasue OH production can be affected not only by photochemical processes, but also by both 272
primary emissions (e.g., HONO and HCHO) and other non-photochemical related heterogenous processes, such as 273
HONO production on various surfaces and ozonolysis of alkenes. These processes will be further discussed in the 274
following sections. 275
3.3 OH Formation Rates 276
()*(,-.-)
012= 4(,-.-)[,-.-] − 8
)*9:)[.-][-,] (3) 277
()*(-
;) = 24(-
>?)[-
;]∅
)* (4) 278
()*(,A,-) = 24(,A,-)[,A,-] (5) 279
()*(,
B-B) = 24(,
B-B)[,
B-B] (6) 280
()*(-
;+ DE8FGFH) = 8
IJK101(L)9);[DE8FGF(M)][-,]N
)*_L (7) 281
Previous field studies have demonstrated that HONO photolysis can contribute substantially to the OH 282
production during daytime (Elshorbany et al., 2009; Hendrick et al., 2014; Kleffmann et al., 2005; Su et al., 2008). 283
In this study, we evaluated the OH formation rates from the photolysis of HONO (Eq. 3), ozone (Eq. 4), 284
formaldehyde (Eq. 5) and hydrogen peroxide (H2O2) (Eq. 6), as well as ozonolysis of alkenes (Eq. 7). The second 285
https://doi.org/10.5194/acp-2019-944Preprint. Discussion started: 9 December 2019c© Author(s) 2019. CC BY 4.0 License.
Page 14
14
term in Eq. 3 is to account for the loss of OH due to the HONO formation from OH + NO, where the OH 286
concentration was simulated using the box model, so that the net OH formation from the photolysis of HONO is 287
considered. J values are the photolysis frequencies of the corresponding species and fOH is the fraction of O(1D) 288
reacts with H2O instead of being quenched by nitrogen (N2) or oxygen (O2). The OH production by the photolysis 289
of formaldehyde was calculated assuming that HO2 formed from reaction R4 was immediately converted into OH 290
by reaction R8 due to high NO levels in this polluted environment. In Eq. 7, YOH_i is the yield of OH from gas-291
phase reaction of O3 and alkene(i) and 8IPQRSR(T)9)U
is the reaction rate constant for the reaction of O3 with alkene(i). 292
The rate constants of the ozonolysis reactions and the corresponding OH yields used in this work are listed in Table 293
2. Since H2O2 was not measured during this campaign, H2O2 was estimated from literature values, i.e., 0.5 ppbv - 294
5 ppbv (Guo et al., 2014; Hua et al., 2008; Ren et al., 2009) and a constant of 3 ppbv H2O2 was used in this work. 295
The calculated campaign averaged OH production rates from the photolysis of HONO, O3, HCHO and H2O2 296
along with ozonolysis of alkenes were 7.13×10⁶ molecules cm-3 s-1, 2.46×10⁶ molecules cm-3 s-1, 1.60×10⁶ 297
molecules cm-3 s-1, 2.39×10⁵ molecules cm-3 s-1 and 3.94×10⁶ molecules cm-3 s-1, respectively, which were 298
comparable with the literature values (Alicke et al., 2002; Chan et al., 2017; Su et al., 2008). As shown in Fig. 5. 299
the contribution of HONO photolysis to OH production varied from 23.6% to 63.3% with a mean value of 44.8%. 300
The ozonolysis of ten highly reactive alkenes (listed in Table 2) by ozone was the second largest contributor to OH 301
radical and the contribution varied from 16.1% to 60.9% with a mean of 30.3%. The contribution of ozone 302
photolysis was in the range of 1.3% to 24.7% with a mean of 14.9%. The contribution of HCHO photolysis varied 303
between 0.9% and 12.5% with a mean of 8.1%, and the contribution of H2O2 photolysis was negligible with an 304
average contribution of 1.9%. The contributions from different OH sources in this study was similar to those found 305
in two wintertime studies. In a study conducted in New York City in winter 2004, it was found that 48% of the net 306
HOx production was from the HONO photolysis, 36% from the ozonolysis of alkenes, only 6% from the HCHO 307
photolysis, and 1% from the O3 photolysis (Ren et al., 2006). In another study conducted in London in winter 2000, 308
https://doi.org/10.5194/acp-2019-944Preprint. Discussion started: 9 December 2019c© Author(s) 2019. CC BY 4.0 License.
Page 15
15
62% of the OH production was found from the ozonolysis of alkenes, 35% from the HONO photolysis, only 6% 309
from the HCHO photolysis, and <1% from the O3 photolysis (Heard et al., 2004). 310
The striking features of the Fig. 5 is that HONO photolysis and ozonolysis of alkenes contributed more than 311
70% of the OH production rate on average. In the early morning, HONO photolysis was the dominant source of 312
OH and may boost the photochemistry right after sunrise. As O3 accumulated, alkene ozonolysis and O3 photolysis 313
became more and more important. The higher percentage of the HONO photolysis in this study is most likely 314
because of the higher concentrations of HONO observed in the study area and its sources will be further investigated 315
in the following sections. 316
3.4 Industrial Plumes 317
Industrial emissions are responsible for a large portion of the haze formation in China. With the 318
implementations of more and more strict mitigation strategies, primary emissions have been reduced substantially 319
in China. However, the observation site was located just ~5 km from the Nanjing industry park, one of the largest 320
industrial zones in the YRD region, which is populated with various heavy industry facilities, including steel mills, 321
power generation stations, and petrochemical refineries. Despite the great effort to reduce primary industrial 322
emissions from these facilities, industrial plumes have often been detected at the site, carrying fair amounts of NH3, 323
NOx, SO2, and VOCs (Ma et al., 2016; Zheng et al., 2015a). To investigate the effects of industrial emissions on 324
local and regional air quality and particularly the role of HONO on the transformation of primary emissions into 325
secondary air pollutants, we have paid special attention into the air masses originated from the industrial zone. 326
Figure 6 depicts the contribution fractions of OH production rates from HONO photolysis, alkene ozonolysis, O3 327
photolysis, HCHO photolysis, and H2O2 photolysis during two industrial plume events. The wind rose plots in Fig. 328
6 indicate that the origin of these air masses were all from the nearby industry zone. Unlike that depicted in Fig. 5, 329
during the two industry pollution events HONO photolysis along with ozonolysis of alkenes dominated the OH 330
https://doi.org/10.5194/acp-2019-944Preprint. Discussion started: 9 December 2019c© Author(s) 2019. CC BY 4.0 License.
Page 16
16
production throughout the day. This was most likely due to the high concentrations of NOx and VOC within the 331
industrial plumes. More interestingly, the average PM2.5 concentrations during the two events were 139 and 239 µg 332
m-3, respectively. Evidently, HONO photolysis and ozonolysis may even play a more important role in OH 333
production during severe haze events. Although ambient OH concentrations during these events may not be high 334
(see Fig. 4a), the high levels of HONO can boost active photochemical oxidation and thus promote the formation 335
of PM2.5, which in turn provides additional reaction surface for more HONO production. To further test this 336
hypothesis, we have investigated the HONO budgets in much details in the next section. 337
3.5 HONO Sources 338
3.5.1 Primary HONO Emissions 339
Previous studies have demonstrated that HONO can be emitted directly from vehicle exhaust (Kirchstetter et 340
al., 1996; Kurtenbach et al., 2001). To evaluate the potential impact of primary emissions on HONO concentration 341
in this work, we have calculated the contribution of primary HONO using reported HONO emission ratios, a typical 342
value of 0.8% (Kurtenbach et al., 2001) was adopted to represent the mixed Chinese vehicle fleet and accordingly 343
the fresh emitted HONO was found accounting for a maximum of 26% of the total HONO within the freshly 344
emitted plumes without consideration of dilution after they were emitted. Nevertheless, the NO/NOx ratio measured 345
in this work was relatively low, with an average of 0.25±0.06, much less than that of freshly emitted exhausts (> 346
0.9) obtained from tunnel experiments (Kurtenbach et al., 2001), indicating that the air masses sampled in this work 347
had been considerably aged and mixed with other air masses, and hence primary HONO (if there was any) had 348
been diluted substantially (less than a few per cents) before reaching the observation site. In addition, our sampling 349
site is located nearby the industrial zone, and the high concentration of NOx was mainly originated from the 350
industrial activities, so the influence of traffic source on HONO was expected to be negligible. 351
https://doi.org/10.5194/acp-2019-944Preprint. Discussion started: 9 December 2019c© Author(s) 2019. CC BY 4.0 License.
Page 17
17
3.5.2 HONO Conversion Rate 352
The HONO conversion rate k(het) (hr-1) is an important parameter to compare HONO formation under various 353
NO2 levels (Xu et al., 2015). In this work, we calculate the HONO conversion rate using the Eq. (8) (Alicke et al., 354
2003): 355
k(het) =
[*):)]Z[\[*):)]Z]
2[\2] [:)[]
(8) 356
where [HONO]t1 and [HONO]t2 are the HONO concentrations at two different times, t1 and t2, respectively, [NO2] 357
is the average NO2 concentration between time t1 and t2. Note Eq. (8) is a simplified demonstration to calculate the 358
reaction rate coefficient of the heterogeneous conversion from NO2 to HONO at night, which can be dependent on 359
different pollution levels. In this study, the averaged k(het) was determined to be ~0.9% hr-1, which was comparable 360
to the results in the urban sites of Xi’an (0.91% hr-1) (Huang et al., 2017) and Shanghai (0.7% hr-1), China (Wang 361
et al., 2013), but much less than some other observations, such as Back Garden, Guangdong, China (2.4% hr-1) (Li 362
et al., 2012), Xinken, Guangdong, China (1.6% hr-1) (Li et al., 2012) and Rossfeld, Rhine Valley, France (2.2% hr-363
1) (Acker and Möller, 2007). Nevertheless, the high level of NOx observed in this work may still lead to high level 364
of HONO through various mechanisms. 365
3.5.3 Heterogeneous Conversion of NO2 366
Previous studies have suggested that heterogeneous conversion of NO2 on wet surfaces could be an important 367
nocturnal HONO source (Finlayson-Pitts et al., 2003; Wang et al., 2017). However, it appeares that the proposed 368
reaction mechanism (2NO2 + H2O) was limited by the uptake of NO2 on the wet surfaces (on the order of 10-6) and 369
thus was too slow to account for the observed NO2 to HONO conversion ratio (Kleffmann et al., 1998). Instead, 370
the reaction between NO2 and adsorbed semi-volatile organic compounds on soot or aerosol surfaces has been 371
suggested to be one or two magnitudes faster than the aforementioned reaction (George et al., 2005; Gutzwiller et 372
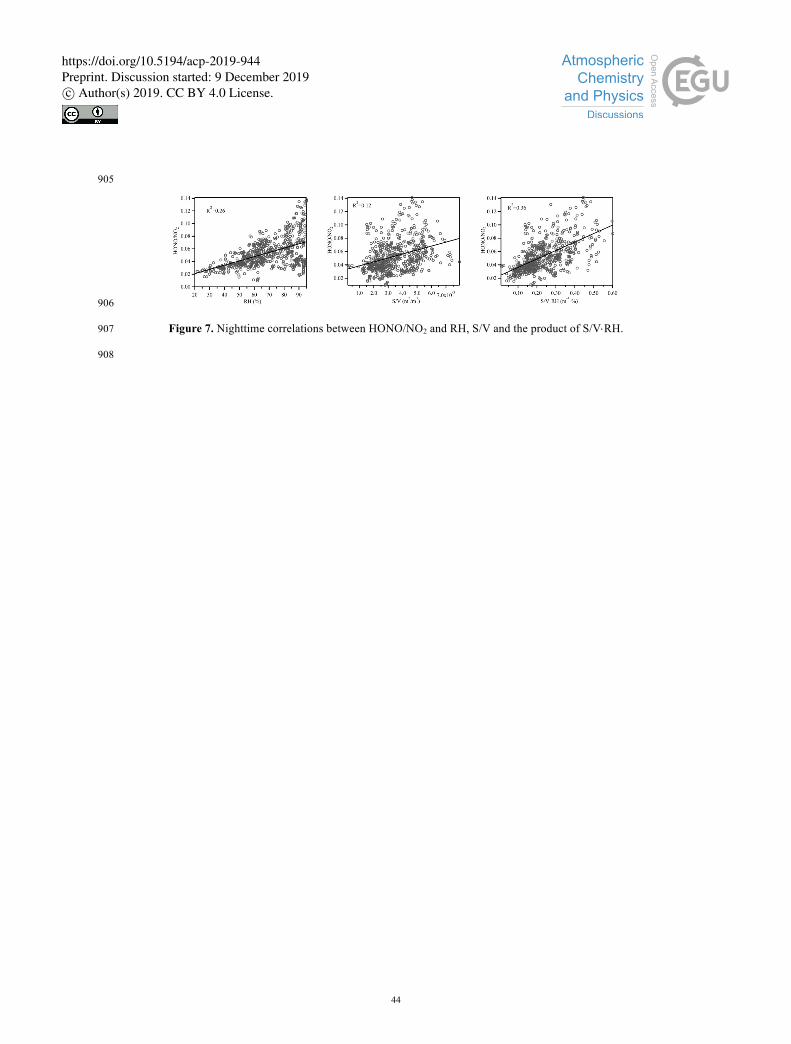
al., 2002) even though the actual reaction mechanism is still under active research. Figure 7 shows the correlation 373
https://doi.org/10.5194/acp-2019-944Preprint. Discussion started: 9 December 2019c© Author(s) 2019. CC BY 4.0 License.
Page 18
18
analyses for several individual days between HONO/NO2 and RH, S/V, and the product of RH×S/V. For instance, 374
on 25 December 2015, HONO correlated with RH (R2 = 0.63) and S/V (R2 = 0.70) to some extent. However, the 375
correlations between HONO/NO2 and the products of RH×S/V (R2 = 0.77) was substantially improved, which was 376
consistent with the participation of water in heterogeneous HONO formation during nighttime, particularly on the 377
aerosol surfaces. These results were generally in line with the results of Stutz et al. (2004). It also should be noted 378
that during nighttime as ambient temperature decreased, PBL also decreased, causing the ground surface to air 379
volume ratio to increase, which may also contribute to higher NO2 to HONO conversion efficiency (Stutz et al., 380
2004). However, as shown in Fig. 7, HONO/NO2 correlated with S/V to some extent and the correlation increased 381
with the product of RH and S/V. Therefore, even though the contribution of HONO formation on the ground surface 382
was present, the aerosol surface was certainly involved in the HONO formation process. The impact of RH on the 383
heterogeneous formation of HONO was further investigated. Figure 8 shows the relationship between HONO/NO2 384
ratio and RH at night. The linearity of the bin points clearly displays the linear correlations between HONO 385
conversion ratio and RH. Following the method introduced by Stutz et al. (2004), we plotted the top-5 values of 386
HONO/NO2 ratio (representing steady state conditions) in each 10% RH interval. The conversion efficiency of 387
NO2 to HONO correlates very well with RH (R2=0.96), strongly indicating the dependence of HONO formation 388
on RH. Similar phenomenon was also observed at an urban site (Qin et al., 2009) and a rural site (Li et al., 2012) 389
in Guangzhou, China. 390
3.5.4 Daytime HONO Budget 391
High concentrations of daytime HONO were frequently observed during the campaign period especially 392
within industrial plumes. If we assume HONO was in photostationary state involving only gas-phase homogeneous 393
HONO production and photolysis loss, the calculated daytime HONO concentration would be 8.1´109 molecules 394
cm-3, only 24.5% of the observed mean HONO concentration during daytime. Since the gas phase reaction between 395
https://doi.org/10.5194/acp-2019-944Preprint. Discussion started: 9 December 2019c© Author(s) 2019. CC BY 4.0 License.
Page 19
19
OH and NO (i.e., POH+NO) alone was unable to explain the observed high HONO concentrations, daytime HONO 396
budget was further examined in details. Here we designate the unexplained HONO source as Punknown. The timely 397
variation of measured HONO concentration can be expressed by the following equation (Wang et al., 2017): 398
^[*):)]
^2
= ()*9:)
+ (_0K0`a0
− (b)*9*):)
+ bcd`2`JefLf
+ bg1c`fL2L`0
) 399
(9) 400
Thus, Punknown can be calculated as: 401
(_0K0`a0
=^ *):)
^2
+ b)*9*):)
+ bcd`2`JefLf
+ bg1c`fL2L`0
− ()*9:)
402
=^ *):)
^2
+ 8)*9*):)
-, ,-.- + 4*):)
,-.- +hijkj
*
,-.- − 8)*9:)
[-,][.-]403
(10) 404
where represents the variation of observed HONO concentrations; Lphotolysis represents the loss rate 405
of HONO by photolysis and JHONO is the measured photolysis frequency of HONO; PNO+OH and LOH+HONO are the 406
gas-phase formation and loss rates of HONO, respectively; kOH+NO and kOH+HONO are the corresponding reaction 407
rate constants; Ldeposition is the dry deposition rate of HONO; l*):)
represents deposition velocity of HONO and 408
H is the mixing height. For l*):)
, a value of 0.48 cm s-1 was adopted (Lee et al., 2016) and the observed mixing 409
height varied from 73 m to 600 m diurnally. A sensitivity analysis with and without the HONO deposition shows 410
that the modeled HONO concentration with HONO deposition loss is 3.5% lower than that without HONO 411
deposition during daytime, indicating that the dry deposition of HONO plays a minor role in HONO losses. The 412
impact of HONO direct emissions was not considered at daytime, since this term is expected to be several orders 413
of magnitude smaller than Lphotolysis (Su et al., 2008). Daytime OH concentration was not measured in this work but 414
was simulated by the MCM box model. 415
Figure 9 shows the average diurnal variation of each individual term in Eq. (10). Compared with Lphotolysis, the 416
gas-phase reaction between OH and HONO and HONO dry deposition contributed very little to the HONO sink 417
during daytime. However, POH+NO and Punknown both contributed significantly to the HONO production and displayed 418
[ ] /HONO t¶ 
https://doi.org/10.5194/acp-2019-944Preprint. Discussion started: 9 December 2019c© Author(s) 2019. CC BY 4.0 License.
Page 20
20
a completely distinct diurnal pattern. Homogeneous reaction between OH and NO reached a maximum of 1.06 419
ppbv hr-1 in the early morning (09:00 LT) due to high concentrations of NO in the morning. The unknown source 420
reached a maximum of 1.46 ppbv hr-1 around noontime with an average of 0.97 ppbv hr-1, which was about twice 421
as much as averaged POH+NO. The diurnal profile of Punknown showed a strong photo-enhanced feature, which is 422
consistent with that observed by Michoud et al. (2014) in wintertime Europe. 423
3.5.5 Photo-Enhanced Conversion of NO2424
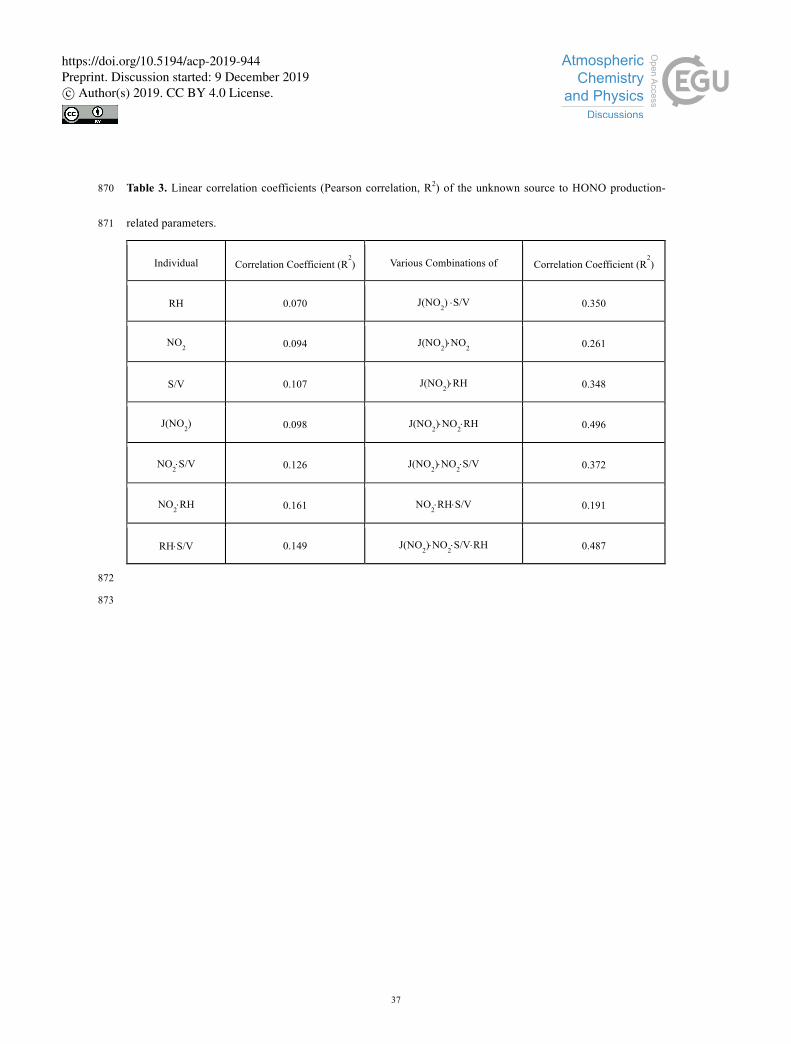
The nature of the unknown source was explored by correlation analyses between Punknown and other HONO 425
production related parameters (see Table 3). Punknown does not correlate well with RH, NO2, S/V, and JNO2 with the 426
correlation coefficients (R2) of 0.070, 0.094, 0.107, and 0.098 respectively. The correlation increased only slightly 427
when heterogeneous conversion of NO2 (NO2×RH, R2 = 0.161) was taken into consideration. It appeared that the 428
unknown HONO sources cannot be well explained by the heterogeneous reactions on wet surfaces alone. Previous 429
studies have suggested that light intensity could be an important parameter influencing the heterogeneous 430
conversion of NO2 to HONO (Han et al., 2017b; Lee et al., 2016). The photo-enhanced HONO source during the 431
daytime has also been identified in different environments ranging from remote (Villena et al., 2011; Zhou et al., 432
2002) to urban conditions (Lee et al., 2016). When photo-enhancement was also considered (JNO2×NO2×RH, R2 = 433
0.496), a significantly better correlation was achieved (Table 3). This suggests that the photosensitized reaction of 434
NO2 on wet surfaces may be an important source of HONO during daytime. Thus, the improvement in the 435
correlation between HONO and other parameters indicates that photochemistry might indeed play an important 436
role in daytime HONO formation (George et al., 2005; Stemmler et al., 2006). Since the correlation coefficient 437
between Punknow and JNO2×NO2×RH is comparable with the value between Punknow and JNO2×NO2×S/V×RH (R2 =0.487), 438
either ground or aerosol surfaces can be the dominant reaction site for photosensitized conversion of NO2. 439
https://doi.org/10.5194/acp-2019-944Preprint. Discussion started: 9 December 2019c© Author(s) 2019. CC BY 4.0 License.
Page 21
21
3.5.6 Model Simulation of HONO 440
The relative contributions of potential HONO sources were assessed by a box model based on the Master 441
Chemical Mechanism (MCMv3.2) (Jenkin et al., 2012). In addition to the homogeneous reaction of NO with OH, 442
four sources of HONO were included, i.e., heterogeneous HONO formation from NO2 reaction on aerosol surface 443
and ground surface and light-induced conversion of NO2 on aerosols and ground surface. Dry deposition of HONO 444
was also considered and a deposition velocity of 0.48 cm s-1 was used here (Lee et al., 2016). 445
Most laboratory studies suggest that the heterogeneous reaction on surface leading to HONO is proportional 446
to the first order of NO2 (Finlayson-Pitts and Pitts, 1999), therefore the HONO formation can be represented by the 447
following reactions (Li et al., 2010): 448
NO2Km
HONO, (11) 449
NO2K&
HONO, (12) 450
where ka and kg are the first-order rate constants for aerosol and ground surface reactions, respectively. For the 451
heterogeneous reaction on aerosols, the first order rate constant was estimated as: 452
8I=
gkj[,mopqrq"
h(s/u)
v
(13) 453
where l is the root mean square (RMS) velocity of NO2, S/V is the aerosol surface area-to-volume ratio and 454
gNO2,aerosol is the reactive uptake coefficient on the aerosol surface, with a value of 1×10⁻⁶ under dark conditions 455
(Aumont et al., 2003; Li et al., 2010). Under sunlight, however, significant enhancement of NO2 conversion to 456
HONO has been found for various types of aerosol surfaces, such as humic acid and similar organic materials 457
(Stemmler et al., 2007), soot (Monge et al., 2010), and mineral dusts (Ndour et al., 2008). To account for the 458
photoenhancement, a higher value of uptake coefficient (2×10⁻⁵) was used for solar radiation less than 400 W m-2 459
and an uptake coefficient scaled by (light intensity)/400 for solar radiation larger than 400 W m−2 as suggested by 460
Li et al. (2010). Accordingly, in this work the photoenhanced uptake coefficient was taken as 2×10⁻⁵ around the 461
https://doi.org/10.5194/acp-2019-944Preprint. Discussion started: 9 December 2019c© Author(s) 2019. CC BY 4.0 License.
Page 22
22
morning hours (~9 AM) and was scaled by the measured photolysis rate of NO2, i.e., (JNO2)/ 2×10⁻³ for JNO2 higher 462
than 2×10⁻³ (the value of JNO2 at ~9AM). 463
8w=
ux,kj[
B*
(14) 464
yg,:)B
=
gkj[,&pqz{x
h
v.B
(15) 465
Equation (14) was used to denote the heterogeneous reactions on the ground surfaces, where Vd,NO2 represents 466
deposition velocity of NO2; H is the PBL height; and gNO2,ground is the reactive uptake coefficient on the ground. 467
Here we assume an NO2 reactive uptake coefficient of 1×10⁻⁵ (Trick, 2004) in the dark on ground surfaces with a 468
yield of 50% and increase it to 2×10⁻⁵ in the daytime, given that the photosensitized reactivity of NO2 on the ground 469
surface is the same as on the aerosol surface. The observed boundary layer height varied from 73 m to 600 m 470
diurnally. The same scale factor ((JNO2)/ 2×10⁻³) was also applied to the daytime ground surface reactions. 471
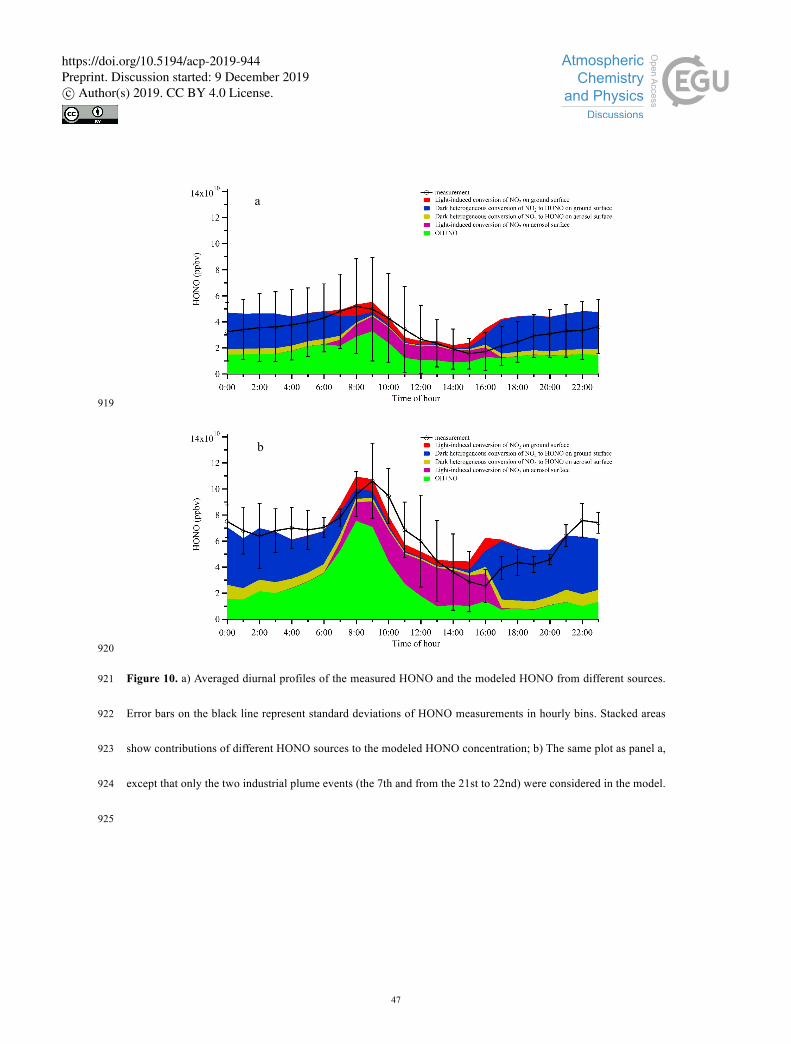
Figure 10a shows the averaged diurnal profiles of the measured HONO concentration and the simulated 472
HONO concentrations from different sources. In general, the box model can capture the observed HONO trend 473
with very similar magnitude of concentration, with a modeled-to-observed HONO ratio of 1.16 during the day and 474
1.40 at night. In early morning, ground surface appeared to play an important role in HONO heterogeneous 475
production while the PBL was still relatively shallow. However, after ~9:00, despite of the swift developing of PBL, 476
fine particle loading started increasing substantially (as shown in Fig. 3), indicating strong secondary formation. 477
Meanwhile, HONO production on aerosol surfaces also increased moderately. We found that higher daytime values 478
were mostly due to the light-induced conversion of NO2 on aerosol surfaces in addition to the homogeneous reaction 479
of NO with OH. While at night, heterogeneous HONO production on ground surface dominated nocturnal HONO 480
sources and the nighttime aerosol surfaces only contributed slightly to the total nighttime HONO. The box model 481
tended to under-predict HONO during daytime, which also led to an ~1-hr delay in the peaking time of the simulated 482
HONO. The most likely reason for these disagreements is due to the fact that heterogeneous conversion of NO2 on 483
various surfaces is too complicated to be fully represented by a single scaling parameter in a linear form. 484
https://doi.org/10.5194/acp-2019-944Preprint. Discussion started: 9 December 2019c© Author(s) 2019. CC BY 4.0 License.
Page 23
23
Nevertheless, the general agreement between observation and simulation in this work demonstrated that photo-485
induced NO2 conversion on aerosol surfaces was the most important HONO source in the study area during daytime. 486
A Monte Carlo sensitivity analysis was also conducted to assess the model simulation uncertainty of HONO 487
concentration. For each of the 24 hours, 100 independent runs were performed. The Monte Carlo sensitivity 488
analysis show that the model uncertainty of HONO ranged from ±15% to ±37%. The sensitivity analysis reinforced 489
the conclusions that the proposed heterogeneous sources can generally capture the observed HONO trend. 490
To investigate the interaction between HONO chemistry and secondary aerosol formations within industrial 491
plumes, we have simulated HONO within the two industrial plume events (see Fig. 6). The results are shown in 492
Fig. 10b. Clearly, HONO was much higher within the industrial plumes comparing to the campaign average (Fig. 493
10a). In addition, aerosol surfaces were the most important HONO source during daytime (7:00 AM - 5:00 PM), 494
especially in the afternoon. Within the industrial plumes, aerosol surfaces contributed around 45% of the observed 495
daytime HONO and only about 11% of total HONO was from the ground surfaces. The fact that ground surfaces 496
were less important during daytime than nighttime was most likely due to the much higher daytime PBL, causing 497
substantial dilution of HONO formed on the ground surfaces. Meanwhile, secondary particulate matters were 498
rapidly produced within the PBL, providing additional heterogeneous reaction sites for HONO formation as a 499
strong OH source to further promote atmospheric oxidative capacity. It should be noted that the reactive uptake of 500
NO2 on various surfaces can be highly variable with the type of surfaces. The value used here (~2×10⁻⁵) is toward 501
the lower end of values reported in the literatures, which is likely the reason that the simulated HONO is generally 502
less than the observations within industrial plumes. The heterogeneous NO2 uptake kinetics and HONO yields of 503
real atmospheric substrates are still under active study and may be different compared to the artificial surfaces 504
studied in the laboratory setting. Nevertheless, enhanced photosensitized conversion of NO2 on aerosol surfaces is 505
demonstrated here as a major HONO source in the plumes influenced by industrial emissions. 506
507
https://doi.org/10.5194/acp-2019-944Preprint. Discussion started: 9 December 2019c© Author(s) 2019. CC BY 4.0 License.
Page 24
24
4 Conclusions 508
Nitrous acid was measured with a custom-built wet-chemistry based HONO analyzer, together with other 509
atmospheric OH precursors (O3 and HCHO) at a suburb site of Nanjing in December 2015. The mixing ratios of 510
HONO varied from 0.03 ppbv to 7.04 ppbv with an average of 1.32 ± 0.92 ppbv. Daytime HONO was sustained at 511
a relatively high concentration, with a minimum diurnal hourly average of ~0.6 ppbv observed around 16:00 LT. A 512
MCM-box model was used to investigate the HONO chemistry and its impact on atmospheric oxidation capacity 513
in the study area. The results show that the average OH production rates from the photolysis of HONO, ozonolysis 514
of alkenes, photolysis of O3, HCHO, and H2O2 were 7.13×10⁶ molecules cm-3 s-1, 3.94×10⁶ molecules cm-3 s-1, 515
2.46×10⁶ molecules cm-3 s-1, 1.60×10⁶ molecules cm-3 s-1 and 2.39×10⁵ molecules cm-3 s-1 , respectively. The box 516
model results show that the average total OH production rate was 1.54×10⁷ molecules cm-3 s-1 during daytime, on 517
average about 45% from the photolysis of HONO, 30% from ozonolysis of alkenes, 15% from the photolysis of 518
O3, 8% form the photolysis of HCHO and 2% from the photolysis of H2O2. 519
Elevated daytime HONO evidently played an important role in sustaining the atmospheric oxidative capability 520
in the study area, which cannot be explained by the typical OH+NO homogeneous formation mechanism. The 521
observed similarity between the diurnal profiles of HONO/NO2 ratio and HONO strongly suggests that HONO was 522
most likely originated from NO2 heterogeneous reactions. In this study, the averaged NO2 to HONO conversion 523
rate was determined to be ~0.9% hr-1. Good correlation between nocturnal HONO/NO2 and the products of S/V×RH 524
supports the heterogeneous NO2/H2O reaction mechanism. 525
To fully assess the HONO chemistry in the study area, an MCM box model was developed to examine HONO 526
budget. In general, the box model can capture the observed HONO trend with a modeled-to-observed HONO ratio 527
of 1.16 during the day and 1.40 at night. The model suggests that higher daytime levels of HONO were mainly 528
produced by the light-induced conversion of NO2 on aerosol surfaces (except early morning), while the 529
https://doi.org/10.5194/acp-2019-944Preprint. Discussion started: 9 December 2019c© Author(s) 2019. CC BY 4.0 License.
Page 25
25
heterogeneous HONO production on ground surface dominated nocturnal HONO sources. The box model tends to 530
over-predict HONO at night. The most possible reason for these discrepancies is due to the fact that heterogeneous 531
conversion of NO2 on various surfaces was too complicated to be fully represented by a single scaling parameter 532
in a linear form. Nevertheless, the general agreement between observation and simulation in this work reiterated 533
that photo-induced NO2 conversion on ground and aerosol surfaces was the most important HONO source in the 534
study area. In the industrial plume case study, it was demonstrated that heterogeneous photosensitized conversion 535
of NO2 on aerosol surfaces was particularly intensified, when rapid growth of secondary particulate matters was 536
simultaneously observed. Our results indicate that the heterogeneous photosensitized conversion of NO2 on aerosol 537
surfaces becomes the largest HONO source throughout the daytime, which in turn can enhance OH production, 538
increase the oxidative capacity of atmosphere, and further strengthen the formation of SOA during the daytime in 539
this environment. 540
541
Author contributions 542
JZ, YM, and XR designed the experiments, and XS, HJ, YG, WW, YZ, WZ, and YD carried out the field 543
measurements and data analysis. XS and XR performed the MCM box model simulation. JZ, XS, and YM prepared 544
the manuscript with comments from all coauthors. 545
Acknowledgements 546
This work was supported by the National Natural Science Foundation of China (Grant numbers 41575122, 547
41675126, and 41730106) and the National Key Research and Development Project (Grant number 548
2017YFC0209502 and 2016YFC0202401). The data used here are listed in the tables, figures, and the supporting 549
materials. 550
551
References 552
https://doi.org/10.5194/acp-2019-944Preprint. Discussion started: 9 December 2019c© Author(s) 2019. CC BY 4.0 License.
Page 26
26
Acker, K., Möller, D., Wieprecht, W., Meixner, F. X., Bohn, B., Gilge, S., Plass-Dülmer, C., and Berresheim, H.: 553
Strong daytime production of OH from HNO2 at a rural mountain site, Geophys. Res. Letts., 33, L02809, 554
10.1029/2005GL024643, 2006. 555
Acker, K., and Möller, D.: Atmospheric variation of nitrous acid at different sites in Europe, Environ. Chem., 4, 556
242-255, https://doi.org/10.1071/EN07023, 2007. 557
Alicke, B., Platt, U., and Stutz, J.: Impact of nitrous acid photolysis on the total hydroxyl radical budget during the 558
Limitation of Oxidant Production/Pianura Padana Produzione di Ozono study in Milan, J. Geophys. Res. Atmos., 559 107, 8196, 10.1029/2000JD000075, 2002. 560
Alicke, B., Geyer, A., Hofzumahaus, A., Holland, F., Konrad, S., Patz, H. W., Schafer, J., Stutz, J., Volz-Thomas, 561
A., and Platt, U.: OH formation by HONO photolysis during the BERLIOZ experiment, J. Geophys. Res. Atmos., 562
108, 17, 8247 563
10.1029/2001jd000579, 2003. 564
Ammann, M., Kalberer, M., Jost, D. T., Tobler, L., Rossler, E., Piguet, D., Gaggeler, H. W., and Baltensperger, U.: 565
Heterogeneous production of nitrous acid on soot in polluted air masses, Nature, 395, 157-160, 10.1038/25965, 566
1998. 567
Atkinson, R., and Arey, J.: Atmospheric degradation of volatile organic compounds, Chem. Rev., 103, 4605-4638, 568
10.1021/cr0206420, 2003. 569
Aumont, B., Chervier, F., and Laval, S.: Contribution of HONO sources to the NOx/HOx/O3 chemistry in the 570
polluted boundary layer, Atmos. Environ., 37, 487-498, https://doi.org/10.1016/S1352-2310(02)00920-2, 2003. 571
Bernard, F., Cazaunau, M., Grosselin, B., Zhou, B., Zheng, J., Liang, P., Zhang, Y., Ye, X., Daele, V., Mu, Y., Zhang, 572
R., Chen, J., and Mellouki, A.: Measurements of nitrous acid (HONO) in urban area of Shanghai, China, 573
Environmental science and pollution research international, 23, 5818-5829, 10.1007/s11356-015-5797-4, 2016. 574
Chan, K. L., Wang, S., Liu, C., Zhou, B., Wenig, M. O., and Saiz-Lopez, A.: On the summertime air quality and 575
related photochemical processes in the megacity Shanghai, China, Sci. Total Environ., 580, 974-983, 576
https://doi.org/10.1016/j.scitotenv.2016.12.052, 2017. 577
Czader, B. H., Rappenglück, B., Percell, P., Byun, D. W., Ngan, F., and Kim, S.: Modeling nitrous acid and its 578
impact on ozone and hydroxyl radical during the Texas Air Quality Study 2006, Atmos. Chem. Phys., 12, 6939-579
6951, 10.5194/acp-12-6939-2012, 2012. 580
Ding, A. J., Fu, C. B., Yang, X. Q., Sun, J. N., Zheng, L. F., Xie, Y. N., Herrmann, E., Nie, W., Petäjä, T., Kerminen, 581
V. M., and Kulmala, M.: Ozone and fine particle in the western Yangtze River Delta: an overview of 1 yr data at 582
the SORPES station, Atmos. Chem. Phys., 13, 5813-5830, 10.5194/acp-13-5813-2013, 2013. 583
Elshorbany, Y. F., Kurtenbach, R., Wiesen, P., Lissi, E., Rubio, M., Villena, G., Gramsch, E., Rickard, A. R., Pilling, 584
M. J., and Kleffmann, J.: Oxidation capacity of the city air of Santiago, Chile, Atmos. Chem. Phys., 9, 2257-2273, 585
10.5194/acp-9-2257-2009, 2009. 586
Elshorbany, Y. F., Kleffmann, J., Kurtenbach, R., Lissi, E., Rubio, M., Villena, G., Gramsch, E., Rickard, A. R., 587
Pilling, M. J., and Wiesen, P.: Seasonal dependence of the oxidation capacity of the city of Santiago de Chile, 588
Atmos. Environ., 44, 5383-5394, 10.1016/j.atmosenv.2009.08.036, 2010. 589
https://doi.org/10.5194/acp-2019-944Preprint. Discussion started: 9 December 2019c© Author(s) 2019. CC BY 4.0 License.
Page 27
27
Elshorbany, Y. F., Steil, B., Brühl, C., and Lelieveld, J.: Impact of HONO on global atmospheric chemistry 590
calculated with an empirical parameterization in the EMAC model, Atmos. Chem. Phys., 12, 9977-10000, 591
10.5194/acp-12-9977-2012, 2012. 592
Emmerson, K. M., Carslaw, N., Carslaw, D. C., Lee, J. D., McFiggans, G., Bloss, W. J., Gravestock, T., Heard, D. 593
E., Hopkins, J., Ingham, T., Pilling, M. J., Smith, S. C., Jacob, M., and Monks, P. S.: Free radical modelling studies 594
during the UK TORCH Campaign in Summer 2003, Atmos. Chem. Phys., 7, 167–181, doi:10.5194/acp-7-167-595
2007, 2007. 596
Finlayson-Pitts, B. J., and Pitts, J. N.: Chemistry of the upper and lower atmosphere : theory, experiments and 597
applications, Academic Press, San Diego, Calif., xxii, 969 pp., 1999. 598
Finlayson-Pitts, B. J., Wingen, L. M., Sumner, A. L., Syomin, D., and Ramazan, K. A.: The heterogeneous 599
hydrolysis of NO2 in laboratory systems and in outdoor and indoor atmospheres: An integrated mechanism, PCCP, 600
5, 223-242, 10.1039/b208564j, 2003. 601
Gall, E. T., Griffin, R. J., Steiner, A. L., Dibb, J., Scheuer, E., Gong, L., Rutter, A. P., Cevik, B. K., Kim, S., Lefer, 602
B., and Flynn, J.: Evaluation of nitrous acid sources and sinks in urban outflow, Atmos. Environ., 127, 272-282, 603
10.1016/j.atmosenv.2015.12.044, 2016. 604
George, C., Strekowski, R. S., Kleffmann, J., Stemmler, K., and Ammann, M.: Photoenhanced uptake of gaseous 605
NO2 on solid organic compounds: a photochemical source of HONO?, Faraday Discuss., 130, 195-210, 606
10.1039/B417888M, 2005. 607
Gerecke, A., Thielmann, A., Gutzwiller, L., and Rossi, M. J.: The chemical kinetics of HONO formation resulting 608 from heterogeneous interaction of NO2 with flame soot, Geophys. Res. Letts., 25, 2453-2456, 10.1029/98GL01796, 609
1998. 610
Gherman, T., Venables, D. S., Vaughan, S., Orphal, J., and Ruth, A. A.: Incoherent Broadband Cavity-Enhanced 611
Absorption Spectroscopy in the near-Ultraviolet: Application to HONO and NO2, Environ. Sci. Technol., 42, 890-612
895, 10.1021/es0716913, 2008. 613
Guo, J., Tilgner, A., Yeung, C., Wang, Z., Louie, P. K. K., Luk, C. W. Y., Xu, Z., Yuan, C., Gao, Y., Poon, S., 614
Herrmann, H., Lee, S., Lam, K. S., and Wang, T.: Atmospheric Peroxides in a Polluted Subtropical Environment: 615
Seasonal Variation, Sources and Sinks, and Importance of Heterogeneous Processes, Environ. Sci. Technol., 48, 616
1443-1450, 10.1021/es403229x, 2014. 617
Gutzwiller, L., Arens, F., Baltensperger, U., Gäggeler, H. W., and Ammann, M.: Significance of Semivolatile Diesel 618
Exhaust Organics for Secondary HONO Formation, Environ. Sci. Technol., 36, 677-682, 10.1021/es015673b, 2002. 619
Han, C., Liu, Y., and He, H.: Heterogeneous reaction of NO2 with soot at different relative humidity., Environmental 620 Science and Pollution Research, 24, 21248–21255, 10.1007/s11356-017-9766-y, 2017a. 621
Han, C., Yang, W., Yang, H., and Xue, X.: Enhanced photochemical conversion of NO2 to HONO on humic acids 622
in the presence of benzophenone, Environ. Pollut., 231, 979-986, https://doi.org/10.1016/j.envpol.2017.08.107, 623
2017b. 624
Heard, D. E., Carpenter, L. J., Creasey, D. J., Hopkins, J. R., Lee, J. D., Lewis, A. C., Pilling, M. J., Seakins, P. W., 625
Carslaw, N., and Emmerson, K. M.: High levels of the hydroxyl radical in the winter urban troposphere, Geophys. 626
https://doi.org/10.5194/acp-2019-944Preprint. Discussion started: 9 December 2019c© Author(s) 2019. CC BY 4.0 License.
Page 28
28
Res. Letts., 31, 10.1029/2004gl020544, 2004. 627
Heland, J., Kleffmann, J., Kurtenbach, R., and Wiesen, P.: A New Instrument To Measure Gaseous Nitrous Acid 628
(HONO) in the Atmosphere, Environ. Sci. Technol., 35, 3207-3212, 10.1021/es000303t, 2001. 629
Hendrick, F., Müller, J. F., Clémer, K., Wang, P., De Mazière, M., Fayt, C., Gielen, C., Hermans, C., Ma, J. Z., 630
Pinardi, G., Stavrakou, T., Vlemmix, T., and Van Roozendael, M.: Four years of ground-based MAX-DOAS 631
observations of HONO and NO2 in the Beijing area, Atmos. Chem. Phys., 14, 765-781, 10.5194/acp-14-765-2014, 632
2014. 633
Hofzumahaus, A., Rohrer, F., Lu, K., Bohn, B., Brauers, T., Chang, C. C., Fuchs, H., Holland, F., Kita, K., Kondo, 634
Y., Li, X., Lou, S., Shao, M., Zeng, L., Wahner, A., and Zhang, Y.: Amplified trace gas removal in the troposphere, 635
Science, 324, 1702-1704, 10.1126/science.1164566, 2009. 636
Hua, W., Chen, Z. M., Jie, C. Y., Kondo, Y., Hofzumahaus, A., Takegawa, N., Chang, C. C., Lu, K. D., Miyazaki, 637
Y., Kita, K., Wang, H. L., Zhang, Y. H., and Hu, M.: Atmospheric hydrogen peroxide and organic hydroperoxides 638
during PRIDE-PRD'06, China: their concentration, formation mechanism and contribution to secondary aerosols, 639
Atmos. Chem. Phys., 8, 6755-6773, 10.5194/acp-8-6755-2008, 2008. 640
Huang, G., Zhou, X., Deng, G., Qiao, H., and Civerolo, K.: Measurements of atmospheric nitrous acid and nitric 641
acid, Atmos. Environ., 36, 2225-2235, https://doi.org/10.1016/S1352-2310(02)00170-X, 2002. 642
Huang, R.-J., Yang, L., Cao, J., Wang, Q., Tie, X., Ho, K.-F., Shen, Z., Zhang, R., Li, G., Zhu, C., Zhang, N., Dai, 643
W., Zhou, J., Liu, S., Chen, Y., Chen, J., and O'Dowd, C. D.: Concentration and sources of atmospheric nitrous acid 644
(HONO) at an urban site in Western China, Sci. Total Environ., 593-594, 165-172, 645 https://doi.org/10.1016/j.scitotenv.2017.02.166, 2017. 646
Jenkin, M. E., Saunders, S. M., and Pilling, M. J.: The tropospheric degradation of volatile organic compounds: a 647
protocol for mechanism development, Atmos. Environ., 31, 81-104, http://dx.doi.org/10.1016/S1352-648
2310(96)00105-7, 1997. 649
Jenkin, M. E., Wyche, K. P., Evans, C. J., Carr, T., Monks, P. S., Alfarra, M. R., Barley, M. H., McFiggans, G. B., 650
Young, J. C., and Rickard, A. R.: Development and chamber evaluation of the MCM v3.2 degradation scheme for 651
β-caryophyllene, Atmos. Chem. Phys., 12, 5275-5308, 10.5194/acp-12-5275-2012, 2012. 652
Kirchstetter, T. W., Harley, A. R., and Littlejohn, D.: Measurement of nitrous acid in motor vehicle exhaust, Environ. 653
Sci. Technol., 30, 2843–2849, 10.1021/es960135y, 1996. 654
Kleffmann, J., Becker, K. H., and Wiesen, P.: Heterogeneous NO2 conversion processes on acid surfaces: possible 655
atmospheric implications, Atmos. Environ., 32, 2721-2729, https://doi.org/10.1016/S1352-2310(98)00065-X, 656
1998. 657
Kleffmann, J., Kurtenbach, R., Lörzer, J., Wiesen, P., Kalthoff, N., Vogel, B., and Vogel, H.: Measured and 658
simulated vertical profiles of nitrous acid-Part I: Field measurements, Atmos. Environ., 37, 2949-2955, 659
10.1016/s1352-2310(03)00242-5, 2003. 660
Kleffmann, J., Gavriloaiei, T., Hofzumahaus, A., Holland, F., Koppmann, R., Rupp, L., Schlosser, E., Siese, M., 661
and Wahner, A.: Daytime formation of nitrous acid: A major source of OH radicals in a forest, Geophys. Res. Letts., 662
32, L05818, 10.1029/2005GL022524, 2005. 663
https://doi.org/10.5194/acp-2019-944Preprint. Discussion started: 9 December 2019c© Author(s) 2019. CC BY 4.0 License.
Page 29
29
Kleffmann, J., Lörzer, J. C., Wiesen, P., Kern, C., Trick, S., Volkamer, R., Rodenas, M., and Wirtz, K.: 664
Intercomparison of the DOAS and LOPAP techniques for the detection of nitrous acid (HONO), Atmos. Environ., 665
40, 3640-3652, https://doi.org/10.1016/j.atmosenv.2006.03.027, 2006. 666
Kleffmann, J., and Wiesen, P.: Technical Note: Quantification of interferences of wet chemical HONO LOPAP 667
measurements under simulated polar conditions, Atmos. Chem. Phys., 8, 6813-6822, https://doi.org/10.5194/acp-668
8-6813-2008, 2008. 669
Kurtenbach, R., Becker, K. H., Gomes, J. A. G., Kleffmann, J., Lörzer, J. C., Spittler, M., Wiesen, P., Ackermann, 670 R., Geyer, A., and Platt, U.: Investigations of emissions and heterogeneous formation of HONO in a road traffic 671
tunnel, Atmos. Environ., 35, 3385-3394, https://doi.org/10.1016/S1352-2310(01)00138-8, 2001. 672
Lee, J. D., Whalley, L. K., Heard, D. E., Stone, D., Dunmore, R. E., Hamilton, J. F., Young, D. E., Allan, J. D., 673
Laufs, S., and Kleffmann, J.: Detailed budget analysis of HONO in central London reveals a missing daytime 674
source, Atmos. Chem. Phys., 16, 2747-2764, 10.5194/acp-16-2747-2016, 2016. 675
Li, G., Lei, W., Zavala, M., Volkamer, R., Dusanter, S., Stevens, P., and Molina, L. T.: Impacts of HONO sources 676
on the photochemistry in Mexico City during the MCMA-2006/MILAGO Campaign, Atmos. Chem. Phys., 10, 677
6551-6567, 10.5194/acp-10-6551-2010, 2010. 678
Li, X., Brauers, T., Haseler, R., Bohn, B., Fuchs, H., Hofzumahaus, A., Holland, F., Lou, S., Lu, K. D., Rohrer, F., 679
Hu, M., Zeng, L. M., Zhang, Y. H., Garland, R. M., Su, H., Nowak, A., Wiedensohler, A., Takegawa, N., Shao, M., 680
and Wahner, A.: Exploring the atmospheric chemistry of nitrous acid (HONO) at a rural site in Southern China, 681
Atmos. Chem. Phys., 12, 1497-1513, 10.5194/acp-12-1497-2012, 2012. 682
Liang, Y., Zha, Q., Wang, W., Cui, L., Lui, K. H., Ho, K. F., Wang, Z., Lee, S.-c., and Wang, T.: Revisiting nitrous 683
acid (HONO) emission from on-road vehicles: A tunnel study with a mixed fleet, J. Air Waste Manage., 67, 797-684
805, 10.1080/10962247.2017.1293573, 2017. 685
Lu, K. D., Rohrer, F., Holland, F., Fuchs, H., Bohn, B., Brauers, T., Chang, C. C., Häseler, R., Hu, M., Kita, K., 686
Kondo, Y., Li, X., Lou, S. R., Nehr, S., Shao, M., Zeng, L. M., Wahner, A., Zhang, Y. H., and Hofzumahaus, A.: 687
Observation and modelling of OH and HO2 concentrations in the Pearl River Delta 2006: a missing OH source in 688
a VOC rich atmosphere, Atmos. Chem. Phys., 12, 1541-1569, 10.5194/acp-12-1541-2012, 2012. 689
Ma, Y., Diao, Y., Zhang, B., Wang, W., Ren, X., Yang, D., Wang, M., Shi, X., and Zheng, J.: Detection of 690
formaldehyde emissions from an industrial zone in the Yangtze River Delta region of China using a proton transfer 691
reaction ion-drift chemical ionization mass spectrometer, Atmos. Meas. Tech., 9, 6101-6116, 10.5194/amt-9-6101-692
2016, 2016. 693
Makkonen, U., Virkkula, A., Mäntykenttä, J., Hakola, H., Keronen, P., Vakkari, V., and Aalto, P. P.: Semi-694 continuous gas and inorganic aerosol measurements at a Finnish urban site: comparisons with filters, nitrogen in 695
aerosol and gas phases, and aerosol acidity, Atmospheric Chemistry and Physics, 12, 5617-5631, 10.5194/acp-12-696
5617-2012, 2012. 697
Michoud, V., Colomb, A., Borbon, A., Miet, K., Beekmann, M., Camredon, M., Aumont, B., Perrier, S., Zapf, P., 698
Siour, G., Ait-Helal, W., Afif, C., Kukui, A., Furger, M., Dupont, J. C., Haeffelin, M., and Doussin, J. F.: Study of 699
the unknown HONO daytime source at a European suburban site during the MEGAPOLI summer and winter field 700
campaigns, Atmospheric Chemistry and Physics, 14, 2805-2822, 10.5194/acp-14-2805-2014, 2014. 701
https://doi.org/10.5194/acp-2019-944Preprint. Discussion started: 9 December 2019c© Author(s) 2019. CC BY 4.0 License.
Page 30
30
Monge, M. E., D'Anna, B., Mazri, L., Giroir-Fendler, A., Ammann, M., Donaldson, D. J., and George, C.: Light 702
changes the atmospheric reactivity of soot, Proc. Natl. Acad. Sci. USA, 107, 6605-6609, 10.1073/pnas.0908341107, 703
2010. 704
Müller, M., Anderson, B. E., Beyersdorf, A. J., Crawford, J. H., Diskin, G. S., Eichler, P., Fried, A., Keutsch, F. N., 705
Mikoviny, T., Thornhill, K. L., Walega, J. G., Weinheimer, A. J., Yang, M., Yokelson, R. J., and Wisthaler, A.: In 706
situ measurements and modeling of reactive trace gases in a small biomass burning plume, Atmos. Chem. Phys., 707
16, 3813-3824, 10.5194/acp-16-3813-2016, 2016. 708
Nakashima, Y., and Kajii, Y.: Determination of nitrous acid emission factors from a gasoline vehicle using a chassis 709
dynamometer combined with incoherent broadband cavity-enhanced absorption spectroscopy, Sci. Total Environ., 710
575, 287-293, https://doi.org/10.1016/j.scitotenv.2016.10.050, 2017. 711
Nash, T.: Nitrous acid in the atmosphere and laboratory experiments on its photolysis, Tellus, 26, 175-179, 712
10.3402/tellusa.v26i1-2.9768, 1974. 713
Ndour, M., D'Anna, B., George, C., Ka, O., Balkanski, Y., Kleffmann, J., Stemmler, K., and Ammann, M.: 714
Photoenhanced uptake of NO2 on mineral dust: Laboratory experiments and model simulations, Geophys. Res. 715
Letts., 35, L05812, 10.1029/2007gl032006, 2008. 716
Neftel, A., Blatter, A., Hesterberg, R., and Staffelbach, T.: Measurements of concentration gradients of HNO2 and 717
HNO3 over a semi-natural ecosystem Atmos. Environ., 30 (17), 3017-3025, 1996. 718
Neuman, J. A., Trainer, M., Brown, S. S., Min, K.-E., Nowak, J. B., Parrish, D. D., Peischl, J., Pollack, I. B., 719
Roberts, J. M., Ryerson, T. B., and Veres, P. R.: HONO emission and production determined from airborne 720 measurements over the Southeast U.S., J. Geophys. Res. Atmos., 121, 9237–9250, 10.1002/2016JD025197, 2016. 721
Nie, W., Ding, A. J., Xie, Y. N., Xu, Z., Mao, H., Kerminen, V. M., Zheng, L. F., Qi, X. M., Huang, X., Yang, X. 722
Q., Sun, J. N., Herrmann, E., Petaja, T., Kulmala, M., and Fu, C. B.: Influence of biomass burning plumes on 723
HONO chemistry in eastern China, Atmos. Chem. Phys., 15, 1147-1159, 10.5194/acp-15-1147-2015, 2015. 724
Perner, D., and Platt, U.: Detection of nitrous-acid in the atmosphere by differential optical-absorption, Geophys. 725
Res. Letts., 6, 917-920, 10.1029/GL006i012p00917, 1979. 726
Pinto, J. P., Dibb, J., Lee, B. H., Rappenglück, B., Wood, E. C., Levy, M., Zhang, R. Y., Lefer, B., Ren, X. R., Stutz, 727
J., Tsai, C., Ackermann, L., Golovko, J., Herndon, S. C., Oakes, M., Meng, Q. Y., Munger, J. W., Zahniser, M., and 728
Zheng, J.: Intercomparison of field measurements of nitrous acid (HONO) during the SHARP campaign, J. 729
Geophys. Res. Atmos., 119, 5583-5601, 10.1002/2013JD020287, 2014. 730
Platt, U., Perner, D., Harris, G. W., Winer, A. M., and Pitts Jr, J. N.: Observations of nitrous acid in an urban 731
atmosphere by differential optical absorption, Nature, 285, 312, 10.1038/285312a0, 1980. 732
Qin, M., Xie, P., Su, H., Gu, J., Peng, F., Li, S., Zeng, L., Liu, J., Liu, W., and Zhang, Y.: An observational study of 733
the HONO-NO2 coupling at an urban site in Guangzhou City, South China, Atmos. Environ., 43, 5731-5742, 734
https://doi.org/10.1016/j.atmosenv.2009.08.017, 2009. 735
Rairoux, P., Koch, B., Moller, D., Göritz, G., Warmbier, G., and Czyzewski, A.: Atmospheric traces monitoring 736
applying Cavity Ring-Down Spectroscopy, Environmental Science and Pollution Research, Special issue 4, 68-71, 737
2002. 738
https://doi.org/10.5194/acp-2019-944Preprint. Discussion started: 9 December 2019c© Author(s) 2019. CC BY 4.0 License.
Page 31
31
Ren, X., Brune, W. H., Mao, J., Mitchell, M. J., Lesher, R. L., Simpas, J. B., Metcalf, A. R., Schwab, J. J., Li, Y., 739
Demerjian, K. L., Felton, H. D., Boynton, G., Adams, A., Perry, J., He, Y., Zhou, X., and Hou, J.: Behavior of OH 740
and HO2 in the winter atmosphere in New York City: Observations and model comparison, Atmos. Environ., 40, 741
S252–S263, 10.1016/j.atmosenv.2005.11.073, 2006. 742
Ren, X., Gao, H., Zhou, X., Crounse, J. D., Wennberg, P. O., Browne, E. C., LaFranchi, B. W., Cohen, R. C., McKay, 743
M., Goldstein, A. H., and Mao, J.: Measurement of atmospheric nitrous acid at Blodgett Forest during 744
BEARPEX2007, Atmos. Chem. Phys., 10, 6283-6294, 10.5194/acp-10-6283-2010, 2010. 745
Ren, X. R., Harder, H., Martinez, M., Lesher, R. L., Oliger, A., Simpas, J. B., Brune, W. H., Schwab, J. J., Demerjian, 746
K. L., He, Y., Zhou, X. L., and Gao, H. G.: OH and HO2 chemistry in the urban atmosphere of New York City, 747
Atmos. Environ., 37, 3639-3651, 10.1016/s1352-2310(03)00459-x, 2003. 748
Ren, Y., Ding, A., Wang, T., Shen, X., Guo, J., Zhang, J., Wang, Y., Xu, P., Wang, X., and Gao, J.: Measurement of 749
gas-phase total peroxides at the summit of Mount Tai in China, Atmospheric Environment, 43, 1702-1711, 750
10.1016/j.atmosenv.2008.12.020, 2009. 751
Rickard, A. R., Johnson, D., McGill, C. D., and Marston, G.: OH Yields in the Gas-Phase Reactions of Ozone with 752
Alkenes, The Journal of Physical Chemistry A, 103, 7656-7664, 10.1021/jp9916992, 1999. 753
Rondon, A., and Sanhueza, E.: High HONO atmospheric concentrations during vegetation burning in the tropical 754
savannah, Tellus B: Chemical and Physical Meteorology, 41, 474-477, 10.3402/tellusb.v41i4.15102, 1989. 755
Salmon, O. E., Shepson, P. B., Ren, X., He, H., Hall, D. L., Dickerson, R. R., Stirm, B. H., Brown, S. S., Fibiger, 756
D. L., McDuffie, E. E., Campos, T. L., Gurney, K. R., and Thornton, J. A.: Top-Down Estimates of NOx and CO 757 Emissions From Washington, D.C.-Baltimore During the WINTER Campaign, J. Geophys. Res. Atmos., 123, 758
7705–7724, 10.1029/2018jd028539, 2018. 759
Scharko, N. K., Martin, E. T., Losovyj, Y., Peters, D. G., and Raff, J. D.: Evidence for Quinone Redox Chemistry 760
Mediating Daytime and Nighttime NO2-to-HONO Conversion on Soil Surfaces, Environ. Sci. Technol., 51, 9633-761
9643, 10.1021/acs.est.7b01363, 2017. 762
Sörgel, M., Trebs, I., Wu, D., and Held, A.: A comparison of measured HONO uptake and release with calculated 763
source strengths in a heterogeneous forest environment, Atmospheric Chemistry and Physics, 15, 9237-9251, 764
10.5194/acp-15-9237-2015, 2015. 765
Spataro, F., Ianniello, A., Esposito, G., Allegrini, I., Zhu, T., and Hu, M.: Occurrence of atmospheric nitrous acid 766
in the urban area of Beijing (China), Sci. Total Environ., 447, 210-224, 767
https://doi.org/10.1016/j.scitotenv.2012.12.065, 2013. 768
Stemmler, K., Ammann, M., Donders, C., Kleffmann, J., and George, C.: Photosensitized reduction of nitrogen 769 dioxide on humic acid as a source of nitrous acid, Nature, 440, 195-198, 10.1038/nature04603, 2006. 770
Stemmler, K., Ndour, M., Elshorbany, Y., Kleffmann, J., D'Anna, B., George, C., Bohn, B., and Ammann, M.: Light 771
induced conversion of nitrogen dioxide into nitrous acid on submicron humic acid aerosol, Atmos. Chem. Phys., 7, 772
4237-4248, 10.5194/acp-7-4237-2007, 2007. 773
Stutz, J., Alicke, B., Ackermann, R., Geyer, A., Wang, S. H., White, A. B., Williams, E. J., Spicer, C. W., and Fast, 774
J. D.: Relative humidity dependence of HONO chemistry in urban areas, J. Geophys. Res. Atmos., 109, D03307, 775
https://doi.org/10.5194/acp-2019-944Preprint. Discussion started: 9 December 2019c© Author(s) 2019. CC BY 4.0 License.
Page 32
32
doi:10.1029/2003jd004135, 2004. 776
Su, H., Cheng, Y. F., Shao, M., Gao, D. F., Yu, Z. Y., Zeng, L. M., Slanina, J., Zhang, Y. H., and Wiedensohler, A.: 777
Nitrous acid (HONO) and its daytime sources at a rural site during the 2004 PRIDE-PRD experiment in China, J. 778
Geophys. Res. Atmos., 113, D14312, 10.1029/2007JD009060, 2008. 779
Su, H., Cheng, Y., Oswald, R., Behrendt, T., Trebs, I., Meixner, F. X., Andreae, M. O., Cheng, P., Zhang, Y., and 780
Poschl, U.: Soil nitrite as a source of atmospheric HONO and OH radicals, Science, 333, 1616-1618, 781
10.1126/science.1207687, 2011. 782
Tang, Y., An, J., Wang, F., Li, Y., Qu, Y., Chen, Y., and Lin, J.: Impacts of an unknown daytime HONO source on 783
the mixing ratio and budget of HONO, and hydroxyl, hydroperoxyl, and organic peroxy radicals, in the coastal 784
regions of China, Atmos. Chem. Phys., 15, 9381-9398, 10.5194/acp-15-9381-2015, 2015. 785
Tanner, D. J., and Eisele, F. L.: Present oh measurement limits and associated uncertainties, J. Geophys. Res. Atmos., 786
100, 2883-2892, 1995. 787
Trick, S.: Formation of nitrous acid on urban surfaces - a physicalchemical perspective, Ph.D. thesis, University of 788
Heidelberg, 2004. 789
Trinh, H. T., Imanishi, K., Morikawa, T., Hagino, H., and Takenaka, N.: Gaseous nitrous acid (HONO) and nitrogen 790
oxides (NOx) emission from gasoline and diesel vehicles under real-world driving test cycles, J. Air Waste Manage., 791
67, 412-420, 10.1080/10962247.2016.1240726, 2017. 792
VandenBoer, T. C., Brown, S. S., Murphy, J. G., Keene, W. C., Young, C. J., Pszenny, A. A. P., Kim, S., Warneke, 793
C., de Gouw, J. A., Maben, J. R., Wagner, N. L., Riedel, T. P., Thornton, J. A., Wolfe, D. E., Dubé, W. P., Öztürk, 794 F., Brock, C. A., Grossberg, N., Lefer, B., Lerner, B., Middlebrook, A. M., and Roberts, J. M.: Understanding the 795
role of the ground surface in HONO vertical structure: High resolution vertical profiles during NACHTT-11, J. 796
Geophys. Res. Atmos., 118, 10,155-110,171, 10.1002/jgrd.50721, 2013. 797
Vecera, Z., and Dasgupta, P. K.: Measurement of ambient nitrous acid and a reliable calibration source for gaseous 798
nitrous acid, Environ. Sci. Technol., 25, 255-260, 10.1021/es00014a006, 1991. 799
Villena, G., Kleffmann, J., Kurtenbach, R., Wiesen, P., Lissi, E., Rubio, M. A., Croxatto, G., and Rappenglück, B.: 800
Vertical gradients of HONO, NOx and O3 in Santiago de Chile, Atmos. Environ., 45, 3867-3873, 801
10.1016/j.atmosenv.2011.01.073, 2011. 802
Villena, G., Bejan, I., Kurtenbach, R., Wiesen, P., and Kleffmann, J.: Interferences of commercial NO2 instruments 803
in the urban atmosphere and in a smog chamber, Atmos. Meas. Tech., 5, 149-159, 10.5194/amt-5-149-2012, 2012. 804
Wall, K. J., and Harris, G. W.: Uptake of nitrogen dioxide (NO2) on acidic aqueous humic acid (HA) solutions as a 805
missing daytime nitrous acid (HONO) surface source, J. Atmos. Chem., 74, 283-321, 10.1007/s10874-016-9342-806 8, 2016. 807
Wang, J., Zhang, X., Guo, J., Wang, Z., and Zhang, M.: Observation of nitrous acid (HONO) in Beijing, China: 808
Seasonal variation, nocturnal formation and daytime budget, Sci. Total Environ., 587-588, 350-359, 809
https://doi.org/10.1016/j.scitotenv.2017.02.159, 2017. 810
Wang, L., Wen, L., Xu, C., Chen, J., Wang, X., Yang, L., Wang, W., Yang, X., Sui, X., Yao, L., and Zhang, Q.: 811
https://doi.org/10.5194/acp-2019-944Preprint. Discussion started: 9 December 2019c© Author(s) 2019. CC BY 4.0 License.
Page 33
33
HONO and its potential source particulate nitrite at an urban site in North China during the cold season, The Science 812
of the total environment, 538, 93-101, 10.1016/j.scitotenv.2015.08.032, 2015a. 813
Wang, M., Chen, W. T., Shao, M., Lu, S. H., Zeng, L. M., and Hu, M.: Investigation of carbonyl compound sources 814
at a rural site in the Yangtze River Delta region of China, Journal of Environmental Sciences-China, 28, 128-136, 815
10.1016/j.jes.2014.12.001, 2015b. 816
Wang, S., Zhou, R., Zhao, H., Wang, Z., Chen, L., and Zhou, B.: Long-term observation of atmospheric nitrous 817
acid (HONO) and its implication to local NO2 levels in Shanghai, China, Atmos. Environ., 77, 718-724, 818 https://doi.org/10.1016/j.atmosenv.2013.05.071, 2013. 819
Wong, K. W., Oh, H. J., Lefer, B. L., Rappenglück, B., and Stutz, J.: Vertical profiles of nitrous acid in the nocturnal 820
urban atmosphere of Houston, TX, Atmos. Chem. Phys., 11, 3595-3609, 10.5194/acp-11-3595-2011, 2011. 821
Wong, K. W., Tsai, C., Lefer, B., Haman, C., Grossberg, N., Brune, W. H., Ren, X., Luke, W., and Stutz, J.: Daytime 822
HONO vertical gradients during SHARP 2009 in Houston, TX, Atmospheric Chemistry and Physics, 12, 635-652, 823
10.5194/acp-12-635-2012, 2012. 824
Wong, K. W., Tsai, C., Lefer, B., Grossberg, N., and Stutz, J.: Modeling of daytime HONO vertical gradients during 825
SHARP 2009, Atmos. Chem. Phys., 13, 3587-3601, 10.5194/acp-13-3587-2013, 2013. 826
Xu, Z., Wang, T., Wu, J., Xue, L., Chan, J., Zha, Q., Zhou, S., Louie, P. K. K., and Luk, C. W. Y.: Nitrous acid 827
(HONO) in a polluted subtropical atmosphere: Seasonal variability, direct vehicle emissions and heterogeneous 828
production at ground surface, Atmos. Environ., 106, 100-109, http://dx.doi.org/10.1016/j.atmosenv.2015.01.061, 829
2015. 830
Xue, L., Gu, R., Wang, T., Wang, X., Saunders, S., Blake, D., Louie, P. K. K., Luk, C. W. Y., Simpson, I., Xu, Z., 831
Wang, Z., Gao, Y., Lee, S., Mellouki, A., and Wang, W.: Oxidative capacity and radical chemistry in the polluted 832
atmosphere of Hong Kong and Pearl River Delta region: analysis of a severe photochemical smog episode, 833
Atmospheric Chemistry and Physics, 16, 9891-9903, 10.5194/acp-16-9891-2016, 2016. 834
Ye, C., Zhou, X., Pu, D., Stutz, J., Festa, J., Spolaor, M., Tsai, C., Cantrell, C., Mauldin, R. L., Campos, T., 835
Weinheimer, A., Hornbrook, R. S., Apel, E. C., Guenther, A., Kaser, L., Yuan, B., Karl, T., Haggerty, J., Hall, S., 836
Ullmann, K., Smith, J. N., Ortega, J., and Knote, C.: Rapid cycling of reactive nitrogen in the marine boundary 837
layer, Nature, 532, 489-491, 10.1038/nature17195, 2016. 838
Ye, C., Zhang, N., Gao, H., and Zhou, X.: Photolysis of Particulate Nitrate as a Source of HONO and NOx, Environ. 839
Sci. Technol., 51, 6849-6856, 10.1021/acs.est.7b00387, 2017. 840
Zhang, N., Zhou, X., Shepson, P. B., Gao, H., Alaghmand, M., and Stirm, B.: Aircraft measurement of HONO 841
vertical profiles over a forested region, Geophys. Res. Letts., 36, L15820, 10.1029/2009gl038999, 2009. 842
Zheng, J., Ma, Y., Chen, M., Zhang, Q., Wang, L., Khalizov, A. F., Yao, L., Wang, Z., Wang, X., and Chen, L.: 843
Measurement of atmospheric amines and ammonia using the high resolution time-of-flight chemical ionization 844
mass spectrometry, Atmos. Environ., 102, 249-259, http://dx.doi.org/10.1016/j.atmosenv.2014.12.002, 2015a. 845
Zheng, J., Ma, Y., Chen, M., Zhang, Q., Wang, L., Khalizov, A. F., Yao, L., Wang, Z., Wang, X., and Chen, L.: 846
Measurement of atmospheric amines and ammonia using the high resolution time-of-flight chemical ionization 847
mass spectrometry, Atmospheric Environment, 102, 249-259, 10.1016/j.atmosenv.2014.12.002, 2015b. 848
https://doi.org/10.5194/acp-2019-944Preprint. Discussion started: 9 December 2019c© Author(s) 2019. CC BY 4.0 License.
Page 34
34
Zhou, X., Civerolo, K., Dai, H., Huang, G., Schwab, J., and Demerjian, K.: Summertime nitrous acid chemistry in 849
the atmospheric boundary layer at a rural site in New York State, J. Geophys. Res. Atmos., 107, ACH 13-11-ACH 850
13-11, 10.1029/2001jd001539, 2002. 851
Zhou, X., Gao, H., He, Y., Huang, G., Bertman, S. B., Civerolo, K., and Schwab, J.: Nitric acid photolysis on 852
surfaces in low-NOxenvironments: Significant atmospheric implications, Geophys. Res. Letts., 30, 2217, 853
10.1029/2003gl018620, 2003. 854
Zhou, X., Zhang, N., TerAvest, M., Tang, D., Hou, J., Bertman, S., Alaghmand, M., Shepson, P. B., Carroll, M. A., 855 Griffith, S., Dusanter, S., and Stevens, P. S.: Nitric acid photolysis on forest canopy surface as a source for 856
tropospheric nitrous acid, Nature Geoscience, 4, 440-443, 10.1038/ngeo1164, 2011. 857
Ziemba, L. D., Dibb, J. E., Griffin, R. J., Anderson, C. H., Whitlow, S. I., Lefer, B. L., Rappenglück, B., and Flynn, 858
J.: Heterogeneous conversion of nitric acid to nitrous acid on the surface of primary organic aerosol in an urban 859
atmosphere, Atmos. Environ., 44, 4081-4089, 10.1016/j.atmosenv.2008.12.024, 2010. 860
861
862
https://doi.org/10.5194/acp-2019-944Preprint. Discussion started: 9 December 2019c© Author(s) 2019. CC BY 4.0 License.
Page 35
35
Table 1. Overview on HONO measurements performed in Nanjing and other cities in China. 863
Location Date HONO (ppbv)� References
Beijing
Sep. - Oct. 2015 (autumn) 2.27 ± 1.82
Wang et al. (2017) Jan. 2016 (winter) 1.05 ± 0.89
Apr. - May 2016 (spring) 1.05 ± 0.95
Jun. - Jul. 2016 (summer) 1.38 ± 0.90
Xi’an Jul. - Aug. 2015 (summer) 1.12 ± 0.97 Huang et al. (2017)
Jinan Nov. 2013 - Jan. 2014 (winter) 0.35 ± 0.5 Wang et al. (2015a)
Nanjing Apr. - Jun. 2012 (spring) 0.76 ± 0.79 Nie et al. (2015)
Xianghe Mar 2010 - Dec 2012 0.33 ± 0.16* Hendrick et al. (2014)
Beijing Jan. - Feb. 2007(winter) 1.04 ± 0.73 Spataro et al. (2013)
Guangzhou Jul. 2006 (summer) 0.71~8.43 (2.8)** Qin et al. (2009)
Xinken Oct. - Nov. 2004 (autumn) 0.4~3.8 (1.2)** Li et al. (2012)
Nanjing Dec. 2015 (winter) 1.32 ± 0.92 This work
�Campaign averaged; *Yearly average; **Only range and mean values are reported 864
865
https://doi.org/10.5194/acp-2019-944Preprint. Discussion started: 9 December 2019c© Author(s) 2019. CC BY 4.0 License.
Page 36
36
Table 2. Ozonolysis reaction rate constants and OH formation yields of the volatile organic compounds (VOC) 866
used in the calculation. 867
VOC k(298K) ´ 10-18
(cm3molecule-1s-1)a OH yield
VOC
k(298K) ´ 10-18
(cm3molecule-1s-1)a OH yield
Ethene 1.6 0.13b trans-2-Pentene 160 0.47c
Propene 10.1 0.34b cis-2-Pentene 130 0.3c
trans-2-Butene 190 0.59b 1-Pentene 10.6 0.37b
cis-2-Butene 125 0.37b Isoprene 12.8c 0.13 ± 0.03c
1-Butene 9.64 0.41b Styrene 17 0.07c
a: Atkinson and Arey (2003); b: Rickard et al. (1999); c: Alicke et al. (2002) 868
869
https://doi.org/10.5194/acp-2019-944Preprint. Discussion started: 9 December 2019c© Author(s) 2019. CC BY 4.0 License.
Page 37
37
Table 3. Linear correlation coefficients (Pearson correlation, R2) of the unknown source to HONO production-870
related parameters. 871
Individual
Parameters
Correlation Coefficient (R2) Various Combinations of
Parameters
Correlation Coefficient (R2)
RH 0.070 J(NO2) ×S/V 0.350
NO2 0.094 J(NO2)×NO2 0.261
S/V 0.107 J(NO2)×RH 0.348
J(NO2) 0.098 J(NO2)×NO2×RH 0.496
NO2×S/V 0.126 J(NO2)×NO2×S/V 0.372
NO2×RH 0.161 NO2×RH×S/V 0.191
RH×S/V 0.149 J(NO2)×NO2×S/V×RH 0.487
872
873
https://doi.org/10.5194/acp-2019-944Preprint. Discussion started: 9 December 2019c© Author(s) 2019. CC BY 4.0 License.
Page 38
38
874
Figure 1. Schematics of the custom-built wet chemistry-based HONO instrument. 875
876
https://doi.org/10.5194/acp-2019-944Preprint. Discussion started: 9 December 2019c© Author(s) 2019. CC BY 4.0 License.
Page 39
39
877
Figure 2. Time series of meteorological parameters, including HONO photolysis frequency (J(HONO)), relative 878
humidity (RH), ambient temperature, wind speed and wind direction, as well as mixing ratios of measured HONO, 879
HCHO, NO, NO2, O3 and PM2.5 during the observation period. 880
881
https://doi.org/10.5194/acp-2019-944Preprint. Discussion started: 9 December 2019c© Author(s) 2019. CC BY 4.0 License.
Page 40
40
882
883
Figure 3. Average diurnal profiles of HONO, NO2, HONO/NO2 and S/V. Error bars represent the standard 884
deviations in hourly bins. 885
886
https://doi.org/10.5194/acp-2019-944Preprint. Discussion started: 9 December 2019c© Author(s) 2019. CC BY 4.0 License.
Page 41
41
887
888
Figure 4. Time series of simulated OH (panel a) and observed photolysis rates (J(HONO) and J(O1D)) (panel b). 889
The gaps in the OH time series were the time periods when some observation data were not available. 890
891
https://doi.org/10.5194/acp-2019-944Preprint. Discussion started: 9 December 2019c© Author(s) 2019. CC BY 4.0 License.
Page 42
42
892
Figure 5. Campaign averaged diurnal variations of contribution fractions of OH production rates from HONO 893
photolysis (brown), alkene ozonolysis (red), O3 photolysis (blue), HCHO photolysis (green), and H2O2 photolysis 894
(purple). 895
896
https://doi.org/10.5194/acp-2019-944Preprint. Discussion started: 9 December 2019c© Author(s) 2019. CC BY 4.0 License.
Page 43
43
897
898
899
900
Figure 6. The same plots as Fig. 5 during two industrial plume events on the 7th (upper panel) and from the 21st-901
22nd (lower panel) of December. The corresponding rose plots indicate the origin of these plumes, i.e., the industry 902
park to the east of the observation site. 903
904
https://doi.org/10.5194/acp-2019-944Preprint. Discussion started: 9 December 2019c© Author(s) 2019. CC BY 4.0 License.
Page 44
44
905
906
Figure 7. Nighttime correlations between HONO/NO2 and RH, S/V and the product of S/V×RH. 907
908
https://doi.org/10.5194/acp-2019-944Preprint. Discussion started: 9 December 2019c© Author(s) 2019. CC BY 4.0 License.
Page 45
45
909
Figure 8. Correlation between HONO/NO2 and relative humidity (RH) at night. The open gray circles are 30-min 910
averages. The red circles represent the averages of the top-5 maxima of HONO/NO2 ratios in 10% RH bins. Error 911
bars represent standard deviations of the top-5 HONO/NO2 ratios in 10% RH bins. The black line is linear fit of 912
the red circles for HONO/NO2 with RH. 913
914
https://doi.org/10.5194/acp-2019-944Preprint. Discussion started: 9 December 2019c© Author(s) 2019. CC BY 4.0 License.
Page 46
46
915
Figure 9. Averaged production and loss rates of daytime HONO and J(NO2) during the measurement period. The 916
black line shows the photolysis rate of NO2. 917
918
https://doi.org/10.5194/acp-2019-944Preprint. Discussion started: 9 December 2019c© Author(s) 2019. CC BY 4.0 License.
Page 47
47
919
920
Figure 10. a) Averaged diurnal profiles of the measured HONO and the modeled HONO from different sources. 921
Error bars on the black line represent standard deviations of HONO measurements in hourly bins. Stacked areas 922
show contributions of different HONO sources to the modeled HONO concentration; b) The same plot as panel a, 923
except that only the two industrial plume events (the 7th and from the 21st to 22nd) were considered in the model. 924
925
a
b
https://doi.org/10.5194/acp-2019-944Preprint. Discussion started: 9 December 2019c© Author(s) 2019. CC BY 4.0 License.