72
1 EPSY 546: LECTURE 1 SUMMARY George Karabatsos
| Date post: | 13-Dec-2015 |
| Category: |
Documents |
| Upload: | sharon-terry |
| View: | 222 times |
| Download: | 3 times |

1
EPSY 546: LECTURE 1SUMMARY
George Karabatsos

2
REVIEW

3
• Test (& types of tests)
REVIEW

4
• Test (& types of tests)
• Item response scoring paradigms
REVIEW

5
• Test (& types of tests)
• Item response scoring paradigms
• Data paradigm of test theory (typical)
REVIEW

6
DATA PARADIGM
X X X X
X X X X
X X X X
X X X X
T ota l
P erson
Score
X
X
X
X
X X X X T o ta l Item Score
p p p p
j J
j J
n n n j nJ
N N N j N J
n
N
j J
j J
11 1 2 1 1
2 1 2 2 2 2
1 2
1 2
1
2
1 2
1 2
:
,
,
Item d ifficu lty
P erso n s = 1 , . . . , ; Item s = 1 , . . . , ; C a teg o rie s 0 , . . . , n N j J k K pN K X
N Kj
j

7
• Latent Trait Re (unidimensional)
REVIEW: Latent Trait

8
• Latent Trait Re (unidimensional)
• Real Examples of Latent Traits
REVIEW: Latent Trait

9
• Item Response Function (IRF)
REVIEW: IRF

10
• Item Response Function (IRF)
– Represents different theories
about latent traits.
REVIEW: IRF
11
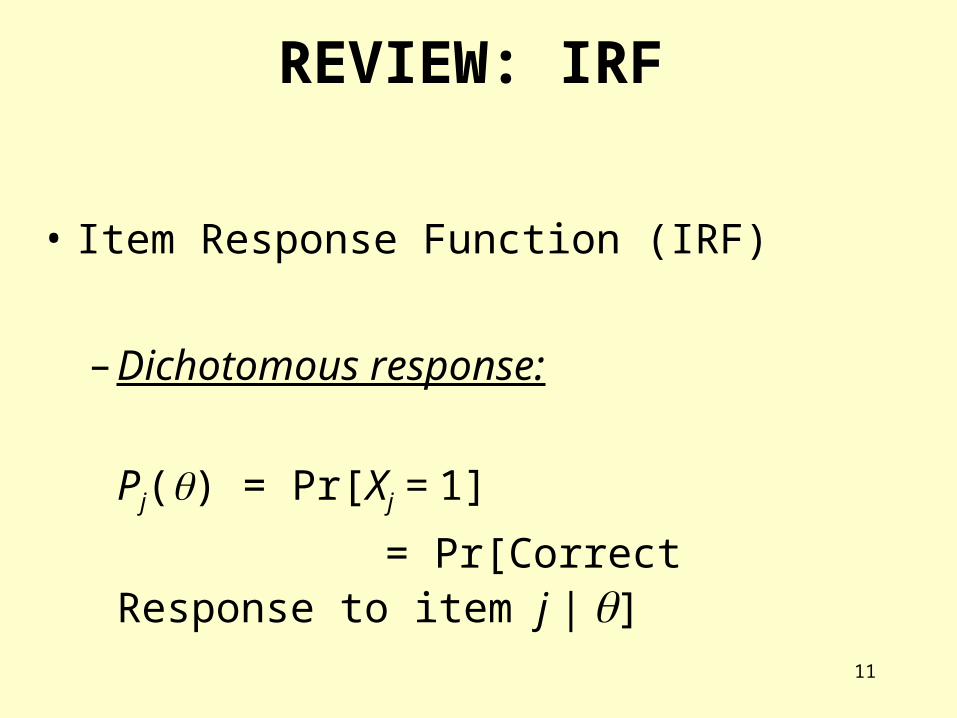
• Item Response Function (IRF)
– Dichotomous response:
Pj() = Pr[Xj = 1]
= Pr[Correct Response to item j | ]
REVIEW: IRF

12
• Item Response Function (IRF)
– Polychotomous response:
Pjk() = Pr[Xj > k | ]
= Pr[Exceed category k of item j | ]
REVIEW: IRF

13
• Item Response Function (IRF)
– Dichotomous or Polychotomous response:
Ej() = [Expected Rating for item j | ]
0 < Ej() < K
REVIEW: IRF

14
IRF: Dichotomous items
.00
.50
1.00
-5 -4 -3 -2 -1 0 1 2 3 4 5
Theta
Pj(Theta)

15
IRF: Polychotomous items
.00
.50
1.00
-5 -4 -3 -2 -1 0 1 2 3 4 5
Theta
Pjk(theta)

16
• The unweighted total score X+n
stochastically orders the latent trait
(Hyunh, 1994; Grayson, 1988)
REVIEW: SCALES

17
• 4 Scales of Measurement
– Conjoint Measurement
REVIEW: SCALES

18
• Conjoint Measurement
– Row Independence Axiom
REVIEW

19
• Conjoint Measurement
– Row Independence Axiom
• Property: Ordinal Scaling and unidimensionality of (test score)
REVIEW

20
INDEPENDENCE AXIOM (row)
ITEMSHard Easy
j = 1 2 3
3(i = 1)
P11 P12 P13
4(i = 2)
P21 P22 P23
TestScore
Group
5(i = 3)
P31 P32 P33
W1 Premise W1 Implication

21
• Conjoint Measurement
– Row Independence Axiom
• Property: Ordinal Scaling and unidimensionality of (test score)
• IRF: Non-decreasing over
REVIEW

22
• Conjoint Measurement
– Row Independence Axiom
• Property: Ordinal Scaling and unidimensionality of (test score)
• IRF: Non-decreasing over • Models: MH, 2PL, 3PL, 4PL, True Score,
Factor Analysis
REVIEW

23
2PL: P a bj j j
11
exp
.00
.50
1.00
-5 -4 -3 -2 -1 0 1 2 3 4 5
Theta
Pj(Theta)

24
3PL: P c c a bj j j j j
1 11
exp
.00
.50
1.00
-5 -4 -3 -2 -1 0 1 2 3 4 5
Theta
Pj(Theta)

25
4PL: P c d c a bj j j j j j
11
exp
.00
.50
1.00
-5 -4 -3 -2 -1 0 1 2 3 4 5
Theta
Pj(Theta)

26
Monotone Homogeneity (MH)
.00
.50
1.00
-5 -4 -3 -2 -1 0 1 2 3 4 5
Theta
Pj(Theta)

27
• Conjoint Measurement
– Column Independence Axiom (adding)
REVIEW

28
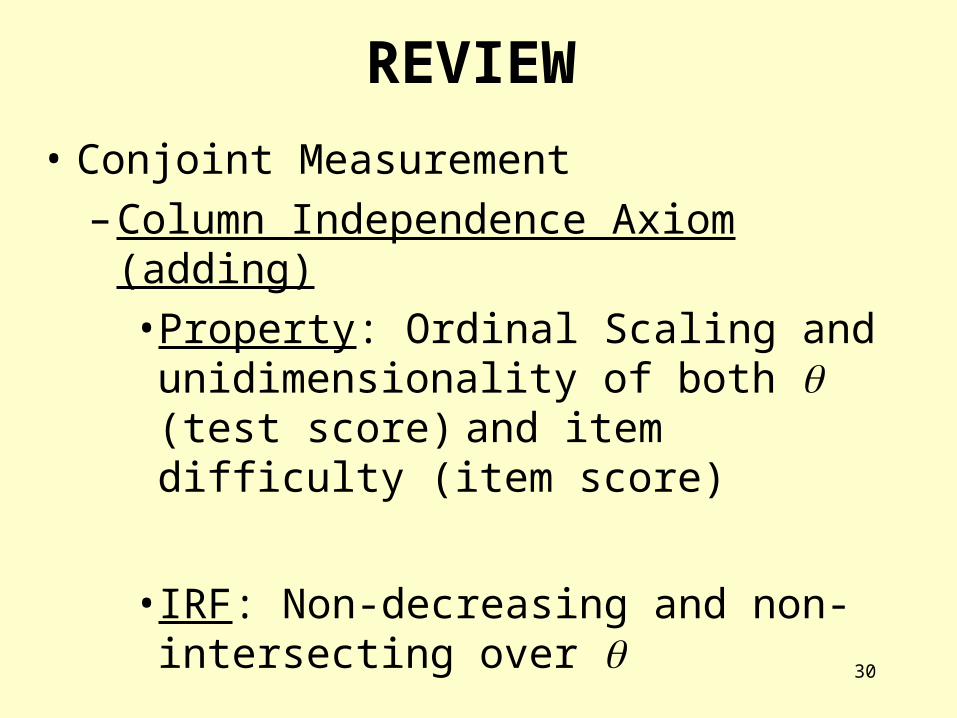
• Conjoint Measurement
– Column Independence Axiom (adding)
• Property: Ordinal Scaling and unidimensionality of both (test score) and item difficulty (item score)
REVIEW

29
ITEMSHard Easy
j = 1 2 3
3(i = 1)
P11 P12 P13
4(i = 2)
P21 P22 P23
TestScore
Group
5(i = 3)
P31 P32 P33
W1 Premise W1 Implication W2 Premise W2 Implication
INDEPENDENCE AXIOM (column)
30
• Conjoint Measurement
– Column Independence Axiom (adding)
• Property: Ordinal Scaling and unidimensionality of both (test score) and item difficulty (item score)
• IRF: Non-decreasing and non-intersecting over
REVIEW
31
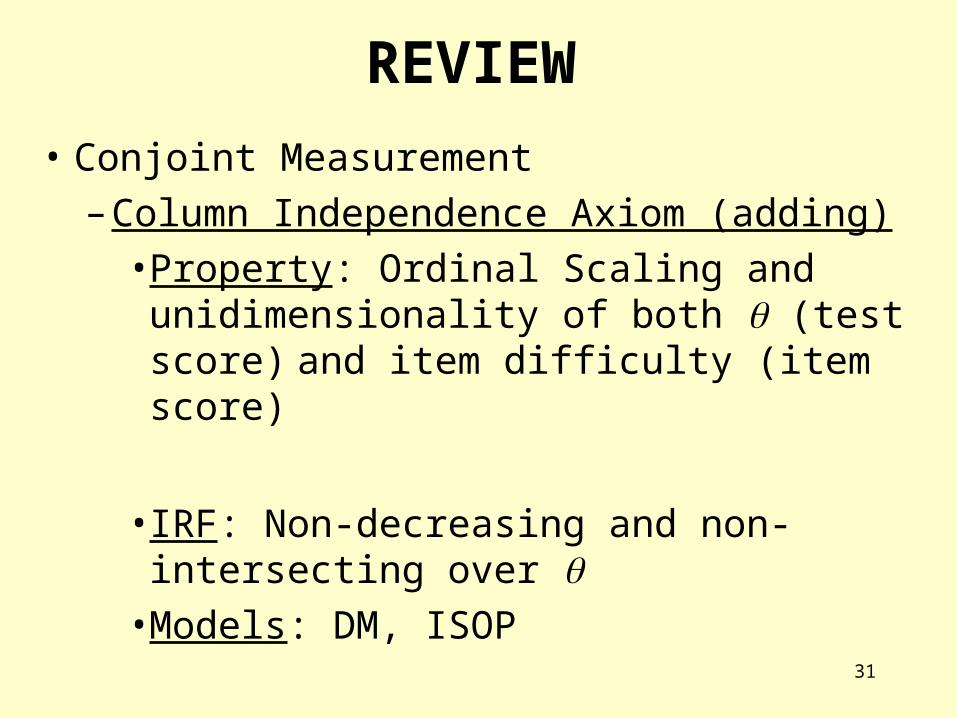
• Conjoint Measurement
– Column Independence Axiom (adding)
• Property: Ordinal Scaling and unidimensionality of both (test score) and item difficulty (item score)
• IRF: Non-decreasing and non-intersecting over
• Models: DM, ISOP
REVIEW

32
DM/ISOP (Scheiblechner 1995)
0.00
0.50
1.00
-5 -4 -3 -2 -1 0 1 2 3 4 5 6 7 8
Theta
Pr[
Co
rrect
Resp
on
se]

33
• Conjoint Measurement
– Thomsen Condition (adding)
REVIEW

34
• Conjoint Measurement
– Thomsen Condition (adding)
• Property: Interval Scaling and unidimensionality of both (test score) and item difficulty (item score)
REVIEW

35
ITEMSHard Easy
j = 1 2 3
3(i = 1)
P11 P12 P13
4(i = 2)
P21 P22 P23
TestScore
Group
5(i = 3)
P31 P32 P33
Thomsen condition(e.g.,double cancellation)

36
• Conjoint Measurement
– Thomsen Condition (adding)
• Property: Interval Scaling and unidimensionality of both (test score) and item difficulty (item score)
• IRF: Non-decreasing and parallel (non-intersecting) over
REVIEW

37
• Conjoint Measurement
– Thomsen Condition (adding)
• Property: Interval Scaling and unidimensionality of both (test score) and item difficulty (item score)
• IRF: Non-decreasing and parallel (non-intersecting) over
• Models: Rasch Model, ADISOP
REVIEW
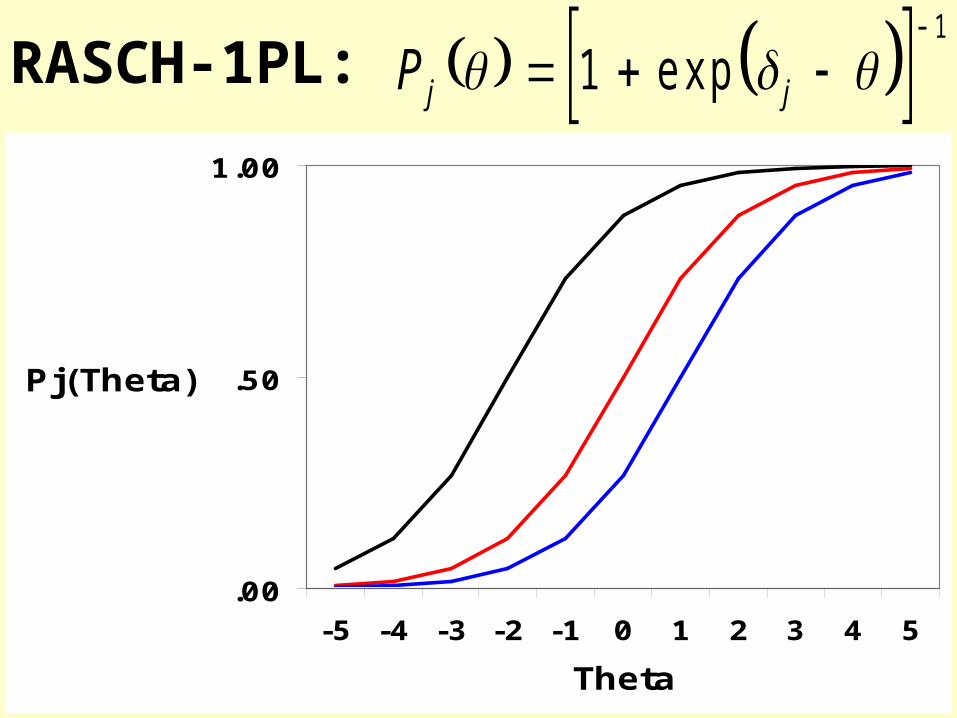
38
RASCH-1PL: P j j
11
exp
.00
.50
1.00
-5 -4 -3 -2 -1 0 1 2 3 4 5
Theta
Pj(Theta)

39
• 5 Challenges of Latent Trait Measurement
REVIEW

40
• 5 Challenges of Latent Trait Measurement
• Test Theory attempts to address these challenges
REVIEW

41
• Test Construction (10 Steps)
REVIEW

42
• Test Construction (10 Steps)
• Basic Statistics of Test Theory
REVIEW

43
• Total Test Score (X+) variance =
Sum[Item Variances]
+
Sum[Item Covariances]
REVIEW
44
EPSY 546: LECTURE 2
TRUE SCORE TEST THEORY AND RELIABILITY
George Karabatsos
45
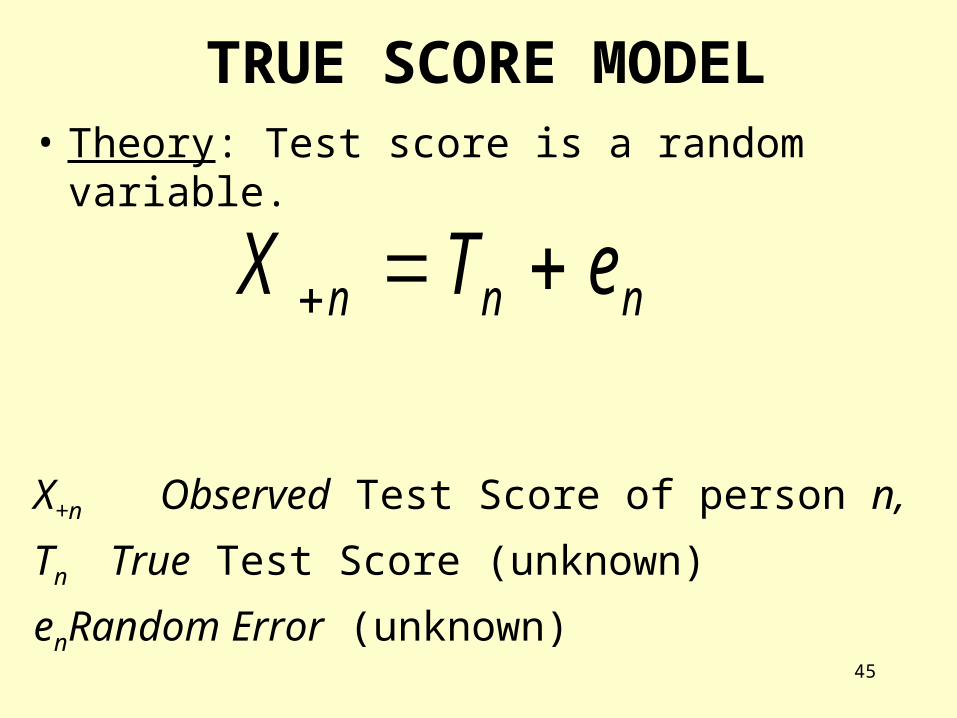
TRUE SCORE MODEL• Theory: Test score is a random variable.
X+n Observed Test Score of person n,
Tn True Test Score (unknown)
en Random Error (unknown)
X T en n n

46
TRUE SCORE MODEL
• The Observed person test score X+n is a random
variable (according to some distribution) with mean Tn = E(X+n) and variance 2(X+n) = 2(en).

47
TRUE SCORE MODEL
• The Observed person test score X+n is a random
variable (according to some distribution) with mean Tn = E(X+n) and variance 2(X+n) = 2(en).
• Random Error en = X+n – Tn
is distributed with
mean E(en) = E(X+n–Tn) = 0,
and variance 2(en) = 2(X+n) .
48
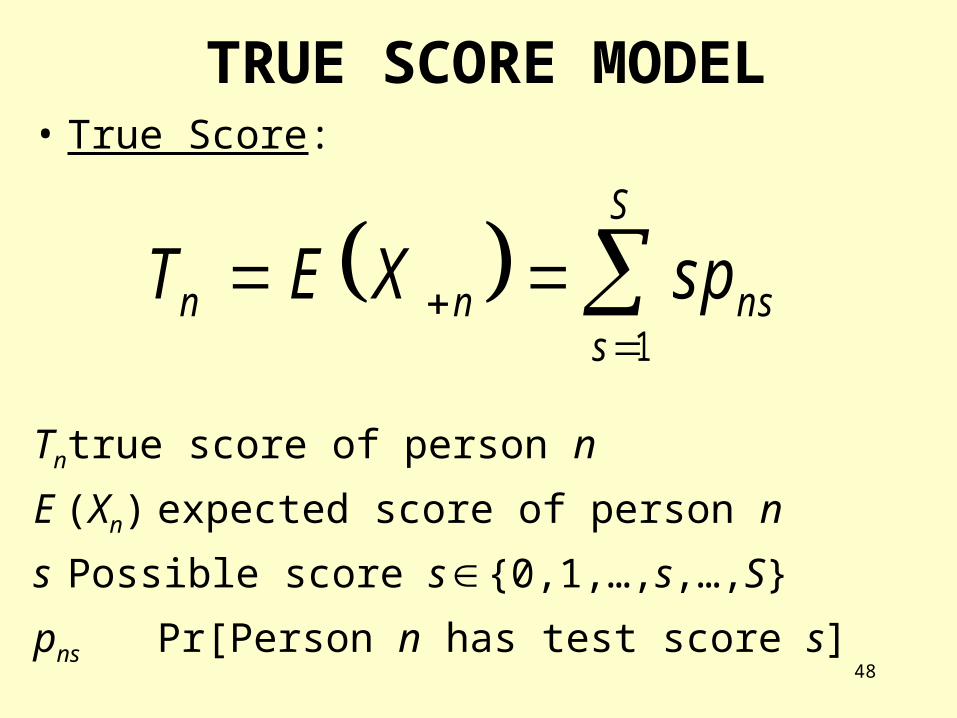
TRUE SCORE MODEL• True Score:
Tn true score of person n
E (Xn) expected score of person n
s Possible score s {0,1,…,s,…,S}
pns Pr[Person n has test score s]
T E X spn n nss
S
1
49
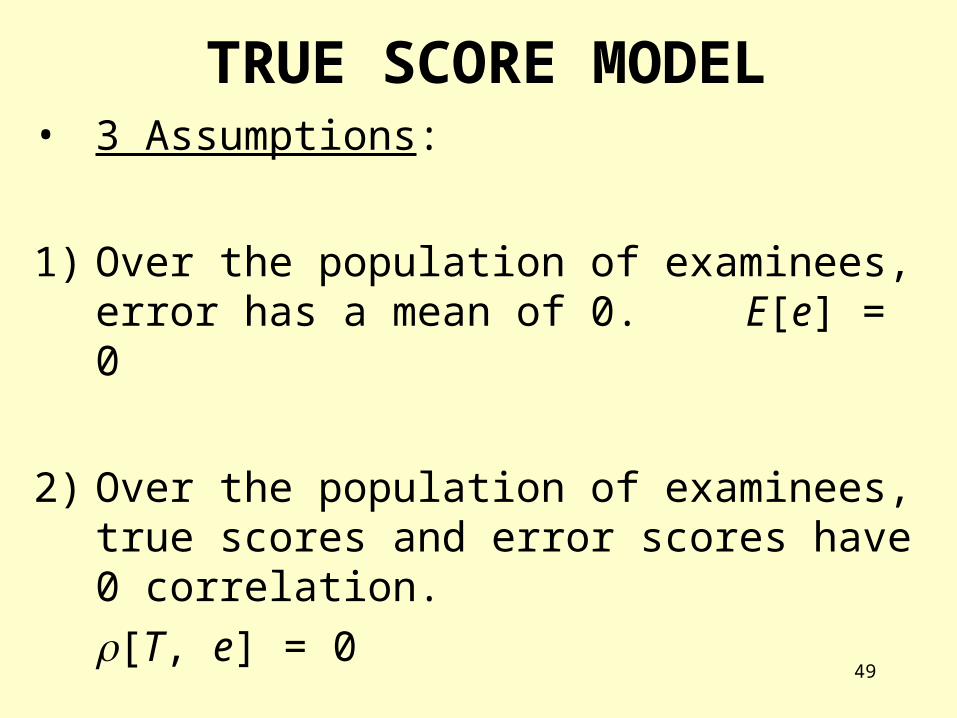
TRUE SCORE MODEL• 3 Assumptions:
1) Over the population of examinees, error has a mean of 0. E[e] = 0
2) Over the population of examinees, true scores and error scores have 0 correlation.
[T, e] = 0

50
TRUE SCORE MODEL• 3 Assumptions:
3) For a set of persons, the correlations of the error scores between two testings is zero.
[e1, e2] = 0
– “Two testings”: when a set of persons take two separate tests, or complete two testing occasions with the same form.
– The two sets of person scores are assumed to be randomly chosen from two independent distributions of possible observed scores.
51
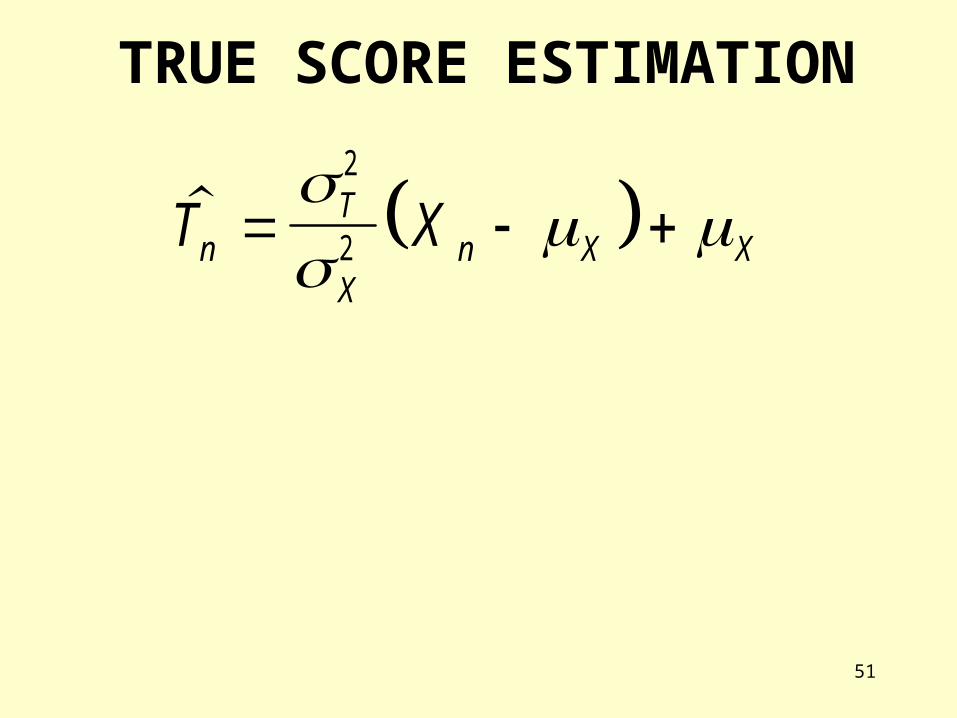
TRUE SCORE ESTIMATION
T XnT
Xn X X
2
2

52
TRUE SCORE ESTIMATION
T XnT
Xn X X
2
2
T Xn
n
N X
N
1

53
TRUE SCORE ESTIMATION
T XnT
Xn X X
2
2
e X Tn n n
54
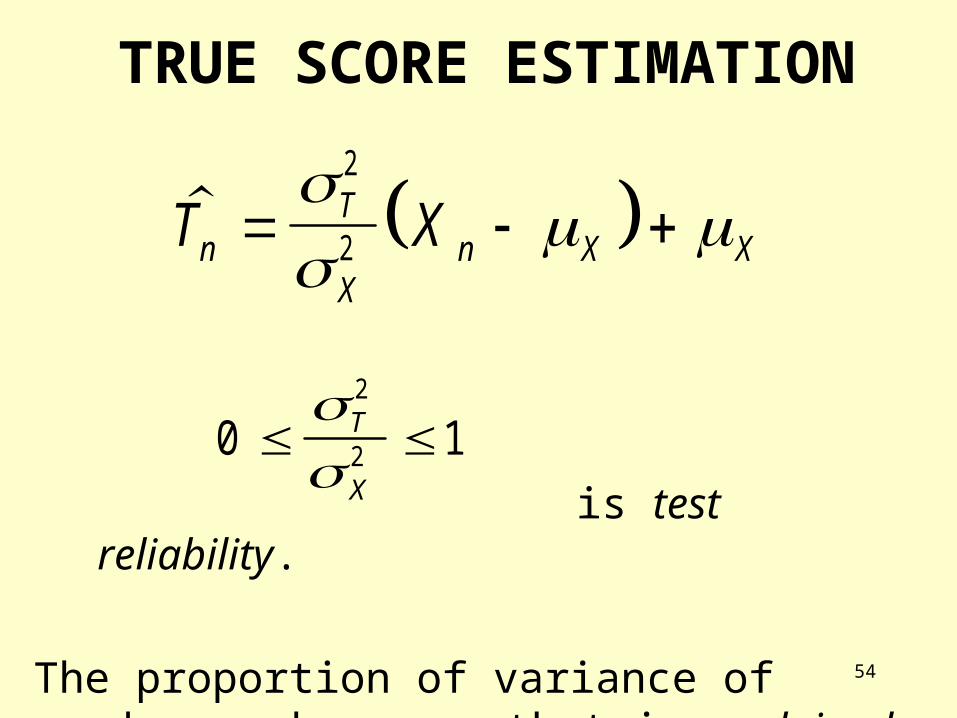
TRUE SCORE ESTIMATION
0 12
2
T
X
is test reliability.
The proportion of variance of observed scores that is explained by the variance of the true scores.
T XnT
Xn X X
2
2

55
TEST RELIABILITY
is the error of measurement.
T
X
X T
X
2
2
2 2
21
X T2 2

56
TEST RELIABILITY
is the standard error of
measurement.
(random error)
X T2 2

57
TEST RELIABILITY
is the standard error of
measurement.
(random error)
Estimated ((1–)*100)% confidence interval around the test score:
X T2 2
X Zn X T /
22 2

58
TEST RELIABILITY
• It is desirable for a test to be Reliable.

59
TEST RELIABILITY
• Reliability – the degree to which the respondents’ test scores are consistent over repeated administrations of the same test.

60
TEST RELIABILITY
• Reliability – the degree to which the respondents’ test scores are consistent over repeated administrations of the same test.
• Indicates the precision of a set of test scores in the sample.

61
TEST RELIABILITY
• Reliability – the degree to which the respondents’ test scores are consistent over repeated administrations of the same test.
• Indicates the precision of a set of test scores in the sample.
• Random and systematic error can affect the reliability of a test.

62
TEST RELIABILITY
• Reliability – the degree to which the respondents’ test scores are consistent over repeated administrations of the same test.
• Test developers have a responsibility to demonstrate the reliability of scores obtained from their tests.

63
ESTIMATING RELIABILITY
C ronbach sJ
J
jj
J
X
'
=
1
1
2
1
2
j2
X
2
Estimated item variance
Estimated total test score variance

64
ESTIMATING RELIABILITY
C ronbach sJ
J
iji j
J J
X
'
/
=
1
21 2
2
ij2
X
2
Estimated covariance between
items i and j
Estimated total test score variance

65
OTHER FORMS OF RELIABILITY
• Test-Retest Reliability:
The correlation between persons’ test scores over two administrations of the same test.

66
OTHER FORMS OF RELIABILITY
• Split-Half Reliability (using Spearman-Brown correction for test length):
AB Correlation between scores of Test A and Test B
2
2
1
A B
A B

67
TEST VALIDITY
• VALIDITY: A test is valid if it measures what it claims to measure.
• Types: Face, Content, Concurrent, Predictive, Construct.

68
• Face validity: When the test items appear to measure what the test claims to measure.
• Content Validity: When the content of the test items, according to experts, adequately represent the latent trait that the test intends to measure.
TEST VALIDITY

69
• Concurrent validity: When the test, measuring a particular latent trait, correlates highly with another test that measures the same trait.
• Predictive validity: When the scores of the test predict some meaningful criterion.
TEST VALIDITY

70
• Construct validity: A test has construct validity when the results of using the test fit hypotheses concerning the nature of the latent trait. The higher the fit, the higher the construct validity.
TEST VALIDITY

71
RELIABILITY & VALIDITY
• Up to a point, reliability and validity increase together, but then any further increase in reliability (over ~.96) decreases validity.
• For e.g., when there is perfect reliability (perfect correlations between items), the test items are essentially paraphrases of each other.

72
RELIABILITY & VALIDITY “If the reliability of the items were increased to
unity, all correlations between items would also become unity, and a person passing one item would pass all items and and another failing one item would fail all the other items. Thus all the possible scores would be a perfect score of one or zero…Is the dichotomy of scores the best that would be expected for items with equal difficulty?”
(Tucker, 1946, on the attenuation paradox)
(see also Loevinger, 1954)


