j ou rna l h om epag e : www.e l sev i e r. com/ loca t e /memsc i
Batch and continuous studies for ethyl lactate synthesis in a pervaporationmembrane reactorCarla S.M. Pereiraa, Viviana M.T.M. Silvaa,∗, Simão P. Pinhob, Alírio E. Rodriguesaa Laboratory of Separation and Reaction Engineering (LSRE), Associate Laboratory LSRE/LCM, Departamento de Engenharia Química,Faculdade de Engenharia, Universidade do Porto, Rua Dr. Roberto Frias s/n, 4200-465 Porto, Portugalb Laboratory of Separation and Reaction Engineering (LSRE), Departamento de Tecnologia Química e Biológica,Instituto Politécnico de Braganc a, Campus de Santa Apolónia, 5301-857 Braganc a, Portugal
a r t i c l e i n f o
Article history:Received 20 November 2009Received in revised form 26 May 2010Accepted 10 June 2010Available online 18 June 2010
Pervaporation process using commercial silica water selective membranes was evaluated to contributefor theethyl lactateprocess intensication by continuouspervaporation membranereactor. Preliminarystudies were performed in order to assess the existence of membrane defects and mass transfer limita-tions, studying the inuence of feed pressure and owrate, respectively. After, in the absence of masstransfer limitations, membrane performance was evaluated experimentally, at different compositionand temperature measuring the ux and selectivity of each species in binary mixtures (water/ethanol,water/ethyl lactate and water/lactic acid). Thus, species permeances were obtained for each experimentand correlated in order to account for the effect of temperature and feed composition. Permeances of ethanol and ethyl lactate depend solely on the temperature, following an Arrhenius equation; for water,itspermeancefollowsa modiedArrhenius equation takinginto account alsothe dependence on thefeedwatercontent. Mathematicalmodels, consideringconcentrationand temperaturepolarization,and non-isothermaleffects aswell,were developedand applied toanalyzethe performanceof batchpervaporationandcontinuouspervaporationmembrane reactor, in both isothermalandnon-isothermalconditions. ThePVMR with ve membranes in series, operating at 70◦ C, leads to 98% of lactic acid conversion and 96%
In the past few years, the interest in the application of reac-tive separations to many chemical processes has substantiallyincreased.Thisisparticularlytrueforequilibriumlimitedreactions,where theremovalofat leastoneof thereactionproducts shiftstheequilibrium towards the product formation.A variety of separationtechniques can be incorporated into the reactor; among all, perva-poration is becoming a promising technology, potentially useful inapplications such as dehydration of organic mixtures [1–4], sepa-ration of organic mixtures [5,6]and removal of organic compoundsfrom aqueous solutions [7,8].
In pervaporation processes, the transport of the componentsfromthefeedliquidmixturetothevaporphaseinvolvesthefollow-ingsteps:(i)masstransferfromthefeedbulktothefeedmembraneinterface; (ii) partition of penetrants between the feed and themembrane; (iii) selective transport (diffusion) through the mem-brane; and (iv) desorption into the vapor phase on the permeate
side. The partitioning and desorption steps are normally neglectedandtheremainingstepsareconsideredasthemaincontributionstotheoverall resistance tomass transfer.The mass transfer resistancein membranes depends on its properties and also on the chem-ical and physical properties of the feed components. In the past,the membrane materials and dimensions were not optimized and,therefore,high membranemass transfer resistancewas commonlyobserved. However, new developments in membrane materialsand ultra-thin composite membranes have led to much smallermembrane mass transfer resistances, which are now mainly dueto the diffusive transport at the boundary layer, like noticed inthe removal of volatile organic compounds from wastewaters [9]and in the dehydration of cyclohexane [10]. Diffusive transportdepends on the hydrodynamic conditions, solute and uid physi-calproperties, andthesystem geometry.Several correlations basedon the Sherwood number for calculating the mass transfer coef-cient for transport in the boundary layer (K bl) have been proposedover the years for different membrane modules congurations[11–18]. Pervaporation is not usually an isothermal process; andtemperature drop in the feed is frequently observed due to speciesvaporization. The heat transfer in pervaporation involves: (i) heattransfer from the feed bulk to the feed membrane interface; (ii)
44 C.S.M. Pereira et al. / Journal of Membrane Science 361 (2010) 43–55
heat transfer through the membrane; and (iii) consumption of heat (vaporization followed by expansion) at the permeate sideof the membrane. In systems operating under laminar conditions,where the membrane is thin and/or has high permeability, thetemperature drop in the feed membrane interface is considerable[19] and, therefore, the boundary layer heat transfer resistanceshould be taken into account. The heat transfer coefcient in theboundary layer is often determined by Nusselt based correlations[20].
Aiming to produce esters, where water is a by-product, suit-ablemembranesfordehydrationoforganicmixturescanbeappliedfor esters process intensication by means of pervaporation mem-brane reactors [21–27]. Although the signicant number of worksdealing with PVMR in the last years, most of them use simpliedmathematical models to optimize and predict the behaviour of PVMR units, neglecting concentration and temperature polariza-tion effects, which can be very signicant under certain workingconditions [28].
The ethyl lactate synthesis on pervaporation and vapour-permeation membrane reactors was studied before by someauthors. The two congurations adopted were: (i) batch reactor,where the esterication reaction takes place, followed by a mem-brane for water removal, and reux of the retentate to the reactor[29–32] and (ii) membrane inside a batch reactor [33,34]. In fact,none of these studies considersa continuous integrated membranereactor for ethyl lactate production. Regarding the type of mem-branes tested, polymeric membranes were used for pervaporation[29,30,32] and zeolites for vapour-permeation [33,34]. However,generally, the pervaporation process is supercially addressed;important membrane parameters, like selectivity and species per-meances, at different temperatures and feed concentrations, werenot obtained. The most detailed pervaporation study for the ethyllactatesystemwasperformedbyDelgadoandco-authorsforbinary[35] and quaternary mixtures [36] using a commercial polymericmembrane Pervap 2201 (from Sulzer Chemtech), but, only theseparation problem was focused, and concentration and temper-ature polarization were not taken into account. Although mostof studies involve the use of polymeric membranes that providegood selectivity and ux, these membranes do not normally sup-port reaction conditions (in terms of concentrations, temperature,and pH, among others) and, therefore, are not appropriated forapplications underthoseconditions. Inorganicmembranes, mainlythose of silica and zeolites, present better stability under acidicand high temperature conditions, and are the best alternative toperform thedehydration of a reaction medium. Since thecommer-cialmicroporous silicamembrane(from Pervatech)revealed betterselectivity and water ux than the one from Pervap SMS (fromSulzer Chemtech) in the dehydration of aqueous mixtures con-taining acetone and isopropanol [4], Pervatech membrane will beconsidered in this work. Moreover, for the dehydration of ethanol,the Pervatech membrane proved to have high ux and selectivity
[37].In this work, the synthesis of ethyl lactate in a continuous inte-grated pervaporation membrane reactor, using the commercialtubular membrane with higher ux and high selectivity (Pervat-ech) is,for therst time, implementedandevaluated.Furthermore,in order to better characterize the pervaporation process and aim-ing to describe the PVMR unit, the effect of feed pressure, owrate,temperature andcomposition on thepervaporationperformance isstudied using batch experiments (BP), testing the different binarymixtures involved in the synthesis of ethyl lactate (ethanol/water,ethyl lactate/water and lactic acid/water). Additionally, a newmathematicalmodelaccountingforthemasstransportphenomenaundernon-isothermalconditionsisdeveloped,andafterappliedfora betterunderstanding anddescription of theethyl lactate produc-
tion by means of a PVMR.
2. Experimental
2.1. Materials
The chemicals used were ethanol (>99.9% in water), lactic acid(>85% in water) and ethyl lactate (>98% in water) from Sigma-Aldrich (U.K.).A commercial strong-acidion-exchange resinnamedAmberlyst 15-wet (A15-wet) (Rohm & Haas) was used as catalystand adsorbent. A commercial hydrophilic membrane supplied byPervatechBV (The Netherlands)was used. It is resistantfor anysol-vent atany concentration, butsensitive toacidic andalkaline media(preferred pH range from 2 up to 9) and so, exposure to inorganicacids or caustics must be avoided. This membrane has a modiedsilica (methyl silica) selective layer coated onto gamma alumina.The separation layer is applied inside of an asymmetric ceramictube that has an outer diameter of 10mm, an inner diameter of 7mm, and a length of 50cm. It has an effective membrane area pertube of about 110cm2. Two equal membrane modules were usedto perform the experiments.
2.2. Pervaporation membrane unit
Theexperiments werecarriedoutin a pervaporationmembraneunit which can operate in batch or in continuous mode. This unitis equipped with temperature (TI) (type K thermocouple, accuracyof about ± 2.2 ◦ C) and pressure sensors (PI) in order to monitor andregister these two parameters. The absolute pressure is measuredthrough two analogue dials (accuracy of about ± 0.5bar), lledwith glycerine (Nuova Firma), while the pressure in the perme-ate side is measured by means of 1 digital dial ceraphant-T PTC31(Endress+Hausser) (accuracy of about± 1 mbar). A schematic rep-resentation of thepervaporation membrane unit is shown in Fig. 1.The temperature was controlled by a thermostated bath (Lauda,Germany) with ethylene glycol/water solution that ows throughthe jackets of feed vessels 1 and 2; pressure was set at 2 bar apply-ing an overpressure of helium to the system in order to preventvaporization of feed mixture over the entire temperature range.
2.2.1. Pervaporation experimentsThe feed was charged into the feed vessel 1 (1 L capacity) and
heated to the desired temperature. In order to heat the whole sys-tem (tubing and membranes) to that same temperature, the feedmixture is after re-circulated over the membrane modules usinga positive displacement diaphragm pump (Hydra Cell G-03, Wan-ner International), in the absence of vacuum on the permeate side.When the steady state is reached, the pervaporation experimentstarts by applying vacuum to the permeate side by means of avacuum pump (Boc Edwards, U.K.). During the whole run, all per-meated vapour is condensed on two parallel glass cold traps lledwith liquid nitrogen.Finally, thecollectedpermeatewasdefrosted,weighted and analyzed. The duration of the experiment is con-
ditioned by the trade-off between ensuring the nearly constantfeed composition and enough amount of permeate. To verify theassumption of constant feed composition samples were collectedbefore and after each experiment.
2.3. Analytical method
All the samples were analysed in a gas chromatograph(Chrompack 9100, Netherlands) using a fused silica capillary col-umn(ChrompackCP-Wax57 CB,25 m× 0.53mmID,df =2.0 m)toseparate the compounds, anda thermal conductivity detector (TCD903A)toquantifythem.Thecolumntemperaturewasprogrammedwith a 1.5min initial hold at 110 ◦ C, followed by a 50◦ C/min rampup to 190 ◦ C and held for 8.5min. The injector and detector tem-
C.S.M. Pereira et al. / Journal of Membrane Science 361 (2010) 43–55 45
Fig. 1. Setup of the pervaporation membrane reactor unit.
N50 was used as the carrier gas with a owrate of 10.5mL/min.The species quantication using this analytical method presentsan inherent average error less than 2%.
3. Pervaporation studies
The experimental results of the pervaporation studies for thedifferent binary mixtures (ethanol/water, ethyl lactate/water andlactic acid/water) are presented in this section. The effect of theabsolute feed pressure, feed owrate, operation temperature, andwater feed mole fractiononto themembrane performance isevalu-ated. The membrane permeabilities were measured in the absenceof mass transfer limitations in the boundary layer like shown bythe preliminary studies.
3.1. Pervaporation transport
Thepervaporationperformanceofthemembranewasevaluatedin terms of pervaporation ux and separation factor (membraneselectivity). The process separation factor ( ) is dened as:
˛ = yi x j xi y j
(1)
where xi is the liquidmole fraction of component i on the feed sideand yi is the mole fraction of component i on the permeate side .
The partial ux of one component through the membrane isgiven by:
J i = w perm,i J tot (2)
where J tot is the total permeation ux expressed in kg/(m2
s) andw perm,i is the mass fraction of component i on the permeate.The solution-diffusion model [38] was successfully applied in
the description of solvent dehydration using microporous silicamembranes [37,39]. This model provides the following transportequation for the permeation molar ux of a component throughthe membrane:
J i = Q memb,i ( xi i p0i − yiP perm ) (3)
where Q memb ,i is the permeance of component i through themembrane (mol/(m 2 sPa)), which is equal to P i/ , being P i thepermeability coefcient of component i (mol/(msPa)), and thethickness of the selective layer of the membrane, i is the activitycoefcient(calculatedbytheUNIQUACmodelusingtheparameters
determined in previous work [40]), p0i is the saturation pressure of
component i, and P perm is the total pressure on the permeate side.The saturation pressure of pure components was estimated by theAntoine equation [41].
Some works consider the temperature inuence on the totalux to measure an apparent activation energy [8,36,42]. However,in this work, the activation energy of permeation is calculated byanArrhenius-typeequationfor thepermeancetemperaturedepen-dence [43]:
Q memb,i = Q memb, 0 exp− E perm,i
RT (4)
where Q memb ,0 is the pre-exponential factor, E perm ,i is the activa-tion energy of permeation, which is a combination of activationenergy of diffusion and the heat of adsorption on the membrane(E perm ,i =E D,i + H s),T is theabsolute temperature and R is the idealgas constant.
3.2. Preliminary studies
3.2.1. Evaluation of the membrane qualityThe driving force for the transport through the membrane is
based on the species chemical potential difference over the mem-brane and, theoretically, the absolute feed pressure affects thechemicalpotentials via the Poyntingfactor [44],whichmight affecteither the ux or the selectivity. However, this inuence is oftennegligible since the Poynting factor is one at low pressures and,therefore, a way to detect membrane imperfections is by perform-
ing pervaporation experiments at different feed pressures. If thepermeate composition andthe total uxremains constant over thestudied pressure range the membrane quality can be, in principle,guaranteed [45].
Theinuenceof thefeed pressureonto thepervaporation mem-brane performance, is shown in Fig. 2, where the total permeationux and permeate composition are given as a function of feedpressure,keeping constant the remainingconditions(temperature,owrate, water feed concentration, permeate pressure). The varia-tions observed eitheron thepermeate compositionsor on the totalux are within the experimental error, being possible to concludethat pervaporation is not affected by the feed pressure, conrmingthemembrane quality. Bruijnet al. [46] studying theeffects of feedpressure on a similar methylated silica membrane also found the
46 C.S.M. Pereira et al. / Journal of Membrane Science 361 (2010) 43–55
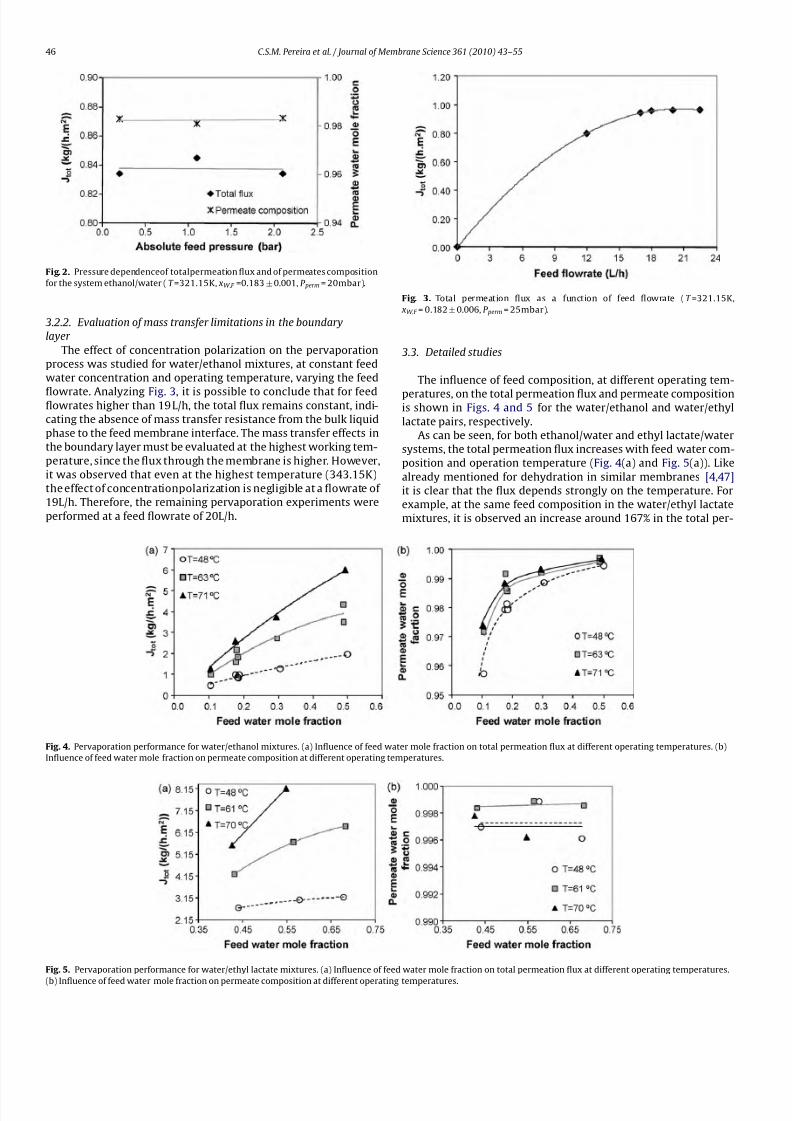
Fig. 2. Pressure dependenceof totalpermeation ux andof permeatescompositionfor the system ethanol/water ( T =321.15K, xW ,F =0.183± 0.001, P perm = 20mbar).
3.2.2. Evaluation of mass transfer limitations in the boundarylayer
The effect of concentration polarization on the pervaporationprocess was studied for water/ethanol mixtures, at constant feedwater concentration and operating temperature, varying the feed
owrate. Analyzing Fig. 3, it is possible to conclude that for feedowrates higher than 19L/h, the total ux remains constant, indi-cating the absence of mass transfer resistance from the bulk liquidphase to the feed membrane interface. The mass transfer effects inthe boundary layer must be evaluated at the highest working tem-perature, since theux through themembrane is higher. However,it was observed that even at the highest temperature (343.15K)theeffectof concentrationpolarization is negligible at a owrate of 19L/h. Therefore, the remaining pervaporation experiments wereperformed at a feed owrate of 20L/h.
Fig. 3. Total permeation ux as a function of feed owrate (T =321.15K, xW ,F = 0.182± 0.006, P perm = 25mbar).
3.3. Detailed studies
The inuence of feed composition, at different operating tem-peratures, on the total permeation ux and permeate compositionis shown in Figs. 4 and 5 for the water/ethanol and water/ethyllactate pairs, respectively.
As can be seen, for both ethanol/water and ethyl lactate/watersystems, the total permeation ux increases with feed water com-position and operation temperature ( Fig. 4(a) and Fig. 5(a)). Likealready mentioned for dehydration in similar membranes [4,47]it is clear that the ux depends strongly on the temperature. Forexample, at the same feed composition in the water/ethyl lactatemixtures, it is observed an increase around 167% in the total per-
Fig. 4. Pervaporation performance for water/ethanol mixtures. (a) Inuence of feed water mole fraction on total permeation ux at different operating temperatures. (b)Inuence of feed water mole fraction on permeate composition at different operating temperatures.
Fig. 5. Pervaporation performance for water/ethyl lactate mixtures. (a) Inuence of feed water mole fraction on total permeation ux at different operating temperatures.
(b) Inuence of feed water mole fraction on permeate composition at different operating temperatures.
C.S.M. Pereira et al. / Journal of Membrane Science 361 (2010) 43–55 47
Fig.6. Inuenceof thetemperatureon theseparationfactorfor thebinary mixtureswater/ethanol and water/ethyl lactate.
meation uxwhen theoperationtemperature changes from 321 to343K. In fact, the permeation driving force increases with temper-ature for all species. Moreover, since water is the most permeatedcomponent, an increase in the feed water content leads to a higher
water driving force,and, consequently, the totaluxis signicantlyenhanced.Regardingthepermeatecomposition, it is almost invari-able with temperature for both ethanol/water ( Fig. 4(b)) and ethyllactate/water ( Fig. 5(b)) systems; and with feed water content forethyl lactate/water pair (varies from 0.996 to 0.999). However, forwater/ethanol pair, it is observed that the water permeate molefraction increases with the feed water concentration.
For water/lactic acid mixtures two pervaporation experimentswere performed with a feed water mole fraction of 0.77, at twodifferent temperatures (321.15 and 343.15K). Observing that thepermeate stream was pure water no more experiments were per-formed for this binary mixture.
The process separation factor for the pairs water/ethanol andwater/ethyl lactate is plotted as a function of the temperature inFig. 6. It can be seen that the membrane presents good selectivitytowards water in both pairs, but the selectivity to water is higherin mixtures with ethyl lactate most probably due to the highermolecular size of ethyl lactate compared with that of ethanol, assupportedby thevalues of thegyration radiuspresentedin Table 1which are an indication of the molecular sizes. It would then beexpected permeation of lactic acid through the membrane. How-ever, the molecular size is not the only factor affecting selectivity;the lower lactic acid vapor pressure (Table 1) signicantly reducesthe permeation driving force for this component. Additionally, theafnity between species and membrane should be considered asa secondary factor (the molecular diameter is the most impor-tant). This afnity is directly related with the dipole moment of each component (Table 1): small dipole moment mightcomplicatethepenetration of molecules into thehydrophilic silica layer.Com-paring lactic acid with ethyl lactate properties, the molecular sizesare similar, but the rst has the lowest dipole moment, which in
Table 1Physical properties for the different species (water, ethanol, ethyl lactate and lacticacid).
Molecule Radius of gyration(Å)a
Dipole moment(Debyes)a
Vapour pressure(bar)b
Water 0.615 1.8497 1.24× 10− 1
Ethanol 2.259 1.6908 2.94× 10− 1
Ethyl lactate 3.622 2.4000 1.92× 10− 2
Lactic acid 3.298 1.1392 1.08× 10− 3
a Data taken from Ref. [43].b Vapour pressure values at 323.15K.
Fig. 7. Temperature dependence of species permeances (mol/(sm 2 Pa)).
addition to the lowest vapor pressure, leads to innite membraneselectivity towards water in lactic acid mixtures.
3.4. Parameter estimation
The pervaporationprocess design requires theknowledgeof thepermeanceof each componentas function of temperature (Eq. (4)).However, there is evidence that the feed water content affects per-meance [36]and,therefore,bothfactorsareneededtobeaccountedfor.
3.4.1. Permeance temperature dependenceExperimental permeance for each species can be calculated
combining using the experimental information found so far in Eq.(3), simultaneously with the activity coefcients calculated by theUNIQUAC model [40]. Those values are presented in Fig. 7.
From the slope and intercept of the linear regression, the acti-vation energy of permeation and the pre-exponential factor areestimated for each species, like presented in Table 2. Althoughthe permeation ux increases with temperature due to increasingdriving forces, the membrane permeability decreases as indicatedby the negative values of the activation energies of permeation(Table 2). As already mentioned, the activation energy is the sumof thediffusionactivation energyandtheheat of adsorption on themembrane, indicating that the permeation of water, ethanol andethyl lactate is governed by the adsorption. Similar results werefound for water/ethanol permeation through silica microporousmembranes [39].
The errorintroducedconsideringcomposition invariantperme-ances can be calculated from the mean relative deviation (MRD),dened by Eq. (5).
MRD = 1nexp
nexp
J i,calc − J i,exp
J i,exp× 100% (5)
In order to decrease the deviations between theoreticaland experimental uxes, parameter estimation considering alsocomposition dependence will be addressed in the following sub-section.
Table 2Pervaporation parameters of Eq. (4) and the mean relative deviation (MRD).
48 C.S.M. Pereira et al. / Journal of Membrane Science 361 (2010) 43–55
Fig. 8. Water ux as a function of the driving force.
3.4.2. Permeance temperature and water content dependenceAccording to Eq. (3), an average water permeance value is
calculated from the slope of water ux as a function of waterdriving force. Fig. 8 shows a linear pattern for the experimen-tal values obtained in this work, indicating a water permeance
of 4.72× 10− 6
mol/(m2
sPa), which is very similar to the aver-age of the calculated water permeances from the experimentaldata (4.76 × 10− 6 ± 8.62 × 10− 7 mol/(m2 s Pa)). This behaviour wasexpected considering other works with ceramic silica membranes,like the dehydration of isopropanol where the water permeancewasindependent of the temperature andwater feed concentration[48]. However, despite the linear trend observed, there is certaindata dispersion, leading to deeper analysis of these results, wherethe water permeance was calculated for each experiment by Eq.(3), decoupling the effects of temperature and composition (seeAppendix).Inconsequence,thefollowingempiricalcorrelationwasobtained for water permeance as function of the temperature andwater feed content:
Q memb,W = 3.278 × 10− 11 exp(18.64 xW ) exp
× −50377 xW − 32326
RT (mol/(sm2 Pa)) (6)
This expression, reects the fact that water adsorption is thecontrolling mechanism (negative values of activation energy of permeation), as sated before; but includes the inuence of thewater feed content. According to the solution-diffusion theory, theactivation energy for the permeation process is a combination of activation energy of diffusion and heat of adsorption on the mem-brane (E perm ,i =E D,i + H s). It is known that the rst term is positive(E D,i), and, forphysisorption process, thesecondterm ( H s)isneg-ative. Moreover, the heat of adsorption depends on the degreeof surface coverage, therefore, H s is indeed an isosteric heat of
adsorption. The membrane tested in this work has a modiedsilica selective layer coated onto gamma alumina. Both materi-als (silica and alumina) are hydrophilic and, therefore, commonlyused for water removal. It has been experimentally demonstratedthat the isosteric heat of water adsorption decreases signicantlywith the increase of the surface coverage for silica, alumina andsilica-alumina materials [49], and for silica gel [50]. This is inagreement with the inuence of water feed content on waterpermeance described by Eq. (6): the isosteric heat of adsorptiondecreases as the water feed content increases, leading to higheractivation energy of permeation (see Table A1), and consequentlythe water permeance decreases when feed water concentrationincreases. Other possible explanations for the behaviour exper-imentally observed are a crowding (saturation) effect of water
diffusion through the silica pores, as proposed by Baker and
Fig. 9. 1/kov,W versus 1/ v bF , b =0.97.
co-authors [51]; and, less likely, swelling as already reportedfor MFI zeolites membranes in the presence of certain solvents[52].
The detailed expression of water permeance (Eq. (6)) leads to aMRDbetween experimental andcalculatedvalues of 10.35%,which
is about 26% smaller than the one obtained when just the tem-perature inuence was considered. Although derived from binarymixture data, expression (6) can be applied to estimate the waterpermeance in quaternary mixtures, since it depends only on thewater content no matters the remaining constituents. This is inagreement with experimental pervaporation results by Delgadoet al. [36], who studied binary and quaternary mixtures involvedin the ethyl lactate synthesis. Therefore, it can be stated that thewatertransport isbarelyaffectedby thepresenceof theothercom-ponents supporting the validity of Eq. (6). For ethanol and ethyllactate, no relation was found between their permeances in themembrane and the feed contents. Therefore, the parameters of Table 2 were used to determine the permeances of these speciesat different operating temperatures and water feed contents.
3.4.3. Estimation of the boundary layer mass transfer coefcient (K bl)
In pervaporation processes, in addition to thepermeation resis-tance in themembranethereis theresistance in theboundarylayer(concentrationpolarization).This can be conveniently representedby the resistance in series model, where the overall resistance totransport is the sum of boundary layer and membrane resistances.The resistance in series equation for pervaporation was derived byWijmans and collaborators [9]:
1kov ,i
=1
Q memb,i+
i p0i V mol,i
a v bF
(7)
in which kov,i is a global membrane mass transfer coefcient
(mol/(sm2
Pa)), that combines the resistance due to the diffusivetransport in the boundary layer with the membrane resistance,V mol ,i isthemolarvolumeofcomponent i (m3/mol),K bl = av b
F wherev F is the feed liquid velocity (m/s). Eq.(7) will be used to determinethe mass transfer resistance in the boundary layer.
The pervaporation experimental data obtained for water/ethanol mixturesusingdifferentfeedowrateswasused toplot theinverse of the global membrane mass transfer coefcient (1/kov) of water and ethanol as a function of 1/ v b
F , as shown in Figs. 9 and 10,respectively. The value of parameter b was chosen in order to keepthedatapointson a straight line andalsominimizing thedifferencebetween the inverse of the interceptof the line andthe experimen-talpermeancemeasured in absence of mass transfer limitations onthe boundary layer (being the best t for b =0.97). The parame-
ter a was obtained from the slope of this line. By this analysis it
The mathematical model developed to describe the behaviourof the batch pervaporation membrane (BPM) considers:
- Plug ow for the bulk uid phase.- Total feed volume inside the tank and the retentatevelocity vari-
ations due to permeation of components.
- Concentration polarization, where the resistance due to the dif-fusive transport in the boundary layer is combined with themembrane resistance in a global membrane resistance.
- Non-isothermal operation due to heat consumption for speciesvaporization.
- Temperature polarization.
Following these assumptions the BPM model equations are:
Feed tank mass balance to component i
d(VC f,i)dt
= Q ret C ret,i − Q f C f,i (10)
where t is the time variable, V is the volume of the feed thank, Q f isthe owrate fed to the membrane modules and Q ret is the owrateattheendofthemembranemodules, C f and C ret aretheliquidphaseconcentrationfedtothemembraneandattheendofthemembranemodules, respectively.
Feed volume variation
dV dt
= Q ret − Q f (11)
Retentate mass balance to component i
∂C ret,i
∂t +
∂(v C ret,i )∂z
+ Am J i = 0 (12)
where z is the axial coordinate at the membrane modules, v isthe supercial velocity, Am is the membrane area per unit mem-
brane modules volume and J i is the permeate molar ux of species
i, through the membrane, dened as:
J i = kov ,i ( xi i p0i − yiP perm ) (13)
where kov,i is the global membrane mass transfer coefcient, thatcombines theresistancedueto thediffusive transportin thebound-ary layer with the membrane resistance [9]:
1kov ,i
=1
Q memb,i+
i p0i V mol,i
K bl(14)
For laminar owand Graetznumber [d2int
v / (Dm L)] much greaterthan one, themasstransfercoefcientfor transportin theboundarylayer, K bl , is determined by the Lévêque correlation [53]:
Sh = 1.62Re0.33Sc 0.33 dint L
0.33(Re < 2300) (15)
where Sh =K bldint /Dm , Re= dint / and Sc = /( Dm) are the Sher-wood, Reynolds and Schmidt numbers, respectively, Dm is thesolute diffusivity in the boundary layer, dint is the inside diameterof the membrane, L is the membrane length, is the density and
is the viscosity. The accuracy of the Lévêque correlation to esti-mate the mass transfer coefcient in the laminar regime has beenvalidated experimentally by several works [11,54]. The predictionof the solute diffusivity was made using the Perkins and Geanko-plis method [55]. Further details concerning its calculation can befound in a previous work [56].
Finally, the mole fraction of component i on the vapor phase(permeate side), yi, is dened as:
yi = J ini= 1 J i
(16)
Fluid velocity variation in the membrane feed side calculated from thetotal mass balance
dv
dz = − Am
n
i= 1
J iV mol,i (17)
where n is the total number of components.
Retentate heat balancen
i= 1
C p,i C ret,i∂T ∂t
+
n
i= 1
v C p,i C ret,i∂(T )∂z
+ Am hF (T − T m ) = 0 (18)
where C p,i is the liquid heat capacity of component i, T is theabsolute temperature in the feed side of the membrane, T m is themembrane absolute temperature, and hF is the heat transfer coef-cient in the liquid boundary layer.
Membrane heat balance
dint
(r int + ı/ 2)2 − r 2int
hF (T − T m) =dint + ı
(r int + ı/ 2)2 − r 2int
n
i= 1
H V i J i (19)
where r int istheinternalradiusofthemembrane, ı isthemembranethickness,and H V
i is theheat ofvaporizationof species i.Theheattransport coefcient was estimated by the Sieder-Tate correlation,valid for laminar pipe ow [57]:
Nu = 1.86 RePr dint
L
0.33b
w
0.14(20)
where Nu = hF dint / ,Pr = C p,i / aretheNusseltandPrandtlnum-bers, respectively, b and w are the viscosity of the liquid in thefeed and in the membrane wall, respectively, and is the thermalconductivity.
50 C.S.M. Pereira et al. / Journal of Membrane Science 361 (2010) 43–55
V = V 0 (21b)
T = T F (21c)
z = 0 : T = T F (22a)v = v F (22b)
C ret,i = C f,i (22c)
where subscripts 0 and F refer to initial state and membrane feedconditions, respectively.
4.2. Pervaporation membrane reactor model
A mathematical model was also developed to describe thebehaviour of the tubular pervaporation membrane reactor thatsimilarly to the BPM model considers:
- Concentration polarization, where the resistance due to the dif-fusive transport in the boundary layer is combined with themembrane resistance in a global membrane resistance.
- Temperature polarization.
Additionally, it also takes in account:
- Axial dispersion ow for the bulk uid phase,- External and internal mass transfer for adsorbable species com-
bined in a global particle resistance.- Non-isothermal operation due to heat effects during species
vaporization and reaction (slightly endothermic).- Velocityvariationsduetopermeationofcomponentsandadsorp-
tion/desorption rates.- Constant column length and packing porosity.
Following this assumption the PVMR model equations are:
Bulk uid mass balance to component i :
∂C i∂t
+∂(uC i)
∂z +
(1 − ε)ε
3r p
K L,i
(C i
− C p,i
) = Dax
∂
∂z C
T
∂xi
∂z −
Am
ε J
i(23)
where K L,i is the global mass transfer coefcient of the componenti, ε is thebed porosity, Dax ,and u are theaxialdispersioncoefcientand the interstitial velocity, respectively, r p is the particle radius,and C p is the average particle concentration. The calculation of theglobal masstransfer coefcient(K L)ispresentedindetailinaprevi-ouswork [56], andtheaxialdispersioncoefcient( Dax)isestimatedfromthe empiricalcorrelation [58]valid for liquids in packedbeds:
εPe p = 0.2 + 0.011Re0.48 p (24)
in which Pe p = d pu/D ax and Re p = d pu/ are the Peclet andReynolds numbers relative to particle, respectively.
The permeate ux of membrane is dened by Eq. (13) (BPMmodel).
Interstitial uid velocity variation calculated from the total mass bal-ance
dudz
= −(1 − ε)
ε3r p
n
i= 1
kL,iV mol,i (C i − C p,i ) − Am
ε
n
i= 1
J i (25)
Pellet mass balance to component i
3r p
K L,i(C i − C p,i ) = ε p∂C p,i
∂t + (1 − ε p) ∂qi
∂t − i b
1 − εr (C p,i ) (26)
where i is the stoichiometric coefcient of component i, b is thebulk density, ε p the particle porosity, qi is the average adsorbed
phaseconcentrationof species i in equilibrium with ¯C p,i ,and r isthe
kinetic rate of thechemical reaction relative to theaverage particleconcentrations in the uid phase given by [40]:
r = kc aEthaLa − aELaW /K eq
1 +NC i= 1K s,i a i
2 (27)
where kc is the kinetic constant, K s,i is the adsorption constantfor species i, K eq is the equilibrium reaction constant, and thesubscripts Eth, La, EL and W refer to ethanol, lactic acid, ethyllactateandwater, respectively.Kineticandthermodynamicparam-eters, needed in Eq. (27), were found in a previous work [40].
The multi-componentadsorption equilibriumisotherm is givenby:
qi =Q ads,i K iC p,i
1 + nl= 1K l C p,i
(28)
where Q ads,i and K i represent the total molar capacity per unit vol-ume of the resin and the equilibrium constant for component i,respectively. Theadsorption parameters were also determined in aprevious work [56].
Retentate heat balancen
i= 1C p,i C i ∂T ∂t
+
n
i= 1uC p,i C i ∂(T )∂z
+ Amε hF (T − T m) + H r b
ε r = 0
(29)
where H r is the reaction enthalpy, which is 4.28kJ/mol [40]. Itmust bementionedthat theheat of adsorption wasneglectedsincewhile some species are being adsorbed, others are being desorbed.
Theequationofthemembraneheatbalanceistheonepresentedin the BPM model (Eq. (19)).
Initial and Danckwerts boundary conditions
t = 0 : C i = C p,i = C i,0, q i = qi, 0 and T = T F (30)
z = 0 : uC i − Dax∂C i∂z
z = 0
= uC i,F (31a)
u = u0 (31b)
T = T F (31c)
z = Lc : ∂C i
∂z z = Lc
= 0 (31d)
where F and 0 refer to the feed and initial states, respectively.Theviscosities, heatcapacities, thermalconductivitiesandheats
of vaporization of pure components were calculated for eachtemperature according to the DIPPR 801 database [59]. The mix-ture heat capacity was estimated assuming linear mole fractionaverages, while the mixture density and mixture thermal conduc-tivity were estimated assuming linear mass fraction averages. The
methods used to predict binaryandmulti-componentmixture vis-cosities were presented in detail in a previous work [56].
4.3. Numerical solution
The above model equations were solved numerically using thegPROMS-general PROcess Modelling System version: 3.0.3. Themathematical model involves a system of partial and algebraicequations (PDAEs). The axial domain was discretized using thirdorder orthogonal collocation in nite elements method (OCFEM).Tennite elements permodule with twocollocationpoints in eachelement were used. The system of ordinary differential and alge-braicequation (ODAEs) wasintegratedover time using theDASOLVintegrator implementation in gPROMS. For all simulations a toler-ance equal to 10− 5 was xed.
C.S.M. Pereira et al. / Journal of Membrane Science 361 (2010) 43–55 51
Fig.11. Experimental waterpermeation ux as a functionof waterpermeation uxdetermined by the BPM model with the K bl estimated (Lévêque correlation) and K bldetermined from experimental data.
5. Results and discussion
5.1. Batch pervaporation
Within the mathematical model proposed for the batch perva-poration, the mass transfer coefcient in the boundary layer is, forall the species, estimated through the Lévêque correlation. How-ever, its accuracy should be validated experimentally. In Section3.4.3, the boundary layer mass transfer coefcients, for water andethanol, weredeterminedfromthe experimental data(Eqs. (8) and(9)), and will be applied in the BPM model. The water permeationuxeswerecalculatedeitherbyusingtheexperimentalmasstrans-fer coefcient in the boundary layer (Eqs. (8) and (9)) or using the
Lévêque correlation (Eq. (15)). As can be observed in Fig. 11, thereis a good agreementbetween thewaterpermeation uxestimatedusing theexperimental mass transfer coefcient with theone usingthe Lévêque correlation, proving its accuracy in the prediction of the boundary layer mass transfer coefcients. Besides, small devi-ations are observed between the experimental uxes and the onesdetermined by the BPM model.
In order to validate the BPM non-isothermal model, the dehy-dration of ethanol andethyl lactate aqueous solutionswas studied.The evolution of water mole fraction in the retentate stream is inagreement with the experimental data: for both ethanol and ethyllactate cases theretentate compositionafter15and10 min, respec-tively, is similar to the theoretical values, as shown in Fig. 12. In
terms of temperature drop, experimentally it was not observedany temperature variation for ethanol dehydration, while it hasdropped 2 ◦ C for the experiment with ethyl lactate. According tothe simulation it would be expected a decrease of 2 and 4 ◦ C forethanol and ethyl lactate dehydrations, respectively.
5.2. Pervaporation membrane reactor
The performance of the pervaporation membrane reactor unit,packed with A15-wet resin in the lumen side of the tubular mem-branes (where the active layer of the silica membranes is placed)
was evaluated by simulation. It was considered that the resin wasinitiallysaturatedwithethanoland then itwas fedwitha mixtureof ethanol and 85wt.% lactic acid aqueous solution. The permeationuxes were estimated using the expressions previously obtainedin Section 3.4, and a compilation of the parameters used in thesimulations is presented in Table 3.
The PVMR unit was evaluated considering isothermal and non-isothermal operation and its performance was compared with theone of a xed bed reactor (FBR) in the same operational condi-tions. The concentration histories at the end of the PVMR and FBR,considering isothermal operation, are shown in Fig. 13. It can beobserved that the enhancement introduced by the water removalthrough the membranes is signicant for the ethyl lactate produc-tion, where a 69% lactic acid conversion was achieved in the PVMR
unit, at the steady state, while in the FBR the conversion obtainedwas just 29%.Considering, alternatively, a non-isothermal operation (see
Fig. 14(b)), the lactic acid conversion at steady state of the FBR isabout 29%, much better than 11% found for the PVMR (Fig. 14(a)).This low performance of the PVMR is due to the temperature dropnoticed in the bulk, around 36 ◦ C, while only 2◦ C was noticed forthe FBR (Fig. 14(a) and (b), respectively). This slightly decrease inthe FBR is due to the heat needed to the reaction only (endother-micreaction),while forthe PVMR there is a largeheat consumptionto vaporize the species. Since the owrate is very small, the heatcapacitance provided by the liquid stream is low and thereforeits temperature is drastically decreased, leading to lower reaction
Fig. 12. Evolution of water composition on retentate and temperature predicted by the non-isothermal BPM model: (a) dehydration of 81% of ethanol in aqueous solution
at 336 K; (b) dehydration of 44% of ethyl lactate in aqueous solution at 344 K.
52 C.S.M. Pereira et al. / Journal of Membrane Science 361 (2010) 43–55
Fig. 13. Concentration histories at the reactor outlet considering isothermal operation: (a) PVMR; (b) FBR.
Fig. 14. Concentration and temperature histories at the reactor outlet considering non-isothermal operation: (a) PVMR; (b) FBR.
kinetic rates,highermass transfer resistancesandlowerwaterper-meation uxes through the membranes.
Clearly, to operate the PVMR for efcient ethyl lactate produc-tion, it is necessary to provide the heat required for vaporizationand reaction, operating in isothermal conditions. As stated before,the silica membranes used in this work have the selective layercoatedinside themembrane tube.Therefore, themostsuitablewayto supplyheat to theretentate liquid is introducing a heatedsweepgas in the permeate side instead of using vacuum. However, whenthe membrane selective layer is coated on the external side of themembrane tube (shell side), the heat can be supplied through anappropriate heated solution re-circulated through jacketed mod-ules; in this situation, theheatis rapidly transferredto theretentateliquid stream.
Assuming that the PVMR unit could operate isothermally, it ispossible to determine by simulation the number of membranesconnected in series needed to maximize the lactic acid conversionof thesame feed processedbefore. Foran operatingtemperature of 50 ◦ C (same conditions from Table 3), it is possible to achieve 93%of lacticacidconversion and84% ofethyl lactate purityat thePVMR
outlet at steady state ( C Eth = 0.65mol/L; C LA = 0.62 mol/L; C EL =7.67mol/L; C W = 0.23mol/L) when using a 250cm long mem-brane reactor (ve tubular membranes, effective area of about550cm2). Trying to further enhance the separation performance,as well as the reaction rate, the PVMR temperature was increasedto 70 ◦ C. In this case, it was obtained a lactic acid conversion of 98% and an ethyl lactate purity of 96% (C Eth = 0.21mol/L; C LA =
0.14mol/L; C EL = 8.02mol/L; C W = 0.02mol/L). From the analy-sis of the internal concentration proles on the retentate side,shown in Fig. 15, it is concluded that using only two membranes itis possible to get about 90% of lactic acid conversion, but only 82%of ethyl lactate purity; being necessary three more membranes tomaximize both lactic acid conversion and ethyl lactate purity.
These results demonstrate that the PVMR has a great potential
for the ethyl lactate production, where high conversions and puri-
These results demonstrate that the PVMR has a great potentialfor the ethyl lactate production, where high conversions and puri-tiescanbeobtained,whenthisreactorisoperatedunderisothermalconditions. Since PVMR integrates the reaction andseparation intoa single device, it is necessary to nd the operating conditions thatsatisfy,simultaneously,theequilibriumandkineticsofreactionandthemembrane permeation. Detailed modelsshouldbe used for theappropriate design of a continuous tubular PVMR unit, from lab-oratory to industrial scale, since simplied models might lead tounder-sized units. As example, Fig. 16 shows the inuence of thespace time on the lactic acid conversion, for two different ratiosbetween membrane length and diameter, with and without takinginto account the membrane concentration polarization effects. Ascan be seen, the concentration polarization effects decrease signif-
Fig. 15. Concentration proles at steady state at 343.15K.
C.S.M. Pereira et al. / Journal of Membrane Science 361 (2010) 43–55 53
Fig.16. Lacticacid conversion at steadystateas functionof thespacetimewithandwithout taking into account the concentration polarization effects, for a membranelength of 1 m.
icantly the reactor performance. For L/D=143 and a space time of about16min, theconcentration polarizationeffectreduces thelac-
tic acid conversion from 91 to 69%.Setting the conversion and feedthroughput, the simplied model leads to a membrane length half of the one really necessary.
6. Conclusions
Commercial hydrophilic silica membrane from Pervatech BV(The Netherlands) was evaluated for the dehydration of ethanol,ethyl lactate and lactic acid, in the temperature range from 48 to72 ◦ C.Firstpervaporationstudiesindicatethatthemembraneshaveno major imperfections since the total ux and water selectivityis barely affect by absolute feed pressure. The inuence of hydro-dynamic conditions on the membrane polarization was analyzed,andforvelocityvalueshigher than 0.14 m/spolarizationeffects are
eliminated. The effect of feed temperature and composition on thepervaporation performance was evaluated by batch experiments.It was concludedthat themicroporous silicamembraneshave highux and high selectivity for water, while ethanol and ethyl lac-tate permeation is reduced and lactic acid does not permeate atall. In summary, the permeances for all species through the micro-porous silica membranes, as a function of temperature and feedwater content, are described by:
Q memb,Eth = 2.36 × 10− 12 exp 22.60 × 10³
RT (mol/(sm2 Pa))
Q memb,LA = 0(mol/(sm2 Pa))
Q memb,EL = 1.99 × 10− 9 exp 10.42 × 10³
RT (mol/(sm2 Pa))
Q memb,W = 3.278 × 10− 11 exp(18.64 xW ) exp
× −50377 xW − 32326
RT (mol/(sm2 Pa))
A mathematical model was developed for the batch perva-poration membrane, considering (i) plug ow for the bulk uidphase; (ii) total feed volume inside the tank and retentate velocityinside the membrane variations due to permeation of compo-nents; (iii) concentration polarization, where the resistance dueto the diffusive transport in the boundary layer is combined with
the membrane resistance in a global membrane resistance; (iv)
non-isothermal operation due to heat consumption for speciesvaporization; and (v) temperature polarization. The batch per-vaporation membrane model was validated experimentally and,therefore, it was extended to the integrated pervaporation mem-brane reactor packed with the catalyst Amberlyst-15wet. Thismodel was used to evaluate the performance of the PVMR in bothisothermal and non-isothermal conditions. It was concluded thatnon-isothermal operation worsens the performance of the PVMR,being even worse than that obtained in the xed bed reactor. Inisothermal conditions, the PVMR is a very attractive solution lead-ingtoa lacticacid conversion of90%and ethyl lactate purityof 82%,for the PVMR setup designed in this work (100cm of length, twomembrane modules) operating at 70 ◦ C. For near lactic acid deple-tion (98% conversion), it is produced ethyl lactate with 96% purityif the membrane modules has 250cm (ve membranes in series),as indicated by the model predictions. The PVMR model will be animportant tool in the design (membrane area, amount of catalyst),andoptimization,ofan industrial pervaporationmembranereactorplant for the ethyl lactate production.
Acknowledgments
The authors would like to thank Pervatech Company for thetechnical support. Carla S.M. Pereira gratefully acknowledges toFundac ão para a Ciência e a Tecnologia (FCT, Portugal) the PhDResearch Fellowships SFRH/BD/23724/2005. This work was alsosupported by the project PPCDT/EQU/61580/2004 (FCT, Portugal).
Appendix A. Supplementary data
Supplementary data associated with this article canbe found, inthe online version, at doi:10.1016/j.memsci.2010.06.014.
Nomenclature
Am
membrane area per unit membrane modules vol-ume (m2/m3)
C liquid phase concentration (mol/m3)C f liquid phase concentration in the thank (mol/m3)C p average particle concentration (mol/m3
particle)C p liquid heat capacity (J/(molK))C ret liquid phase concentration in the retentate (mem-
brane feed side) (mol/m3)Dax axial dispersion coefcient (m2/s)df lm thickness ( m)dint internal diameter of the membrane (m)Dm solute diffusivity in the boundary layer (m2/s)E D activation energy of diffusion (J/mol)E perm activation energy of permeation (J/mol)
hF heat transfercoefcientin the liquid boundary layer(W/K)H s heat of adsorption (J/mol)H V heat of vaporization (J/mol)H r enthalpy of reaction (J/mol)
J permeate ux (mol/(m2 s)) J tot total permeate ux (mol/(m2 s))K bl boundary layer mass transfer coefcient (m/s)kc kinetic constant (mol/(kgs))K eq equilibrium reaction constantK i Langmuir equilibrium constant (m3/mol)K L global mass transfer coefcientkov global membrane mass transfer coefcient
54 C.S.M. Pereira et al. / Journal of Membrane Science 361 (2010) 43–55
K s adsorption constant in Eq. (27) thicknessoftheselectivelayerofthemembrane(m)
L column length (m)n total number of componentsNu NusseltP permeability coefcient (mol/(ms Pa)) p0 saturation pressure (s)Pe p Peclet number relative to particleP perm total pressure on the permeate side (s)Pr Prandtlq solid phase concentration in equilibrium with the
uid concentration inside the particle (mol/m3)Q ads total molar capacity per unit volume of resin
(mol/m3)Q memb permeance (mol/(m2 sPa))Q memb ,0 pre-exponential factor (mol/(m2 sPa))Q f owrate fed to the membrane modules (m3/s)Q ret owrate at the exit of the membrane modules
(m3/s)r rate of reaction (mol/(kgs))R ideal gas constant (J/(molK))r int internal radius of the membrane (m)r p particle radius (m)d p particle diameter (m)Re ReynoldsRe p Reynolds number relative to particleSc SchmidtSh Sherwoodt time variable (s)T absolute temperature in the feed side of the mem-
brane (K)T m absolute membrane temperature (K)u interstitial velocity (m/s)V volume of the feed thank (m3)v supercial velocity (m/s)
V mol molar volume (m3/mol)w mass fraction
xi liquid mole fraction of component i in the feed side yi mole fraction in the vapor phase of component i z axial coordinate at the membrane modules (m)
Greek letters i activity coefcient of component i
ε bulk porosityε p particle porosity
i stoichiometric coefcient of component ib bulk density (kg/m3 bed)
SubscriptsF feedi component i (i = Eth, La, EL, W)0 initial conditionsPerm permeateEth ethanolLa lactic acidEL ethyl lactateW water
References
[1] R.Y.M. Huang, R. Pal, G.Y. Moon, Crosslinked chitosan composite membranefor the pervaporation dehydration of alcohol mixtures and enhancement of structural stability of chitosan/polysulfone composite membranes, J. Membr.Sci. 160 (1999) 17–30.
[2] V. Van Hoof, C. Dotremont, A. Buekenhoudt, Performance of Mitsui NaA typezeolite membranes for the dehydration of organic solvents in comparisonwith commercial polymeric pervaporation membranes, Sep. Purif. Technol. 48(2006) 304–309.
[3] P.D.Chapman,T. Oliveira,A.G. Livingston,K. Li,Membranesfor thedehydrationof solvents by pervaporation, J. Membr. Sci. 318 (2008) 5–37.
[4] C. Casado, A. Urtiaga, D. Gorri, I. Ortiz, Pervaporative dehydration of organicmixturesusingacommercialsilicamembrane:determinationofkineticparam-eters, Sep. Purif. Technol. 42 (2005) 39–45.
[5] L. Lin, Y. Zhang, Y. Kong, Recent advances in sulfur removal from gasoline bypervaporation, Fuel 88 (2009) 1799–1809.
[6] B. Smitha, D. Suhanya, S. Sridhar, M. Ramakrishna, Separation of organic–organic mixtures by pervaporation – a review, J. Membr. Sci.241 (2004) 1–21.
[7] T. Ohshima, T. Miyata, T. Uragami, Selective removal of dilute benzene fromwater by various cross-linked poly(dimethylsiloxane) membranes containingtert -butylcalix[4]arene, Macromol. Chem. Phys. 206 (2005) 2521–2529.
[8] M. Khayet, C. Cojocaru,G. Zakrzewska-Trznadel,Studies on pervaporationsep-aration of acetone, acetonitrile and ethanol from aqueous solutions, Sep. Purif.Technol. 63 (2008) 303–310.
[9] J.G. Wijmans, A.L. Athayde, R. Daniels, J.H. Ly, H.D. Kamaruddin, I. Pinnau, Therole of boundary layers in the removal of volatile organic compounds fromwater by pervaporation, J. Membr. Sci. 109 (1996) 135–146.
[10] I. Ortiz, A. Urtiaga, R. Ibánez, P. Gómez, D. Gorri, Laboratory- and pilot plant-scale study on the dehydration of cyclohexane by pervaporation, J. Chem.Technol. Biotechnol. 81 (2006) 48–57.
[11] R.O. Crowder, E.L. Cussler, Mass transfer resistances in hollowber pervapora-tion, J. Membr. Sci. 145 (1998) 173–184.
[12] C. Lipski, P. Côté, The use of pervaporation for the removal of organic contam-inants from water, Environ. Prog. 9 (1990) 254–261.
[13] C. Dotremont, S. Van den Ende, H. Vandommele, C. Vandecasteele, Concen-tration polarization and other boundary layer effects in the pervaporation of chlorinated hydrocarbons, Desalination 95 (1994) 91–113.
[14] S. Bandini, A. Saavedra, G.C.Sarti, Vacuum membranedistillation: experimentsand modeling, AIChE J. 43 (1997) 398–408.
[15] A.M. Urtiaga, E.D. Gorri, J.K. Beasley, I. Ortiz, Mass transfer analysis of the per-vaporative separation of chloroform from aqueous solutions in hollow berdevices, J. Membr. Sci. 156 (1999) 275–291.
[16] V. Gekas,B. Hallstrom,Mass transfer in the membraneconcentration polariza-tionlayerunder turbulentcross ow.I. Critical literaturereviewand adaptationof existing sherwood correlations to membrane operations, J. Membr. Sci. 30(1987) 153–170.
[17] F. Lipnizki, R.W. Field, Mass transfer performance for hollow bre moduleswith shell-side axial feed ow: using an engineering approach to develop aframework, J. Membr. Sci. 193 (2001) 195–208.
[18] T.A.C. Oliveira, U. Cocchini, J.T. Scarpello, A.G. Livingston, Pervaporation masstransfer with liquid ow in the transition regime, J. Membr. Sci. 183 (2001)119–133.
[19] E. Favre, Temperature polarization in pervaporation, Desalination 154 (2003)129–138.
[20] H.O.E. Karlsson, G. Trägardh, Heat transfer in pervaporation, J. Membr. Sci. 119(1996) 295–306.
[21] Y. Zhu, R.G. Minet, T.T. Tsotsis, A continuous pervaporation membrane reactorfor the study of esterication reactions using a composite polymeric/ceramicmembrane, Chem. Eng. Sci. 51 (1996) 4103–4113.
[23] B.G. Park, T.T. Tsotsis, Models and experiments with pervaporation membranereactors integrated with an adsorbent system, Chem. Eng. Process. 43 (2004)1171–1180.
[24] S.Y. Lim, B. Park, F. Hung, M. Sahimi, T.T. Tsotsis, Design issues of perva-poration membrane reactors for esterication, Chem. Eng. Sci. 57 (2002)4933–4946.
[25] X. Feng,R.Y.M. Huang,Studies of a membrane reactor: esterication facilitatedby pervaporation, Chem. Eng. Sci. 51 (1996) 4673–4679.
[26] M.T. Sanz, J. Gmehling, Esterication of acetic acid with isopropanol coupledwith pervaporation. Part II. Study of a pervaporation reactor, Chem. Eng. J. 123(2006) 9–14.
[27] Ó. de la Iglesia, R. Mallada, M. Menéndez, J. Coronas, Continuous zeolite mem-brane reactor for esterication of ethanol and acetic acid, Chem. Eng. J. 131(2007) 35–39.
[28] P. Gómez, R. Aldaco, R. Ibánez, I. Ortiz, Modeling of pervaporation pro-cessescontrolled by concentrationpolarization,Comput. Chem.Eng. 31 (2007)1326–1335.
C.S.M. Pereira et al. / Journal of Membrane Science 361 (2010) 43–55 55
[31] K. Wasewar, S. Patidar, V.K. Agarwal, Esterication of lactic acid with ethanolin a pervaporation reactor:modelingandperformance study,Desalination243(2009) 305–313.
[32] D. Rathin, T. Shih-Perng, Esterication of fermentation-derived acids via per-vaporation, US Patent No. 57236391998.
[33] J.J. Jafar, P.M. Budd, R. Hughes, Enhancement of esterication reaction yieldusing zeolite A vapour permeation membrane, J. Membr. Sci. 199 (2002)117–123.
[34] K. Tanaka, R. Yoshikawa, C. Ying, H. Kita, K.I. Okamoto, Application of zeolite Tmembraneto vapor-permeation-aidedestericationof lactic acidwith ethanol,Chem. Eng. Sci. 57 (2002) 1577–1584.
[35] P. Delgado, M.T. Sanz, S. Beltrán, Pervaporation study for different binary mix-turesin theestericationsystem of lacticacid withethanol,Sep. Purif.Technol.64 (2008) 78–87.
[36] P. Delgado, M.T. Sanz, S. Beltrán, Pervaporation of the quaternary mixturepresent during the esterication of lactic acid with ethanol, J. Membr. Sci. 332(2009) 113–120.
[37] S. Sommer, T. Melin, Performance evaluation of microporous inorganic mem-branesin thedehydration of industrial solvents,Chem.Eng. Process. 44 (2005)1138–1156.
[38] J.G.Wijmans,R.W. Baker,The solution-diffusionmodel: a review, J.Membr. Sci.107 (1995) 1–21.
[39] Y. Ma, J. Wang, T. Tsuru, Pervaporation of water/ethanol mixturesthrough microporous silica membranes, Sep. Purif. Technol. 66 (2009)479–485.
[40] C.S.M.Pereira,S.P.Pinho, V.M.T.M. Silva,A.E. Rodrigues,Thermodynamic equi-librium and reaction kinetics for the esterication of lactic acid with ethanolcatalyzedbyacidionexchangeresin,Ind.Eng.Chem.Res.47(2008)1453–1463.
[41] C.L. Yaws, Chemical Properties Handbook, McGraw-Hill, New York, 1999.[42] C.S.Slater, T. Schurmann,J. MacMillian,A. Zimarowski,Separation of diacteone
alcohol–water mixtures by membrane pervaporation, Sep. Sci. Technol. 41(2006) 2733–2753.
[44] J.M. Smith, H.C.V. Ness, Introduction to Chemical Engineering Thermodynam-ics, 4th ed., McGraw-Hill Book Co., New York, 1987.
[45] M. Pera-Titus, J. Llorens, F. Cunill, On a rapid method to characterize intercrys-talline defects in zeolite membranes using pervaporation data, Chem. Eng. Sci.63 (2008) 2367–2377.
[46] F. Bruijn, J. Gross, Z. Olujic, P. Jansens, F. Kapteijn, On the driving force omethanol pervaporation through a microporous methylated silica membrane,Ind. Eng. Chem. Res. 46 (2007) 4091–4099.
[47] J.E. ten Elshof, C.R. Abadal, J. Sekulic, S.R. Chowdhury, D.H.A. Blank, Transpmechanisms of water and organic solvents through microporous silica in thepervaporationof binary liquids, Micropor.Mesopor.Mater.65 (2003)197–208.
[48] A.W. Verkerk, P. Van Male, M.A.G. Vorstman, J.T.F. Keurentjes, Description ofdehydration performance of amorphous silica pervaporation membranes, J.
Membr. Sci. 193 (2001) 227–238.[49] T. Morimoto, M. Nagao, J. Imai, Interaction between water and hydroxylatedsurface of silica-alumina, Bull. Chem. Soc. Jpn. 47 (1974) 2994–2997.
[50] A. Chakraborty, B.B. Saha,S. Koyama, Adsorptionthermodynamics of silicagel-water systems, J. Chem. Eng. Data 54 (2009) 448–452.
[51] R.W.Baker, J.G.Wijmans, Y. Huang, Permeability, permeanceand selectivity:apreferredway of reportingpervaporationperformance data,J. Membr. Sci.348(2010) 346–352.
[52] M. Yu, J.L.Falconer, R.D.Noble, Characterizingnon-zeolitic porevolume in zeo-lite membranesby temperature-programmed desorption, Micropor. Mesopor.Mater. 113 (2008) 224–230.
[53] M.A. Lévêque, Les lois de transmission de chaleur par convection, Ann. Mines13 (1928) 201.
[54] S.R. Wickramasinghe, M.J. Semmens, E.L. Cussler, Mass transfer in various hollow ber geometries, J. Membr. Sci. 69 (1992) 235–250.
[55] L.R.Perkins,C.J.Geankoplis, Moleculardiffusionin a ternaryliquid system withthe diffusing component dilute, Chem. Eng. Sci. 24 (1969) 1035–1042.