New Mo-Fe-O silica supported catalysts for methanol to formaldehyde oxidation Ana Paula Soares Dias a, *, V.V. Rozanov b,1 , Joa ˜o Carlos Bentes Waerenborgh c , Manuel Farinha Portela a a ICEMS-GRECAT, Technical University of Lisbon, Instituto Superior Te ´cnico, Avenida Rovisco Pais, s/n, 1049-001 Lisboa, Portugal b N. N. Semenov Institute of Chemical Physics, Russian Academy of Sciences, Kosygin St., 4, Moscow 117977, Russia c Instituto Tecnolo ´gico e Nuclear, Departamento de Quı´mica/CFMC-UL, Estrada Nacional 10, 2686-953 Sacave ´m, Portugal 1. Introduction Formaldehyde is an important building block for complex chemicals that is produced from methanol by two main processes [1,2]: (1) Dehydrogenation of methanol rich air mixture over silver catalysts. (2) Oxidation of methanol over iron molybdate (Mo-Fe-O) based catalysts. Hybrid processes are also used in industry. The Mo-Fe-O catalysts based process is advantageous because the reaction can be carried out at comparatively lower tempera- tures (350–375 8C). The high exothermicity (159 kJ/mol [3]) of the main reaction leads to the formation of hot spots in the catalyst bed, which contributes to the fast deactivation of the catalyst by MoO 3 sublimation [4–7]. Methanol oxidation over Mo-Fe-O catalysts is carried out using fixed bed reactors. Some authors proposed the use of fluidized bed reactors because such reactors present the advantage of mini- mization of the hot spots of the catalytic bed [8]. Additionally, other advantages such as decrease of the explosion risk, handling of the catalyst deactivation without interrupting the operation, and increase of production capacity are also referred. Due to weak resistance to mechanical abrasion, unsupported Mo-Fe-O catalysts cannot be used in fluidized bed reactors [8]. Thus, some authors have studied Mo-Fe-O mixed oxides supported Applied Catalysis A: General 345 (2008) 185–194 ARTICLE INFO Article history: Received 17 December 2007 Received in revised form 28 April 2008 Accepted 29 April 2008 Available online 3 May 2008 Keywords: Supported catalysts Iron molybdates Silica Methanol oxidation Formaldehyde Iron phosphates ABSTRACT Silica supported Mo-Fe and Mo-Fe-P mixed oxides (Mo/Fe = 3 atomic ratio) were prepared in the presence of citric acid as chelating agent to obtain a uniform distribution of the active phase. Loading of 23.1% (w/w) of MoO 3 was used exceeding the monolayer content (around 2.2 monolayers of MoO 3 ). The low interaction between the silica and the mixed oxide in addition to the high content of the active phase led to a three-dimensional distribution of the active phase, confirmed by SEM. Several iron (Fe 3+ ) precursors (nitrate, chloride, sulfate, phosphate and pyrophosphate) were used in order to assess their effect on the catalysts performances. Some elements (N, Cl, S and P) from the iron precursors remained in the catalyst. Samples prepared from phosphate and pyrophosphate had phosphorus in their compositions and Mo ¨ ssbauer spectra revealed the presence of iron phosphate. Nevertheless, due to lack of crystallinity, these phases (iron phosphates) are probably inactive. All the prepared catalysts display high activity and selectivity towards formaldehyde, even for low and high methanol conversions. The catalyst prepared from iron pyrophosphate was the most active. The presence of heteropolymolybdates, containing phosphorus, or its Mo rich surface can perhaps explain its enhanced catalytic behavior. For temperatures lower than 625 K this sample (merely 26.2% (w/w) of active phase) presented higher formaldehyde yields than one unsupported industrial catalyst. Such a catalyst prepared from iron pyrophosphate presents promising catalytic performances for use in fluidized bed reactors. The loss of Mo during reaction was observed for all the prepared catalysts. Micrographs for post reaction samples displayed MoO 3 needles (or plates) formed during the redox cycle, which are easily sublimated. Conversely, for the sample prepared from iron pyrophosphate the MoO 3 needles are absent, which is probably indicative of a different reaction mechanism. ß 2008 Elsevier B.V. All rights reserved. * Corresponding author. Tel.: +351 21 8417873; fax: +351 21 8499242. E-mail addresses: [email protected](A.P.S. Dias), [email protected](J.C.B. Waerenborgh), [email protected](M.F. Portela). 1 Deceased. Contents lists available at ScienceDirect Applied Catalysis A: General journal homepage: www.elsevier.com/locate/apcata 0926-860X/$ – see front matter ß 2008 Elsevier B.V. All rights reserved. doi:10.1016/j.apcata.2008.04.040
Transcript
Applied Catalysis A: General 345 (2008) 185–194
New Mo-Fe-O silica supported catalysts for methanol to formaldehyde oxidation
Ana Paula Soares Dias a,*, V.V. Rozanov b,1, Joao Carlos Bentes Waerenborgh c, Manuel Farinha Portela a
a ICEMS-GRECAT, Technical University of Lisbon, Instituto Superior Tecnico, Avenida Rovisco Pais, s/n, 1049-001 Lisboa, Portugalb N. N. Semenov Institute of Chemical Physics, Russian Academy of Sciences, Kosygin St., 4, Moscow 117977, Russiac Instituto Tecnologico e Nuclear, Departamento de Quımica/CFMC-UL, Estrada Nacional 10, 2686-953 Sacavem, Portugal
A R T I C L E I N F O
Article history:
Received 17 December 2007
Received in revised form 28 April 2008
Accepted 29 April 2008
Available online 3 May 2008
Keywords:
Supported catalysts
Iron molybdates
Silica
Methanol oxidation
Formaldehyde
Iron phosphates
A B S T R A C T
Silica supported Mo-Fe and Mo-Fe-P mixed oxides (Mo/Fe = 3 atomic ratio) were prepared in the
presence of citric acid as chelating agent to obtain a uniform distribution of the active phase. Loading of
23.1% (w/w) of MoO3 was used exceeding the monolayer content (around 2.2 monolayers of MoO3). The
low interaction between the silica and the mixed oxide in addition to the high content of the active phase
led to a three-dimensional distribution of the active phase, confirmed by SEM.
Several iron (Fe3+) precursors (nitrate, chloride, sulfate, phosphate and pyrophosphate) were used in
order to assess their effect on the catalysts performances.
Some elements (N, Cl, S and P) from the iron precursors remained in the catalyst. Samples prepared
from phosphate and pyrophosphate had phosphorus in their compositions and Mossbauer spectra
revealed the presence of iron phosphate. Nevertheless, due to lack of crystallinity, these phases (iron
phosphates) are probably inactive.
All the prepared catalysts display high activity and selectivity towards formaldehyde, even for low and
high methanol conversions. The catalyst prepared from iron pyrophosphate was the most active. The
presence of heteropolymolybdates, containing phosphorus, or its Mo rich surface can perhaps explain its
enhanced catalytic behavior. For temperatures lower than 625 K this sample (merely 26.2% (w/w) of
active phase) presented higher formaldehyde yields than one unsupported industrial catalyst. Such a
catalyst prepared from iron pyrophosphate presents promising catalytic performances for use in
fluidized bed reactors.
The loss of Mo during reaction was observed for all the prepared catalysts. Micrographs for post
reaction samples displayed MoO3 needles (or plates) formed during the redox cycle, which are easily
sublimated. Conversely, for the sample prepared from iron pyrophosphate the MoO3 needles are absent,
which is probably indicative of a different reaction mechanism.
6-860X/$ – see front matter � 2008 Elsevier B.V. All rights reserved.
10.1016/j.apcata.2008.04.040
Hybrid processes are also used in industry.The Mo-Fe-O catalysts based process is advantageous because
the reaction can be carried out at comparatively lower tempera-tures (350–375 8C). The high exothermicity (159 kJ/mol [3]) of themain reaction leads to the formation of hot spots in the catalyst bed,which contributes to the fast deactivation of the catalyst by MoO3
sublimation [4–7].Methanol oxidation over Mo-Fe-O catalysts is carried out using
fixed bed reactors. Some authors proposed the use of fluidized bedreactors because such reactors present the advantage of mini-mization of the hot spots of the catalytic bed [8]. Additionally,other advantages such as decrease of the explosion risk, handlingof the catalyst deactivation without interrupting the operation,and increase of production capacity are also referred.
Due to weak resistance to mechanical abrasion, unsupportedMo-Fe-O catalysts cannot be used in fluidized bed reactors [8].Thus, some authors have studied Mo-Fe-O mixed oxides supported
A.P.S. Dias et al. / Applied Catalysis A: General 345 (2008) 185–194186
over materials (Al2O3, SiO2) with satisfactory mechanical resis-tance. Published results showed that supported catalysts are lessactive than unsupported catalysts [8–12]. The interaction betweenthe support material and the active phase (Mo-Fe-O) is pointed outas the major reason.
The reported results show that the increase of support materialsurface area has a negative effect on the catalytic behavior of thesupported iron molybdate catalyst. This effect is more pronouncedfor alumina than for silica. This result led Cairati et al. [9] toconclude that silica and alumina interact differently with Mo-Fe-Ophase. An analogous result was reported by Hill and Wilson [12].They observed different Raman spectra for iron molybdatessupported over silica and over alumina. For silica the spectrawere more similar to that of the unsupported Mo-Fe-O mixedoxide. The same authors concluded that the interaction support/Mo-Fe-O was stronger for alumina. In fact, the formation of[Al(OH)6Mo6O18]3� Anderson type ions during impregnation ofalumina with Mo solution was reported [13]. Also Carbucicchio[14] reported the formation of Al2(MoO4)3, with iron in interstitialpositions, when alumina was used as the support material. Thisoccurrence would be responsible for catalysts with Fe rich surfaces.More recently Trifiro et al. [15] reported the formation of two typesof interfacial compounds (Fe(III) dissolved in alumina and Fe–Al–Mo heteromolybdate), which would contribute to lowering ofcatalytic performances, when alumina was used as the supportmaterial. Castelao-Dias et al. [16] studied several Mo-Fe-Ocatalysts using Mossbauer spectroscopy. For SiO2, SiC and TiO2
support materials they concluded that the Mo-Fe-O phase reactswith the support material and that the occurrence of such reactiondepends mainly on the surface area of the support material and isreinforced for higher surface areas.
In order to contribute to a better knowledge on the supportedMo-Fe-O catalysts, for possible fluidized bed reactor operation, theinfluence of the nature of the Fe3+ precursor, used in the catalystpreparation, was investigated. Silica was chosen as supportmaterial due to its lower interaction with the Mo-Fe-O activephase, its availability and low price. Relative high surface areasilica was used but with a high content of the active phase in orderto minimize the interaction support/active phase.
The most used synthesis route for supported catalysts involvesthe impregnation of the support material with a solution of themetal (or oxide) precursor, followed by evaporation until dry and afinal thermal treatment. Usually a poor dispersion of the activephase is obtained. Alternative approaches leading to a highdispersion of the active phase, involve either the increase of theviscosity, or very high (or low) evaporation rates of theimpregnation solution. A more effective technique is to useaqueous solutions of multidentate chelated metal complexes [17].
The use of chelating ligands, such as citric acid, to preparesupported catalysts with a more uniform distribution of the activephase is a widely accepted practice [18]. Additionally, it is reported[19] that the introduction of organic additives during preparationsteps, namely citric acid as dispersant, can influence the catalystmorphology and thus the catalyst performance.
A brief survey of the literature on the preparation of supportedMo-Fe-O catalysts is given by Hill and Wilson [12]. Twopreparation techniques are generally used:
1. in
cipient wetness; 2. s praying the support material with a solution of both Mo and Fe
precursors in the presence of citric acid.
In order to avoid the problem related to the degree ofimpregnation of Mo and Fe, the second technique was adoptedin the present work. Citric acid avoids the precipitation of Mo and
Fe during the impregnation step, producing a homogenoussolution and uniform distribution of both metal ions over thesupport material. This results from the formation of complexes(citrate type) with the metal ions. Furthermore the gases and theheat generated when burning the organic molecule (citric acid) inthe calcination step lead to the increase of surface area andenhancement of the interaction between the active phase and thesupport material.
Some modifications to the preparation protocol, referred by Hilland Wilson [12], were introduced.
2. Experimental
2.1. Preparation of the catalysts
The silica supported catalysts were prepared by contacting thesupport material (10 g of Sipernat 22 from DEGUSSA) with a hot(353 K) aqueous solution (300 cm3) of both Mo and Fe precursorsand citric acid (citric acid/(Mo + Fe) = 1 molar ratio). Ammoniumheptamolybdate was used as molybdenum precursor. Nitrate,chloride, sulfate, phosphate and pyrophosphate Fe3+ salts wereused as iron precursors.
All the catalysts were prepared with an atomic ratio Mo/Fe = 3,similar to the unsupported industrial Mo-Fe-O catalysts [2]. All theprepared samples were loaded with 23.1% (w/w) of MoO3.According to previously published results this loading correspondsapproximately to 2.2 MoO3 theoretical monolayers [20]. Suchloading was selected in order to avoid the presence of silanolgroups on the catalyst surface. In fact, published results [21]showed that commercial silica can, depending on the reactionconditions, oxidize methanol to CO, methyl formate, formaldehydeand CO2. Moreover, this amount of MoO3 is expected to avoid theformation of Fe rich catalysts surfaces since iron oxide catalyzesthe total combustion of methanol [22].
The slurry containing the support material, both Mo and Feprecursors and citric acid was heated (around 373 K) undervigorous stirring until dry. No precipitation occurred during thisstep. In fact citric acid prevents the precipitation of both Fe3+ andMo6+ ions.
The cake obtained after total evaporation of water was driedovernight at 393 K and then calcined (750 K) in a slow flow ofdry air for 5 h. The calcination temperature was chosen inagreement with the results of activation studies by thermo-gravimetry. Before calcinations the samples were crushed in apyrex mortar.
For comparison of catalytic behavior, data from an industrialcatalyst were used. Such unsupported ferric molybdate catalystwith atomic ratio Mo/Fe = 3 has characteristics similar to those ofcoprecipitated iron molybdate as reported before [23].
2.2. Characterization of the catalysts
In order to select the calcination temperature, the activationunder air of the prepared samples after the drying step was studiedby thermogravimetry in TG-DTA-DSC equipment (LabSys-SETARAM). A few milligrams (<30 mg) of powder were used foreach TG-DTA test. Alumina crucibles of 100 ml and a heating rate of10 K/min were used. The weight loss and the heat flow wererecorded for each sample from 320 K to 825 K.
The BET surface areas of the catalysts were measured with aCoulter SA 3100 apparatus. Before BET measurements the sampleswere kept at 250 8C, under primary vacuum, for 120 min. The bulkcontent of molybdenum of fresh and post reaction samples wasassessed by induced coupled plasma (ICP) with a PerkinElmerplasma 400.
Fig. 1. Rate of weight loss versus temperature (DTG) of the precursors of the
catalysts (under air; heating rate 5 K/min).
A.P.S. Dias et al. / Applied Catalysis A: General 345 (2008) 185–194 187
X-ray diffraction (XRD) patterns were recorded (0.58/min; step0.028) at room temperature with a Rigaku equipment using Cu Ka
radiation (Ni filter) at 40 kV and 30 mA.The bulk compositions of iron phases, for fresh and post
reaction catalysts samples were studied by transmission Moss-bauer spectroscopy at room temperature with a time modespectrometer, a constant acceleration drive and a 57Co in a Rhmatrix source. The isomer shifts (d) were given with respect to a-Fe at room temperature and calculated as the quadrupole splittings(D) and the line widths (W) with a precision of 0.02 mm s�1. Thespectra were fitted to Lorentzian lines using a non-linear least-squares method. The relative areas and widths of both peaks in aquadrupole doublet were kept equal during refinement.
The micro Raman spectra were collected with a Spex 1877triplemate spectrometer using the 514.5 nm line as excitingradiation.
Fresh and post reaction samples were characterized by SEM-EDX using a HITACHI S2400 scanning electron microscopeequipped with a RONTEC energy dispersive X-ray high vacuumdetector (W filament, E = 25 kV). Samples were analyzed from a15 mm working distance, with a resolution of 12 nm.
The acid properties of the catalysts were examined by NH3
thermodesorption (TPD-NH3). The experiments were performedwith a gaseous mixture of NH3 (5% (v/v)) in He. Before surfacesaturation with the probe molecule, each sample (200–300 mg)was kept under helium flow at 823 K until complete removal of theadsorbed impurities. Then the sample was cooled down to 297 Kand pulses of the adsorbing gas (NH3 + He) were introduced untilsaturation of the surface. The physisorbed species were removedby flushing with He for 30 min. The thermodesorption was thenperformed by heating the sample up to 700 K, at 10 K/min, underHe flow (1 cm3/s). The desorption process was monitored using athermal conductivity detector (TCD) of a Shimadzu gas chromato-graph.
2.3. Catalytic tests
Methanol oxidation was carried out in a conventionalcontinuous flow apparatus at atmospheric pressure. Catalyticbehavior was studied in steady state conditions. Feed mixtures (6%,v/v) were prepared by injecting liquid methanol into the air flowwith a precise Gilson 302 pump. The catalyst (0.5 g; W/F = 10 g h/molMeOH) was diluted with inert SiC (1:4, w/w) to avoid adversethermal effects and charged into a tubular pyrex reactor with athermocouple in a coaxial centered thermowell. Catalyst particlesof diameter dp < 125 mm (115 mesh sieve) were used in order tominimize the effects of internal diffusion limitations on the massand heat transfer.
The reactor outlet was kept at 403 K, to prevent condensation ofliquid products and formaldehyde polymerisation, and wasconnected to a Shimadzu GC-8A gas chromatograph with thermalconductivity detector. Two in-parallel columns, one at roomtemperature (molecular sieve 13�) for N2, O2, CO and CO2, and theother in the oven of the chromatograph (porapak T) at 443 K forHCHO, CH3OCH3 (DME), H2O, CH3OH (MeOH), HCOOCH3 (MF) andCH2(OCH3)2 (DMM), performed the separation of the reactoreffluents. Formic acid was never detected.
The average rate of methanol conversion (rMeOH) was computedconsidering plug flow:
rMeOH ¼FMeOH
WX
where FMeOH is the molar flow of methanol in the reactor fed, W theweight of the active phase (26.2% of catalyst weight), and X themethanol conversion at the reactor outlet.
3. Results and discussion
3.1. Characterization of the catalysts
3.1.1. Morphology and chemical composition
The DTG (rate of weight loss versus temperature) data ofcatalyst precursors are in Fig. 1. For all samples two main weightloss processes can be identified. They are complex because citricacid can form citrates with metals and chelates with others ligands,depending on the metal and the used precursor.
In order to avoid molybdenum loss by sublimation and decreaseof specific surface, all the prepared catalysts were calcined at750 K. In fact, for samples prepared from iron nitrate, chloride,sulfate and phosphate the weight is almost stable for thistemperature. Conversely for the sample prepared from Fepyrophosphate the last weight loss process is still in progress at750 K.
Data in Table 1 show that the iron precursor influences thesurface area of the catalysts. The sample prepared with chlorideprecursor displays the lower surface area.
The morphology of the fresh and post reaction catalysts wasassessed by SEM. According to the silica supplier (DEGUSSA),the bare support material consists of small spheroids under100 mm.
Representative micrographs, for fresh samples, are presentedin Fig. 2A. For all samples the morphology was similar to that of thesilica support. However, this support was studded with thesupported phase. Small (<10 mm) aggregates of the Mo-Fe-Ostudded over the silica spheres were discernible for all thesamples. Additionally, samples revealed plate-like crystallitesthat seem to be stuck on the silica surface. Usually plate-likecrystals forming small rosaceous aggregates are observable forstoichiometric unsupported Fe2(MoO4)3 [23]. A recent work onthe 3D architectures of the iron molybdate phase confirms theattribution of plate-like crystallites (flakes) to the Fe2(MoO4)3
phase [24].
Table 1BET surface area of fresh catalysts and Mo content, by ICP, for fresh and post
reaction catalysts
Catalyst Surface areaa (m2/g) Mo content (%, w/w)
Fresh Post reaction
Fe3+ precursor
Nitrate 90 22.4 20.8
Chloride 65 20.6 19.8
Sulfate 95 21.8 21.5
Phosphate 86 20.9 17.4
Pyrophosphate 91 19.4 16.3
a Support material Sipernat 22 (DEGUSSA) 190 m2/g.
A.P.S. Dias et al. / Applied Catalysis A: General 345 (2008) 185–194188
Micrographs of the prepared samples clearly showed theformation of three-dimensional structures for the supported activephase. The absence of monolayer-like dispersion was expectabledue to the large loading. Additionally, the monolayer dispersion ofthe active phase over the support material is believed to occurwhen there is a strong interaction between the active phase andthe support material. Taking into account that there is no suchinteraction between silica and the MoFeO active phase, amonolayer dispersion was unlikely for the prepared samples,even using a sol–gel like procedure.
The post reaction catalysts without phosphorus (Fig. 2B) exhibitMoO3 needles or/and plates representative of the molybdenumsegregation usually reported for unsupported iron molybdatecatalysts [2].
Fig. 2. (A) SEM micrographs of fresh catalysts. (B)
Schematically the structure of the active phase, fresh and postreaction, can be represented by:
After calcination the prepared catalyst samples exhibit coloursvarying from yellow-green, characteristic of the unsupported ironmolybdates [23], to blue, attributable to molybdenum phosphoruscompounds [25]. The samples prepared with iron phosphate andiron pyrophosphate were blue, showing that phosphorus remainedin the catalysts after calcinations. The post reaction samplesprepared from nitrate, chloride and sulfate iron precursorsdisplayed red/brown shades indicating the presence of Fe3+
species on the surface. This occurrence and the presence ofmolybdenum blues in the reactor bottom, for all the samplestested, point to the loss of molybdenum. In order to quantify theMo loss, the molybdenum content was evaluated by ICP for freshand post reaction samples (Table 1).
Actually ICP measurements confirm the loss of molybdenumduring reaction. Samples with phosphorus (from iron phosphate
SEM micrographs of post reaction catalysts.
Fig. 2. (Continued ).
Table 2Mo/Si, Mo/Fe atomic ratios by SEM-EDX of fresh and post reaction catalysts
Catalyst Atomic ratio
Mo/Si Mo/Fe
Fresh Post reaction Fresh Post reaction
Fe3+ precursor
Nitrate 0.3 0.5 2.8 4.0
Chloride 0.2 0.5 2.6 2.0
Sulfate 0.6 0.5 2.6 4.3
Phosphate 0.3 0.7 2.5 3.6
Pyrophosphate 0.3 0.5 10.4 7.6
A.P.S. Dias et al. / Applied Catalysis A: General 345 (2008) 185–194 189
and pyrophosphate) lose more Mo than the other samples. Thisresult is ascribable to the fact that these two samples were testedfor higher reaction temperatures than the other samples, 750 Kinstead of 725 K. In addition they remained 3 h longer on thestream. The sublimation of Mo species increases with temperatureand this process is usually identified as the major deactivationprocess [4–7,26].
The content of molybdenum in the near surface layers, for freshand post reaction samples, was also measured by EDX during SEM.Furthermore EDX analyses were also performed for other elementspresent at the catalysts surfaces. The main results are displayed inTable 2.
The results show that during reaction the molybdenummigrates to the catalyst surface. In fact, methanol oxidationproceeds via a partial reduction followed by reoxidation of theactive phase which segregates MoO3 [23,27]. The segregated MoO3
can be sublimated from the catalyst surface in reaction conditions.The corresponding Mo loss is compensated by Mo coming from thecatalyst bulk. This result is corroborated by the presence of MoO3
needles in SEM micrographs for post reaction catalysts (Fig. 2). TheMoO3 needles are only absent in the sample prepared from ironpyrophosphate, even though this sample shows the largest Moloss. The lack of MoO3 needles suggests the absence of the abovementioned reduction process. Results in Table 3 show that
phosphorus remains at the catalyst surface prepared from bothphosphorus-containing iron precursors. Both samples displaysimilar P/Mo atomic ratios according to SEM-EDX. The sampleprepared from iron pyrophosphate has a Mo-richer surface, anddisplays a lower Mo/Fe ratio after reaction as a consequence of Moloss. The sample prepared with iron phosphate exhibits a Mosurface enrichment after reaction caused by Mo segregation duringreaction.
Table 3P/Mo, Mo/Si and Mo/Fe atomic ratios by SEM-EDX for fresh and post reaction
catalysts prepared with iron phosphate and pyrophosphate
Atomic ratios
P/Mo Mo/Si Mo/Fe
Phosphate
Fresh 0.4 0.3 2.5
Post reaction 0.3 0.7 3.6
Pyrophosphate
Fresh 0.3 0.3 10.4
Post reaction 0.3 0.5 7.6
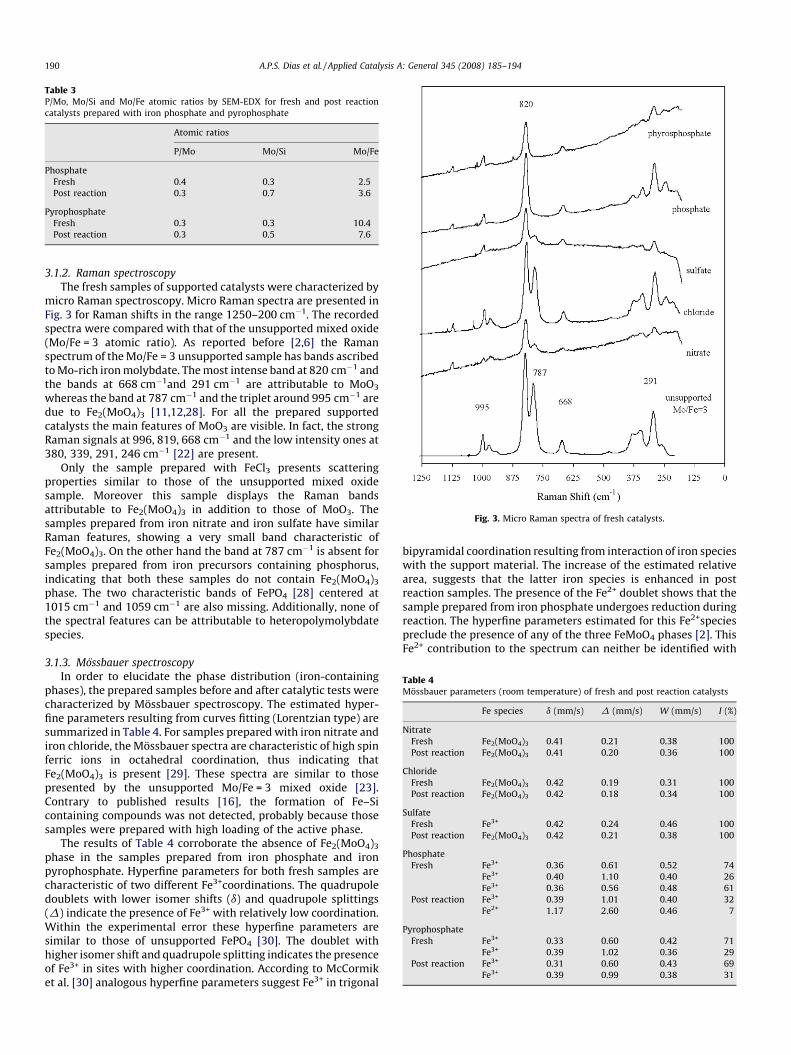
Fig. 3. Micro Raman spectra of fresh catalysts.
Table 4Mossbauer parameters (room temperature) of fresh and post reaction catalysts
Fe species d (mm/s) D (mm/s) W (mm/s) I (%)
Nitrate
Fresh Fe2(MoO4)3 0.41 0.21 0.38 100
Post reaction Fe2(MoO4)3 0.41 0.20 0.36 100
Chloride
Fresh Fe2(MoO4)3 0.42 0.19 0.31 100
Post reaction Fe2(MoO4)3 0.42 0.18 0.34 100
Sulfate
Fresh Fe3+ 0.42 0.24 0.46 100
Post reaction Fe2(MoO4)3 0.42 0.21 0.38 100
Phosphate
Fresh Fe3+ 0.36 0.61 0.52 74
Fe3+ 0.40 1.10 0.40 26
Fe3+ 0.36 0.56 0.48 61
Post reaction Fe3+ 0.39 1.01 0.40 32
Fe2+ 1.17 2.60 0.46 7
Pyrophosphate
Fresh Fe3+ 0.33 0.60 0.42 71
Fe3+ 0.39 1.02 0.36 29
Post reaction Fe3+ 0.31 0.60 0.43 69
Fe3+ 0.39 0.99 0.38 31
A.P.S. Dias et al. / Applied Catalysis A: General 345 (2008) 185–194190
3.1.2. Raman spectroscopy
The fresh samples of supported catalysts were characterized bymicro Raman spectroscopy. Micro Raman spectra are presented inFig. 3 for Raman shifts in the range 1250–200 cm�1. The recordedspectra were compared with that of the unsupported mixed oxide(Mo/Fe = 3 atomic ratio). As reported before [2,6] the Ramanspectrum of the Mo/Fe = 3 unsupported sample has bands ascribedto Mo-rich iron molybdate. The most intense band at 820 cm�1 andthe bands at 668 cm�1and 291 cm�1 are attributable to MoO3
whereas the band at 787 cm�1 and the triplet around 995 cm�1 aredue to Fe2(MoO4)3 [11,12,28]. For all the prepared supportedcatalysts the main features of MoO3 are visible. In fact, the strongRaman signals at 996, 819, 668 cm�1 and the low intensity ones at380, 339, 291, 246 cm�1 [22] are present.
Only the sample prepared with FeCl3 presents scatteringproperties similar to those of the unsupported mixed oxidesample. Moreover this sample displays the Raman bandsattributable to Fe2(MoO4)3 in addition to those of MoO3. Thesamples prepared from iron nitrate and iron sulfate have similarRaman features, showing a very small band characteristic ofFe2(MoO4)3. On the other hand the band at 787 cm�1 is absent forsamples prepared from iron precursors containing phosphorus,indicating that both these samples do not contain Fe2(MoO4)3
phase. The two characteristic bands of FePO4 [28] centered at1015 cm�1 and 1059 cm�1 are also missing. Additionally, none ofthe spectral features can be attributable to heteropolymolybdatespecies.
3.1.3. Mossbauer spectroscopy
In order to elucidate the phase distribution (iron-containingphases), the prepared samples before and after catalytic tests werecharacterized by Mossbauer spectroscopy. The estimated hyper-fine parameters resulting from curves fitting (Lorentzian type) aresummarized in Table 4. For samples prepared with iron nitrate andiron chloride, the Mossbauer spectra are characteristic of high spinferric ions in octahedral coordination, thus indicating thatFe2(MoO4)3 is present [29]. These spectra are similar to thosepresented by the unsupported Mo/Fe = 3 mixed oxide [23].Contrary to published results [16], the formation of Fe–Sicontaining compounds was not detected, probably because thosesamples were prepared with high loading of the active phase.
The results of Table 4 corroborate the absence of Fe2(MoO4)3
phase in the samples prepared from iron phosphate and ironpyrophosphate. Hyperfine parameters for both fresh samples arecharacteristic of two different Fe3+coordinations. The quadrupoledoublets with lower isomer shifts (d) and quadrupole splittings(D) indicate the presence of Fe3+ with relatively low coordination.Within the experimental error these hyperfine parameters aresimilar to those of unsupported FePO4 [30]. The doublet withhigher isomer shift and quadrupole splitting indicates the presenceof Fe3+ in sites with higher coordination. According to McCormiket al. [30] analogous hyperfine parameters suggest Fe3+ in trigonal
bipyramidal coordination resulting from interaction of iron specieswith the support material. The increase of the estimated relativearea, suggests that the latter iron species is enhanced in postreaction samples. The presence of the Fe2+ doublet shows that thesample prepared from iron phosphate undergoes reduction duringreaction. The hyperfine parameters estimated for this Fe2+speciespreclude the presence of any of the three FeMoO4 phases [2]. ThisFe2+ contribution to the spectrum can neither be identified with
Fig. 4. XRD patterns of fresh catalysts prepared from chloride and phosphorus
containing precursors and unsupported industrial like catalyst (Mo/Fe = 3 atomic
ratio).
Fig. 5. XRD patterns of fresh and post reaction catalyst prepared from iron
phosphate.
Fig. 6. NH3 TPD of fresh catalysts and support.
A.P.S. Dias et al. / Applied Catalysis A: General 345 (2008) 185–194 191
the mixed valence iron (Fe2+ + Fe3+) containing phase found byMillet et al. [31] in iron phosphate catalysts after dehydrogenationof isobutyric acid. This Fe2+ may be rather related with the fact thatthe prepared supported Fe-P-O phase was amorphous. Amorphousand crystalline FePO4 catalysts present different reductionbehaviors [32]. On the other hand hyperfine parameters for thoseFe2+ species are analogous to those presented by Huynh and Millet[33] for iron substituted Keggin type phosphomolybdic com-pounds. However, the same is not observed for the Fe3+ species.
For the remaining samples the reduction of iron phases duringreaction was not detected by Mossbauer spectroscopy. Further-more hyperfine parameters for the sample prepared from ironsulfate seems to reveal an increase of crystallinity of theFe2(MoO4)3 phase during reaction.
3.1.4. X-ray diffraction
The main features of XRD patterns for fresh catalysts arepresented in Fig. 4. The samples prepared from iron nitrate,chloride and sulfate show XRD patterns characteristic of poorlycrystallized Mo-rich iron molybdate (unsupported MoFeO patternof Fig. 4). The sample prepared from iron chloride displays thehighest crystallinity. XRD lines for these samples are broader thanthose of the unsupported phase probably due to the crystallitessize.
The XRD data for fresh catalysts (Fig. 4) show that phosphorus(from iron precursor) prevents the formation of Fe2(MoO4)3. Thesamples prepared from iron phosphate and iron pyrophosphateonly display XRD lines characteristic of MoO3 [2]. The XRD patternsrecorded for these samples are similar to those reported by Saidand El-Wahab [34] for silica supported MoO3 samples. Ananalogous effect was reported by Demdivod et al. [35]. Theyfound that the introduction of phosphate ions into stoichiometricferric molybdate leads to the formation of a proportional amountof MoO3 detectable by XRD.
None of the five phases (tridymite and quartz FePO4,FePO4�2H2O, Fe2P2O7 and a-Fe2O3) reported by Ren et al. [36]for silica supported FePO4 catalysts has been found. Additionally
no crystalline heteropolymolybdates [25] could be identified. TheXRD pattern of the post reaction sample prepared from ironphosphate did not reveal the presence of Fe2+ crystalline phases.The XRD patterns for fresh and post reaction samples were similar(Fig. 5). Thus, the phase containing Fe2+ evidenced by Mossbauerspectroscopy could not be identified by XRD probably due to thedetection limit of XRD technique.
3.1.5. Surface acidity by NH3 TPD
The surface acidity of the prepared samples was assessed byNH3 TPD. The recorded desorptograms are presented in Fig. 6.The desorptograms were normalized to the same surface area.The desorptogram for the silica support was included sincesilanol groups have acidic character [37]. The NH3 desorptionprofile for this sample shows a maximum at 390 K. Publishedresults [23] for unsupported Mo-Fe-O mixed oxides showedthree desorption maxima (400 K, 480 K, 580 K) for sampleshaving Mo/Fe = 3 atomic ratio. This study also showed that NH3
desorption profile was almost independent of the bulk Mo/Featomic ratio because the surface of the catalysts always
A.P.S. Dias et al. / Applied Catalysis A: General 345 (2008) 185–194192
presented an atomic ratio similar to that of the stoichiometricmixed oxide (Fe2(MoO4)3).
The NH3 desorption profiles of silica supported and unsup-ported mixed Mo-Fe-O samples were distinguishable. This may beattributed to the fact that the iron molybdate phase over thesupport material present Mo/Fe atomic ratios different from those
Fig. 7. Catalytic activity versus reaction temperature of the catalys
of the unsupported Mo-Fe-O mixed oxide. For the samplesprepared from nitrate, sulfate and chloride the differences amongthem can be due to the contamination of surfaces by strangeelements from the iron precursors. Unpublished XPS resultsrevealed the presence of N for the sample prepared from ironnitrate and S for the sample prepared from iron sulfate. The
ts (6% (v/v) methanol in air; W/F = 10 g h/molMeOH, W = 0.5 g).
Fig. 9. Average rate of methanol conversion (reaction conditions of Fig. 7).
A.P.S. Dias et al. / Applied Catalysis A: General 345 (2008) 185–194 193
samples prepared from iron phosphate and iron pyrophosphatehave surface compounds that are different from iron molybdate,which changes the adsorption behavior of NH3. In fact the sampleprepared from pyrophosphate has the highest acidity, whereas thesample prepared from iron phosphate displays the lowest surfaceacidity. This result can arise from the fact that the pyrophosphatesample has a Mo rich surface (Table 2).
3.2. Catalytic behavior
Data on the catalytic behavior of the catalysts are presented inFig. 7. For the conditions tested the major reaction product wasformaldehyde. Low amounts of methyl formate (MF), CO and CO2
were observed as byproducts. Dimethyl ether (DME) anddimethoxymethane usually referred as byproducts for themethanol oxidation over metal oxides catalysts [2] were observedwith residual selectivities (<0.5). The overoxidation byproducts(CO and CO2) were only produced with considerable selectivitiesfor high temperature and high methanol conversion. This resultseems to indicate that overoxidation products result from theconsecutive oxidation of formaldehyde that remains adsorbed, oris readsorbed on the catalyst surface. The relatively large catalystssurfaces would contribute to this result.
The plot of conversion versus reaction temperature, in Fig. 7,shows that the catalyst prepared from iron pyrophosphate wasmore active than the others for the same reaction conditions. Thiseffect was noticeable even for the lower reaction temperatures.The average rate of methanol conversion, in Fig. 9, also confirmsthis result.
The best catalytic behavior for the sample prepared from ironpyrophosphate can be ascribable to the presence of some kind ofheteropolymolybdates compounds on the catalyst surface. In factthis sample presented a Mo surface enrichment (Table 2). Thissample has also the highest NH3 adsorption, which substantiatesthe presence of such surface species. On the other hand theimproved catalyst behavior of this catalyst can be ascribed to theeffect of its Mo rich surface recently reported by Andersson et al.[26].
The methanol to formaldehyde oxidation over unsupportedFePO4 catalysts was briefly reported by Klissurski et al. [38]. Theyemphasized that taking into account the similar nature of Mo–Oand P–O bonds, theoretically FePO4 and Fe2(MoO4)3 must lead to
Fig. 8. Formaldehyde yield versus reaction temperature for prepared catalysts and
unsupported Mo-Fe-O industrial catalyst (reaction conditions of Fig. 7).
analogous performances. Their main result was high formaldehydeselectivity even for high reaction temperatures.
In Fig. 8 the formaldehyde yields of the prepared samples werecompared with those obtained using an industrial catalyst with thesame Mo/Fe atomic ratio (Mo/Fe = 3). The industrial catalyst hadphysico-chemical characteristics similar to those of the abovementioned sample prepared by coprecipitation [23]. For tempera-tures lower than 600 K the catalyst samples prepared from ironsulfate, phosphate and pyrophosphate display higher formalde-hyde yield than the industrial sample. This result is very importantsince supported samples merely contain 26.2% of active phase(basis Mo-Fe-O over inert silica) (Fig. 8).
4. Conclusions
SEM micrographs clearly showed the formation of three-dimensional structures for the supported active phase, instead ofthe monolayer type spreading. This result indicates that theinteraction between the support and the active phase is weak, aspreviously reported. EDX results during SEM underline the factthat the iron source strongly influences the Mo and Fe distributionin the surface layers of the catalysts. Additionally, for the samplesprepared from iron phosphate and pyrophosphate they showedthat phosphorus remains in the catalysts. The sample preparedfrom iron pyrophosphate showed a remarkable Mo surfaceenrichment.
The iron (ferric) precursor influences the catalytic perfor-mances of the prepared samples since some elements (N, Cl, S, andP), from the iron precursors, remain in the catalyst. Samplesprepared from phosphate and pyrophosphate, have phosphorus intheir compositions and Mossbauer spectra indicated the presenceof iron phosphate. The lack of crystallinity probably makes theseiron phosphate phases inactive.
All the prepared catalysts display high activity and selectivitytowards formaldehyde, both for low and high methanol conver-sions. The computed average rate of methanol conversion showsthat the catalyst prepared from iron pyrophosphate was the mostactive. The presence of heteropolymolybdates, containing phos-phorus, can perhaps explain the best catalytic behavior of thissample. Unfortunately no experimental evidence for the formationof such compounds was obtained. Only the blue color of thecatalysts suggests its existence. In addition, the enhancedperformances of the pyrophosphate derived sample can be relatedwith its Mo-rich surface. For temperatures lower than 625 K this
A.P.S. Dias et al. / Applied Catalysis A: General 345 (2008) 185–194194
sample (merely 26.2% (w/w) of active phase) presents higherformaldehyde yields than the unsupported industrial catalyst. Thecatalyst prepared from iron pyrophosphate presents promisingcatalytic performance for use in fluidized bed reactors.
The loss of Mo during reaction was observed for all the preparedcatalysts. Micrographs for post reaction samples display MoO3
needles (or plates) formed during the redox cycle, which are easilysublimated. Conversely, for the sample prepared from ironpyrophosphate the MoO3 needles are absent, which is probablyindicative of a different reaction mechanism.
After optimizing the preparation techniques of the morepromising catalysts, long-run catalytic tests must be performedto get the necessary information about the stability of the catalysts.
References
[1] A.B. Stiles, T.A. Koches, Oxidation Catalysts in Catalyst Manufacture, 2nd edition,Marcel Dekker, New York, 1997 (Chapter 20).
[2] A.P. Vieira Soares, M. Farinha Portela, A. Kiennemann, Catal. Rev. -Sci. Eng. 47(2005) 125.
[3] M. Bowker, R. Holroyd, A. Elliott, P. Morrall, A. Alouche, C. Entwistle, A. Toern-crona, Catal. Lett. 83 (2002) 165.
[4] N. Pernicone, Catal. Today 11 (1991) 85.[5] I.E. Wachs, L.E. Briand, US Appl. 6,037,290, 14 March 2000.[6] A.P. Vieira Soares, M. Farinha Portela, A. Kiennemann, Catal. Commun. 2 (2001) 159.[7] A.P. Vieira Soares, M. Farinha Portela, A. Kiennemann, L. Hilaire, Chem. Eng. Sci. 58
(2003) 1315.[8] L. Cairati, L. Di Fiori, P. Forzatti, I. Pasquon, F. Trifiro, Ind. Chem. Proc. Des. Dev. 19
(1980) 561.[9] L. Cairati, M. Carbucicchio, O. Ruggeri, Stud. Surf. Sci. Catal. 3 (1979) 279.
[10] P. Forzatti, React. Kinet. Catal. Lett. 20 (1982) 213.[11] C.G. Hill Jr., J.H. Wilson III, J. Mol. Catal. 63 (1990) 65.
[12] C.G. Hill Jr., J. Wilson III, J. Mol. Catal. 67 (1991) 57.[13] M. Carbucicchio, F. Trifiro, A. Vaccari, J. Catal. 75 (1982) 207.[14] M. Carbucicchio, J. Chem. Phys. 70 (1979) 784.[15] F. Trifiro, M. Carbucicchio, P.L. Villa, Hyp. Inter. 111 (1998) 17.[16] M. Castelao-Dias, B.F.O. Costa, R.M. Quinta-Ferreira, Hyp. Inter. 136 (1–2) (2001)
9.[17] A. Jos van Dillen, R.J.A.M Terorde, D.J. Lensveld, J.W. Geus, K.P. de Jong, J. Catal. 216
(2003) 257.[18] K.-Q. Sun, E. Marceau, M. Che, Phys. Chem. Chem. Phys. 8 (2006) 1731.[19] L. Shen, X. Zhang, Y. Li, X. Yang, J. Luo, G. Xu, Nanotechnology 15 (2004) 337.[20] J. Leyer, M.I. Zaki, H. Knozinger, J. Phys. Chem. 90 (1986) 4775.[21] L. Cairati, F. Trifiro, J. Catal. 80 (1983) 25.[22] L.E. Briand, A.M. Hirt, I.E. Wachs, J. Catal. 202 (2001) 268.[23] A.P.V. Soares, M. Farinha Portela, A. Kiennemann, L. Hilaire, J.M.M. Millet, Appl.
Catal. A: Gen. 206 (2001) 221.[24] Y. Ding, S.-H. Yu, C. Liu, Z.-A. Zang, Chem. Eur. J. 13 (2007) 746.[25] L. Marosi, J. Chifre, C. Otero Arean, Powder Diff. 18 (2003) 236.[26] A. Andersson, M. Hernelind, O. Augustsson, Catal. Today 112 (2006) 40.[27] S.D.M. Jacques, O. Leynaud, D. Strusevich, A.M. Beale, G. Sankar, C.M. Martin, P.
Barnes, Angew. Chem. Int. Ed. 45 (2006) 445.[28] H. Tian, I.E. Wachs, L.E. Briand, J. Phys. Chem. B 109 (2005) 23491.[29] M. Carbucicchio, F. Trifiro, J. Catal. 45 (1976) 77.[30] R.L. McCormick, G.O. Alptekin, D.L. Williamson, T.R. Ohno, Top. Catal. 10 (2000)
115.[31] J.M. Millet, C. Virely, M. Forissier, P. Bussiere, J.C. Vedrine, Hyp. Inter. 46 (1989)
619.[32] M.M. Gadgil, S.K. Kulshreshtha, J. Sol. State Chem. 111 (1994) 357.[33] Q. Huynh, J.M.M. Millet, J. Phys. Chem. Solids 66 (2005) 887.[34] Abd El-Aziz A. Said, Mohamed M.M. Abd El-Wahab, J. Chem. Technol. Biotechnol.
Sedova, V.B. Nakrokhin, B.I. Popov, Kinet. Catal. (Engl.) 35 (1992) 910.[36] T. Ren, L. Yan, X. Zhang, J. Suo, Appl. Catal. A: Gen. 244 (2003) 11.[37] N. Sahai, Environ. Sci. Technol. 36 (2002) 445.[38] D. Klissurski, V. Rives, N. Abadzhjieva, Y. Pesheva, P. Pomonis, T. Sdoukos, D.
Petrakis, J. Chem. Soc. Chem. Commun. 21 (1993) 1606.