Study on the improvement in continuously variable transmission efficiency with a thermal management system Minje Park, Daebong Jung, Minjae Kim, Kyoungdoug Min * School of Mechanical and Aerospace Engineering, Seoul National University, Gwanak 599, Gwanak-ro Gwanak-Gu, Seoul 151-744, Republic of Korea highlights A transmission model was developed for a thermal management system. The transmission experiments under the steady-state condition and actual HEV transient cycle driving were executed. Model prediction of oil temperature in the transmission showed good agreement with experimental results. The effect of the fast warm-up using a waste heat recovery model was dominant at below the freezing point condition. article info Article history: Received 18 December 2012 Accepted 24 July 2013 Available online 3 August 2013 Keywords: Thermal management system Continuously variable transmission Waste heat recovery Transmission thermal management abstract Recently, a thermal management system (TMS) was considered to improve fuel economy by reducing energy loss and parasitic energy. Furthermore, the TMS includes waste heat recovery (WHR), which warms up engine coolant or transmission oil and obtain electrical or mechanical energy. In particular, the TMS is necessary to resolve the drawback of hybrid electric vehicles (HEVs), as the transmission oil heats up more slowly compared to a conventional vehicle due to shorter engine operating time. In this report, a TMS with a WHR system was applied to supply heat source to the continuously variable transmission (CVT) oil of a HEV for a better operating region at the cold start condition. The research was performed using a simulation model, which consists of a thermal mass model, heat transfer model, friction model and waste heat recovery model with experimental data were used for validation. As a result, the simulation results showed that the CVT efficiency with the WHR model could be improved by as much as 2% with an oil temperature increase of 16 C in the urban dynamometer driving schedule (UDDS) mode, and an additional 2e8% improvement in transmission efficiency could be achieved by expansion of the application area. Ó 2013 Published by Elsevier Ltd. 1. Introduction The stringent requirements for the fleet average emissions legislation and compulsory standard on fuel economy have caused a major transition to technological innovation such as hybrid electric vehicles (HEVs), electric vehicles (EVs) and fuel cell electric vehicles (FCEVs) [1]. In recent years, HEVs have been reasonably successful in penetrating the mainstream because of their potential for emission reduction and fuel consumption compared to other systems. These next generation vehicles have been introduced by applying state-of-the-art powertrain architectures and energy storage components [2,3]. For example, the usage of energy, which is recovered from the rejected energy flow by additional systems such as Rankine steam cycle, thermoelectric device, heat exchanger and energy harvesting system. Many manufacturers have applied these systems, especially a heat exchanger, to improve the effi- ciency of the commercial vehicle for competitive price and per- formance. In this way, the overall recovery systems and their associated strategies are collectively known as the thermal man- agement system. A TMS is one of the most promising energy recovery technolo- gies to be utilized since propulsion systems of the vehicle have changed from internal combustion engine to a complex hybrid system. One purpose of the TMS is to optimize waste energy re- covery and to efficiently use that energy; furthermore, the TMS can be used as an additional power source or increase the efficiency of the cooling and heating system [6]. Recently, manufacturers have introduced a co-generation system using a thermodynamic cycle, such as Rankine and Stirling, for supplying power to the electric water pump [7e9]. * Corresponding author. Tel.: þ82 2 880 1661; fax: þ82 2 883 0179. E-mail address: [email protected](K. Min). Contents lists available at ScienceDirect Applied Thermal Engineering journal homepage: www.elsevier.com/locate/apthermeng 1359-4311/$ e see front matter Ó 2013 Published by Elsevier Ltd. http://dx.doi.org/10.1016/j.applthermaleng.2013.07.032 Applied Thermal Engineering 61 (2013) 11e19
Study on the improvement in continuously variable transmissionefficiency with a thermal management system
Minje Park, Daebong Jung, Minjae Kim, Kyoungdoug Min*
School of Mechanical and Aerospace Engineering, Seoul National University, Gwanak 599, Gwanak-ro Gwanak-Gu, Seoul 151-744, Republic of Korea
h i g h l i g h t s
� A transmission model was developed for a thermal management system.� The transmission experiments under the steady-state condition and actual HEV transient cycle driving were executed.� Model prediction of oil temperature in the transmission showed good agreement with experimental results.� The effect of the fast warm-up using a waste heat recovery model was dominant at below the freezing point condition.
a r t i c l e i n f o
Article history:Received 18 December 2012Accepted 24 July 2013Available online 3 August 2013
1359-4311/$ e see front matter � 2013 Published byhttp://dx.doi.org/10.1016/j.applthermaleng.2013.07.03
a b s t r a c t
Recently, a thermal management system (TMS) was considered to improve fuel economy by reducingenergy loss and parasitic energy. Furthermore, the TMS includes waste heat recovery (WHR), whichwarms up engine coolant or transmission oil and obtain electrical or mechanical energy. In particular, theTMS is necessary to resolve the drawback of hybrid electric vehicles (HEVs), as the transmission oil heatsup more slowly compared to a conventional vehicle due to shorter engine operating time. In this report, aTMS with a WHR system was applied to supply heat source to the continuously variable transmission(CVT) oil of a HEV for a better operating region at the cold start condition. The research was performedusing a simulation model, which consists of a thermal mass model, heat transfer model, friction modeland waste heat recovery model with experimental data were used for validation. As a result, thesimulation results showed that the CVT efficiency with the WHR model could be improved by as much as2% with an oil temperature increase of 16 �C in the urban dynamometer driving schedule (UDDS) mode,and an additional 2e8% improvement in transmission efficiency could be achieved by expansion of theapplication area.
� 2013 Published by Elsevier Ltd.
1. Introduction
The stringent requirements for the fleet average emissionslegislation and compulsory standard on fuel economy have causeda major transition to technological innovation such as hybridelectric vehicles (HEVs), electric vehicles (EVs) and fuel cell electricvehicles (FCEVs) [1]. In recent years, HEVs have been reasonablysuccessful in penetrating the mainstream because of their potentialfor emission reduction and fuel consumption compared to othersystems. These next generation vehicles have been introduced byapplying state-of-the-art powertrain architectures and energystorage components [2,3]. For example, the usage of energy, whichis recovered from the rejected energy flow by additional systems
þ82 2 883 0179.
Elsevier Ltd.2
such as Rankine steam cycle, thermoelectric device, heat exchangerand energy harvesting system. Many manufacturers have appliedthese systems, especially a heat exchanger, to improve the effi-ciency of the commercial vehicle for competitive price and per-formance. In this way, the overall recovery systems and theirassociated strategies are collectively known as the thermal man-agement system.
A TMS is one of the most promising energy recovery technolo-gies to be utilized since propulsion systems of the vehicle havechanged from internal combustion engine to a complex hybridsystem. One purpose of the TMS is to optimize waste energy re-covery and to efficiently use that energy; furthermore, the TMS canbe used as an additional power source or increase the efficiency ofthe cooling and heating system [6]. Recently, manufacturers haveintroduced a co-generation system using a thermodynamic cycle,such as Rankine and Stirling, for supplying power to the electricwater pump [7e9].
M. Park et al. / Applied Thermal Engineering 61 (2013) 11e1912
To optimize TMS application, the suitable energy sourceand target should be adopted to achieve a better efficiency. Forexample, the exhaust gas energy reuse is distinctly useful as theportion of energy usage becomes high. Additionally, the appli-cation of the TMS in a HEV is quite feasible because the shorterengine operation time can lead to unfavorable temperatureranges of the engine and transmission during the warm-upperiod [5,10].
The HEV has various characteristics that not only use an in-ternal combustion engine as its primary power source but alsofeature an electric system [11]. In addition, the CVT is attractiveequipment in the HEV as it guarantees the engine to work at theoptimal operating line (OOL) along with a small number of enginecycles better than other transmissions; hence, the CVT system hasbeen applied to the HEV [12]. In these cases, previous researchersfocused on belt-pulley loss, hydraulic loss, gear ratio and linepressure control [13e17]. Lee et al. showed a modified CVT ratiocontrol algorithm to improve the engine performance by consid-ering the HEV powertrain response lag [18]. In addition, Akehurstet al. presented a total loss mechanism that analyzed torque loss,pulley deflection loss and belt-slip loss in a pushing V-belt CVTwith dynamic equations [19]. However, the developed models inprevious studies did not consider the thermodynamic perspective.In recent years, several researchers have worked on a thermalnetwork of vehicle components based on the TMS mechanism thatare more a significant factor than ever before [4,20]. This is becausethe performance of major powertrain components, such as theengine and transmission, is affected by oil viscosity as a function oftemperature [21].
Christof and Andreas showed that the engine friction could be2.5 times higher at the cold start condition, which means theengine friction is directly linked with the coolant temperature[22]. Therefore, many researchers have presented the fast warm-up results with reduced emissions, focusing on modeling of en-gine characteristics related to the temperature and warm-upmethods of experimental approaches such as Rankine cycle andthermal energy storage system [23e33]. The TMS has been widelyutilized in the innovate automotive technology [34e40]; inparticular, the transmission part has significant potential interms of the heating rate of lubricant which is lower than theengine because the heat source of the transmission is only in-ternal friction loss with lower viscosity characteristics than anyother oil, hence, the TMS can be utilized to heat up the trans-mission in a short period of time [24]. Watanabe showed that thefuel economy can be improved by 2.5% by the application of theWHR on the transmission and engine. The reason for thisimprovement can be explained by the reduction in mechanicalloss from engine and transmission due to the early powertrainwarm-up [5].
In this study, an integrated transmission thermal management(TTM) model was developed, and diverse methodologies wereevaluated. The models were developed based on a Mild HEV withCVT in Tables 1 and 2, which were validated at the UDDS drivingmode. In particular, the commercial Mild HEV was used to obtain atemperature profile for the cold start condition. Additionally, the
Table 1Specification of transmission for simulation model.
Transmission CVT
Type Belt-pulleyWeight(kg) 67Diff. Gear ratio 4.910Gear range 0.44e2.42
powertrain experiment with AC dynamometers was conducted toacquire an efficiency map of the CVT. First, a transmission model bya lumped capacity method was developed with four sub models topredict the CVT temperature with a transmission efficiency map.Next, the CVT model was validated by experimental data, whichwere obtained using the HEV powertrain and commercial Mild HEVexperiment towards oil temperature in cold-start conditions.Finally, a WHR model was used to reduce the CVT oil warm-upperiod.
2. TTM model
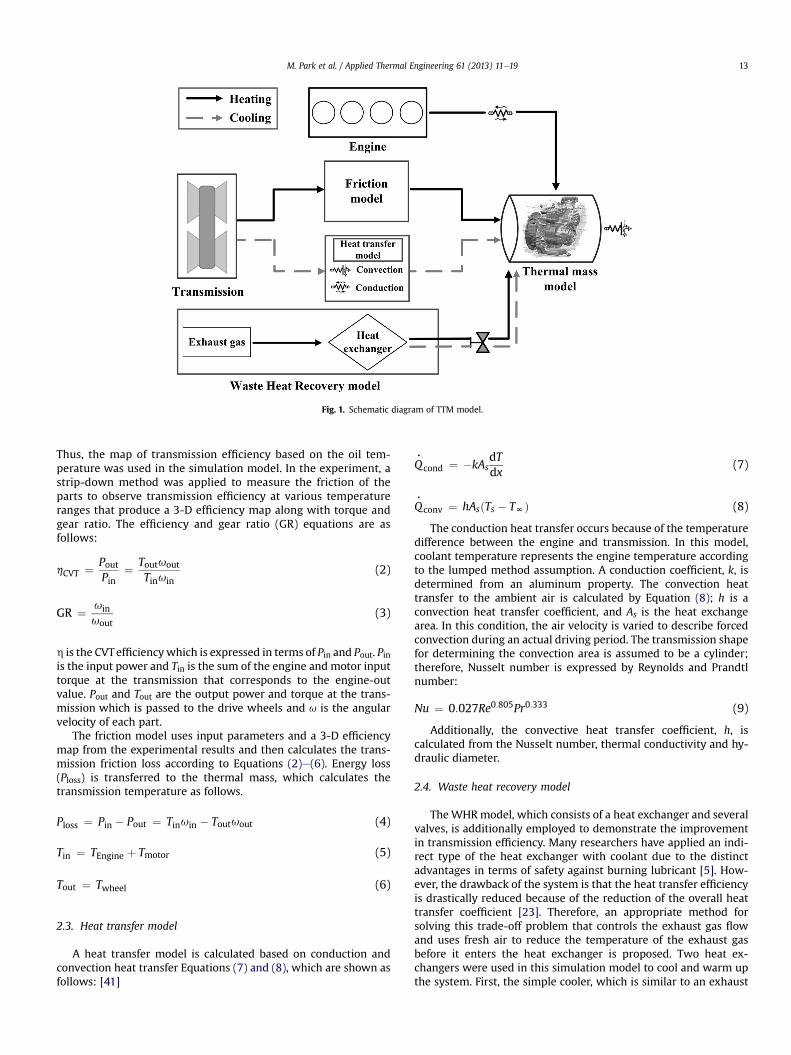
The TTM model consists of the following four sub models: athermal mass model, a heat transfer model, a friction model and awaste heat recovery model (Fig. 1). The thermal mass model con-siders transmission characteristics, such as weight, material prop-erty and size. The heat transfer model calculates conduction andconvection heat transfer quantities. The transmission internal loss,which is obtained by experiment, is applied to the friction modelwith specific equations. Total energy of transmission is determinedby sum of friction and heat transfer value and transferred to ther-mal mass, hence, oil temperature is decided. In addition, the wasteheat recovery model, which is designed to supply another heatsource to the CVT oil, is implemented using the simple heat ex-changers and control strategies.
2.1. Thermal mass model
The model concept assumes that the mass of the body reachesthe thermal equilibrium condition by lumped capacity method. Atransmission consists of various parts, such as pulleys, belt, sole-noid valve, hydraulic line, bearing, seal, final drive, etc. To simplifythe modeling, this thermal mass model describes one object tocalculate the representative value of the transmission oil temper-ature via the lumped method assumption. Therefore, one equationcan be used as a representative of all the other equations, enablingfaster and simpler calculation as identified in Equation (1) which isbased on the law of energy conservation. Frictional energy isapplied to the thermal mass as it is generated. The temperaturevariation equation is as follows:
dTdt
¼
Xn
i¼1
d�_Qi
�
m$c(1)
where Q is the thermal energy transferred; C is the specific heat ofthe transmission;m is themass of the transmission; and dT/dt is thetemperature variation versus time domain.
2.2. Friction model
The friction model calculates internal friction loss via an en-ergy conservation equation with experimental results. Trans-mission efficiency is substantially changed according to the oiltemperature and is hard to express in general function form.
Fig. 1. Schematic diagram of TTM model.
M. Park et al. / Applied Thermal Engineering 61 (2013) 11e19 13
Thus, the map of transmission efficiency based on the oil tem-perature was used in the simulation model. In the experiment, astrip-down method was applied to measure the friction of theparts to observe transmission efficiency at various temperatureranges that produce a 3-D efficiency map along with torque andgear ratio. The efficiency and gear ratio (GR) equations are asfollows:
hCVT ¼ PoutPin
¼ Toutuout
Tinuin(2)
GR ¼ uinuout
(3)
h is the CVTefficiency which is expressed in terms of Pin and Pout. Pinis the input power and Tin is the sum of the engine and motor inputtorque at the transmission that corresponds to the engine-outvalue. Pout and Tout are the output power and torque at the trans-mission which is passed to the drive wheels and u is the angularvelocity of each part.
The friction model uses input parameters and a 3-D efficiencymap from the experimental results and then calculates the trans-mission friction loss according to Equations (2)e(6). Energy loss(Ploss) is transferred to the thermal mass, which calculates thetransmission temperature as follows.
Ploss ¼ Pin � Pout ¼ Tinuin � Toutuout (4)
Tin ¼ TEngine þ Tmotor (5)
Tout ¼ Twheel (6)
2.3. Heat transfer model
A heat transfer model is calculated based on conduction andconvection heat transfer Equations (7) and (8), which are shown asfollows: [41]
Q,
cond ¼ �kAsdTdx
(7)
Q,
conv ¼ hAsðTs � TNÞ (8)
The conduction heat transfer occurs because of the temperaturedifference between the engine and transmission. In this model,coolant temperature represents the engine temperature accordingto the lumped method assumption. A conduction coefficient, k, isdetermined from an aluminum property. The convection heattransfer to the ambient air is calculated by Equation (8); h is aconvection heat transfer coefficient, and As is the heat exchangearea. In this condition, the air velocity is varied to describe forcedconvection during an actual driving period. The transmission shapefor determining the convection area is assumed to be a cylinder;therefore, Nusselt number is expressed by Reynolds and Prandtlnumber:
Nu ¼ 0:027Re0:805Pr0:333 (9)
Additionally, the convective heat transfer coefficient, h, iscalculated from the Nusselt number, thermal conductivity and hy-draulic diameter.
2.4. Waste heat recovery model
TheWHRmodel, which consists of a heat exchanger and severalvalves, is additionally employed to demonstrate the improvementin transmission efficiency. Many researchers have applied an indi-rect type of the heat exchanger with coolant due to the distinctadvantages in terms of safety against burning lubricant [5]. How-ever, the drawback of the system is that the heat transfer efficiencyis drastically reduced because of the reduction of the overall heattransfer coefficient [23]. Therefore, an appropriate method forsolving this trade-off problem that controls the exhaust gas flowand uses fresh air to reduce the temperature of the exhaust gasbefore it enters the heat exchanger is proposed. Two heat ex-changers were used in this simulation model to cool and warm upthe system. First, the simple cooler, which is similar to an exhaust
M. Park et al. / Applied Thermal Engineering 61 (2013) 11e1914
gas recirculation cooler, is used to decrease the temperature of theexhaust gas. The other heat exchanger model was selected afterconsideration of the gaseliquid heat transfer; furthermore, counterflow is assumed. The gas passes through the inner pipes of the heatexchanger and liquid flows around the pipes. The temperatures inthe pneumatic and hydraulic volumes are state variables, alongwith the temperature of the wall. The heat exchanger considers thepneumatic and hydraulic volumes heat exchange through the wallof the pipes by convection (Equations (10) and (11)). The Heattransfer was calculated between these two capacities as follows:
dQcond ¼ kL� AsðTw1 � Tw2Þ (10)
dQconv ¼ h� AsðTl � TwÞ (11)
Tw is the wall temperature at each point and L is the distancebetween the two temperature points. The exhaust gas route isdetermined by the path controller associated with the 200 �Cboundary temperature. When the exhaust gas temperature ishigher than 200 �C, it does not enter the heat exchanger; however,it is emitted through the bypass. In contrast, when the exhaust gastemperature is lower than 200 �C, it flows into the heat exchanger,and heat transfer occurs between the exhaust gas and transmissionoil. Thus, theWHRmodel was developed with various components,data and strategies.
3. Development of correlation factor
The WHR effects cause overall improvement in the CVT effi-ciency during the UDDS driving cycle. In addition, additionalimprovement is predicted when the WHR is used at an extremelylow ambient temperature such as 0 �C and �10 �C. This improve-ment is because the kinematic viscosity of the CVT oil at 0 �Cdrastically increased, as much as 2.5 times than that at 25 �C.However, the developed simulation model was validated at 40e80 �C, a correlation factor is required to overcome this problem andpredict accurate friction loss. Therefore, the goal of this section is todevelop the correlation factor focusing on extremely low temper-atures. The correlation factors between friction, viscosity, andtemperature were established as exponential functions reflectingseveral references. Kemp and Linden suggested a correlation be-tween viscosity and temperature, which has an exponential rela-tion as follows [21]:
Y ¼ 51:565 exp:�0:1651T (12)
In addition, the friction loss based on the temperature has asimilar relationship to oil viscosity, as shown by Andrews et al. [25].To estimate the correlation factor at very low temperatures, thepolynomial function between the viscosity factor and the frictionloss factor was developed based on the experimental data and ki-nematic viscosity of the CVT oil as follows:
y ¼ �0:019x2 þ 0:987xþ 0:078 (13)
Viscosity factor and friction factor were normalized viscosityand friction value versus temperature condition. Friction value wasobtained from powertrain experiment and viscosity value withtemperature was obtained from the manufacturer. According to therelationship between these values, the modified correlation factorversus temperature was developed and expressed by an exponen-tial function via the CVT oil viscosity factor and the well-definedpolynomial function as follows:
Corr_ factor ¼ 3:416 exp�0:024T (14)
Therefore, the WHR application was expanded to include thelow temperature region.
4. Experiment
4.1. Experimental setup
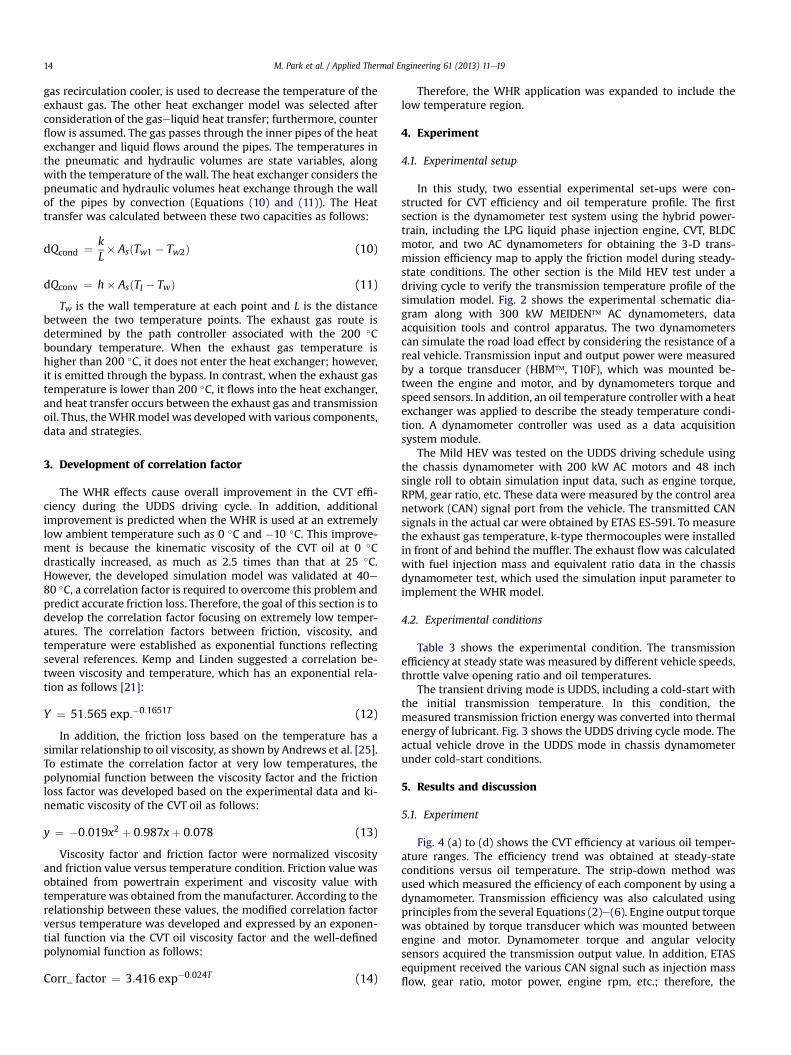
In this study, two essential experimental set-ups were con-structed for CVT efficiency and oil temperature profile. The firstsection is the dynamometer test system using the hybrid power-train, including the LPG liquid phase injection engine, CVT, BLDCmotor, and two AC dynamometers for obtaining the 3-D trans-mission efficiency map to apply the friction model during steady-state conditions. The other section is the Mild HEV test under adriving cycle to verify the transmission temperature profile of thesimulation model. Fig. 2 shows the experimental schematic dia-gram along with 300 kW MEIDEN� AC dynamometers, dataacquisition tools and control apparatus. The two dynamometerscan simulate the road load effect by considering the resistance of areal vehicle. Transmission input and output power were measuredby a torque transducer (HBM�, T10F), which was mounted be-tween the engine and motor, and by dynamometers torque andspeed sensors. In addition, an oil temperature controller with a heatexchanger was applied to describe the steady temperature condi-tion. A dynamometer controller was used as a data acquisitionsystem module.
The Mild HEV was tested on the UDDS driving schedule usingthe chassis dynamometer with 200 kW AC motors and 48 inchsingle roll to obtain simulation input data, such as engine torque,RPM, gear ratio, etc. These data were measured by the control areanetwork (CAN) signal port from the vehicle. The transmitted CANsignals in the actual car were obtained by ETAS ES-591. To measurethe exhaust gas temperature, k-type thermocouples were installedin front of and behind the muffler. The exhaust flowwas calculatedwith fuel injection mass and equivalent ratio data in the chassisdynamometer test, which used the simulation input parameter toimplement the WHR model.
4.2. Experimental conditions
Table 3 shows the experimental condition. The transmissionefficiency at steady state was measured by different vehicle speeds,throttle valve opening ratio and oil temperatures.
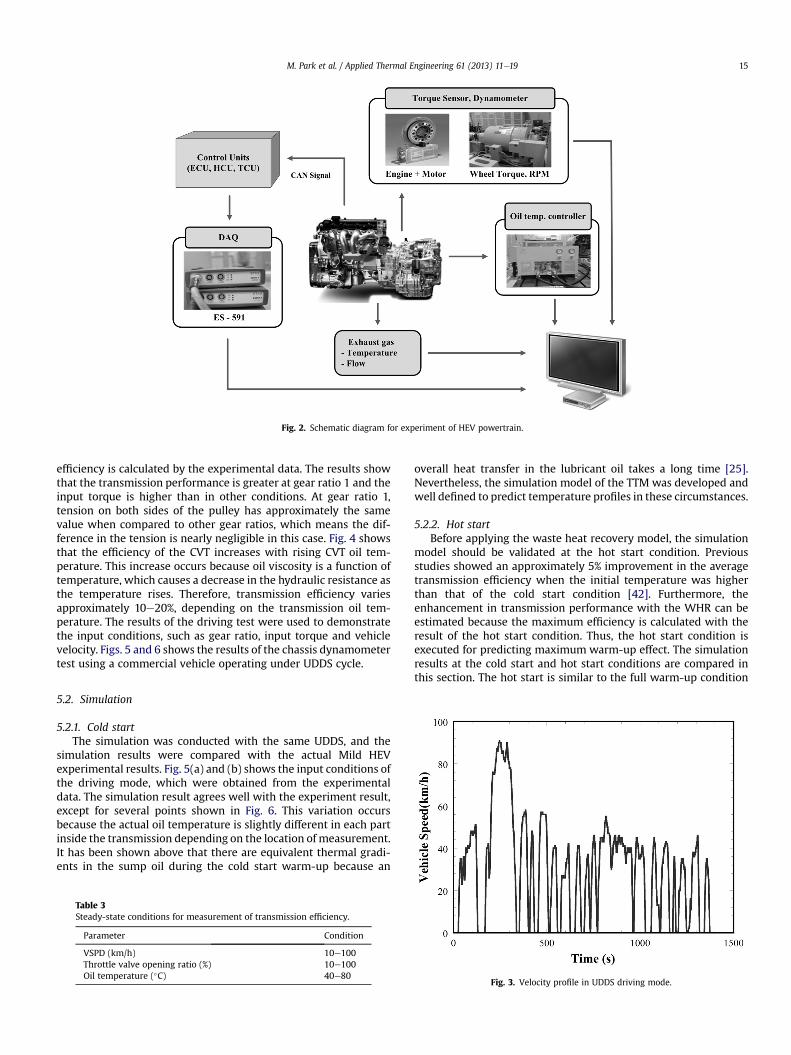
The transient driving mode is UDDS, including a cold-start withthe initial transmission temperature. In this condition, themeasured transmission friction energy was converted into thermalenergy of lubricant. Fig. 3 shows the UDDS driving cycle mode. Theactual vehicle drove in the UDDS mode in chassis dynamometerunder cold-start conditions.
5. Results and discussion
5.1. Experiment
Fig. 4 (a) to (d) shows the CVT efficiency at various oil temper-ature ranges. The efficiency trend was obtained at steady-stateconditions versus oil temperature. The strip-down method wasused which measured the efficiency of each component by using adynamometer. Transmission efficiency was also calculated usingprinciples from the several Equations (2)e(6). Engine output torquewas obtained by torque transducer which was mounted betweenengine and motor. Dynamometer torque and angular velocitysensors acquired the transmission output value. In addition, ETASequipment received the various CAN signal such as injection massflow, gear ratio, motor power, engine rpm, etc.; therefore, the
Fig. 2. Schematic diagram for experiment of HEV powertrain.
M. Park et al. / Applied Thermal Engineering 61 (2013) 11e19 15
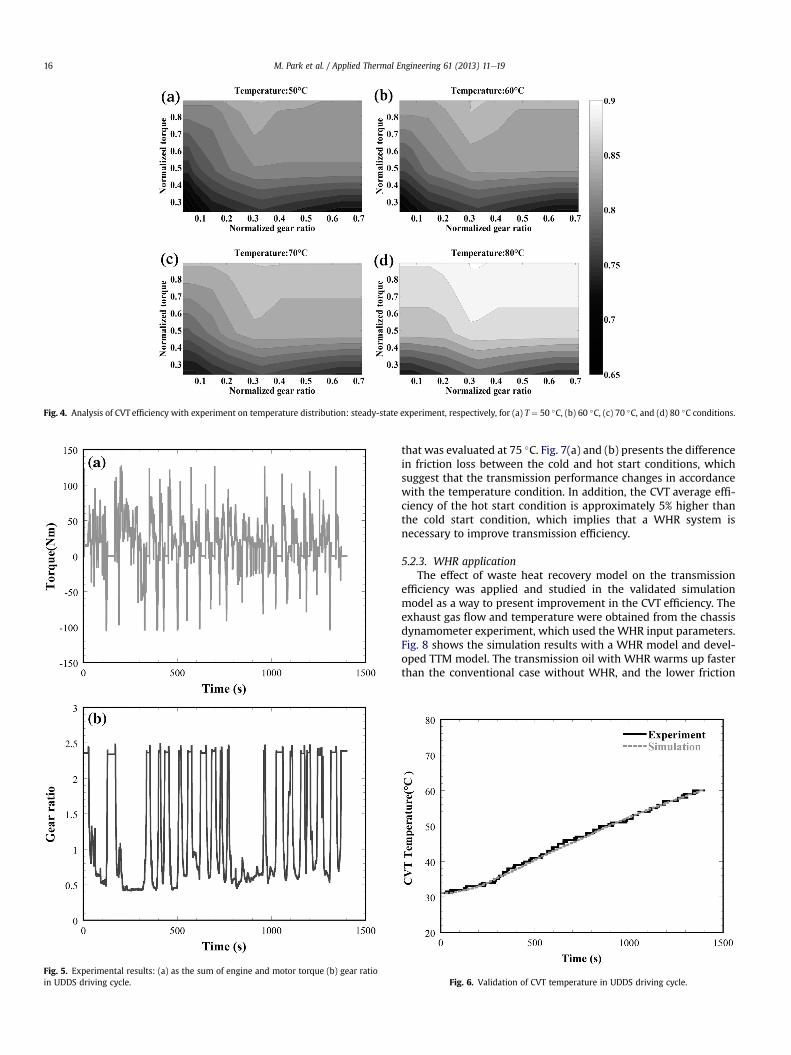
efficiency is calculated by the experimental data. The results showthat the transmission performance is greater at gear ratio 1 and theinput torque is higher than in other conditions. At gear ratio 1,tension on both sides of the pulley has approximately the samevalue when compared to other gear ratios, which means the dif-ference in the tension is nearly negligible in this case. Fig. 4 showsthat the efficiency of the CVT increases with rising CVT oil tem-perature. This increase occurs because oil viscosity is a function oftemperature, which causes a decrease in the hydraulic resistance asthe temperature rises. Therefore, transmission efficiency variesapproximately 10e20%, depending on the transmission oil tem-perature. The results of the driving test were used to demonstratethe input conditions, such as gear ratio, input torque and vehiclevelocity. Figs. 5 and 6 shows the results of the chassis dynamometertest using a commercial vehicle operating under UDDS cycle.
5.2. Simulation
5.2.1. Cold startThe simulation was conducted with the same UDDS, and the
simulation results were compared with the actual Mild HEVexperimental results. Fig. 5(a) and (b) shows the input conditions ofthe driving mode, which were obtained from the experimentaldata. The simulation result agrees well with the experiment result,except for several points shown in Fig. 6. This variation occursbecause the actual oil temperature is slightly different in each partinside the transmission depending on the location of measurement.It has been shown above that there are equivalent thermal gradi-ents in the sump oil during the cold start warm-up because an
Table 3Steady-state conditions for measurement of transmission efficiency.
Parameter Condition
VSPD (km/h) 10e100Throttle valve opening ratio (%) 10e100Oil temperature (�C) 40e80
overall heat transfer in the lubricant oil takes a long time [25].Nevertheless, the simulation model of the TTM was developed andwell defined to predict temperature profiles in these circumstances.
5.2.2. Hot startBefore applying the waste heat recovery model, the simulation
model should be validated at the hot start condition. Previousstudies showed an approximately 5% improvement in the averagetransmission efficiency when the initial temperature was higherthan that of the cold start condition [42]. Furthermore, theenhancement in transmission performance with the WHR can beestimated because the maximum efficiency is calculated with theresult of the hot start condition. Thus, the hot start condition isexecuted for predicting maximum warm-up effect. The simulationresults at the cold start and hot start conditions are compared inthis section. The hot start is similar to the full warm-up condition
Fig. 3. Velocity profile in UDDS driving mode.
Fig. 4. Analysis of CVT efficiency with experiment on temperature distribution: steady-state experiment, respectively, for (a) T ¼ 50 �C, (b) 60 �C, (c) 70 �C, and (d) 80 �C conditions.
Fig. 5. Experimental results: (a) as the sum of engine and motor torque (b) gear ratioin UDDS driving cycle.
M. Park et al. / Applied Thermal Engineering 61 (2013) 11e1916
that was evaluated at 75 �C. Fig. 7(a) and (b) presents the differencein friction loss between the cold and hot start conditions, whichsuggest that the transmission performance changes in accordancewith the temperature condition. In addition, the CVT average effi-ciency of the hot start condition is approximately 5% higher thanthe cold start condition, which implies that a WHR system isnecessary to improve transmission efficiency.
5.2.3. WHR applicationThe effect of waste heat recovery model on the transmission
efficiency was applied and studied in the validated simulationmodel as a way to present improvement in the CVT efficiency. Theexhaust gas flow and temperature were obtained from the chassisdynamometer experiment, which used the WHR input parameters.Fig. 8 shows the simulation results with a WHR model and devel-oped TTM model. The transmission oil with WHR warms up fasterthan the conventional case without WHR, and the lower friction
Fig. 6. Validation of CVT temperature in UDDS driving cycle.
Fig. 7. Simulation results: (a) difference of friction loss cold and hot start conditionsand (b) as histogram in UDDS driving cycle.
Fig. 9. Influence of WHR system with correlation factor on extremely low tempera-ture: (a) effect of the initial temperature at 0 �C and (b) effect of the initial temperatureat �10 �C.
M. Park et al. / Applied Thermal Engineering 61 (2013) 11e19 17
loss could additionally save an additional decrease of 6.5%. Inaddition, the amount of conduction heat transfer from the engine totransmission decreased because the oil temperature increasedmore rapidly than in the conventional condition. As a result,simulation result shows that the CVT efficiency increased 2%, withan improvement in average efficiency with the WHR modelapplication.
5.2.4. Influence of development methodsFig. 9(a) and (b) shows the influence of the WHR with the
developed correlation factor on extremely low temperatures, 0 �Cand �10 �C, to predict improvement potential of the transmissionThe distinct effect of the WHR showed that oil temperature rapidlyincreased more than conventional conditions with a difference offinal temperature. The time to reach 50 �C is decreased from 20 to13 min, and a 4.7 MJ friction loss was reduced in the UDDS cyclewith 0 �C initial temperature. In the case of �10 �C, the warm-uptime to reach 50 �C was reduced by 8 min when compared withthe normal system, which resulted in the average transmissionefficiency in the UDDS cycle improved up to 8%. Therefore, the oiltemperature profile and initial temperature condition have a sig-nificant impact on transmission efficiency.
Fig. 8. Comparison of CVT Temperature about cold start and WHR system.
6. Conclusions
An integrated TTM model for hybrid electric vehicles with CVTwas developed to estimate the effects in improving transmissionefficiency. The simulation model includes a friction model, a ther-mal mass model, a heat transfer model and a WHR model. Thesuggested simulation model was validated with actual vehicleexperimental data under the UDDS driving cycle. This study couldhave a significant impact on how the WHR system is extensivelyutilized.
The main results are summarized as follows:
(1) The thermal management model of transmission was devel-oped based on the lumped capacity method for thermal massmodel and estimates of the heat generation. This model canpredict temperature variation under driving conditions, andachieves a good compatibility with experimental data.
(2) The experiment of the transmission under steady-state con-dition and actual HEV transient cycle driving was executed toverify simulation results. The transmission 3-D map wasidentified with temperature based upon the input torque andgear ratio. The CVT efficiency improved as the temperature andthe input torque increased; this was caused by a decrease in
M. Park et al. / Applied Thermal Engineering 61 (2013) 11e1918
pump and mechanical friction loss. Input parameters of thesimulation model and validation data were obtained from theexperiment of the commercial HEV driving test.
(3) The waste heat recovery model was applied to the TTM systemfor better CVT efficiency at the cold start condition. The simu-lation results show that CVT efficiency was improved by 2%,which means the fuel consumption is potentially reduced inthis case. The complete warm-up time is reduced, and the finaltemperature is increased up to 76 �C.
(4) The expansion of theWHR systemwas evaluated to predict theimprovement at below the freezing point conditions, such as0 �C and �10 �C. The scalability of WHR was verified upto �10 �C through a correlation factor, and hence, the CVT ef-ficiency was improved by up to 8%. Therefore, the fuel economywill be also estimated about 6e7% with reducing the warm-upperiod.
Acknowledgements
This work was supported by the Hyundai Motor Company, thesecond stage of Brain Korea 21 Project, and the Seoul NationalUniversity Institute of Advanced Machinery and Design.
References
[1] D. Xuan, J. Kim, Y. Kim, Optimal operation strategy development for fuel cellhybrid vehicle, J. Mech. Sci. Technol. 25 (2011) 183e192.
[2] A. Widyotriatmo, K.S. Hong, L.H. Prayudhi, Robust stabilization of a wheeledvehicle: hybrid feedback control design and experimental validation, J. Mech.Sci. Technol. 24 (2010) 513e520.
[3] H. Kim, H. Cho, Y. Son, H. Kim, H. Kim, M. Suh, Derivation of optimal design ofcockpit module considering vibration and heat-resistance characteristics,J. Mech. Sci. Technol. 24 (2010) 1219e1224.
[4] J.R. Wagner, V. Srinivasan, D.M. Dawson, E. Marotta, Smart thermostat andcoolant pump control for engine thermal management systems, SAE Pap.(2003) 01e0272.
[5] K. Watanabe, M. Tani, T. Yamamuro, M. Kubo, Development of integratedpowertrain simulation for hybrid electric vehicles considering total energymanagement, SAE Tech. Pap. (2012) 01e1012.
[6] B.T. Liu, K.H. Chien, C.C. Wang, Effect of working fluids on organic Rankinecycle for waste heat recovery, Energy 29 (2004) 1207e1217.
[7] R.D. Chalgren, Thermal comfort and engine warm-up optimization of a low-flow advanced thermal management system, SAE SP (2004) 1e8.
[8] N. Kawamoto, K. Naiki, T. Kawai, T. Shikida, M. Tomatsuri, Development ofnew 1.8-liter engine for hybrid vehicles, SAE Pap. (2009) 01e1061.
[9] R. Stobart, D. Milner, The potential for thermo-electric regeneration of energyin vehicles, SAE Tech. Pap. (2009) 01e1333.
[10] R. Pfiffner, L. Guzzella, C. Onder, Fuel-optimal control of CVT powertrains,Control Eng. Pract. 11 (2003) 329e336.
[11] D. Karbowski, J. Kwon, N. Kim, A. Rousseau, Instantaneously optimizedcontroller for a multimode hybrid electric vehicle, SAE Tech. Pap. (2010) 01e0816.
[12] K. Ahn, P. Papalambros, Engine optimal operation lines for power-split hybridelectric vehicles, Proc. Inst. Mech. Eng. Part D 223 (2009) 1149e1162.
[13] C. Zhu, H. Liu, J. Tian, Q. Xiao, X. Du, Experimental investigation on the effi-ciency of the pulley-drive CVT, Int. J. Automot. Technol. 11 (2010) 257e261.
[14] C. Zheng, W. Lim, S. Cha, Performance optimization of CVT for two-wheeledvehicles, Int. J. Automot. Technol. 12 (2011) 461e468.
[15] W. Ryu, H. Kim, Belt-pulley mechanical loss for a metal belt continuouslyvariable transmission, Proc. Inst. Mech. Eng. Part D 221 (2007) 57e65.
[16] L. He, L. Li, L.Y. Yu, J. Song, Multi-state control strategy of starting for a wetfriction clutch via a fuzzy logic algorithm, Int. J. Automot. Technol. 12 (2011)537e544.
[17] J. Petric, A power-split hybrid hydraulic vehicle transmission modeling andcomparative analysis, SAE Tech. Pap. (2010) 01e2010.
[18] H. Lee, H. Kim, Improvement in fuel economy for a parallel hybrid electricvehicle by continuously variable transmission ratio control, Proc. Inst. Mech.Eng. Part D 219 (2005) 43e51.
[19] S. Akehurst, N. Vaughan, D. Simner, The effect of lubricant temperature on theloss mechanisms associated with an automotive metal V-belt CVT, SAE Tech.Pap. (2000) 01e1872.
[20] C. Changenet, P. Velex, Housing influence on churning losses in gearedtransmissions, J. Mech. Des. 130 (2008) 128e133.
[21] S.P. Kemp, J.L. Linden, Physical and Chemical Properties of a Typical AutomaticTransmission Fluid, Society of Automotive Engineers, Warrendale, PA (USA),1990.
[22] C. Samhaber, A. Wimmer, E. Loibner, Modeling of engine warm-up withintegration of vehicle and engine cycle simulation, SAE Pap. (2001) 01e1697.
[23] F. Will, A. Boretti, A new method to warm up lubricating oil to improve thefuel efficiency during cold start, SAE Int. J. Engines 4 (2011) 175e187.
[24] K. Kunze, S. Wolff, I. Lade, J. Tonhauser, A systematic analysis of CO2 reductionby an optimized heat supply during vehicle warm up, SAE Pap. (2006) 01e1450.
[25] G. Andrews, A. Ounzain, H. Li, M. Bell, J. Tate, K. Ropkins, The use of a water/lube oil heat exchanger and enhanced cooling water heating to increase waterand lube oil heating rates in passenger cars for reduced fuel consumption andCO2 emissions during cold start, SAE Pap. (2007) 01e2067.
[26] N. Yamada, M.N.A. Mohamad, Efficiency of hydrogen internal combustionengine combined with open steam Rankine cycle recovering water and wasteheat, Int. J. Hydrogen Energy 35 (2010) 1430e1442.
[27] S. Quoilin, R. Aumann, A. Grill, A. Schuster, V. Lemort, H. Spliethoff, Dynamicmodeling and optimal control strategy of waste heat recovery organicRankine cycles, Appl. Energy 88 (2011) 2183e2190.
[28] S. Quoilin, S. Declaye, B.F. Tchanche, V. Lemort, Thermo-economic optimiza-tion of waste heat recovery organic Rankine cycles, Appl. Therm. Eng. 31(2011) 2885e2893.
[29] S. Riffat, X. Ma, Thermoelectrics: a review of present and potential applica-tions, Appl. Therm. Eng. 23 (2003) 913e935.
[30] B. Zalba, J.M. Marı
n, L.F. Cabeza, H. Mehling, Review on thermal energy storagewith phase change: materials, heat transfer analysis and applications, Appl.Therm. Eng. 23 (2003) 251e283.
[31] L. Vasiliev, V. Burak, A. Kulakov, D. Mishkinis, P. Bohan, Latent heat storagemodules for preheating internal combustion engines: application to a buspetrol engine, Appl. Therm. Eng. 20 (2000) 913e923.
[32] H. Van Putten, P. Colonna, Dynamic modeling of steam power cycles: part IIesimulation of a small simple Rankine cycle system, Appl. Therm. Eng. 27(2007) 2566e2582.
[33] M. Gumus, Reducing cold-start emission from internal combustion enginesby means of thermal energy storage system, Appl. Therm. Eng. 29 (2009)652e660.
[34] Z. Rao, S. Wang, M. Wu, Z. Lin, F. Li, Experimental investigation on thermalmanagement of electric vehicle battery with heat pipe, Energy Convers.Manage. 65 (2013) 92e97.
[35] A. Mills, S. Al-Hallaj, Simulation of passive thermal management system forlithium-ion battery packs, J. Power Sources 141 (2005) 307e315.
[36] X. Duan, G. Naterer, Heat transfer in phase change materials for thermalmanagement of electric vehicle battery modules, Int. J. Heat Mass Transfer 53(2010) 5176e5182.
[37] Z. Lin, S. Wang, J. Huo, Y. Hu, J. Chen, W. Zhang, E. Lee, Heat transfer char-acteristics and LED heat sink application of aluminum plate oscillating heatpipes, Appl. Therm. Eng. 31 (2011) 2221e2229.
[38] A.P. Sasmito, E. Birgersson, A.S. Mujumdar, A novel flow reversal concept forimproved thermal management in polymer electrolyte fuel cell stacks, Int. J.Therm. Sci. 54 (2012) 242e252.
[39] Z. Rao, S. Wang, A review of power battery thermal energy management,Renewable Sustainable Energy Rev. 15 (2011) 4554e4571.
[40] H. Hamut, I. Dincer, G. Naterer, Exergy analysis of a TMS (thermal manage-ment system) for range-extended EVs (electric vehicles), Energy 46 (2012)117e125.
[41] Y.A. Cengel, Heat Transfer, second ed., McGraw Hill, 2006.[42] B. Min, R. Matthews, M. Duoba, H. Ng, R. Larsen, Direct measurement of
powertrain component efficiencies for a light-duty vehicle with a CVT oper-ating over a driving cycle, SAE Tech. Pap. (2003) 01e3202.
Abbreviations
A: areaCp: specific heat of the transmissionD: diameterGR: gear ratioh: convection heat transfer coefficientk: thermal conductivitym: massL: distance between two temperature pointsNu: Nusselt numberPloss: total power loss of transmissionPin: input power of transmissionPout: output power of transmissionQ: heat flowPr: Prandtl numberRe: Reynolds numberS: heat exchange areat: timeT: temperatureTin: input torqueTmotor: motor torqueTout: output torqueTwheel: wheel torqueTg: gas temperature
M. Park et al. / Applied Thermal Engineering 61 (2013) 11e19 19
Tl: liquid temperatureTw: wall temperatureTw1: temperature of first thermal solid capacityTw2: temperature of second thermal solid capacityuin: input speed