25
© G. A. Motter, 2006 & 2008 ECE 480 Six Sigma Overview & Introduction to Design for Six Sigma

© G. A. Motter, 2006 & 2008
ECE 480
Six Sigma Overview &Introduction to
Design for Six Sigma
© G. A. Motter, 2006 & 2008
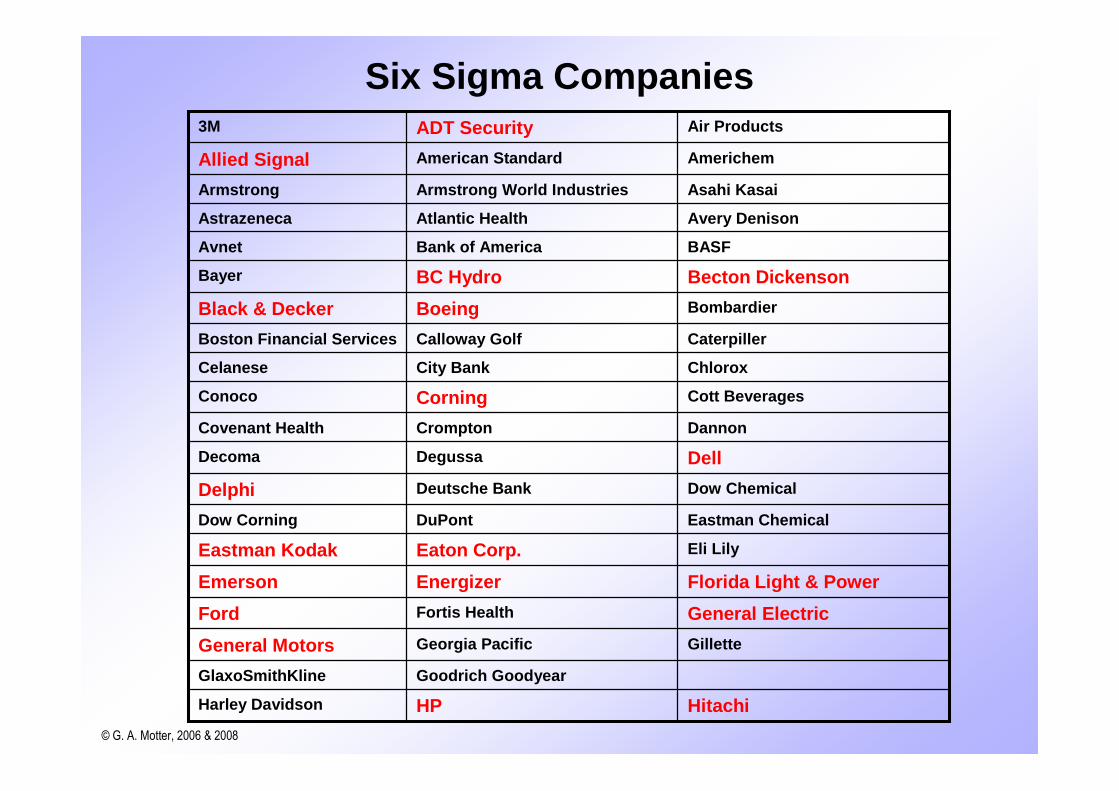
Six Sigma Companies
HitachiHPHarley Davidson
Goodrich GoodyearGlaxoSmithKline
GilletteGeorgia PacificGeneral Motors
General ElectricFortis HealthFord
Florida Light & PowerEnergizerEmerson
Eli LilyEaton Corp.Eastman Kodak
Eastman ChemicalDuPontDow Corning
Dow ChemicalDeutsche BankDelphi
DellDegussaDecoma
DannonCromptonCovenant Health
Cott BeveragesCorningConoco
ChloroxCity BankCelanese
CaterpillerCalloway GolfBoston Financial Services
BombardierBoeingBlack & Decker
Becton DickensonBC HydroBayer
BASFBank of AmericaAvnet
Avery DenisonAtlantic HealthAstrazeneca
Asahi KasaiArmstrong World IndustriesArmstrong
AmerichemAmerican StandardAllied Signal
Air ProductsADT Security3M

© G. A. Motter, 2006 & 2008
More Six Sigma Companies
XeroxWR GraceVisteon
US FilterTRWTransfreight
TraneToyotaTimken
SwagelokSunbeamSun Chemical
Square DSprintSony
Silicon GraphicsSiemensSherwin Williams
Seagate TechnologiesScott SeedsSAS Inst.
SamsungSaint-GobainRoyal Bank of Canada
Rhom & HaasRogers Corp.Raytheon
PraxairPPG IndustriesPitney Bowes
PhillipsOwens CorningOmnova Solutions
NoveonNorthrop GrummanNoranda
NCR Corp.NBC NewsNational Semiconductor
MotorolaMoogMckesson
MaytagLubrizolLord
Lockheed MartinLG ChemicalKohler Corp.
KelloggJohnson & JohnsonJohns Manville Corp.
John DeereITWITT Industries
IntelIBMHoneywell

© G. A. Motter, 2006 & 2008
Six Sigma Optimization - MAIC5
Function Definition & Analysis – Powerful Problem Analysis Technique
Homework Assignment4
Quality Function Deployment (QFD) – Customer Driven Development3
Understanding the Customer’s Viewpoint - VOC
Homework Assignment2
WOWing Customers with Six Sigma Products - DFSS1
Six Sigma ‘Tour’ Lecture TitleLecture
© G. A. Motter, 2006 & 2008

© G. A. Motter, 2006 & 2008
WOWing Customers with SixSigma Products . . .
via Design for Six Sigma
© G. A. Motter, 2006 & 2008
DFSS DiscussionObjectives
• Define Quality, Defect, and Sigma Level
• Describe generic DFSS Process flow
• Highlight the DFSS Process with an example
• Explain “What’s different about DFSS” fromtraditional Engineering Design approach?
© G. A. Motter, 2006 & 2008
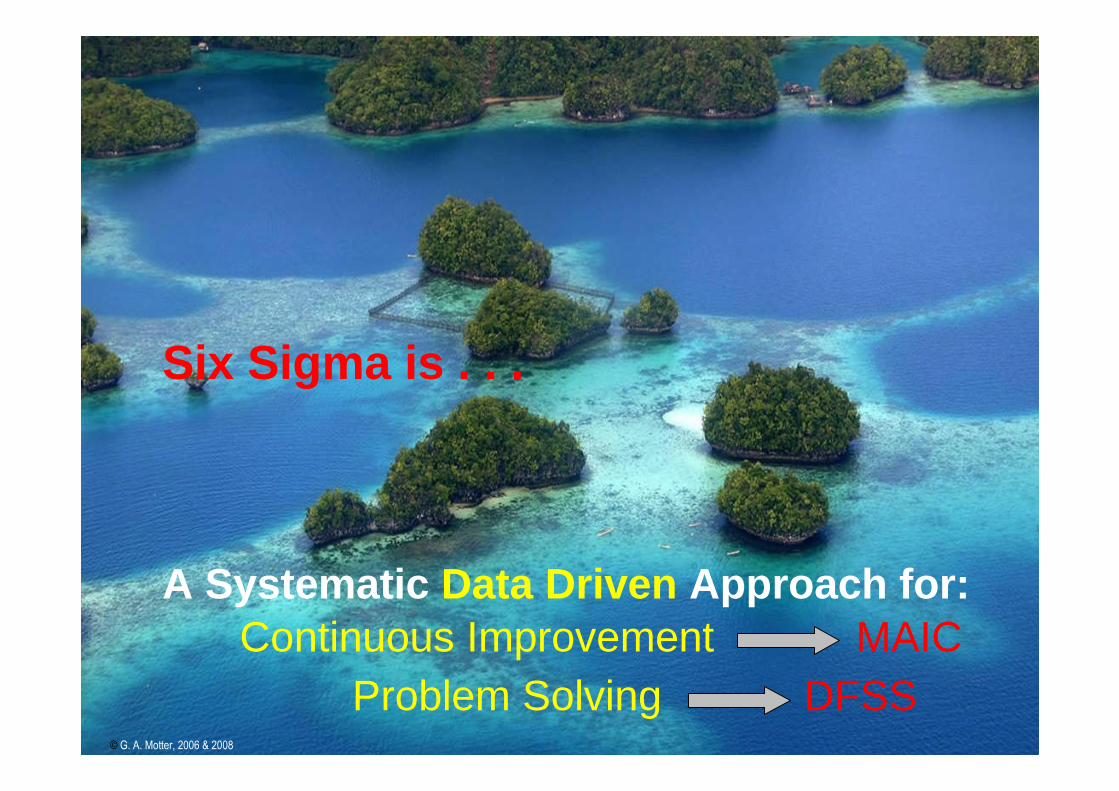
Six Sigma is . . .
A Systematic Data Driven Approach for:
© G. A. Motter, 2006 & 2008
Continuous Improvement MAIC
Problem Solving DFSS
© G. A. Motter, 2006 & 2008
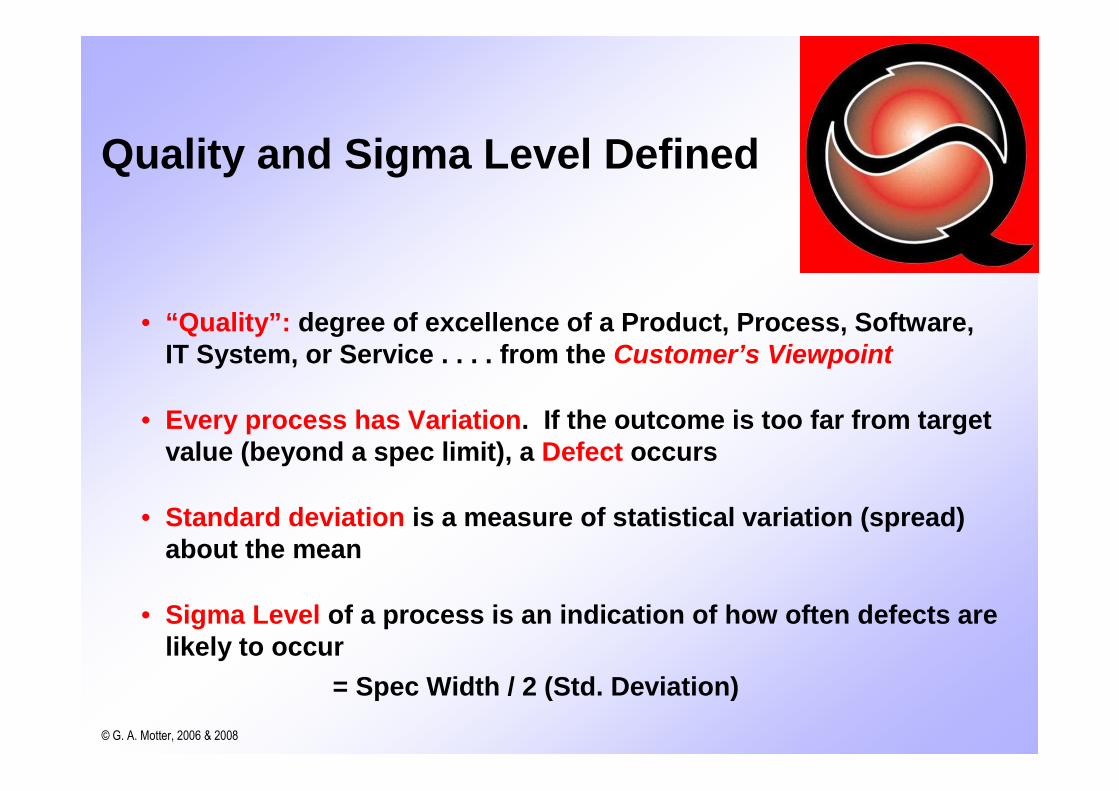
Quality and Sigma Level Defined
• “Quality”: degree of excellence of a Product, Process, Software,IT System, or Service . . . . from the Customer’s Viewpoint
• Every process has Variation. If the outcome is too far from targetvalue (beyond a spec limit), a Defect occurs
• Standard deviation is a measure of statistical variation (spread)about the mean
• Sigma Level of a process is an indication of how often defects arelikely to occur
= Spec Width / 2 (Std. Deviation)

© G. A. Motter, 2006 & 2008
Matching Product Requirements andProcess Capability
69.146251
30.853752
6.680723
0.620974
0.023275
0.000346
% Out ofSpec
Sigma
Level
Defects
Lower SpecLimit
Upper SpecLimit
Manufacturing
Voice of Customer
Voice of Process
Mean
Source: Implementing Six Sigma, F. Breyfogle III
Assuming a LongTerm 1.5 Sigma Shift
© G. A. Motter, 2006 & 2008
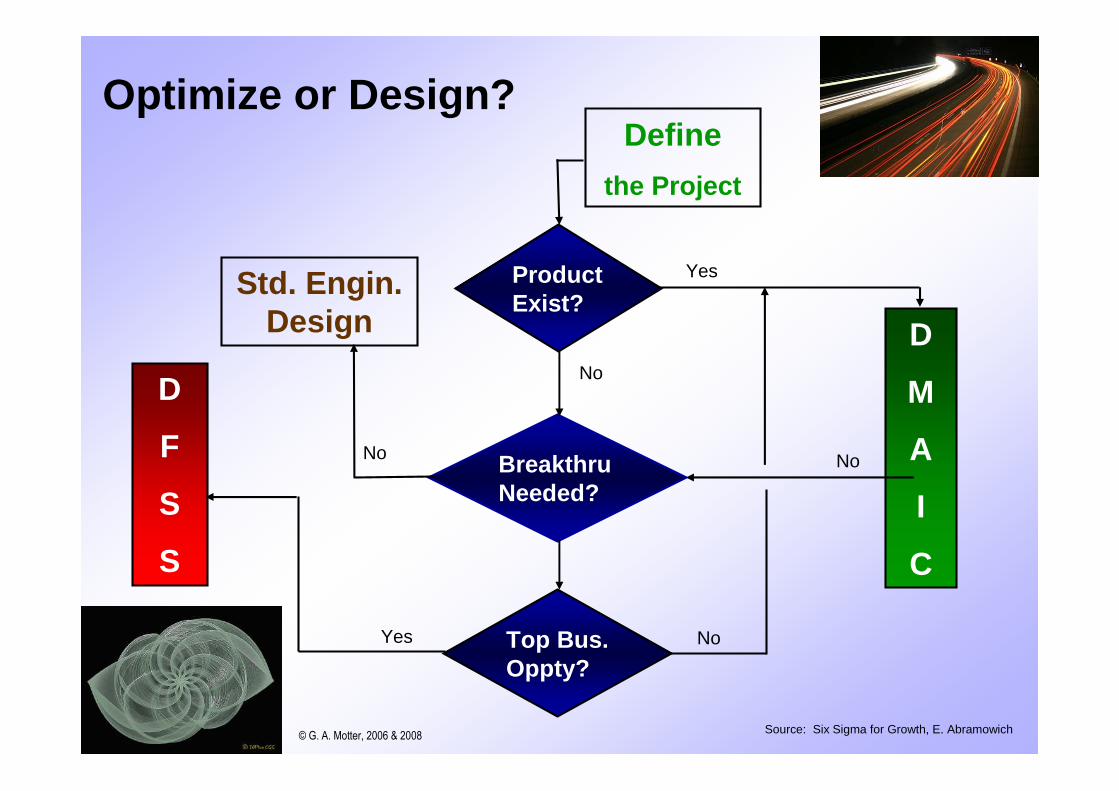
Optimize or Design?Define
the Project
ProductExist?
Top Bus.Oppty?
BreakthruNeeded?
D
F
S
S
D
M
A
I
C
Yes
Yes
No
No
No
Std. Engin.Design
No
Source: Six Sigma for Growth, E. Abramowich© G. A. Motter, 2006 & 2008
© G. A. Motter, 2006 & 2008
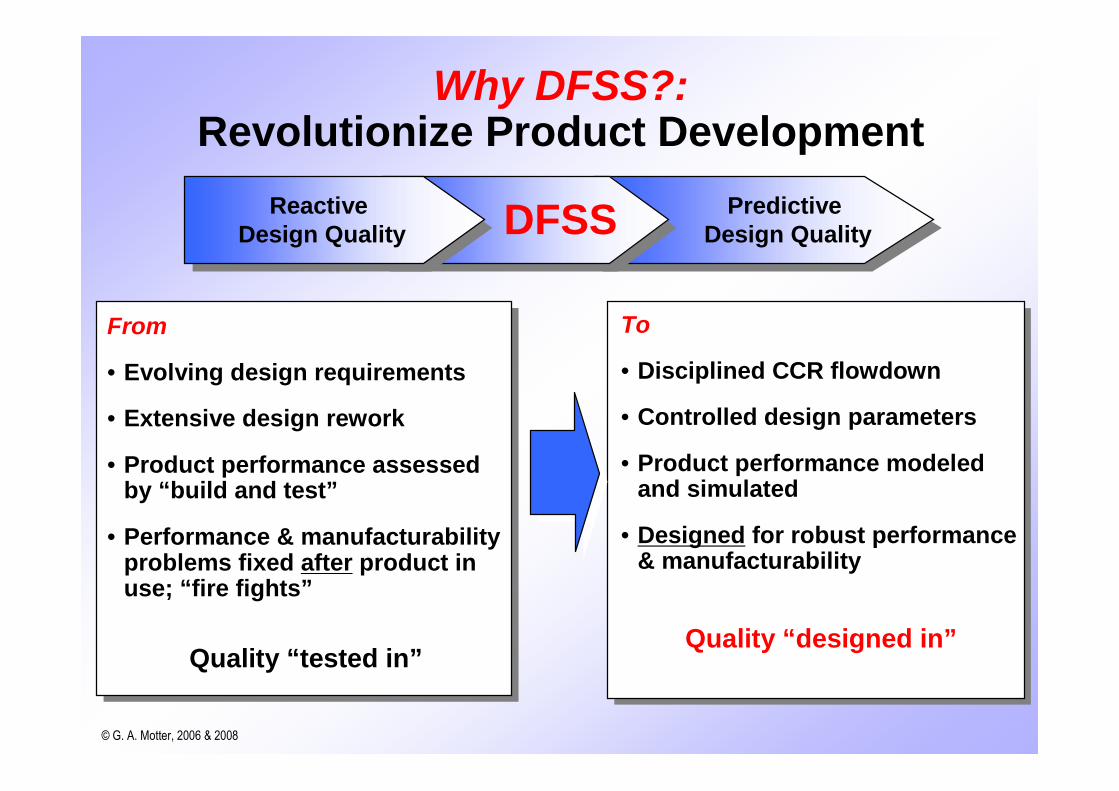
Why DFSS?:Revolutionize Product Development
ReactiveDesign Quality
PredictiveDesign QualityDFSS
From
• Evolving design requirements
• Extensive design rework
• Product performance assessedby “build and test”
• Performance & manufacturabilityproblems fixed after product inuse; “fire fights”
Quality “tested in”
To
• Disciplined CCR flowdown
• Controlled design parameters
• Product performance modeledand simulated
• Designed for robust performance& manufacturability
Quality “designed in”
© G. A. Motter, 2006 & 2008
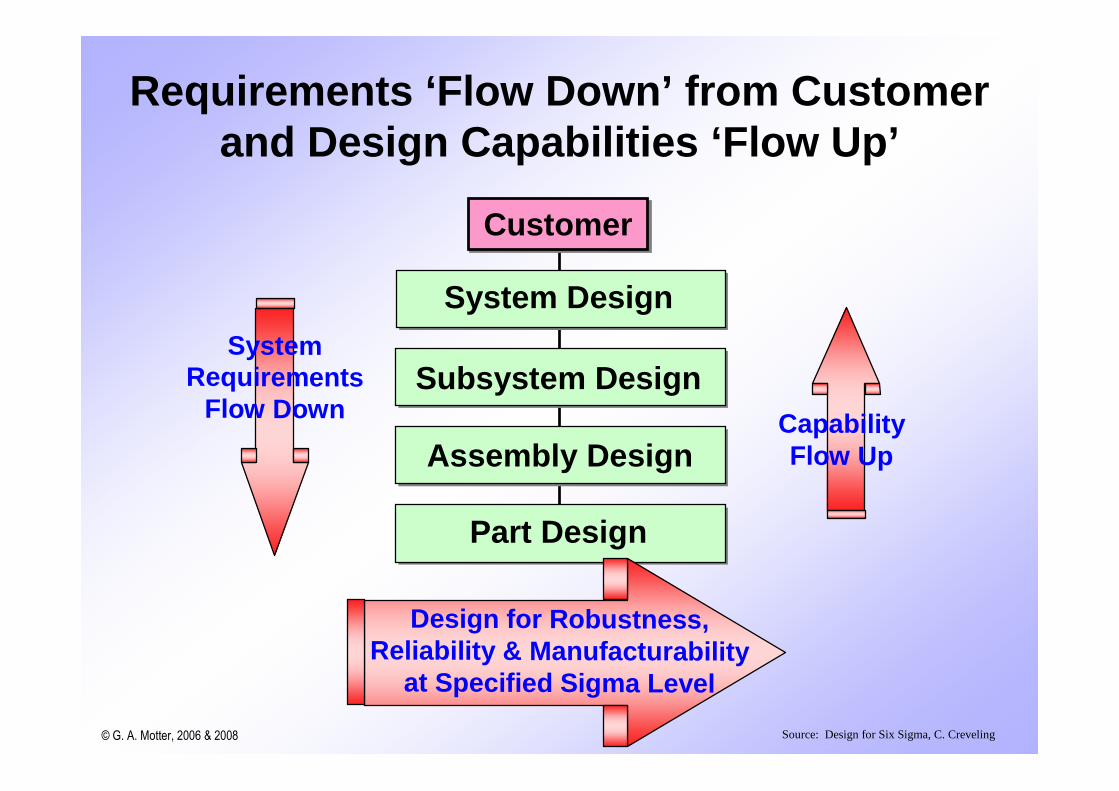
Requirements ‘Flow Down’ from Customerand Design Capabilities ‘Flow Up’
SystemRequirements
Flow DownSubsystem Design
System Design
Assembly Design
Part Design
CustomerCustomer
Design for Robustness,Reliability & Manufacturability
at Specified Sigma Level
Source: Design for Six Sigma, C. Creveling
CapabilityFlow Up
© G. A. Motter, 2006 & 2008
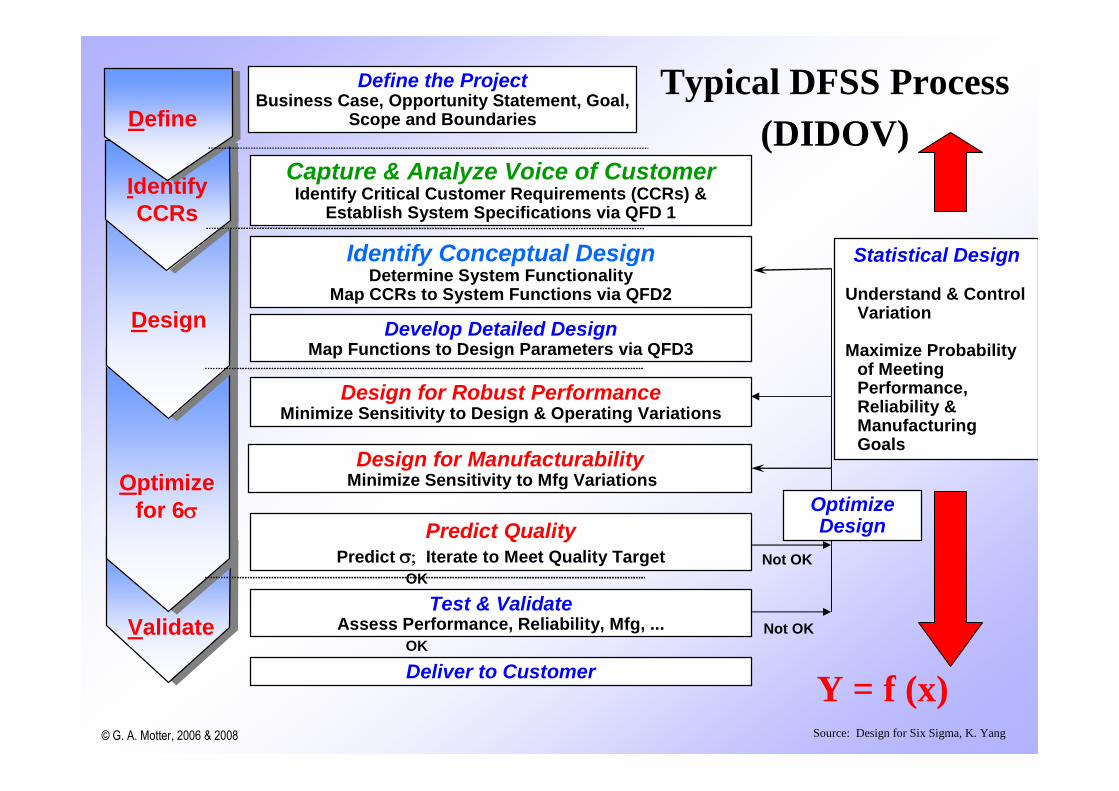
Statistical Design
Understand & ControlVariation
Maximize Probabilityof MeetingPerformance,Reliability &ManufacturingGoals
Test & ValidateAssess Performance, Reliability, Mfg, ...
OK
Capture & Analyze Voice of CustomerIdentify Critical Customer Requirements (CCRs) &
Establish System Specifications via QFD 1
Design for ManufacturabilityMinimize Sensitivity to Mfg Variations
Design for Robust PerformanceMinimize Sensitivity to Design & Operating Variations
Predict QualityPredict Iterate to Meet Quality Target
Identify Conceptual DesignDetermine System Functionality
Map CCRs to System Functions via QFD2
Develop Detailed DesignMap Functions to Design Parameters via QFD3
OK
Deliver to Customer
Optimizefor 6
Validate
Design
IdentifyCCRs
Define
Define the ProjectBusiness Case, Opportunity Statement, Goal,
Scope and Boundaries
Typical DFSS Process
(DIDOV)
Source: Design for Six Sigma, K. Yang
Y = f (x)
Not OK
Not OK
OptimizeDesign

© G. A. Motter, 2006 & 2008
Voice of the Customer andQuality Function Deployment
Relationships
Strong - 9
Medium - 3
Weak - 1
HowsCustomerImportance
3
4
5
2
4
2
1
System LevelImportance
Th
rus
t
We
igh
t
To
tM
ain
tC
os
t
Mis
sio
nF
ue
lB
urn
Cyc
leL
ife
Lim
its
Tim
eT
oR
em
ove
Dis
kB
urs
tS
pe
ed
Lb
$/F
ltH
r
Ga
l/F
lt
Flt
Cyc
les
Lb
Min
ute
s
RP
M
Target Direction
More is better
Less is better
Targeted amount
68 36 57 22 41 22 35
Customer NeedsWhats
High Power
Low Oper. Cost
Meet RangeReq'ts
Long Life
High Payload
Easy ToMaintainEasy To
Troubleshoot
• Voice of the Customer• Surveys• Focus groups• Conjoint Analysis
Intense Focus on what the Customer wantsIntense Focus on what the Customer wants
Identify

© G. A. Motter, 2006 & 2008
System Design
Locomotive
Platform Engine Generator Inverter TruckTraction
Coupler SanderControl Console
System
Subsystems
Assemblies
Parts
• Customers buy System Performance and Reliability
• Design Decisions are made at Subsystem, Assembly and Parts
• Systems engineering allows
– Flow Down of Customer Requirements to lower design levels
– Rational Design Decisions to achieve system-level goals
RequirementsFlow Down
Design

© G. A. Motter, 2006 & 2008
Quantify relationships between CCRs & Design Parameters– First principles models– Numerical models (finite elements, lumped parameter, …)– Designed experiments (DOE)– QFD
Design for Robust Performance
DOE Main Effects Plot
Fu
elE
co
no
my
Octane Level Air Temp
X1
X2
Y = 50
9080
7060
Response Surface
Steep gradient,high sensitivityto variabilities
in X’s
Optimum
• Regression to obtain Transfer Function:
Y = f(X1, X2, X3) a0 + a1X1 + a2X2 + a3X3 + a4X1X2 + a5X1X3 + a6X2X3 + ...
2-Way InteractionsMain Effects
Capture knowledge in Transfer Function libraries & design templatesCapture knowledge in Transfer Function libraries & design templates
Optimize

© G. A. Motter, 2006 & 2008
Statistical vs Deterministic Design:Switching Power Supply Example
Baseline design
• Isolated switching converter/feedback section
• Low cost, combine power MOSFETand control circuit in a 3-pin package
R2
R1CTRL
Vo
PWM IC
OPTO
VrefIb
••
R1
InputFilter
Isolated SwitchingConverter
Feedback
Vo = 5 Vdc, +/- 5%Vin = 85 - 275 Vac
System Requirements:• Vin: 85 - 275 V
• Vo: 5 V, +/- 5%
• 6 quality
• Low cost

© G. A. Motter, 2006 & 2008
Deterministic Design
Analysis: Transfer function
Choose values fordesign parameters:
Substituting: Output voltage = 5.04 volts
Baseline design meets 5V, +/- 5% performance requirementBut, quality level is not yet determined
Baseline design meets 5V, +/- 5% performance requirementBut, quality level is not yet determined
Design Parameter ValueLM 431I ref voltage, Vref (volts) 2.495R1 (ohms) 10000
R2 (ohms) 10000
Bias current, Ib (amps) 5.0E-06
VrefVo = Vref + R2 ____ + Ib
R1( )

© G. A. Motter, 2006 & 2008
Statistical Design
Design Parameter Mean Std Dev TolerancesLower Upper
LM 431I Vref (volts) 2.495 0.0283 0.085 0.085
R1 (ohms) 10000 33.3333 1% 1%
R2 (ohms) 10000 33.3333 1% 1%
Bias current, Ib (amps) 5.0E-06 1.15E-06 2.00E-06 2.00E-06
Analysis: Transfer Function
Design parameters are statistical.Engineer selects mean values and ameasure of variability (e.g., standarddeviation, based on componenttolerance).
Baseline design meets 5V, +/- 5% performanceBut quality level is only 5
Baseline design meets 5V, +/- 5% performanceBut quality level is only 5
Do a statistical analysis (e.g., Monte
Carlo), using Transfer Function and
statistical parameter values
Results:• Vo mean 5.04 volts
• Vo std dev 0.059 volts
• Defects/million 188 (5.06s)
VrefVo = Vref + R2 ____ + Ib
R1( )
Volts4.75 4.875 5.00 5.125 5.25
.000
.009
.017
.026
.035
Pro
ba
bil
ity
© G. A. Motter, 2006 & 2008
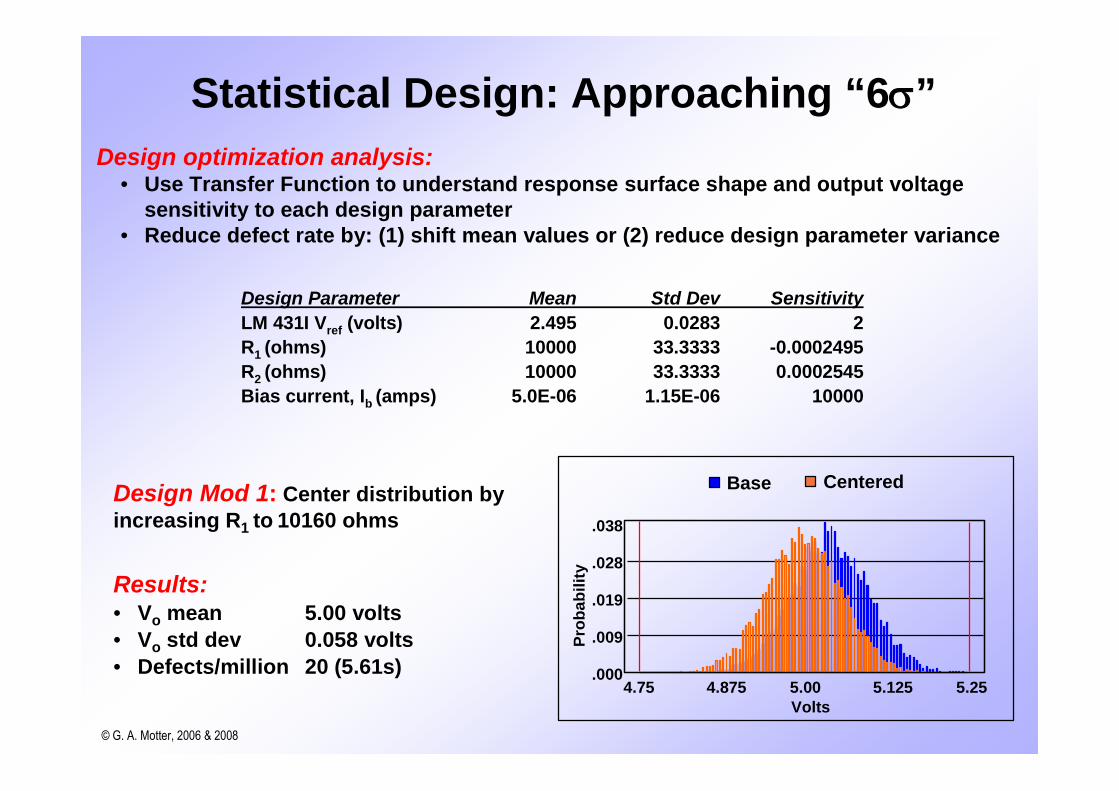
Design optimization analysis:• Use Transfer Function to understand response surface shape and output voltage
sensitivity to each design parameter• Reduce defect rate by: (1) shift mean values or (2) reduce design parameter variance
Statistical Design: Approaching “6”
Design Parameter Mean Std Dev Sensitivity
LM 431I Vref (volts) 2.495 0.0283 2
R1 (ohms) 10000 33.3333 -0.0002495
R2 (ohms) 10000 33.3333 0.0002545
Bias current, Ib (amps) 5.0E-06 1.15E-06 10000
Design Mod 1: Center distribution byincreasing R1 to 10160 ohms
Results:• Vo mean 5.00 volts
• Vo std dev 0.058 volts
• Defects/million 20 (5.61s)4.75 4.875 5.00 5.125 5.25
Base Centered
.000
.009
.019
.028
.038
Volts
Pro
ba
bil
ity
© G. A. Motter, 2006 & 2008
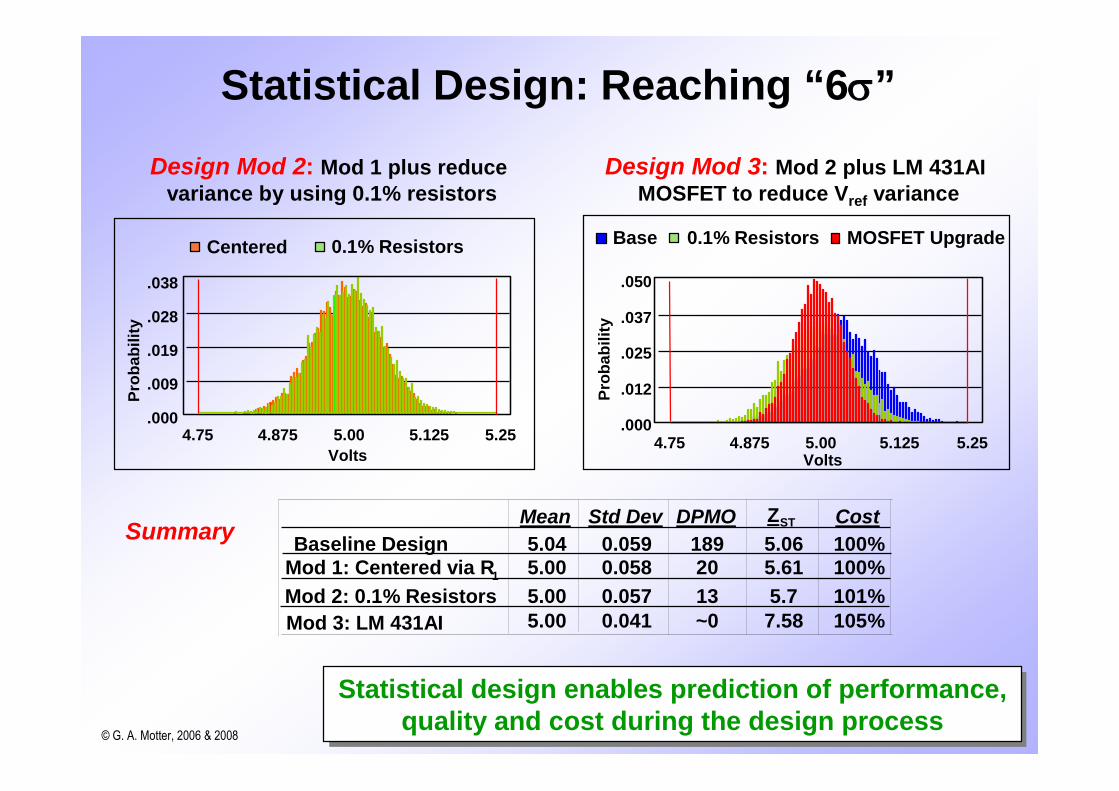
Statistical Design: Reaching “6”
Design Mod 2: Mod 1 plus reducevariance by using 0.1% resistors
Design Mod 3: Mod 2 plus LM 431AIMOSFET to reduce Vref variance
Summary
Statistical design enables prediction of performance,quality and cost during the design process
Statistical design enables prediction of performance,quality and cost during the design process
4.75 4.875 5.00 5.125 5.25
Base 0.1% Resistors MOSFET Upgrade
.000
.012
.025
.037
.050
Volts
Pro
ba
bil
ity
Centered 0.1% Resistors
.000
.009
.019
.028
.038
4.75 4.875 5.00 5.125 5.25
Volts
Pro
ba
bil
ity
Mean Std Dev DPMO ZST Cost
Baseline Design 5.04 0.059 189 5.06 100%Mod 1: Centered via R1 5.00 0.058 20 5.61 100%
5.00 0.057 13 5.7 101%
Mod 3: LM 431AI 5.00 0.041 ~0 7.58 105%Mod 2: 0.1% Resistors

© G. A. Motter, 2006 & 2008
What’s Different About DFSS?
• Disciplined, comprehensive process applicable to all Designs
• “Line of Sight” from Customer Needs to all System Design levels
• Statistical design to understand . . . and reduce Variation
• “New” tools: QFD, Function Analysis, TRIZ, DOE, DFM,statistical tolerance, Robust Design, multi-variable optimizations
• Quality prediction throughout development
• Dedicated Team can develop a Breakthrough Design in months
But, does not replace need for soundEngineering Judgment
But, does not replace need for soundEngineering Judgment

© G. A. Motter, 2006 & 2008
Questions
&
Discussion

© G. A. Motter, 2006 & 2008
Appendix

© G. A. Motter, 2006 & 2008
Mapping of Common Tools toDFSS Stages
Robustness/ReliabilityDemonstration
Design Verification Plan & ReportV
ControlPlan
ProcessCapability
StatisticalTolerance
AnalyticalReliability
&Robustne
ss(AR&R)
Tolerance Design
ParameterDesign
Numeric/Heuristic
OptimizationO
GageR&R
DimensionVariationAnalysis
RobustEngineering Designand R&RChecklist
AxiomaticDesign
FMEAP-
Diagram
System &FunctionalDiagrams
DesignedExperiment
ConceptGeneration &
SelectionD
DFSSScorecard
FDVS:Target
Setting &Verification
QualityLoss
Function
QualityHistory:
Warranty,etc.
QualityHistory:Surveys,Ratings,
etc.
BenchMarking
KanoModel
QFDMarket Research & Brand
AnalysisVoice of
CustomerI


![CONFIDENTIAL GlaxoSmithKline group of companies 201283 · the Clinical Study Report for Protocol [GlaxoSmithKline Document Number 2014N211002_00]and Protocol amendment [GlaxoSmithKline](https://static.documents.pub/doc/80x56/5f667658e5c63f1eec01e090/confidential-glaxosmithkline-group-of-companies-201283-the-clinical-study-report.jpg)


