D’Hondt, S.L., Jørgensen, B.B., Miller, D.J., et al., 2003 Proceedings of the Ocean Drilling Program, Initial Reports Volume 201 10. SITE 1229 1 Shipboard Scientific Party 2 BACKGROUND AND OBJECTIVES Site 1229 was one of three Leg 201 sites selected for drilling on the continental shelf of Peru. These shelf sites were collectively selected to provide records of microbial activities, communities, and geochemical consequences in organic-rich ocean-margin sediments. The principal objectives at this site were 1. To test by comparison with other sites drilled during this expe- dition whether microbial communities, microbial activities, and the nature of microbe-environment interactions are different in organic-rich ocean-margin sediments than in open-ocean sediments with less organic matter; 2. To test how the occurrence of sulfate-bearing subsurface brine affects microbial communities, microbial activities, and micro- bial influence on sediment chemistry in organic-rich, sulfate- depleted, methane-rich sediments; and 3. To provide multiple opportunities for recovering and identifying the sulfate-reducing methanotrophic communities of deeply buried marine sediments. Site 1229 is located on the Peru shelf in 150.5 m water depth. It is in the immediate vicinity of Leg 112 Site 681. As described in “Principal Results,” p. 2, in the “Site 1227” chapter, geochemical studies of Leg 112 sites show that brine is present below the seafloor in the Trujillo and Salaverry Basins (Suess, von Huene, et al., 1988). Site 1229 provides an opportunity to study how the presence of sulfate-bearing brine affects subseafloor life in organic-rich, sulfate-depleted, methane-rich sedi- ments. Consequently, it provides an excellent standard of comparison for Sites 1227 and 1228, which are, respectively, affected by the intru- sion of sulfate-free brine into organic-rich, sulfate-depleted sediments 1 Examples of how to reference the whole or part of this volume. 2 Shipboard Scientific Party addresses. Ms 201IR-110
Transcript
D’Hondt, S.L., Jørgensen, B.B., Miller, D.J., et al., 2003Proceedings of the Ocean Drilling Program, Initial Reports Volume 201
10. SITE 12291
Shipboard Scientific Party2
BACKGROUND AND OBJECTIVES
Site 1229 was one of three Leg 201 sites selected for drilling on thecontinental shelf of Peru. These shelf sites were collectively selected toprovide records of microbial activities, communities, and geochemicalconsequences in organic-rich ocean-margin sediments.
The principal objectives at this site were
1. To test by comparison with other sites drilled during this expe-dition whether microbial communities, microbial activities, andthe nature of microbe-environment interactions are different inorganic-rich ocean-margin sediments than in open-oceansediments with less organic matter;
2. To test how the occurrence of sulfate-bearing subsurface brineaffects microbial communities, microbial activities, and micro-bial influence on sediment chemistry in organic-rich, sulfate-depleted, methane-rich sediments; and
3. To provide multiple opportunities for recovering and identifyingthe sulfate-reducing methanotrophic communities of deeplyburied marine sediments.
Site 1229 is located on the Peru shelf in 150.5 m water depth. It is inthe immediate vicinity of Leg 112 Site 681. As described in “PrincipalResults,” p. 2, in the “Site 1227” chapter, geochemical studies of Leg 112sites show that brine is present below the seafloor in the Trujillo andSalaverry Basins (Suess, von Huene, et al., 1988). Site 1229 provides anopportunity to study how the presence of sulfate-bearing brine affectssubseafloor life in organic-rich, sulfate-depleted, methane-rich sedi-ments. Consequently, it provides an excellent standard of comparisonfor Sites 1227 and 1228, which are, respectively, affected by the intru-sion of sulfate-free brine into organic-rich, sulfate-depleted sediments
1Examples of how to reference the whole or part of this volume.2Shipboard Scientific Party addresses.
Ms 201IR-110
SHIPBOARD SCIENTIFIC PARTYCHAPTER 10, SITE 1229 2
and the intrusion of sulfate-rich brine into sediments with sulfate-bear-ing interstitial waters.
Shipboard chemical analyses from Leg 112 indicate that the concen-trations of methane at Site 681 increase from 102 to 105 µL/L in the first40 m of the sediment column and decline from 105 to 102 µL/L between73 and 100 meters below seafloor (mbsf) (Shipboard Scientific Party,1988). In contrast, the concentrations of dissolved sulfate decline to 0mM over the first ~30 mbsf, remain at or near 0 mM until 75 mbsf, andthen increase steadily with greater depths (Shipboard Scientific Party,1988). This downhole pattern of sulfate concentrations indicates activesulfate reduction at depths above 30 mbsf and below ~75–100 mbsf.The downhole pattern of methane concentrations indicates that meth-ane is created at depths of 60–70 mbsf and diffuses to the overlying andunderlying zones of active sulfate reduction, where both sulfate andmethane are destroyed.
Chloride concentrations increase steadily to the base of the hole.Ammonium concentrations decline slightly from the sediment/waterinterface to 12 mbsf, increase from 12 to 80 mbsf, and then begin to de-cline again. Alkalinity also declines from the sediment/water interfaceto 12 mbsf, increases to a subsurface maximum at 32 mbsf, and thendeclines again with depth. Calcium and magnesium concentrations ex-hibit minimum values at ~30 mbsf and then increase steadily to thebase of the hole. The magnesium/calcium ratio exhibits a broad peakfrom ~0 to 40 mbsf and then steadily declines to the base of the hole(Shipboard Scientific Party, 1988).
These downhole profiles of dissolved chemical concentrations arecollectively inferred to result from high levels of biological activity andbiologically driven solid-phase alteration throughout the sediment col-umn, coupled with diffusive exchange with the overlying ocean andwith a sulfate-bearing brine introduced at depth. Acridine orange directcounts show that prokaryotic cells are present in samples taken from asdeep as 80 mbsf at Site 681 (Cragg et al., 1990). Viable prokaryotes werefound and potential activity rates were identified in the same samples(Cragg et al., 1990). The subsurface extent of key electron donors (hy-drogen, acetate, and formate) and electron acceptors with standard free-energy yields greater than that of sulfate (oxygen, nitrate, manganeseoxide, and iron oxides) was not determined for Site 681.
PRINCIPAL RESULTS
An important objective for Site 1229 is to identify and quantifyzones of microbial activity based on reactive interstitial water species.Toward this end, we established a highly resolved chemical recordthroughout the drilled sediment column. Profiles of conservative ionsprovide evidence of diffusive mixing between seawater diffusing down-ward from the sediment/water interface and a brine diffusing upwardfrom older sediments. For example, concentrations of dissolved chlo-ride increase linearly from 559 mM at the sediment/water interface to1208 mM at the base of the drilled sediment column (186 mbsf). Peakconcentrations of biologically affected chemical species, such as ammo-nium (5800 µM) and dissolved inorganic carbon (DIC) (22 mM), indi-cate that rates of subseafloor microbial activity are much higher at thisocean-margin site than at open-ocean Sites 1225 and 1226. These peakconcentrations also suggest that the subseafloor microbial activity atSite 1229 is slightly greater than that at Site 1228 (which lies just sea-
SHIPBOARD SCIENTIFIC PARTYCHAPTER 10, SITE 1229 3
ward of Site 1229) and perhaps is slightly less than that at Site 1227(which is situated 310 km to the north on the Peru shelf).
As at Site 1228, the concentration profiles of several biologically af-fected chemical species exhibit a pronounced anomaly just below theseafloor (at 2–3 mbsf). This anomaly at Site 1229 consists of a brief pos-itive excursion in alkalinity, DIC, ammonium, and sulfide, with a co-occurring negative excursion in dissolved sulfate. The same anomaly isalso apparent in the ammonium and alkalinity profiles of Site 681(Shipboard Scientific Party, 1988). As described in “Principal Results,”p. 2, in the “Site 1228” chapter, this near-surface interstitial wateranomaly indicates that the steady-state diffusion of biologically activechemicals past the upper sediment column was disrupted by late Pleis-tocene environmental change and has not yet fully recovered. There areleast three possible general explanations of this anomaly. It may resultfrom ongoing activity in a microbial “hotspot” at this shallow sedimentdepth, it may be a chemical relic of past microbial activity (now relax-ing back to a diffusional steady state), or it may be a result of the recentestablishment of an oxygen minimum at this water depth, causing theextinction of a bioirrigating benthos and a stimulation of sulfate reduc-tion in the uppermost 2 m of sediment.
The most striking biogeochemical feature of this site is the reversal ofthe biogeochemical zonation at depth. This reversal is immediately ap-parent in the dissolved sulfate profile. The sulfate concentrations de-cline from a seawater value of 29 mM at the sediment surface to 0 mMat ~35 mbsf. They remain at 0 mM from 35 to 88 mbsf and thensteadily rise from 0 to 38 mM at 186 mbsf. The sulfate that sustains mi-crobial reduction over the uppermost 35 mbsf of the sediment columnultimately diffuses downward from the overlying ocean. The sulfatethat sustains microbial reduction below 88 mbsf is inferred to diffuseupward from the underlying brine. Both intervals of sulfate reductionare marked by local maxima in the concentrations of dissolved sulfide,with a broad peak from ~20 to 40 mbsf and a sharper peak at ~90 mbsf.
The sulfate profile is mirrored by the dissolved methane profile. Dis-solved methane concentrations are <100 µM from 0 to 20 mbsf, holdsteady at a few hundred micromolar from 20 to 35 mbsf, and then riseto values of ~2000 µM (exceeding 1 bar partial pressure) between 65and 75 mbsf. Methane then steadily declines to <100 µM at 93 mbsfand remains in the range of 100 µM or less to the base of the sampledsediment column. As at Site 1227, the disappearance of almost allmethane at the depths of sulfate depletion indicates that most of themethane in this sediment column is ultimately destroyed by anaerobicmethanotrophy. As observed at all previously drilled Leg 201 sites, theSite 1229 methane and sulfate profiles indicate that methane can bemaintained in subseafloor sediments at background concentrationsthat are inversely related to the co-occurring dissolved sulfate concen-trations.
The dissolved iron and manganese concentration profiles demon-strate that net reduction of iron and manganese oxides occurs in themethanogenic zone. The principal foci of net manganese and iron re-duction are at slightly different depths, with iron reduction peaking at75–90 mbsf and manganese reduction just above and below that inter-val. The presence of methanogenesis in iron- and manganese-reducingenvironments may result from a limited availability of mineral-suppliedelectron acceptors relative to electron donors. In these organic-rich sed-iments, electron donors may be supplied to the microbial community
SHIPBOARD SCIENTIFIC PARTYCHAPTER 10, SITE 1229 4
faster than mineral dissolution can supply dissolved reducible manga-nese and iron.
The dissolved barium profile is broadly similar to the methane pro-file. Dissolved barium concentrations are <2 µM from 0 to 24 mbsf.Concentrations of barium in interstitial water then rapidly rise to 18µM at 40 mbsf and remain near 19 µM until almost 80 mbsf. They thendecline steeply to 2 µM at ~100 mbsf and are <2 µM for the remainderof the drilled sediment column. As at Site 1227, the inverse relationshipbetween sulfate and barium is inferred to be controlled by the solubilityproduct of BaSO4 (barite). Upward diffusion of barium past 35 mbsf anddownward diffusion of barium past 90 mbsf is suspected to sustainmodern barite formation at, respectively, ~24 and 100 mbsf. Similarly,the shoulders of the barium peak at ~40 and 80 mbsf are inferred tomark the principal depths of current barite dissolution at this site.
Prokaryotic cell counts were done at 10-m intervals throughout theupper sediment column and across both sulfate/methane interfaces.These data show that mean sedimentary cell concentrations are several-fold higher at this ocean-margin site than at the Leg 201 open-oceansites and may be slightly higher than mean concentrations at nearbySite 1227. The most striking features of the shipboard cell counts arethe thousandfold increase in cell concentrations in the lower zone ofoverlapping sulfate and methane concentrations and the tenfold in-crease in cell concentrations in the upper zone of overlapping concen-trations. The maximum cell concentrations observed in the lower sul-fate/methane zone are actually an order of magnitude higher than theconcentrations observed at the sediment/water interface. Given thecoarse spacing of these samples and their positions relative to thechemically defined sulfate/methane overlap zones, the peak cell con-centrations observed in the upper sulfate/methane zone may greatlyunderestimate the peak concentrations in that zone.
Acetate and formate concentrations exhibit strong local maxima of~6 µM in both of the sulfate/methane interface zones. These maximaare centered at 37 and 90 mbsf. As with the cell counts, these local max-ima are higher than the local maxima exhibited by both acetate (~2µM) and formate (3 µM) at the sediment/water interface. Throughoutmost of the remaining record at this site, concentrations of both specieswere between 1 and 2 µM. As at Site 1227, the concentrations of bothspecies reach their highest values near the base of the drilled sedimentcolumn (~15 µM). These results are intriguing because these volatile ac-ids are important substrates for both sulfate reducers and methanogens.Hydrogen is another important electron donor in anaerobic communi-ties. Almost all hydrogen concentrations measured at this site were <0.5nM, and most were <0.2 nM. These concentrations resemble those ob-served at open-ocean Site 1225 and ocean-margin Site 1227. As noted in“Principal Results,” p. 2, in the “Site 1225” chapter and “Principal Re-sults,” p. 2, in the “Site 1227” chapter, these concentrations are muchlower than expected from experiments with sulfate-reducing and meth-anogenic communities of surface sediments. The accurate interpreta-tion of these acetate, formate, and hydrogen concentrations must awaitpostcruise analyses of prokaryotic energetics in subseafloor environ-ments.
The cell concentration data and sulfate and methane gradients dem-onstrate that the subseafloor prokaryotic population and activity are lo-cally strongly focused at the sulfate/methane overlap zone defined bythe upward-diffusing sulfate-bearing brine and the downward-diffusingmethane. The dissolved barium profile indicates that microbial activity
SHIPBOARD SCIENTIFIC PARTYCHAPTER 10, SITE 1229 5
in this zone directly influences sediment chemistry by mediating theprecipitation and dissolution of barite. In these effects on subsurface bi-ological activities and biogeochemical cycles, this brine-caused sulfate/methane interface mirrors the effects of the overlying “normal” sulfate/methane interface. Postcruise microbiological studies will be required todemonstrate whether or not the microbial community supported bythe brine-induced interface is locally unique or the same as that sup-ported by the overlying interface.
The upper sulfate-rich zone at Site 1229 lies entirely within litho-stratigraphic Subunit IA, a stratigraphic interval of primarily hemipe-lagic sediments (0–40 mbsf). The underlying methane-rich zone islargely limited to lithostratigraphic Subunit IB, which is the upper por-tion of a longer interval (40–138 mbsf) of mixed terrigenous and hemi-pelagic sediments. The anaerobic oxidation of methane (AOM) zonesthat separate the upper and lower sulfate-rich zones from the interven-ing methane-rich zone are associated with brief sedimentary intervalscharacterized by high grain density, high natural gamma radiation(NGR), high resistivity, and low porosity. These brief low-porosity inter-vals are unusually rich in terrigenous sediment and are interpreted tohave been deposited during the two most recent lowstands of fouronlap/offlap cycles that define the 40- to 138-mbsf interval.
In short, as at Site 1228, the upper sulfate-reducing interval at Site1229 is composed of predominantly hemipelagic sediments, thestrongly methanogenic zone is rich in terrigenous sediment relative tothe overlying sulfate-reducing zone, and the intervening AOM zone ispresent just above an interval of low-porosity, high-density lowstandsediments. The lower AOM zone at Site 1229 is present within a similarinterval of high-density, low-porosity lowstand sediments. The litho-logic association of AOM zones with high-density, low-porosity low-stand sediments at Sites 1229, 1228, and 1227 provides intriguing evi-dence that, on the Peru shelf, the position of AOM zones is currentlypinned within the sediment column by lithologic properties and, by ex-tension, depositional history.
As at Site 1227, stratigraphic patterns of magnetic susceptibility anddissolved manganese, iron, and sulfide concentrations indicate similarcontrol of other microbial processes by depositional history at Site1229. Magnetic susceptibility is generally much higher in the methano-genic zone and in the lower sulfate-reducing zone than in the overlyingsulfate-reducing zone. This circumstance suggests that mineral sourcesof reducible iron and manganese are more abundant in the terrigenous-dominated sediments of the lower sulfate-reducing zone and the mixedterrigenous and hemipelagic sediments of the methanogenic zone thanin the mostly hemipelagic sediments of the upper sulfate-reducingzone. The relatively high magnetic susceptibility of the intervals withmore strongly terrigenous sediments is consistent with our finding thatdissolved manganese and iron concentrations are generally higher inthe lower methanogenic zone and the underlying sulfate-reducing zonethan in the upper sulfate-reducing zone. The presence of higher manga-nese and iron concentrations and lower sulfide concentrations in theserelatively high susceptibility intervals in turn provides strong evidencethat the current rates and stratigraphic foci of iron reduction, manga-nese reduction, and sulfide precipitation depend strongly on deposi-tional history.
Experiments on major microbial processes and on enumeration of vi-able prokaryotes were initiated at selected depths ranging from near themudline to the bottom of the drilled sediment column. The studied
SHIPBOARD SCIENTIFIC PARTYCHAPTER 10, SITE 1229 6
processes include methane and acetate formation and consumption,sulfate reduction, hydrogen oxidation, and rates of cell growth. Thecultivation experiments include selective growth conditions for a widerange of autotrophic and heterotrophic microorganisms ranging frompsychrophilic to thermophilic. Detailed microbiological sampling tar-geted the top of the sediment column and both the upper and lowersulfate/methane overlap zones.
The results from one Davis-Villinger Temperature Probe (DVTP) de-ployment were combined with temperature data from Site 681 to definea linear gradient of 35.5°C/km for this site. The mean sediment/waterinterface temperature defined by this gradient is 13.4°C. The tempera-ture defined for the base of the drilled sediment column (193 mbsf) is20.2°C. Throughout this interval (0–193 mbsf), temperatures are in thelow mesophilic range.
Trials were undertaken of four experimental tools at this hole: thepressure coring sampler (PCS), the Davis-Villinger Temperature-PressureProbe (DVTP-P), the Advanced Hydraulic Piston Corer-Methane (APC-M) tool, and the Fugro percussion corer (FPC).
OPERATIONS
Transit to Site 1229
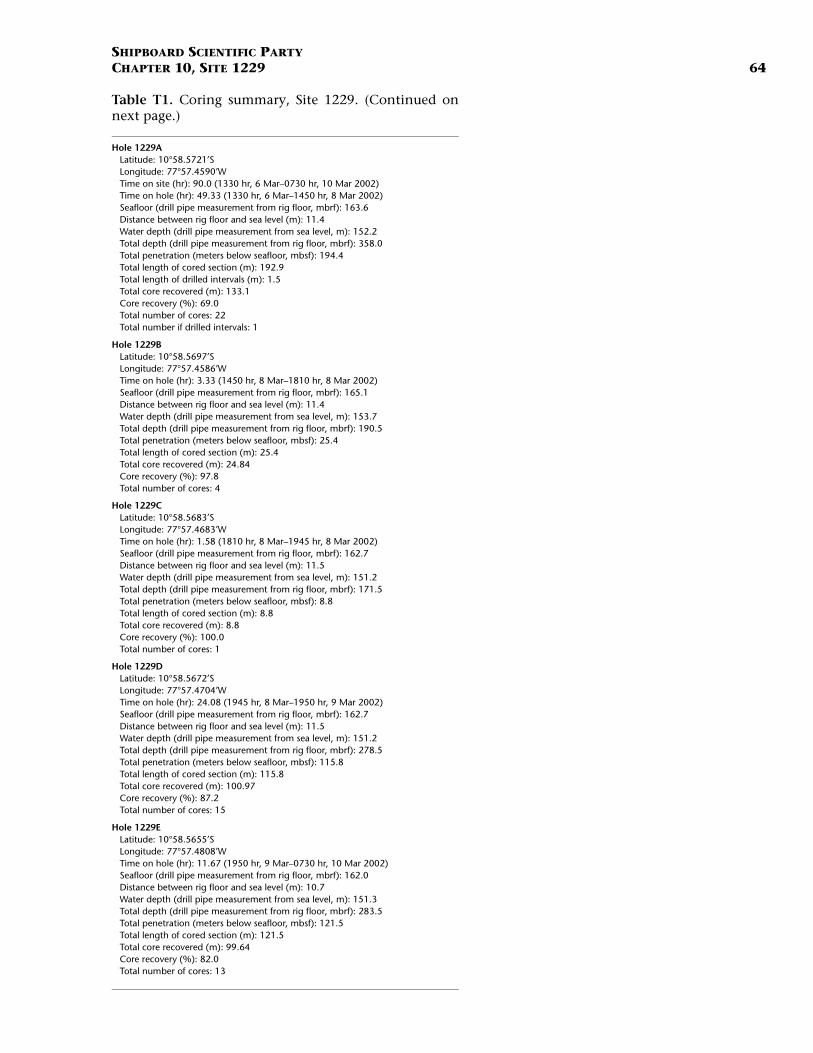
Sites 1228 and 1229 are 9 nmi apart, so the transit between themonly required an hour, and a positioning beacon was deployed at 1330hr on 6 March 2002 at the coordinates recorded in the Leg 112 InitialReports volume (Shipboard Scientific Party, 1988) and verified by theOcean Drilling Program (ODP) Drilling Services Department operationsreport for Leg 112. Coring operations at Site 1229 are detailed in TableT1.
Hole 1229A
Our first operation at Site 1229 was deployment of the water sam-pling temperature probe (WSTP) to collect a bottom-water sample. Ashort in the electronics prevented the tool from functioning properly,and an in-line capacitor was installed in the tool to prevent similar fail-ures in future deployments. Continuous advanced hydraulic piston cor-ing (APC) through Core 4H (0.0–33.4 mbsf) returned 98% recovery. Thesignal from a DVTP temperature measurement at this depth appearsnoisy, but a severe current was rattling the drill pipe and the formationmay have been unsuitable to sufficiently seal the tool in the sediment.APC coring continued to 58.9 mbsf (Cores 5H through 7H), where weintended to make another DVTP measurement, but poor recovery inthe last two cored intervals above this depth prompted us to delay thiseffort. Recovery improved on the next two cores (Cores 9H and 10H)(58.9–77.9 mbsf; recovery = 98%), so the DVTP and the DVTP-P weredeployed after Cores 9H and 10H, respectively.
As we experienced significant overpull while extracting Cores 9H and10H, mud pills were pumped after each subsequent core to clean thehole and we began operating in a drill-over mode. High recovery con-tinued through Core 12H (77.9–107.9 mbsf; recovery = 96%), followedby a third DVTP temperature measurement. Cores 13H and 14H (107.9–126.9 mbsf) had somewhat poorer results (average recovery = 75%). TheAPC-M tool was run continuously from Core 201-1229-2H through
T1. Coring summary, Site 1229, p. 64.
SHIPBOARD SCIENTIFIC PARTYCHAPTER 10, SITE 1229 7
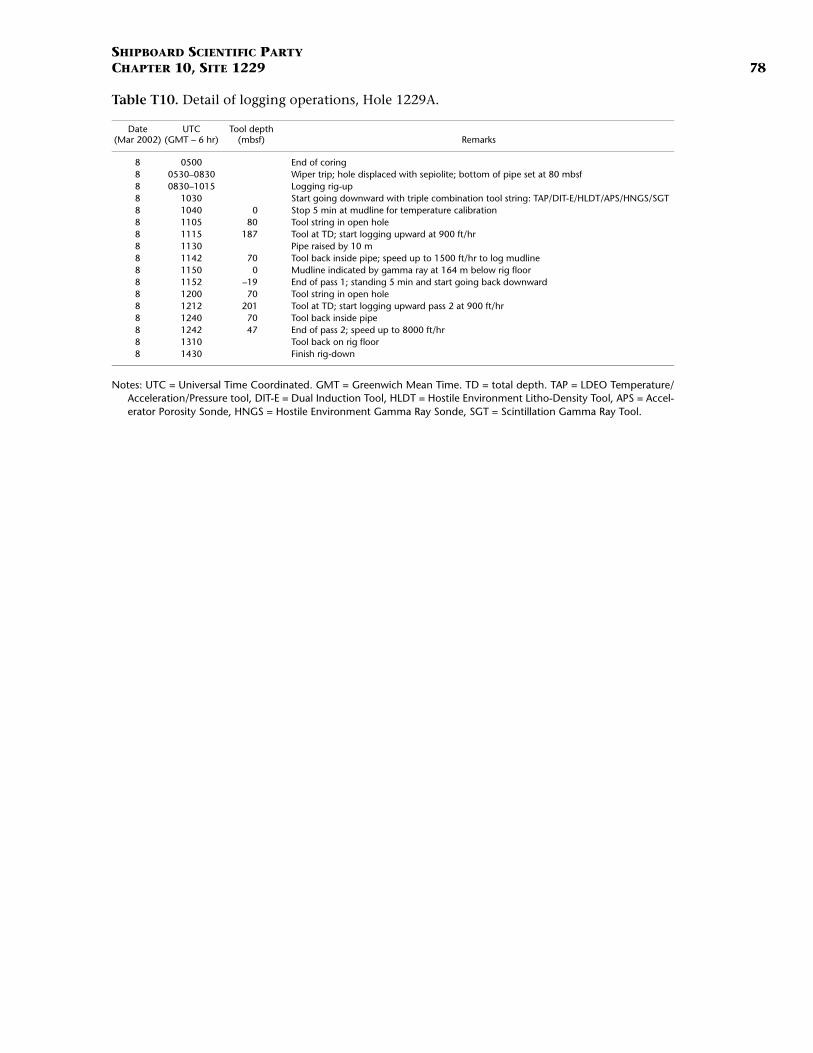
13H. The next three cores (Cores 15H through 17H; 126.9–155.4 mbsf)returned only severely disturbed cores composed of gravel and mud.Based on this result, we aborted a planned deployment of the FPC tool.Because our goal was improved recovery in the lower part of the sectioncompared to Leg 112, we drilled through this interval and attemptedtwo APC barrels (Cores 18H and 19H; 155.4–174.4 mbsf), which re-turned an interval satisfactory for geochemical and microbiologicalsampling. The DVTP was deployed after Core 18H at 164.9 mbsf. Core20M was a deployment of the FPC tool. Cores 21H and 22H took usnear our depth objective (194.4 mbsf), but we again experienced poorand disturbed recovery in muddy gravel, so we opted not to performplanned pressure and temperature measurements at this interval andaborted an additional run of the FPC tool as well. Operations at Hole1229A concluded with logging the entire cored interval using the triplecombination (triple combo) tool string.
Perfluorocarbon tracer (PFT) was pumped continuously in all holes atSite 1229 as part of our contamination monitoring protocol. In addi-tion, fluorescent microspheres were deployed on Cores 2H, 3H, 4H, 6H,9H, 11H, 16H, 17H, 19H, and 22H. Elevated hydrogen sulfide (as highas 50 ppm) was measured with handheld detectors at the rig floor andon the catwalk for the upper part of the cored interval, although hydro-gen sulfide was undetectable below 30 mbsf. Nevertheless, alert precau-tions were maintained throughout coring at this site.
Hole 1229B
Using the dynamic positioning system, we offset 5 m north fromHole 1229A to initiate Hole 1229B. We were restricted in offset distanceand direction in order to maintain a reasonably clean signal from thepositioning beacon in shallow water. The upper three cores from thishole (Cores 1H through 3H) (0.0–24.4 mbsf; recovery = 102%) werededicated to shore-based paleoceanography studies, so the cores werenot split and the end caps were sealed with tape rather than acetone.Operations at Hole 1229B concluded with a deployment of the FPC toolat 24.4 mbsf. During this deployment the tool was damaged beyondour capacity to repair at sea, so no more deployments were planned.
Holes 1229C and 1229D
After an offset of 20 m west from Hole 1229B, operations began inHole 1229C with a WSTP deployment, which returned a bottom-watersample. High-resolution sampling of the upper few meters of the sedi-ment column was one of our objectives for this hole, so when Core 201-1229C-1H returned with the upper end of the core liner collapsed andthe mudline disturbed, we terminated the hole. A second mudline at-tempt, offset 5 m west-northwest (Core 201-1229D-1H) (0.0–6.8 mbsf;recovery = 100%), was suitable for our sampling plan and initiated Hole1229D.
Continuous APC coring continued through Core 201-1229D-9H (to77.8 mbsf), averaging 81% recovery. The core liner on Core 201-1229D-8H was shattered, resulting in a severely disturbed core. A PCS deploy-ment on Core 201-1229D-10P returned under hydrostatic pressure andcontained a mixture of air and methane. An interval between 85 and 90mbsf that fell at the junction between cored intervals in Hole 1229Awas determined by geochemical analysis to be of particular interest, sowe asked the drilling crew to optimize our chances of complete recov-
SHIPBOARD SCIENTIFIC PARTYCHAPTER 10, SITE 1229 8
ery of this interval in Hole 1229D. Core 201-1229D-11H was shot from5 m above the bottom of the hole, thus advancing only 4.5 m to 84.3mbsf. The subsequent Core 201-1229D-12H bridged the interval of in-terest, and although the core was partially disturbed, sufficient intactmaterial was recovered to sample for geochemistry and microbiology.Cores 201-1229D-13H through 15H (0.0–115.8 mbsf; recovery = 72%)completed operations in Hole 1229D.
Hole 1229E
For our final penetration at Site 1229, we offset 20 m west of Hole1229D. Continuous APC coring from Core 1H through 13H (0.0–121.5mbsf; recovery = 82%) was interrupted only by a short deployment ofthe DVTP at 83.5 mbsf to augment our thermal profile at this site. Oper-ations at Site 1229 concluded when the bit passed through the rig floorat 0700 hr on 10 March, and we began our transit to Site 1230.
LITHOSTRATIGRAPHY
At Site 1229 we recovered a 194.4-m-thick sequence of mixed diato-maceous and siliciclastic sediments. According to the biostratigraphicand magnetostratigraphic chronostratigraphy established for Site 681,which is located in close proximity of Site 1229 (Shipboard ScientificParty, 1988), updated according to Berggren et al. (1995), the entire sed-imentary sequence is late Pliocene to Pleistocene age. In order to estab-lish unit and subunit boundaries, information from Holes 1229A and1229D is combined to fill gaps caused by poor recovery. Based on litho-logic changes detected by means of visual core description, smear slideanalysis, color reflectance, X-ray diffraction (XRD), and laboratory mea-surements of magnetic susceptibility, bulk density, and NGR (see “Phys-ical Properties,” p. 20), two lithostratigraphic units were established.Unit I was further subdivided into Subunits IA–IC (Figs. F1, F2).
Description of Lithostratigraphic Units
Unit I
Interval: 201-1229A-1H-1 through 16H-2 and 201-1229D-1H-1through 15H-CC
Depth: 0–138.6 mbsf (Hole 1229A) and 0–138.6 mbsf (Hole 1229D)Age: Pleistocene to Holocene
The lithology of Unit I is characterized by alternations of olive-greenwell-laminated diatom- and clay-rich silt and clay-and silt-rich diatomooze. Gray, partly green, more homogeneous silty clay is more abundantin the central part of the unit (Fig. F1). The lower boundary is defined bya transition from green diatom-rich sediments above and clayey silt andsand below. The lithostratigraphic boundary is present below the lower-most layers of diatom-rich sediment in Section 201-1229A-16H-2.
Subunit IA
Interval: 201-1229A-1H-1 through 6H-1 and 201-1229D-1H-1through 6H-2
Depth: 0–40.7 mbsf (Hole 1229A) and 0–42.8 mbsf (Hole 1229D)
0 2 4 6 8 10
Dep
th (
mbs
f)
1H 1H1H 1H 1H
2H
3H
4H
5H
6H
7H
8H
9H
10H
11H
12H
13H
2H
3H
4H
5H
6H
7H
8H
9H
11H
12H
13H
14H
15H
10P
2H
3H
4MTD
25.4 mbsf
TD8.8 mbsf
TD115.8mbsf TD
121.5mbsf
2H
3H
4H
5H
6H
7H
8H
9H
10H
11H
12H
13H
14H
15H
16H
17H
18H
19H
21H
22H
20M
Drilled
Hole1229A
Hole1229B
Hole1229C
Hole1229D
Hole1229E
TD194.4 mbsf
Cor
e
Rec
over
y
Cor
e
Rec
over
y
Cor
e
Rec
over
y
Cor
e
Rec
over
y
Cor
e
Rec
over
y
10
20
30
40
60
70
80
90
110
120
130
140
160
170
180
190
50
100
150
200
Color Reflectance (b*)
Ph
Ph
Ph
PhPhPh
Ph
Ph
Ph
IA
IB
IC
Olive-green, yellowlaminated diatom- and
silt-bearing clayand diatom and clay-richsilt with nannofossil-rich
laminae andgray silty layers
Alternation between olive-green diatom- and silt-rich
clay, rich in dolomite and phosphate nodules
Well-laminated clay- andsilt-rich diatom ooze,
cross-bedding and erosionsurfaces at the top, silt and
The major lithology of Subunit IA consists of olive-green diatom-andclay-rich silt. Millimeter-scale laminated zones alternate with slightlygrayer, almost homogeneous zones with higher clay and silt content.The yellow laminae are enriched in diatoms, some of them showing analmost pure pinnate diatom assemblage. A few calcite-rich nannofossilooze laminae are present (e.g., XRD Sample 201-1229A-2H-1, 105–106cm). The uppermost 3 m of Cores 201-1229A-1H and 201-1229D-1Hconsist of brown, bioturbated, and poorly laminated clay-rich diatomooze. Bioturbation is poorly developed throughout the rest of the unit.Gray silty clay layers are common sedimentary features. Cross-lamina-tion is present in Sections 201-1229A-5H-4 and 5H-6 and also in interval201-1229D-1H-2, 90–120 cm (Fig. F3A). Two erosional surfaces coveredwith coarser silty and fine sandy layers are present in Sections 201-1229A-2H-6 and 6H-2. The first authigenic dolomite nodule is present at3.8 mbsf (XRD Sample 201-1229A-1H-3, 84–85 cm). X-ray diffractions ofthe uppermost dolostone nodules revealed the presence of a small cal-citic component together with dolomite (Sample 201-1229A-2H-1, 56–57 cm) (see “Mineralogy,” p. 11), which might be due to nannofossils.Authigenic dolomite becomes more common below 30 mbsf. Dissemi-nated rhombs of dolomite are concentrated around dolomite nodules orin yellow laminae (Fig. F3B). The uppermost occurrence of phosphate isat 1.2 mbsf (XRD Sample 201-1229E-1H-1, 122–124 cm). Sections 201-1229E-1H-3 and 1H-4 contain several centimeter-sized phosphate nod-ules. They are commonly present together with dolomites, but a clear re-lationship between these two diagenetic minerals could not be estab-lished.
The lower boundary of Subunit IA is marked by an erosional surfaceoverlain by phosphatic sand. A gravel zone at the top of Core 201-1229A-6H, which also contains phosphatic nodules, is probably an arti-fact of the drilling process.
Changes in color reflectance were most obvious in the yellow-bluecolor reflectance spectrum (chromaticity variable b*; Fig. F1). Decreas-ing b* values coincide with changes in some of the physical properties,such as magnetic susceptibility and bulk density (see “Physical Proper-ties,” p. 20). A sharp spike of natural gamma radiation at 40.7 mbsf co-incides exactly with the erosional surface at the lower boundary of Sub-unit IB.
Subunit IB
Interval: 201-1229A-6H-1 through 11H-6Depth: 40.7–96.9 mbsf
An alternation of gray homogeneous quartz- and feldspar-rich claylayers and olive-green laminated diatom-rich silty clay characterizes thelithology of Subunit IB. Three ~10-m-thick gray siliciclastic layerspresent in the subunit are spread roughly 25 m apart. Slumping, cross-lamination, sandy graded beds, and lenses of shell debris are common(Fig. F3D). Quartz and plagioclase are present in variable amountsthroughout the subunit. Dolomite forms pale yellow and gray nodulesand semilithified yellow laminae, which are especially abundant in thelower part of the subunit (Fig. F1). Dolomite can also be found as whiteprecipitates along millimeter-scale quartz sand–filled dikes that repre-sent fluid escape structures (Section 201-1229A-10H-1; XRD results forSample 201-1229A-10H-1, 111–114 cm) (Fig. F3C).
The upper boundary of Subunit IB is sharp and is present belowphosphatic sediments overlying an erosional surface (see Subunit IA).
cm
110
120
100
90
A201-1229D-1H-2, 90-120 cm cm
90
80
70
B201-1229A-1H-3, 70-95 cm
F3. Site 1229 features, p. 35.
SHIPBOARD SCIENTIFIC PARTYCHAPTER 10, SITE 1229 10
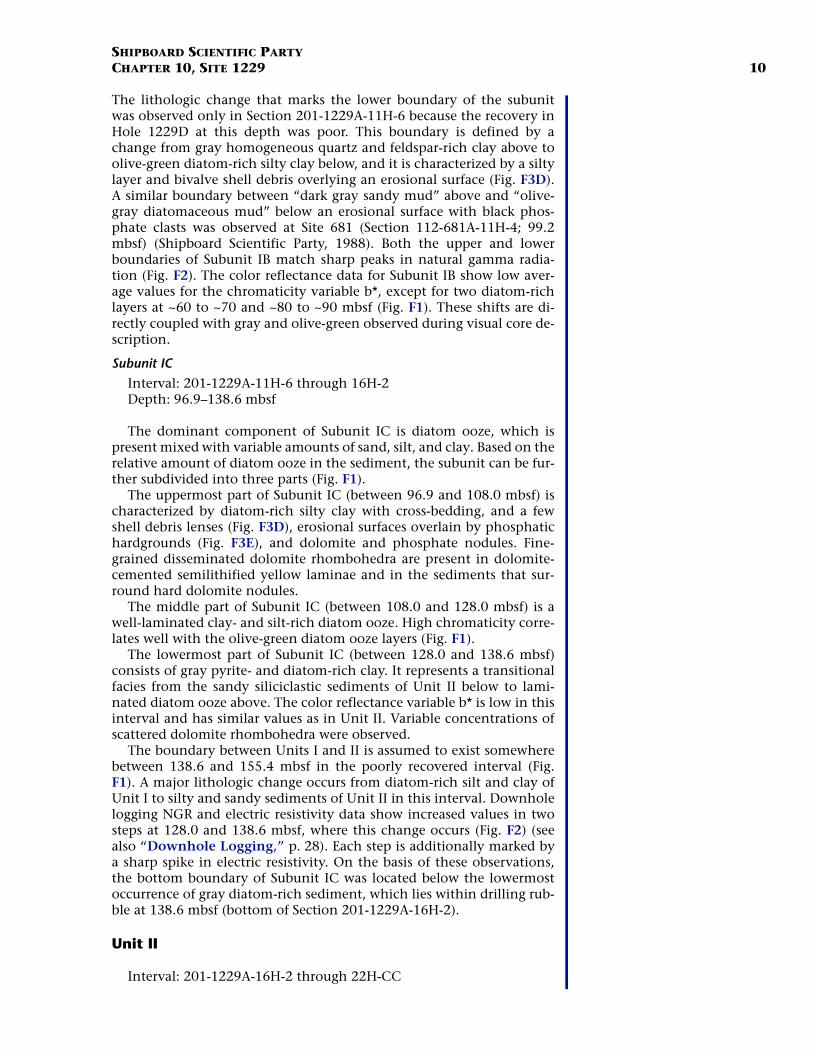
The lithologic change that marks the lower boundary of the subunitwas observed only in Section 201-1229A-11H-6 because the recovery inHole 1229D at this depth was poor. This boundary is defined by achange from gray homogeneous quartz and feldspar-rich clay above toolive-green diatom-rich silty clay below, and it is characterized by a siltylayer and bivalve shell debris overlying an erosional surface (Fig. F3D).A similar boundary between “dark gray sandy mud” above and “olive-gray diatomaceous mud” below an erosional surface with black phos-phate clasts was observed at Site 681 (Section 112-681A-11H-4; 99.2mbsf) (Shipboard Scientific Party, 1988). Both the upper and lowerboundaries of Subunit IB match sharp peaks in natural gamma radia-tion (Fig. F2). The color reflectance data for Subunit IB show low aver-age values for the chromaticity variable b*, except for two diatom-richlayers at ~60 to ~70 and ~80 to ~90 mbsf (Fig. F1). These shifts are di-rectly coupled with gray and olive-green observed during visual core de-scription.
Subunit IC
Interval: 201-1229A-11H-6 through 16H-2Depth: 96.9–138.6 mbsf
The dominant component of Subunit IC is diatom ooze, which ispresent mixed with variable amounts of sand, silt, and clay. Based on therelative amount of diatom ooze in the sediment, the subunit can be fur-ther subdivided into three parts (Fig. F1).
The uppermost part of Subunit IC (between 96.9 and 108.0 mbsf) ischaracterized by diatom-rich silty clay with cross-bedding, and a fewshell debris lenses (Fig. F3D), erosional surfaces overlain by phosphatichardgrounds (Fig. F3E), and dolomite and phosphate nodules. Fine-grained disseminated dolomite rhombohedra are present in dolomite-cemented semilithified yellow laminae and in the sediments that sur-round hard dolomite nodules.
The middle part of Subunit IC (between 108.0 and 128.0 mbsf) is awell-laminated clay- and silt-rich diatom ooze. High chromaticity corre-lates well with the olive-green diatom ooze layers (Fig. F1).
The lowermost part of Subunit IC (between 128.0 and 138.6 mbsf)consists of gray pyrite- and diatom-rich clay. It represents a transitionalfacies from the sandy siliciclastic sediments of Unit II below to lami-nated diatom ooze above. The color reflectance variable b* is low in thisinterval and has similar values as in Unit II. Variable concentrations ofscattered dolomite rhombohedra were observed.
The boundary between Units I and II is assumed to exist somewherebetween 138.6 and 155.4 mbsf in the poorly recovered interval (Fig.F1). A major lithologic change occurs from diatom-rich silt and clay ofUnit I to silty and sandy sediments of Unit II in this interval. Downholelogging NGR and electric resistivity data show increased values in twosteps at 128.0 and 138.6 mbsf, where this change occurs (Fig. F2) (seealso “Downhole Logging,” p. 28). Each step is additionally marked bya sharp spike in electric resistivity. On the basis of these observations,the bottom boundary of Subunit IC was located below the lowermostoccurrence of gray diatom-rich sediment, which lies within drilling rub-ble at 138.6 mbsf (bottom of Section 201-1229A-16H-2).
Unit II
Interval: 201-1229A-16H-2 through 22H-CC
SHIPBOARD SCIENTIFIC PARTYCHAPTER 10, SITE 1229 11
Depth: 138.6–194.4 mbsfAge: late Pliocene–Pleistocene
Unit II consists of an almost pure siliciclastic packet of Pleistocenesediments. The main lithology is dark gray hornblende-bearing feldspar-quartz sand with variable amounts of clay. Feldspar and quartz grains arewell rounded, and their relative amounts vary strongly. The sedimentsare slightly laminated and show few burrows. In Core 201-1229A-18H,sedimentary structures, such as flat and subangular gray mud clasts, pos-sibly related to synsedimentary slumping, were observed. Authigenicminerals, such as phosphate and dolomite, are present in Unit II but areless abundant compared to Unit I. They are present as disseminatedgrains in sand layers (see “Mineralogy,” p. 11), and nodules were nolonger observed.
The upper boundary of Unit II is marked by the onset of diatoma-ceous ooze layers, which indicates the end of a time period with majorsiliciclastic input. This transition is poorly documented in Core 201-1229A-16H (see above). However, the transition is well defined in wire-line logging data (NGR and electrical resistivity) (see “Downhole Log-ging,” p. 28). Because of both the gray color and the low diatom con-tent, Unit II usually shows low and less variable chromaticity values.
Mineralogy
A total of 21 samples were collected at Site 1229 for XRD analysis. Ingeneral, XRD data confirm lithologic observations made during visualcore description.
For instance, calcite was found in Sample 201-1229A-2H-1, 105–106cm, which had been collected from a nannofossil-rich layer in SubunitIA. The presence of quartz and feldspar in all measured samples fromSite 1229 suggests a continual supply of terrigenous input, even duringthe deposition of the biogenic subunits (e.g., Subunit IC). Quartz is es-pecially common in some of the gray layers observed in Subunit IA(Sample 201-1229A-1H-2, 70–71 cm). In all XRD samples from Unit I,feldspar is only a minor mineralogic component, whereas in Unit II itcan be more abundant than quartz (Samples 201-1229A-19H-2, 40–41cm, and 19H-3, 60–61 cm). Pure quartz sand was observed as filling of afluid escape structure (Sample 201-1229A-10H-1, 111–114 cm). Horn-blende was mainly found in the silts and sands of Unit II (Samples 201-1229A-19H-2, 40–41 cm, and 19H-3, 60–61 cm).
The main diagenetic minerals at Site 1229 are dolomite and phos-phate. Dolomite is mostly present as pale yellow and gray (3–5 cmthick) hard nodules (Samples 201-1229A-1H-3, 84–85 cm, and 8H-1,62–64 cm). Only dolomite nodules from Subunit IA contained traceamounts of calcite, possibly due to calcareous nannofossils (Sample201-1229A-2H-1, 105–106 cm). Disseminated dolomite was detectedboth by smear slide and XRD analyses (Sample 201-1229A-3H-1, 56–57cm). It was observed in pale yellow altered zones, which are preferen-tially present around hard lithified dolomite nodules and within dia-tom-rich laminae. These scattered dolomite rhombohedra might repre-sent an early stage of the formation and growth of a hard nodule.Dolomite peaks are commonly offset by ~0.2°2θ relative to the standardpeak for ordered dolomite, indicating calcium-rich dolomite (Fig. F4)(Samples 201-1229A-1H-3, 84–85 cm; 3H-1, 56–57 cm; 2H-1, 105–106cm; and 8H-1, 62–64 cm). Phosphate grains found in black sands (UnitII) were identified by XRD as fluorapatite (Sample 201-1229A-21H-1, 0
200
400
600
800
1000
1200
1400
1600
1800
2000
cps
10 20 30 40 50 60
Quartz, syn: JCPDS 33-1161: SiO2
Dolomite: JCPDS 36-0426: CaMg(CO3)2
4.257
3.342
2.457 2.282
2.237
2.1271.9792
1.8179
1.80211.6719
1.65911.6082
4.033 3.699
2.888
2.672.539
2.404
2.193
2.0652.015
2.0061.8473
1.80491.787
1.78
1.74611.5667
1.5446
Qua
rtz:
26.
674°
2θ
Ord
ered
dol
omite
: 30.
965°
2θ
30.7
2°2θ
26.6
2°2θ
°2θ CuKα
F4. Diffractogram of dolomite, p. 38.
SHIPBOARD SCIENTIFIC PARTYCHAPTER 10, SITE 1229 12
30–31 cm); however, dark D-phosphate nodules and several orangespots of F-phosphate were found (Samples 201-1229A-13H-2, 103–104cm, and 21H-1, 30–31 cm).
Summary
The 194.4-m-thick late Pliocene to Pleistocene sequence drilled atSite 1229 was divided into two units. Unit I consists of 138 m of mixeddiatom-rich hemipelagic and siliciclastic sediment. Unit II is mostlycomposed of siliciclastic sands. Based on the relative amount of clayand silt in the diatom ooze–dominated sediments of Unit I, three sub-units were recognized: Subunit IA consists of olive-green laminatedclay-rich diatom and nannofossil ooze and diatom-rich silt and clay.The uppermost 3 m of the subunit consists of poorly laminated brownclay-rich diatom ooze. The lower boundary is marked by an erosionalsurface overlain by phosphatic sand. In Subunit IB, both diatom oozeand terrigenous silt and clay are present. Cross-lamination, erosionalsurfaces, and burrowing characterize the diatom-poor layers. Subunit ICconsists of a 42-m-thick interval of diatom-rich silty clay and diatomooze. Planar lamination is present throughout the unit. Cross-lamina-tion and erosional surfaces are present at the top of the subunit.
Unit II consists of homogeneous slightly burrowed hornblende-bearing quartz- and feldspar-rich sand. The most prominent diageneticfeature of this site is the presence of dolomitic and phosphatic miner-als, which were observed also at very shallow burial depth. Nodules ofdolomite and phosphate are abundant throughout Unit I, and dissemi-nated dolomite is present in Unit II. Disseminated dolomite rhombo-hedra are abundant in pale yellow zones around hard lithified dolomitenodules and in yellow diatom-rich laminae. Dolomite nodules are oftenpresent together with phosphatic nodules.
Variations between diatom-rich and predominantly siliciclastic li-thologies observed in the different units and subunits are also identifi-able by several physical properties, including color reflectance, mag-netic susceptibility, and bulk density. Erosional surfaces observedduring visual core description appear to match some of the spikes innatural gamma radiation.
BIOGEOCHEMISTRY
Interstitial Water
Site 1229 is characterized by the presence of a deep brine that intro-duces sulfate at depth. The interstitial water (IW) sampling scheme forSite 1229 was designed to recover dissolved components at high spatialresolution along the transition from seawater to subsurface brine. Addi-tional sampling was targeted at key biogeochemical intervals includingthe uppermost sediment column and two sulfate–methane transitions.
A total of 106 IW samples were obtained from Site 1229. From Hole1229A, 52 samples were collected at an average resolution of two tothree per core, except in Cores 201-1229A-9H, 10H, 11H, and 12H,where resolution was increased to five to seven samples per core (aboutone per section), and in Cores 6H and 7H, where no samples were re-covered between 42.9 and 60.2 mbsf. Sampling in Hole 1229D includeda bottom-water sample (WSTP) and high-resolution coverage (five toseven samples per core) of the first five cores between 0 and 40.7 mbsf.
SHIPBOARD SCIENTIFIC PARTYCHAPTER 10, SITE 1229 13
Two samples per core were collected between 40.7 mbsf and the bottomof the hole at 107.6 mbsf, except in the case of the intervals between77.8 and 84.3 mbsf and 96.8 and 106.3 mbsf, where samples were notavailable.
As at previous Leg 201 sites, we determined concentrations of impor-tant electron donor/acceptor species and microbial metabolites includ-ing volatile fatty acids (acetate and formate), methane, ethane, pro-pane, hydrogen, ammonium, phosphate, DIC, sulfate, iron, andmanganese.
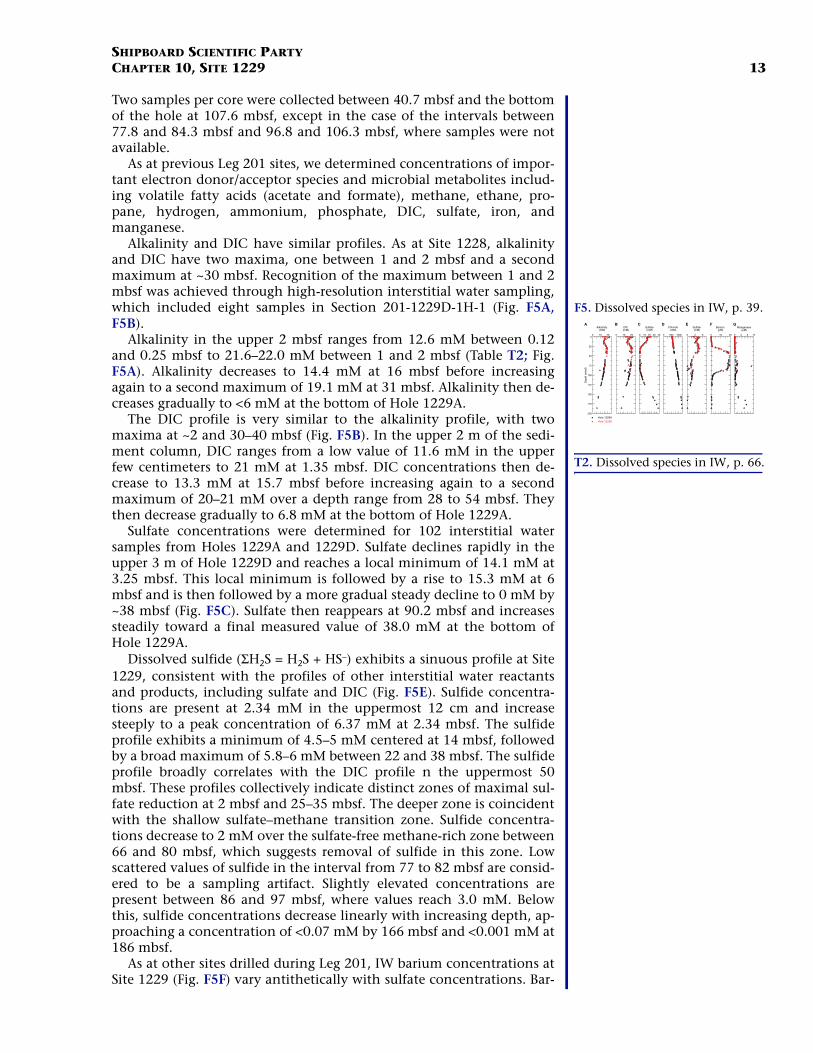
Alkalinity and DIC have similar profiles. As at Site 1228, alkalinityand DIC have two maxima, one between 1 and 2 mbsf and a secondmaximum at ~30 mbsf. Recognition of the maximum between 1 and 2mbsf was achieved through high-resolution interstitial water sampling,which included eight samples in Section 201-1229D-1H-1 (Fig. F5A,F5B).
Alkalinity in the upper 2 mbsf ranges from 12.6 mM between 0.12and 0.25 mbsf to 21.6–22.0 mM between 1 and 2 mbsf (Table T2; Fig.F5A). Alkalinity decreases to 14.4 mM at 16 mbsf before increasingagain to a second maximum of 19.1 mM at 31 mbsf. Alkalinity then de-creases gradually to <6 mM at the bottom of Hole 1229A.
The DIC profile is very similar to the alkalinity profile, with twomaxima at ~2 and 30–40 mbsf (Fig. F5B). In the upper 2 m of the sedi-ment column, DIC ranges from a low value of 11.6 mM in the upperfew centimeters to 21 mM at 1.35 mbsf. DIC concentrations then de-crease to 13.3 mM at 15.7 mbsf before increasing again to a secondmaximum of 20–21 mM over a depth range from 28 to 54 mbsf. Theythen decrease gradually to 6.8 mM at the bottom of Hole 1229A.
Sulfate concentrations were determined for 102 interstitial watersamples from Holes 1229A and 1229D. Sulfate declines rapidly in theupper 3 m of Hole 1229D and reaches a local minimum of 14.1 mM at3.25 mbsf. This local minimum is followed by a rise to 15.3 mM at 6mbsf and is then followed by a more gradual steady decline to 0 mM by~38 mbsf (Fig. F5C). Sulfate then reappears at 90.2 mbsf and increasessteadily toward a final measured value of 38.0 mM at the bottom ofHole 1229A.
Dissolved sulfide (ΣH2S = H2S + HS–) exhibits a sinuous profile at Site1229, consistent with the profiles of other interstitial water reactantsand products, including sulfate and DIC (Fig. F5E). Sulfide concentra-tions are present at 2.34 mM in the uppermost 12 cm and increasesteeply to a peak concentration of 6.37 mM at 2.34 mbsf. The sulfideprofile exhibits a minimum of 4.5–5 mM centered at 14 mbsf, followedby a broad maximum of 5.8–6 mM between 22 and 38 mbsf. The sulfideprofile broadly correlates with the DIC profile n the uppermost 50mbsf. These profiles collectively indicate distinct zones of maximal sul-fate reduction at 2 mbsf and 25–35 mbsf. The deeper zone is coincidentwith the shallow sulfate–methane transition zone. Sulfide concentra-tions decrease to 2 mM over the sulfate-free methane-rich zone between66 and 80 mbsf, which suggests removal of sulfide in this zone. Lowscattered values of sulfide in the interval from 77 to 82 mbsf are consid-ered to be a sampling artifact. Slightly elevated concentrations arepresent between 86 and 97 mbsf, where values reach 3.0 mM. Belowthis, sulfide concentrations decrease linearly with increasing depth, ap-proaching a concentration of <0.07 mM by 166 mbsf and <0.001 mM at186 mbsf.
As at other sites drilled during Leg 201, IW barium concentrations atSite 1229 (Fig. F5F) vary antithetically with sulfate concentrations. Bar-
0 500 1000
Chloride(mM)
D
0 10 20 30 40
Sulfate(mM)
C
0
25
50
75
100
125
150
175
200
0 10 20
Alkalinity(mM)
Hole 1229A
Hole 1229D
Dep
th (
mbs
f)
A
0 10 20
DIC(mM)
B
0 4 8
Sulfide(mM)
E
0 10 20
Barium (µM)
F
0 4 8 12
Manganese(µM)
G
F5. Dissolved species in IW, p. 39.
T2. Dissolved species in IW, p. 66.
SHIPBOARD SCIENTIFIC PARTYCHAPTER 10, SITE 1229 14
ium is close to the detection limit (~0.1 µM) at the sediment/water in-terface, where sulfate is high, but sharply rises to 19 µM at 42 mbsf,where sulfate is below detection limit. Across the sulfate-depleted zoneat Site 1229 from 42 to 86 mbsf, barium concentrations range between16.5 and 19 µM. Below this interval, sulfate concentrations steadily riseand dissolved barium concentrations decrease to 0.5 µM at 156.75mbsf. The overall barium profile at Site 1229 most likely is controlledby barite solubility. Interestingly, however, barium concentrations atthe bottom of the hole exceed those at the top, despite higher sulfateconcentrations at the bottom.
With the exception of one sample at 76.85 mbsf, the dissolved man-ganese concentrations at Site 1229 (Fig. F5G) are low (<2 µM) over theupper 115 mbsf. Below this depth, dissolved manganese concentrationsrise to >6 µM at 166.25 mbsf. Site 1229 is located at the upper boundaryof a strong oxygen minimum zone.
The low dissolved manganese concentrations may reflect a lack ofsolid manganese inputs because they are reduced in the water columnor in the upper few centimeters of the seafloor. Interestingly, however,lightly elevated concentrations of dissolved manganese (~2 µM), cen-tered at ~69 and 92 mbsf, suggest reduction of some manganese-bearingphase in the middle of the sediment sequence. The sample with anom-alously high manganese (and iron) concentrations (Sample 201-1229A-9H-6, 95–110 cm) may be affected by an unknown artifact or contami-nation.
The dissolved iron profile (Fig. F5H) shows a high degree of scatterbut generally low values (<2 µM) down to ~125 mbsf, with one excep-tion. Between 78 and 92 mbsf, the iron concentrations of several sam-ples are >10 µM. Iron concentrations are also relatively high (>5 µM)below 125 mbsf. Most labile iron in the sediment column at Site 1229has probably been precipitated as sulfides.
Dissolved strontium concentrations (Fig. F5I) rise significantly from90 µM at the seafloor to 360 µM at 186 mbsf. As at Sites 1227 and 1228,the strontium gradient of Site 1229 decreases with depth, changingfrom 2.1 µM/m over the upper 100 m to 0.6 µM/m over the lower 90 m.Interestingly, of the three sites, the curvature to a smaller gradient oc-curs deepest and is most pronounced at Site 1229. The steep strontiumgradients and curvature imply both a diagenetic release of strontium inthe cored section and a flux of strontium from deep brines to shallowsediment and seawater. The similarity in the strontium concentrationgradients at Sites 1228 and 1229 suggests that brines beneath these twoholes are similar in chemical composition.
Dissolved lithium concentrations (Fig. F5J) rise from 27 µM at theseafloor to 184 µM at the bottom of the hole. However, unlike at Sites1227 and 1228, this ~1.0-µM/m increase in lithium is less than the in-crease in strontium. The cause of the range in lithium gradients is un-known but, in contrast to the strontium gradients, may suggest differ-ences in diagenetic exchange and in the composition of the sourcebrine. Nonetheless, as at the other sites, a substantial flux of lithium oc-curs from deep brine to the shallow sediment and seawater.
The ammonium profile in the upper 43 m at Site 1229 is very similarto that observed at Site 1228. It has two distinct maxima, one between1.3 and 4.3 mbsf (as at Site 1228) and a second broader maximum(~5000 µM) centered between ~50 and 75 mbsf (Fig. F5K). Below 75mbsf there is a linear decrease to ~4000 µM at 159.75 mbsf.
As at Sites 1227 and 1228, the dissolved phosphate concentrationwas determined on splits of 55 IW samples (46 from Hole 1229A and 9
SHIPBOARD SCIENTIFIC PARTYCHAPTER 10, SITE 1229 15
from Hole 1229D) that were previously analyzed for alkalinity in orderto overcome chemical interferences from hydrogen sulfide (see “Bio-geochemistry,” p. 14, in the “Site 1227” chapter).
The upper 10 m of the phosphate concentration profile in Hole1229D (Fig. F5M) is very similar to the Site 1228 profile, with maximumconcentrations of ~42 µM in the upper 2 mbsf and a decline to a localminimum of 6.6 µM at 12.2 mbsf. Below 12.2 mbsf, phosphate concen-trations increase toward a second local maximum of 12.7 µM at 31.25mbsf. Between ~40 and 71 mbsf, phosphate concentrations declinegradually to 4–5 µM at a depth of 160 mbsf and then increase to 7.8 µMat 186.2 mbsf. The sharp decrease above 12 mbsf and relatively smallrange below is consistent with control of phosphate by apatite solubil-ity below this depth.
Dissolved silica concentrations in Holes 1229A and 1229D are fairlyconstant by 18 mbsf and range between ~950 and 1050 µM over mostof the site (Fig. F5M). These values likely reflect control by biogenic sil-ica solubility in these diatomaceous sediments.
Chloride exhibits a regular and steady increase with depth, as at Sites1227 and 1228 (Fig. F5D). Chloride concentrations range from 555.7mM near the sediment/water interface to a maximum of 1208.2 mM at186.2 mbsf at the bottom of Hole 1229A.
The concentrations of acetate and formate were analyzed in 57 IWsamples from Holes 1229A and 1229D (Table T2; Fig. F5N, F5O). Over-all, the concentrations of both compounds are similar to those at Site1227 and higher than those at Site 1228. Acetate concentrations rangefrom 0.7 to 11.9 µM, and formate concentrations range from 0.6 to 12.1µM. Maximum concentrations of both acids are present in the twosulfate–methane transition zones (~40 and ~90 mbsf) and close to thebottom of Hole 1229A. Concentrations in other depth intervals of Site1229 are commonly low, with the majority of values <2 µM.
Methane was detected in all samples at Site 1229 (Table T3; Fig. F5P).In addition, ethane and propane were found in the majority of samples(Table T3; Fig. F5Q, F5R). As noted in the chapters for previous sites, in-creasing extraction times led to increased yields (Table T3). In the fol-lowing discussion of methane concentrations in a stratigraphic context,we will discuss in detail the data series from the 8-day extraction ofsamples from Hole 1229A, which yielded consistently higher valuesthan shorter extraction.
Concentrations of methane are 1.5 µM near the sediment/water in-terface and increase to ~80 µM at 21.70 mbsf. There is an almost three-fold increase in methane concentrations over the next 2 m. Between23.35 and 37.9 mbsf, methane concentrations are fairly uniform at lev-els slightly >200 µM. The depth interval around 37.9 mbsf (uppershaded bar in Fig. F5P) coincides with the transition zone, where sulfateconcentrations decrease to undetectable levels. From 37.9 to 41 mbsf,methane concentrations increase sharply to ~800 µM but then dropagain to <400 µM at 43.65 mbsf. This somewhat unusual decrease inthe upper portion of the “methanogenic” sediment is associated withan erosional layer that marks the boundary between lithostratigraphicSubunits 1A and 1B. Poor recovery in this interval precluded methaneanalyses until a depth of 60.2 mbsf, where its concentration reaches1260 µM. Concentrations of methane remain high to a depth of 76.80mbsf, with the majority of values in excess of 1000 µM. Below 85.20mbsf, concentrations decrease sharply from slightly above 500 µM to17 µM at 93.40 mbsf within the second sulfate–methane transitionzone created by the sulfate-rich brine (lower shaded bar in Fig. F5P). Be-
T3. Methane in headspace, p. 69.
SHIPBOARD SCIENTIFIC PARTYCHAPTER 10, SITE 1229 16
low the second sulfate–methane transition zone, methane concentra-tions are relatively low (between 13 and 102 µM).
The concentrations of ethane and propane are <1 µM in the top 100mbsf at Hole 1229A. In more deeply buried sediments, concentrationsof both compounds peak at ~120 and 160 mbsf, with ethane values be-ing 2 and 2.5 µM, respectively (Fig. F5Q). Propane concentrations inthose intervals are slightly higher (Fig. F5R). Concentrations of bothgases drop noticeably at the more deeply buried transition zone at ~90mbsf, whereas the relative decrease at the upper transition zone appearsless pronounced.
Hydrogen incubations were conducted on 20 samples from Hole1229A and 10 samples from Hole 1229D (Table T4; Fig. F5S). Concen-trations range between ~0.1 and ~4 nM, with most samples between~0.1 and ~0.5. It is interesting to note that the highest-concentrationsamples were in the sulfate–methane transition zone.
MICROBIOLOGY
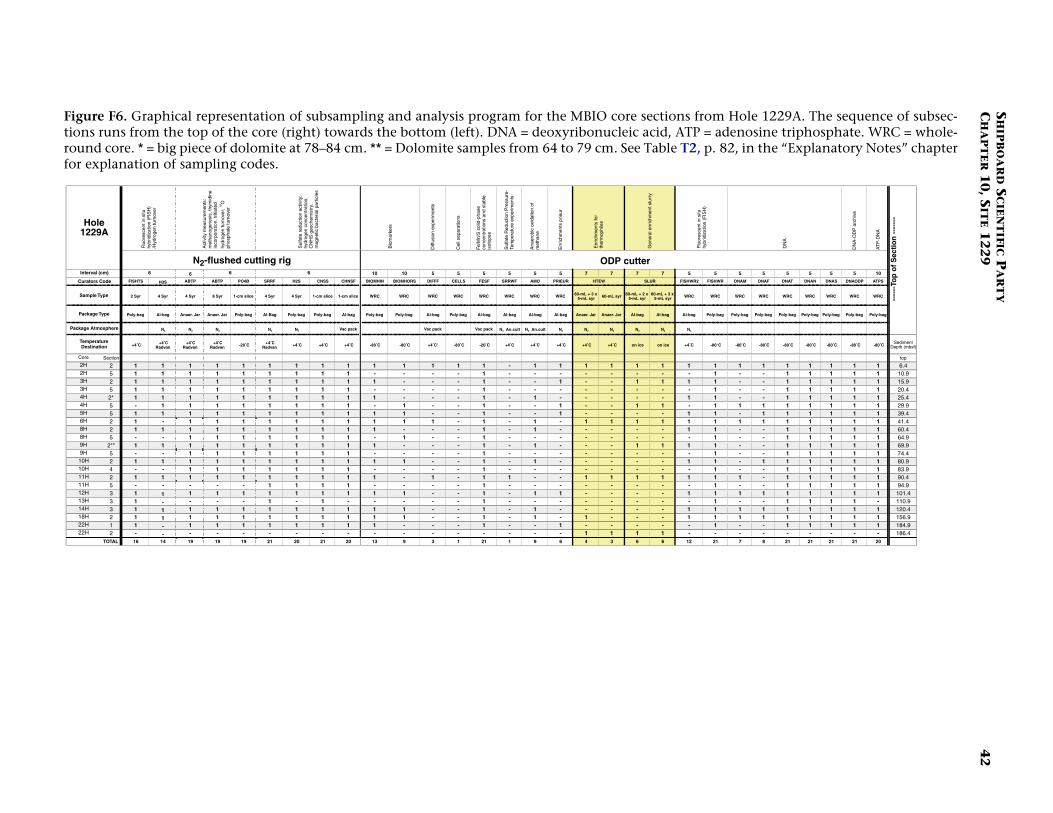
Microbiological sampling of Site 1229 covered the sulfate-reducingzone near the sediment/water interface, the sulfate-depleted methano-genic zone between ~35 and 90 mbsf, and the sulfate-rich deep layer atdepths between 90 and 186 mbsf, which was influenced by the pres-ence of a deep subsurface brine. Whenever possible, two sections ofeach core from the upper 100 m of the sediment column were routinelysampled for deoxyribonucleic acid (DNA) analysis, measurements ofsulfate reduction rates, hydrogen concentration and turnover, methan-ogenesis rates, acetate turnover, thymidine incorporation, bacteriallipid biomarkers, adenosine triphosphate, fluorescent in situ hybridiza-tion (FISH), and iron/manganese/sulfur solid-phase geochemistry (Fig.F6) (Cores 201-1229A-2H through 11H). Poor recovery of Core 201-1229A-7H (49.5–59 mbsf) led to this depth interval being substitutedwith two core sections from the same depth interval of Hole 1229D(Sections 201-1229D-7H-1 and 7H-4) (Fig. F7). Every core that could beobtained from the deeper layers of the sediment column was sampledto analyze the prokaryotic communities and activities in the deepsulfate-rich layer (Sections 201-1229A-12H-3 through 22H-2) (Fig. F6).
Sampling in Hole 1229D focused on fine-scale resolution of intervalsthat had been missed or inadequately sampled in Hole 1229A. Sam-pling in five sections of the mudline core in Hole 1229D (Sections 201-1229D-1H-1,1H- 2, 1H-3, 1H-4, and 1H-5) aimed at fine resolution ofthe highly compressed chemical gradients at the top of the sedimentcolumn in order to provide good end-member data for the microbiolog-ical and geochemical analyses in deep sediment layers (Fig. F7). Sam-pling in Sections 201-1229D-4H-3, 4H-4, and 4H-5 aimed at resolvingthe low-sulfate interval between 30 and 33 mbsf, where sulfate declinesto <1 mM (Figs. F6, F7). The two bottom sections of the short Core 201-1229D-12H (Sections 12H-2 and 12H-3) and the consecutive two topsections of Core 13H (Sections 13H-1 and 13H-2) were sampled to ob-tain a fine resolution in the lower sulfate–methane transition zone be-tween 85 and 90 mbsf (Fig. F5) that had not been sampled sufficientlyin Cores 201-1229A-10H and 11H (Fig. F7). In addition, specific sam-ples were recovered in Hole 1229D from defined depths that had notbeen sampled in sufficient detail at similar depths in Hole 1229A (Sec-tions 201-1229D-2H-5, 6H-1, 9H-4, and 15H-3).
SHIPBOARD SCIENTIFIC PARTYCHAPTER 10, SITE 1229 17
Total Prokaryotic Cell Enumeration
During core processing in the 10°C reefer, sample plugs (1 cm3) fortotal prokaryotic cell enumeration were taken from a total of 24 depthsbetween 8.88 and 185.7 mbsf in Hole 1229A (18 samples) and between0.01 and 53.86 mbsf in Hole 1229D (6 samples). Prokaryotes werepresent in all samples to 185.7 mbsf (Fig. F8). The highest number wasfound at 90.45 mbsf (Sample 201-1229A-11H-2, 5–11 cm), which con-tained 9.5 × 10⁹ cells/cm3. The lowest number was at the base of thehole, with 2.7 × 10⁶ cells/cm3, 3500-fold lower than at 90.45 mbsf.
The overall depth profile of cell numbers per cubic centimeter fol-lows a trend observed at other ODP sites (Parkes et al., 1994), withmany of the data lying very close to, or on, the mean regression line(Fig. F9). Two zones of major interest, just above the 35-mbsf upper sul-fate–methane transition and the lower sulfate–methane transition at~90 mbsf (see “Biogeochemistry,” p. 12) were intensively sampled.Prokaryotic cell numbers were very high at these depths and in bothcases exceeded the upper 2-σ envelope of the existing database. The up-per sulfate–methane transition zone showed elevated counts between20.98 mbsf (Sample 201-1229A-3H-5, 58–60 cm) and 40.35 mbsf (Sam-ple 5H-5, 95–100 cm), with a maximum of 1.18 × 10⁸ cells/cm3 at 29.81mbsf (Sample 201-1229D-4H-3, 101–107 cm). This represented a ten-fold increase over predicted cell counts at that depth. The increase incell numbers at the lower sulfate–methane transition zone was broader,lying between 84.48 mbsf (Sample 201-1229A-10H-4, 58–64 cm) and157.98 mbsf (Sample 18H-2, 108–114 cm). The lower boundary mayrepresent a sampling artifact, since data points between 125 and 158mbsf were not available. Within this broad band of increased cell num-bers, a peak was present at 90.45 mbsf (Sample 201-1229A-11H-2, 5–11cm) with 9.48 × 10⁹ cells/cm3, which represented a 1730-fold increaseover predicted cell counts at that depth. This value was exceptionallyhigh for a deep marine sediment. To our knowledge, this is the highestprokaryotic cell count ever found well below the seafloor. To excludepotential sources of error and bias, the counts were repeated. Solutionswere refiltered, new sterile equipment was used, blanks were checked,and a different person redid the count. The original enumeration wasconfirmed.
The peak in prokaryotic numbers at 90.45 mbsf was present within aprominent gray homogeneous quartz- and feldspar-rich clay (see “Sub-unit IB,” p. 9, in “Description of Lithostratigraphic Units” in “Litho-stratigraphy”). To confirm the high prokaryotic cell counts, additionalsubsamples were taken from two other independently sampled sourceswithin the same clay zone for enumeration. These were a 0.2-mL slurrysample from 91.14 mbsf (Sample 201-1229A-11H-2, 88–93 cm) and a 1-cm3 whole-round core (WRC) sample from 91.28 mbsf (Sample 11H-2,103–109 cm). These gave prokaryotic cell counts of 5.81 × 10⁸ and 2.06× 10⁹ cells/cm3, respectively (Figs. F8, F9). The mean prokaryotic cellcount density in this narrow 83-cm band amounts to 2.25 × 10⁹ cells/cm3, a 410-fold increase over the mean cell number from all previouslypublished sites at this depth.
Numbers of dividing cells (suggested as an index of growth activity)are typically <10% of the total count. As expected, dividing cells, as apercentage of the total count, are high near the surface (Fig. F8). Theydecrease to a minimum at 20.98 mbsf (Sample 201-1229A-3H-5, 58–60cm), before increasing again. Interestingly, the maximum percentage ofdividing cells around the upper sulfate–methane transition zone is
5 6 7 8 9 10
0 4 8 12 16 20
0
10
20
30
40
50
60
70
80
90
100
110
120
130
140
150
160
170
180
190
Dividing cells (%)
Dep
th (
mbs
f)
Total cells (log10
cells/cm3)
F8. Prokaryotic cells enumerated by AODC, p. 44.
5 6 7 8 9 10 110.01
0.1
1
10
100
1000
Dep
th (
mbs
f)
Total cells (log 10 cells/cm3)
F9. Total prokaryote profile, p. 45.
SHIPBOARD SCIENTIFIC PARTYCHAPTER 10, SITE 1229 18
present at 40.35 mbsf (Sample 201-1229A-5H-5, 95–100 cm), well belowthe maximum direct count. In all cases where a reliable quantificationwas possible, the proportion of dividing cells amounted to ~10% of thetotal counts below the upper sulfate–methane transition zone and alsoat the prokaryotic cell abundance peak at the deeper sulfate–methanetransition zone.
The high amount of organic matter and the silty clay with very smallparticle size made direct counting at this site more problematic thanusual. Generally, subsamples of 15–40 µL can be processed, but in thiscase subsample size was restricted to a maximum of 10–12 µL. Conse-quently, the detection limit increased to 5.8 × 10⁵ cells/cm3. The per-centage of dividing cells should be viewed with caution where the di-rect count is <1 × 10⁷ cells/cm3.
Contamination Tests
While drilling cores for microbiology, the potential for contamina-tion with bacteria from the surface is highly critical. Contaminationtests were continuously conducted using solutes (PFT) or bacterial-sizedparticles (fluorescent microspheres) to check for the potential intrusionof drill water from the periphery toward the center of cores and thus toconfirm the suitability of the core material for microbiological research.We used the chemical and particle tracer techniques described in ODPTechnical Note 28 (Smith et al., 2000). Furthermore, the freshly collectedcores were visually examined for possible cracks and other signs of dis-turbance by observation through the transparent core liner. Core sec-tions observed to be disturbed before or after subsampling were not an-alyzed further. Such disturbance phenomena are critical to the integrityof the core material and therefore also to its usefulness for microbiolog-ical studies.
Perfluorocarbon Tracer
PFT was injected continuously into the drilling fluid during drillingof Holes 1229A and 1229D (see “Perfluorocarbon Tracer Contamina-tion Tests,” p. 26, in “Microbiological Procedures and Protocols” in“Microbiology” in the “Explanatory Notes” chapter). PFT concentrationanalyses focused on microbiology cores and especially on sections thatwere used for slurry preparation and cultivations. To compare the PFTconcentrations in the center of a core to the PFT concentrations at theperiphery of the same core, a 5-cm3 subcore sample was also taken atthe core periphery, adjacent to the core liner. Whenever possible, thesamples were taken directly on the catwalk because the PFT content ofcatwalk air was usually not detectable.
Low levels of potential seawater contamination (Table T5) werefound for the center portions of all tested cores of Holes 1229A and1229D. With one exception (Section 201-1229A-6H-2), the values werenot higher than 0.07 µL seawater/g sediment (average = 0.039 µL sea-water/g sediment). The outer portions of all tested cores had a signifi-cantly higher level of PFT tracer and potential seawater contamination.In all cases, the PFT content and the estimated potential seawater con-tamination levels were higher in the periphery of the core than in thecenter (see House et al., this volume).
Of the eight master slurry samples taken from Site 1229 (Table T6),only the slurries from Cores 201-1229A-9H and 11H showed small con-
T5. Seawater contamination based on PFT, p. 73.
T6. Potential contamination of slurries based on PFT, p. 74.
SHIPBOARD SCIENTIFIC PARTYCHAPTER 10, SITE 1229 19
centrations of PFT (~0.06 µL potential seawater contamination/mLslurry).
Assuming 5 × 10⁸ prokaryotic cells/L surface seawater, each 0.1 µLseawater contamination may represent as many as 50 contaminatingcells if the sediment is porous enough to allow cells to travel with thePFT.
Particulate Tracer
Fluorescent microspheres (beads) were deployed on all eight coresfrom which slurries were made at this site. For each slurry, two subsam-ples were processed: (1) a sample of the slurry to check contaminationand (2) a scraping from the outer surface of the core to confirm deploy-ment of microspheres.
Microsphere deployment was confirmed from the outer core scrap-ings in all six cores that were sampled for slurry preparation (Table T7).Microspheres were detected in two slurry samples. In Sample 201-1229A-3H-2, 40–54 cm, a single bead was observed; further microscopicsearching of the membrane failed to detect any additional beads. It isbelieved that a single microsphere represents filter handling and pro-cessing effects rather than contamination (see “Fluorescent Micropar-ticle Tracer,” p. 27, in “Procedures and Protocols” in “Microbiology” inthe “Explanatory Notes” chapter). In Sample 201-1229A-11H-2, 74–88cm, however, three microspheres were observed within the countinggrid and many more microspheres were present outside of the countingarea. It therefore seems likely that this sample was contaminated.
Cultivations
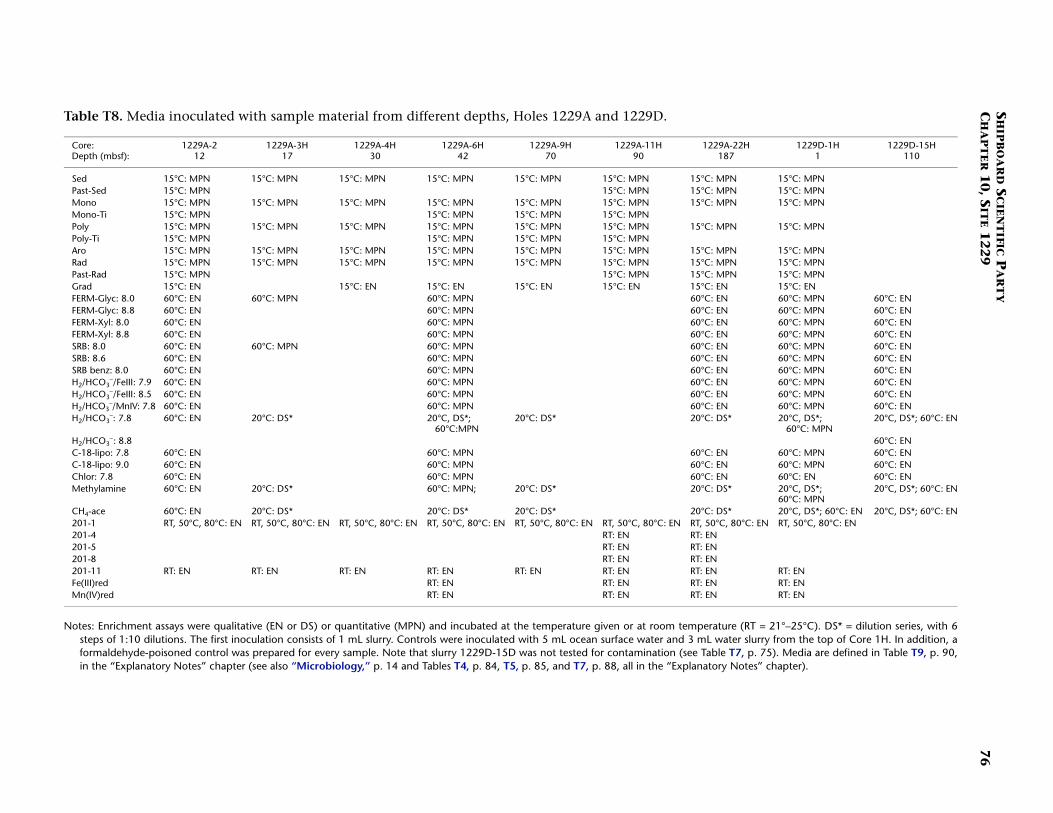
Since the complex geochemical profiles of Site 1229 (Fig. F5) indicatedistinct zones of contrasting microbial activities, slurry samples fromnine different depths were used for cultivation experiments (Table T8).These slurries included the eight master slurries checked for contamina-tion (Table T7) and an additional slurry from Core 201-1229D-15H forenrichments of predominantly thermophiles. Slurries for cultivationwere prepared by subcoring with two 60-mL syringes from the center oftwo freshly broken surfaces after precutting the core liner with the ODPcutter. This technique provided untouched (although not alwayssmooth) surfaces that were immediately sampled. The inoculated mediawere selective for fermentative prokaryotes, sulfate reducers, methano-gens, and various anaerobic chemolithoautotrophic and heterotrophicprokaryotes that use iron(III) or manganese(IV) as an electron acceptor.Quantitative cultivations (most probable number [MPN] experiments)and enrichment cultures were started at temperatures between 15° and80°C. For this site, additional microbiological work was undertakenconsidering the following aspects:
1. To quantify culturable methanogens at different depths in thesediment column, dilution series were prepared using substratesthat are characteristic for major physiological and phylogeneticgroups of methanogens. Two of these substrates, methyl amines(typically found in nearshore environments) and hydrogen/carbon dioxide can also be used by acetogens. Potentially, aceto-gens could provide acetate for the sulfate reducers at the sulfate/methane interface.
T7. Potential contamination of slurries based on beads, p. 75.
T8. Media inoculated with materi-al from Site 1229, p. 76.
SHIPBOARD SCIENTIFIC PARTYCHAPTER 10, SITE 1229 20
2. In order to study the role of sulfate as a limiting electron accep-tor, both sulfate-free and sulfate-containing media were used forinoculation of samples from the sulfate-containing sedimentlayers, the sulfate–methane transition zone, and sulfate-freesediment layers. Whereas the normal sulfate-containing mediawere reduced with FeS, the sulfate-free media were reduced withtitanium citrate and were kept sulfide-free to exclude sulfide ox-idation to sulfate.
3. A considerable proportion of subsurface prokaryotes could bespore-forming bacteria. Spores are bacterial resting stages thatare resistant to environmental stress factors, such as nutrient de-pletion, desiccation, heat, and irradiation. To quantify the con-tribution of spore-forming bacteria to the total cultivableprokaryotic community, pasteurized (heated to 80°C for 10 min)and untreated slurries were used in parallel for MPN experi-ments. All shipboard cultivation experiments and the media andincubation temperatures are shown in Table T8. For details ofthe various media compositions and incubation conditions seeTables T4, p. 84, T5, p. 85, and T7, p. 88, and “Procedures andProtocols,” p. 25, in “Microbiology,” all in the “ExplanatoryNotes” chapter.
FISH-SIMS
13C substrate incubations were initiated for postcruise analysis by flu-orescence in situ hybridization–secondary ion mass spectrometry (FISH-SIMS) using material from Cores 201-1229A-2H, 3H, 4H, 6H, and 11H.In each case, 10 mL of the master slurry was injected into each bottle.The 13C substrates used were methane, acetate, and glucose. For Cores201-1229A-4H and 11H, an additional acetate bottle was inoculated,and for Core 11H, no glucose bottle was used.
PHYSICAL PROPERTIES
At Site 1229, we collected a full range of physical property data fromHole 1229A, which extended from the seafloor to a depth of 194.4mbsf. All cores in Hole 1229A except Core 201-1229A-20M were takenby APC. Samples were taken from four additional holes drilled at Site1229 to address high-resolution objectives and spot-coring needs. Allcores from each hole were run through the multisensor track (MST),with Hole 1229E at higher resolution and Holes 1229B, 1229C, and1229D at standard resolution. No discrete moisture and density (MAD)samples or split-core measurements were collected from these subse-quent holes.
The physical property data from these cores are described below andcompared with those from Site 681 (Shipboard Scientific Party, 1988).The local stratigraphic record was extended from 187.0 mbsf in Hole681A to 194.4 mbsf in Hole 1229A, though core recovery at Hole 1229Awas very poor below 130 mbsf where sediments consisted of semicon-solidated clayey silts and unconsolidated feldspar- and magnetite-bear-ing quartz sands. Above 130 mbsf, Holes 1229A and 1229D provide>90% recovery for MST and split-core physical property profiles. Wehave incorporated wireline logs from the triple combo tool string,which provide a continuous record between ~70 and 170 mbsf, with
SHIPBOARD SCIENTIFIC PARTYCHAPTER 10, SITE 1229 21
the shipboard physical property logs to provide an almost completephysical description of the sediments at Site 1229.
Each section of WRC that was analyzed for physical properties wasfirst degassed for up to 2 hr on the catwalk, if necessary, for safety (be-cause of high hydrogen sulfide levels), was equilibrated to laboratorytemperature (2-4 hr), and then was run on the MST. The standard-resolution measurements were magnetic susceptibility (spacing = 5 cm,data acquisition scheme [DAQ] = 2 × 1 s), gamma ray attenuation (GRA)density (spacing = 10 cm, count time = 5 s), P-wave velocity (spacing =10 cm, DAQ = 10), and NGR (spacing = 30 cm, count time = 15 s). Ther-mal conductivity measurements were made on the third section of eachwhole-round core in Hole 1229A, where possible. Some sections wereremoved from the catwalk for microbiology and interstitial water sam-pling. Physical properties were measured on these sections only if intactparts remained following the sampling. This limited the continuityand, hence, spatial resolution of the physical property record.
MAD, P-wave velocity from the digital velocimeter, and resistancedata (translated to formation factors as detailed in “Formation Factor,”p. 47, in “Physical Properties” in the “Explanatory Notes” chapter) werecollected regularly only from Hole 1229A. MAD samples were taken at afrequency of one per section and at higher resolution in sections withmany voids or lithologic transitions. MAD samples were co-locatedwith the methane headspace extractions where possible to facilitate thevolumetric analysis of methane concentrations.
Instrumentation, measurement principles, and data transformationsare discussed further in “Physical Properties,” p. 41, in the “Explana-tory Notes” chapter.
In general, the wireline logs and physical data that record burial his-tory (bulk density, resistivity, and P-wave velocity) show expecteddownhole trends controlled by interstitial dewatering with increasingoverburden. The measurements most responsive to lithologic variations(magnetic susceptibility, grain density, and NGR) have preserved arecord of cyclic sedimentation, and these higher-frequency variationsare clearly superimposed on the burial signatures.
We recognize three broad zones in the characteristics of the physicalproperty data: 0–40, 40–138, and 138–194.4 mbsf. The first boundary(40 mbsf) is a distinct lithologic change, whereas the second boundary(138 mbsf) has been chosen at the base of a transitional sequence ex-tending from 125 to 138 mbsf. Within the 40- to 138-mbsf zone, foursedimentary sequences of biogenic siliciclastic deposition are identified,between 40 and 62 mbsf, 62 and 88 mbsf, 88 and 125 mbsf, and 125and 138 mbsf. In the following sections, we describe the main charac-teristics of each physical property in terms of these intervals, relatingthem (where possible) to the lithostratigraphic divisions given in “De-scription of Lithostratigraphic Units,” p. 8, in “Lithostratigraphy.”
Infrared Scanner
The infrared scanner was not employed at this site.
Magnetic Susceptibility
Low-field volume magnetic susceptibility was measured on the MSTusing the Bartington loop sensor as described in “Magnetic Suscepti-bility,” p. 44, in “MST Measurements” in “Physical Properties” in the“Explanatory Notes” chapter. Data were collected on WRC sections
SHIPBOARD SCIENTIFIC PARTYCHAPTER 10, SITE 1229 22
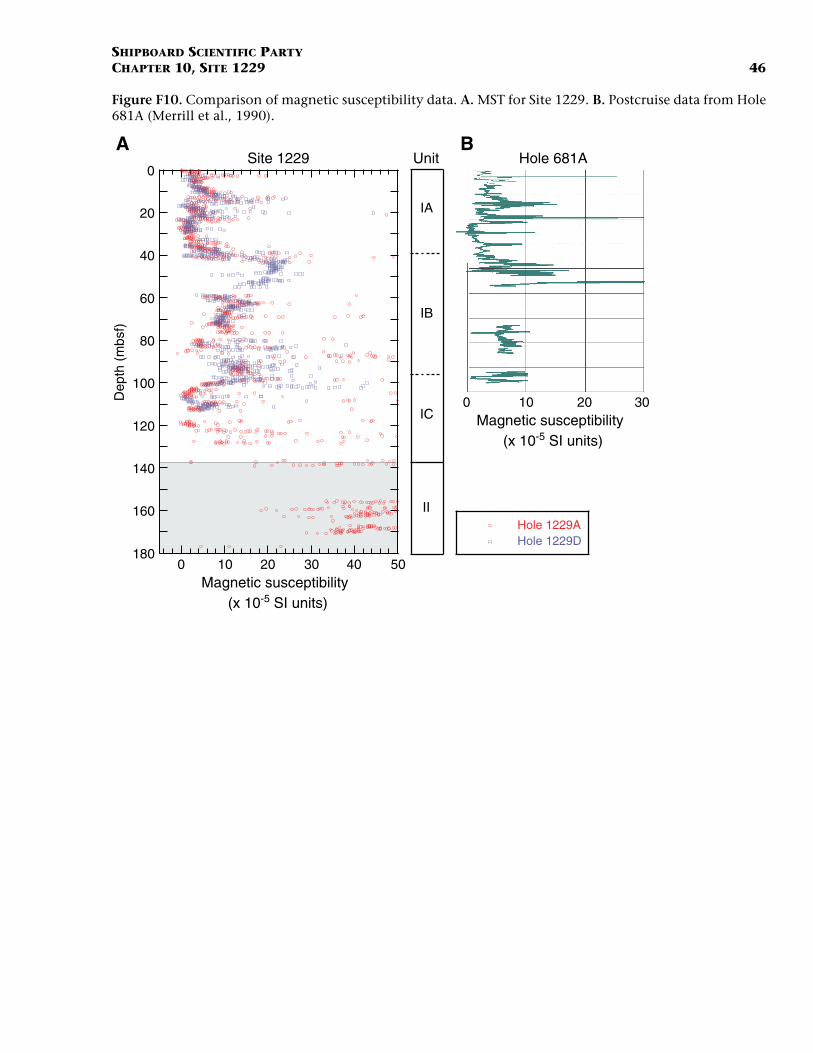
from deep Holes 1229A and 1229D at standard resolution (spacing = 5cm, DAQ = 2 × 1 s). The interval of low recovery in Hole 1229A from 40to 60 mbsf was subsequently covered by sediments from Hole 1229D(Fig. F10A). Hole 1229D terminated at 112.8 mbsf, and data are missingfrom Hole 1229A over the intervals 113–118, 128–138, and 140–155mbsf. Both data sets match well, especially above 70 mbsf, but both areincreasingly noisy from 80 to 112 mbsf. Despite this interference, wewere still able to discern the underlying trends.
The magnetic susceptibility record can be divided into the threezones described above. The uppermost, from 0 to 40 mbsf in Hole1229A, corresponds to Subunit IA (see “Description of Lithostrati-graphic Units,” p. 8, in “Lithostratigraphy”). It is characterized by alow response of 2 × 10⁻⁵ to 5 × 10⁻⁵ SI units but with three narrow peaks(at 2.5, 15, and 20 mbsf) that reach between 10 × 10–5 and 45 × 10–5 SIunits. The 15- and 20-mbsf peaks appear in the records of both Holes1229A and 1229D and coincide with silt interlayers. At 40 mbsf, there isa sharp increase in average magnetic susceptibility to ~23 × 10–5 SIunits; from 40 to 42 mbsf, the signal fluctuates widely. We consider thehorizon delineated by this increase to be a significant physical propertyboundary.
We define a second physical property zone between 40 and 138mbsf. This zone incorporates Subunits IB and IC. Across this interval allphysical property records are characterized by a cyclic pattern that is re-peated every 10 to 30 m. The pattern is not as clear in the susceptibilityrecord as it is in the other property profiles. Data from Hole 1229D indi-cate that the high-susceptibility interval at the top of this zone is 8–9 mthick. Susceptibility generally decreases from ~23 × 10–5 SI units at 45mbsf to ~0 × 10–5 SI units at 85 mbsf. There is increasing variation in thesignal, averaging ~15 × 10–5 SI units to 108 mbsf. From 108 to 120 mbsf,susceptibility remains ~0–10 × 10–5 SI units. From 120 to 138 mbsf, theaverage susceptibility increases but exhibits large fluctuations, probablyas a result of closely spaced interbeds of diatomaceous ooze and clasticsilt or sand.
The lowermost zone extends from 138 mbsf to the base of the hole.Over this interval, magnetic susceptibility averages 35 × 10–5 to 45 × 10–5
SI units. Missing data from 140 to 155 mbsf and from most of the sec-tion below 170 mbsf make it impossible to determine a trend across thisinterval.
Magnetic susceptibility data from Site 681 were collected postcruiseby Merrill et al. (1990). They are reproduced here for comparison in Fig-ure F10B. Their record is complete only across the uppermost 50 mbsf,where they show good agreement with Site 1229 data. Below 50 mbsf,Site 681 records are too incomplete to enable detailed comparisons.
Paleomagnetism
At Site 1229, we collected 16 discrete samples for paleomagneticmeasurements. The sampling frequency was two samples from eachcore in Cores 201-1229A-2H through 8H (2.9–61.0 mbsf) and one sam-ple from each core below this interval to the bottom of the hole (Cores201-1229A-9H through 22H; 61.0–194.4 mbsf). Alternating-field (AF)demagnetization of the natural remanent magnetization (NRM) wasconducted up to 40 mT in 10- or 5-mT steps. Anhysteretic remanentmagnetization (ARM) was measured to 40 mT in 10-mT steps with a 29-
IA
Unit
IB
IC
II
0
20
40
60
80
100
120
140
160
1800 10 20 30 40 50
Hole 1229AHole 1229D
Dep
th (
mbs
f)
Magnetic susceptibility(x 10-5 SI units)
Site 1229
Magnetic susceptibility(x 10-5 SI units)
Hole 681A
0 10 20 30
A B
F10. Comparison of magnetic sus-ceptibility, p. 46.
SHIPBOARD SCIENTIFIC PARTYCHAPTER 10, SITE 1229 23
µT direct current–biasing field. AF demagnetization of the ARM wasconducted to 40 mT in 10-mT steps.
Samples from lithostratigraphic Subunits IA and IC through Unit II(see “Description of Lithostratigraphic Units,” p. 8, in “Lithostratig-raphy”) indicate higher magnetic intensity after 20-mT AF demagneti-zation (Fig. F11). The intensity peak in lithostratigraphic Subunit IA at23 mbsf correlates with the intensity peak at the lower Brunhes/Matu-yama boundary (18 mbsf) identified from Hole 681A (Shipboard Scien-tific Party, 1988). Although stepwise AF demagnetization shows adownward drilling-induced overprint, we were able to isolate the origi-nal magnetic direction in lithostratigraphic Subunit IA in Cores 201-1229A-3H through 4H and in Subunit IC in Core 201-1229A-14H. Sub-unit IA is characterized by dark brown diatom- and clay-rich silt withpale yellow nannofossil-rich laminae and layers of gray silt. Demagneti-zation of a sample from the pale yellow laminae (Sample 201-1229A-4H-6, 70–72 cm) reveals an original magnetic direction (Fig. F12). De-magnetization of the dark brown diatom- and clay-rich silt (Sample201-1229A-3H-3, 65–67cm) in lithostratigraphic Subunit IA and lami-nated clay- and silt-rich diatom ooze (Sample 201-1229A-14H-3, 110–112 cm) in the middle part of lithostratigraphic Subunit IC reveals shal-low inclinations (Figs. F13, F14) near that expected for a geocentric ax-ial dipole at this latitude (21°) after removal of the drilling-inducedoverprint.
Gray siliciclastic layers in lithostratigraphic Subunit IB and Unit IIconsist of feldspar- and quartz-rich sand with variable proportions ofclay. This interval is coarser grained than the rest of lithostratigraphicUnit I. The sediments in this interval have a relatively high NRM inten-sity (Fig. F11) and magnetic susceptibility; however, we cannot resolvethe original magnetic component because of the strong drilling-induced overprint.
Density and Porosity
Density data were measured on the MST by the GRA densitometer(spacing = 10 cm, count time = 5 s) and calculated from split-core mass/volume measurements. Porosity was calculated from the split-core sam-ples. The density and porosity data sets show expected changes withlithostatic loading. Both MST GRA and discrete-sample bulk density in-crease from ~1.2–1.3 g/cm3 at the top of the hole to ~1.8 g/cm3 at thebase (Fig. F15A). Porosity decreases from 80% to 40% over the same in-terval (Fig. F15C). The three physical property zones are clearly identi-fied, with good resolution of the sedimentary sequences between 40and138 mbsf (Subunits IB and IC). The most complete records in thelowermost two-thirds of Hole 1229A are the wireline records of bulkdensity, porosity, and resistivity (Figs. F15, F16), but the same patternsare evident in the less continuous shipboard GRA and MAD bulk den-sity, grain density, and porosity data.
In combination, these data show that the interval from 40 to 138mbsf is composed of four cycles of variation in the physical properties.The cycles shown in Figures F16 and F17 range from 13 m (125–138mbsf) up to 37 m (88–125 mbsf) in thickness. Each cycle consists of twoparts (see Fig. F17). In the upper part, bulk densities range from 1.6 to1.8 g/cm3, with porosities averaging ~60%. The lower part is character-ized by lower bulk densities (between 1.2 and 1.4 g/cm3) with porositiesranging up to 80%. Grain densities show a similar pattern, with the up-per part of a cycle consistently >2.6 g/cm3 and the lower parts between
Hole 1229A
Dep
th (
mbs
f)
Magnetic intensity (kA/m)
0
50
100
150
20010-7 10-410-510-6
Unit
IA
IB
IC
II
F11. Magnetic intensity, p. 47.
J/Jmax Jmax = 3.60e-6
0 40
N, Up
E, E
N
2010 30
NRM
Equal Area projection
NRM
Sample 201-1229A-4H-6, 70-72 cm
N, Up
E, N
N
Demagnetization level (mT)
Lower hemisphere Upper hemisphere
Initial point (NRM)
NRM
15 20
25
30
5 mT10
Inclination = -22.0°Declination = 61.5°
HorizontalVertical
NRM
F12. Principal component analy-sis, 201-1229A-4H-6, 70–72 cm, p. 48.
J/Jmax Jmax = 4.99e-6
N, Up
E, E
N,Up
E,N
N
NRM
NRM
NRM
NRM
5 mT
10
15
20
2530
Inclination = -23.7°Sample 201-1229A-3H-3, 65-67 cm
N, Up
E, N
N
Equal Area projection
Lower hemisphere Upper hemisphere
0 402010 30
Demagnetization level (mT)
HorizontalVertical
Initial point (NRM)
NRM
F13. Principal component analy-sis, 201-1229A-3H-3, 65–67 cm, p. 49.
J/Jmax Jmax = 3.10e-5
N, Up
E, E
N,Up
E,NN
0 402010 30
Demagnetization level (mT)
NRM
NRM
NRM
35 40
20mT2530
Inclination = 21.0°Sample 201-1229A-14H-3, 110-112 cm N, Up
E, NN
Lower hemisphere Upper hemisphere
Equal Area projection
Initial point (NRM)
NRM
NRM
HorizontalVertical
F14. Principal component analy-sis, 201-1229A-14H-3, 110–112 cm, p. 50.
SHIPBOARD SCIENTIFIC PARTYCHAPTER 10, SITE 1229 24
2.3 and 2.4 g/cm3. Each cycle has a sharp base and gradual change inphysical properties upward to the base of the next cycle. Wireline resis-tivity values exhibit a similar pattern (Fig. F16).
Examination of the lithostratigraphy (see “Lithostratigraphy,” p. 8)shows that the overall interval from 40 to 138 mbsf consists of twomain interbedded lithologies: (1) diatomaceous ooze, which forms theprincipal component of the lower part of the cycle described above, and(2) quartz- and feldspar-rich clay and silt, defined by the higher bulkand grain densities and the lower porosity, making up the upper part ofeach cycle.
The interval from 138 to 194.4 mbsf is the third and lowermost zoneconsistently delineated by changes in physical properties, and it corre-sponds to Unit II (Fig. F15). This interval is characterized by high grainand bulk densities (>2.6 and 1.7–1.9 g/cm3, respectively) and low poros-ity (<50%). These density and porosity variations are consistent withthe dominant sand and silt lithologies.
MAD data for Site 681 were collected at very low resolution but gen-erally fall within the range of our data. GRA data from Site 681 (Ship-board Scientific Party, 1988) show mean values and variance similar tothose from Site 1229 over the common intervals. The Site 681 data onlyextend to a depth of 138 mbsf and were too sparse to allow for a full de-scription of the downhole variation.
Compressional Wave Velocity
P-wave data from the MST P-wave logger (PWL) were recorded at a10-cm spacing for all available APC cores from Holes 1229A, 1229B,1229C, and 1229D and at 2-cm spacing for Hole 1229E. The PWS3 ve-locimeter was used to measure P-wave velocities on split cores fromHole 1229A, with measurements taken at least once per section. Closer-spaced measurements were made at lithologic boundaries and in sedi-mentary intervals marked by evidence of diagenetic or other petrophys-ical changes.
P-wave data show a consistent increase in velocity across lithostrati-graphic Unit I (physical property zone 1), from 1510 m/s at the seafloorto ~1580 m/s at 138 mbsf (Fig. F18). Several diagenetic anomalies aresuperimposed on the background velocity increase at 13–15, 42–44, 82–84, and ~94 mbsf (see also “Lithostratigraphy,” p. 8). The base of Sub-unit IA at 40 mbsf is particularly evident, with sharply increasing veloc-ities ranging between 1500 and 1750 m/s over the short interval to 43mbsf. This horizon is marked by interlayered dolomitic and phosphatecements and nodules.
The bases of the two best-defined cycles within the lower part of UnitI (physical property zone 2) at ~83 and 125 mbsf are marked by thin in-tervals of higher P-wave velocities. The tops of these cycles are indi-cated by slightly higher velocities relative to the immediately adjacentstrata, but the cyclic patterns are not as clearly discerned as in the otherdata (e.g., bulk density and natural gamma ray measurements).
There is a large gap in our MST and discrete sample data over the in-terval 128–155 mbsf, but the wireline logs all support a boundary at~138 mbsf. Below this level, P-wave velocity is on average much fasterthan would be predicted from the downhole trend extrapolated fromUnit I. Most of the PWS3 velocimeter measurements yielded velocitiesin the range of 1720–1780 m/s. The lower end of this range was thehighest value recorded over the same interval on the MST PWL, wheremost of the values ranged from 1620 to 1720 m/s. We attribute the ≥50-
SHIPBOARD SCIENTIFIC PARTYCHAPTER 10, SITE 1229 25
m/s velocity increase in Unit II to the distinct lithology change at ~138mbsf, below which the sequence is dominated by coarse-grainedhornblende-bearing feldspathic sand.
Natural Gamma Ray Emission
NGR was measured on the MST for all Site 1229 holes (spacing = 30cm, count time = 15 s) except for Hole 1229E, which was run at a higherspatial resolution (spacing = 15 cm, count time = 30 s) for the first fivecores and then at 20-cm spacing and 30-s count times (from Section201-1229E-5H-7). In addition, NGR was recorded with the NGR sondeduring the wireline logging run. Both data sets are shown in Figure F19.The wireline response is suppressed above ~68 mbsf because of attenua-tion by the drill pipe. Within Subunit IA, the MST gamma ray responseis relatively low at ~20 counts per second (cps), but two spikes at 13 and20 mbsf appear on both Holes 1229A and 1229D NGR records and inthe wireline data. These correspond to quartz- and feldspar-rich silty in-terbeds. The base of Subunit IA is clearly delineated on all NGR records.It is a narrow interval characterized by large-amplitude fluctuations be-tween ~40 and 42 mbsf. MST and wireline profiles indicate a break at~56 mbsf, where the trend changes from an upward-decreasing back-ground response (0–56 mbsf) to an upward-increasing backgroundgamma response (56–125 mbsf) seen in both the GRA and wireline data(Fig. F19B).
Between 40 and 138 mbsf, the MST NGR data are overall somewhatnoisy and do not track the wireline log closely, although commonpeaks and troughs are apparent. The wireline log, on the other hand,clearly shows the second and third cycles defined by the other physicalproperty measurements (Fig. F19B). The lowermost cycle (from 125 to138 mbsf) is different in NGR character from those above; we suggestthis interval is a transition between the underlying sand- and silt-dominated clastic unit (Unit II) and the sequences within Subunit IBand the upper part of Subunit IC.
The gamma ray wireline log suggests that the downward-increasingtrend seen at the base of Unit I continues in Unit II to a depth of at least153 mbsf, at which point the wireline logging terminates. This is coin-cidently the depth at which we were again able to collect MST andMAD data. The MST NGR record indicates that below 155 mbsf theemissions are again low, which is consistent with the quartz-rich sandand silt lithologies recovered.
Thermal Conductivity
Thermal conductivity measurements were made on Hole 1229A sedi-ments at a rate of one per core (usually the third section, at 75 cm, ifthis was available). Values range between 0.71 and 1.29 W/(m·K) (aver-age = 0.86 W/[m·K]) (Fig. F20A). Average normalized thermal conduc-tivity and bulk density show a high correlation (Fig. F20B), indicatingthat the thermal conductivity is a direct function of water content ofthe sediments. The combination of high clastic content (i.e., increasedgrain-scale thermal conductivity) and low porosity in Unit II results inthe thermal conductivity anomaly at ~160 mbsf.
SHIPBOARD SCIENTIFIC PARTYCHAPTER 10, SITE 1229 26
Formation Factor
Formation factor (longitudinal and transverse) was determined forHole 1229A as described in “Formation Factor,” p. 47, in “PhysicalProperties” in the “Explanatory Notes” chapter, with a minimum sam-ple interval of one per section, increasing if distinct lithologic changeswere observed.
The trend of decreasing formation factor with depth for a given li-thology represents increasing interstitial water salinity, which causesthe sediments to appear more conductive relative to the seawater stan-dard used in the resistivity-formation factor transform. This effect willbe corrected in postcruise analysis once the interstitial water chemistryhas been completely determined.
Longitudinal (parallel to core axis) formation factors range from 1.1to 2.5 in the mainly biogenic sediments and 2.5 to 4.9 in the interbed-ded siliciclastic sediments of Unit I (Fig. F21). The steplike changes inapparent conductivity are consistent with changes seen in other physi-cal properties. Below 138 mbsf (Unit II), the dominant lithology of feld-spathic silt and sand produces formation factors of 2.9–3.3. Low forma-tion factors (<2.7) reflect recovery artifacts. Electrical conductivityanisotropy typically ranges from 0% to 12% (average = 6%). Overall,the formation factor measurements track the changing lithostratigra-phy, clearly delineating the sedimentary sequences in Unit I.
Summary and Discussion
At Site 1229 there are three physical property zones over the 194.4-minterval drilled. The lowermost of these is dominated by terrigenousquartz- and feldspar-rich sand and silt. Overlying this basal epiclasticunit is an interval of mixed terrigenous and hemipelagic sediments ar-ranged into cycles ranging from 13 to 37 m thick. The uppermost unitis dominated by a hemipelagic facies. The three zones are visible in allphysical property data sets. The characteristics of each are summarizedbelow (with the depths taken from Hole 1229A):
1. 0–40 mbsf. This zone is characterized by low magnetic suscepti-bility, with three peaks at 2.5, 15, and 20 mbsf. Low bulk andgrain density correspond to higher porosity in this interval andalso exhibit peaks at 15 and 20 mbsf. Natural gamma radiationis low overall, with peaks at 13 and 20 mbsf.
2. 40–138 mbsf. The diagnostic features in this zone are four cyclesof upward-increasing density, NGR, and resistivity and upward-decreasing porosity. It also has more variable magnetic suscepti-bility than the other two zones.
3. 138–194.4 mbsf. This zone has high magnetic susceptibility,high bulk and grain densities, high NGR, and low porosity.
Overall, the physical property data sets correlate well between the dif-ferent measurements. The sedimentary environmental record is over-printed by a simple burial pattern showing increasing density and P-wave velocity with depth and a progressive decrease in porosity. Super-imposed on this general pattern, on 10-m scales, is a record of the envi-ronmental fluctuation between marine and terrigenous sediment inputwithin an overall transition from marginal to open-marine conditions.The wireline log and less continuous MST and discrete sample physical
IA
Unit
IB
IC
II
0
20
40
60
80
100
120
140
160
1801 2 3 4 5 6
Dep
th (
mbs
f)
Formation factor
diatom ooze
interbedded siliciclastics
diatom- and quartz-bearing clay and silt
Lithology
F21. Formation factor profile, p. 57.
SHIPBOARD SCIENTIFIC PARTYCHAPTER 10, SITE 1229 27
property data provide a template within which a composite lithostrati-graphic sequence stratigraphy can be constructed.
DOWNHOLE TOOLS
At Site 1229, the downhole tools employed were the Adara tempera-ture shoe, DVTP, DVTP-P, WSTP, APC-M tool, FPC, and PCS. The resultsof the temperature and pressure measurements at Site 1229 are de-scribed in the two sections below. A short summary of the other tooldeployments is provided in the third section.
In Situ Temperature Measurements
One good downhole temperature determination was made in Hole1229A using the DVTP. An Adara temperature shoe deployment beforeCore 201-1229A-1H yielded a value for the bottom-water temperatureof 14.9°C. The WSTP deployment successfully recorded a value of15.1°C for water temperature 10 m above the seafloor. Figure F22 showsthe data from the successful DVTP deployment at 164.9 mbsf. Fourother deployments at 33.4, 68.4, 83.5, and 107.9 mbsf resulted inrecords that could not be used. Table T9 summarizes Site 1229 tempera-ture measurements together with the Site 681 data.
The results of the DVTP and Adara temperature measurements aredisplayed in Figure F23. Because we obtained only one good downholetemperature value at Site 1229, the results from Site 681 were includedin the thermal gradient estimate. Because of a variety of problems docu-mented by the Leg 112 Shipboard Scientific Party (1988), each of the es-timates for Site 681 is denoted as either an upper or lower bound on thetrue formation temperature. In the combined plot in Figure F23, four ofthe data points are nearly collinear. These four points yield a linear gra-dient of 0.0346°C/m in the upper 187 m of the sediment column (Fig.F23). Extrapolating this gradient upward to the seafloor yields a bot-tom-water temperature of 13.5°C, which is 1.4°C lower than the mea-sured value at Site 681. Although 4°C seasonal temperature variationsare possible at 100- to 200-m depths in upwelling systems (e.g., Smithet al., 1991), specific data were not available on board the ship to verifywhether 13.5°C is a reasonable mean bottom-water temperature for Site1229. The extrapolated temperature at the bottom of Hole 1229A, at192.9 mbsf, is 20.2°C. Multiplying the gradient by an average thermalconductivity of 0.87 W/(m·K) (Fig. F20A) gives a conductive heat flowestimate of 30 mW/m2 at Site 1229. This result is equal to the 30 mW/m2 value estimated as a lower bound for Site 681 by the Leg 112 Ship-board Scientific Party (1988). It is also close to our estimates of 32 mW/m2 for Site 1228 and 37 mW/m2 for Site 1227. Figure F23B shows a the-oretical steady-state conductive temperature profile calculated using aconstant heat flow of 35.5 mW/m2, a seafloor temperature of 13°C, andthe measured thermal conductivities from the Hole 1229A cores. Thetheoretical profile is noticeably curved because of the factor of 1.7downhole increase in thermal conductivity (see Fig. F20A).
The failure rate for DVTP measurements attributed to formation andsea conditions increased at Site 1229 to a high of 80% compared to 50%at Sites 1227 and 1228 and 0% at Sites 1225 and 1226. The one success-ful measurement at Site 1229 was the deepest deployment attempted at164.9 mbsf. It was located in lithostratigraphic Unit II, composed of al-ternating sand and silt (Fig. F1), and the subsequent core had the lowest
19.0
19.5
20.0
20.5
21.0
21.5
22.0
22.5
23.0
20 25 30 35 40
Tem
pera
ture
(o C
)
Time (min)
Lower thermistor
Upper thermistor
Fitted temperature = 19.2°C
After Core 201-1229A-18HDepth = 164.9 mbsf
F22. DVTP temperature record, p. 58.
T9. Downhole temperatures, p. 77.
0
50
100
150
20013 14 15 16 17 18 19 20 21
Linear gradient
DVTP
Adara
Leg 112
Dep
th (
mbs
f)
Temperature ( oC)
Temperature gradient: 0.0355°C/m
12 13 14 15 16 17 18 19 20
Integrated profile
DVTP
Leg 112
Temperature ( oC)
Conductive heat flow:
35.5 mW/m2
F23. Temperatures vs. depth, p. 59.
SHIPBOARD SCIENTIFIC PARTYCHAPTER 10, SITE 1229 28
recovery compared to the other four deployments (recovery = 43%).The four unsuccessful deployments were located at shallower depths insilt, clay, or diatom ooze. These results indicate that deployments of theDVTP in shallow water (<200 m) may be more likely to succeed atdepths below 150 mbsf.
Davis-Villinger Temperature-Pressure Probe
The DVTP-P was deployed once at Site 1229 at a depth of 79.4 mbsf(after Core 201-1229A-9H). The lithology for this depth was composedof diatom-rich ooze with an average porosity of 75%. The record dis-played in Figure F24 exhibits 5-min stops at the seafloor and the base ofthe hole both before and after the tool was pushed into the sediments.A stepped pressure increase occurred when the tool entered the forma-tion, followed by a sharp drop within 1 min to ~2.42 MPa, whichequals the predicted hydrostatic value for the hole depth and measuredsalinity gradient. For the remainder of the 30-min deployment, thepressure oscillated at 2.42 ± 0.02 MPa. The amplitude of the oscillationcorresponds to ~4 m of head, which was comparable to the oscillationsat Site 1228. An investigation into the cause of the oscillations isneeded.
Other Tools
After a failed deployment of the WSTP above Hole 1229A, a sampleof bottom water was successfully collected from 10 m above the sea-floor at Hole 1229C. Chlorinity data showed that this sample deviated<2% from International Association of Physical Sciences of the Oceanstandard seawater (see “Interstitial Water,” p. 12, in “Biogeochemis-try”). The APC-M tool was run continuously from Cores 201-1229A-2Hthrough 13H. The tool appeared to function correctly, and the data willbe analyzed postcruise. The FPC was tested twice at Site 1229 at 24.4and 174.4 mbsf (Cores 201-1229B-4M and 201-1229A-20M, respec-tively). Because of a number of mechanical problems, the FPC failed toretrieve pressurized cores on either deployment. The single deploymentof the PCS (Core 201-1229D-10P) successfully recovered 0.86 m of sedi-ment from the 2-m cored interval.
DOWNHOLE LOGGING
Operations
One logging run was made in Hole 1229A with the triple combo toolstring (see “Downhole Logging,” p. 53, in the “Explanatory Notes”chapter). After recovery of Core 201-1229A-22H at 0500 hr on 8 March,the hole was conditioned for logging. The wiper trip only reached 187mbsf, indicating that there was ~7 m of fill at the bottom. The hole wasthen displaced with 100 bbl of sepiolite, and the bottom of the drillstring was positioned at 80 mbsf. Logging rig-up started at 0830 hr. De-spite a limited velocity of only 1.2 kt, the current generated strong vi-brations in the short drill string and particular care was taken in tight-ening the connections while assembling the logging string. The 35-m-long tool string started downhole at 1030 hr, and two passes were madewithout difficulty. Both passes reached the bottom of the hole at thewireline depth 187 mbsf (351 meters below rig floor), and the bottom
1.5
2.0
2.5
3.0
30 40 50 60 70 80 90
Pre
ssur
e (M
Pa)
Time (min)
Stop at mudline Stop at
mudline
After Core 201-1229A-9H
Depth = 79.4 mbsf Water depth = 152.2 m
Stop at BOH
Stop at BOH
Estimated pressure = 2.42 MPa
F24. DVTP-P pressure, p. 60.
SHIPBOARD SCIENTIFIC PARTYCHAPTER 10, SITE 1229 29
of the drill string was raised by 10 m during logging, allowing data re-cording in the open hole to 70 mbsf. Logging operations and rig-downwere completed by 1430 hr (see Table T10 for a detailed summary of theoperations).
Data Quality
The caliper log (Fig. F25A) shows that the borehole wall was gener-ally smooth and that the caliper arm maintained good contact with theformation over the entire logged interval, a requirement for high-quality data recording measurements made on core samples. Loggingdata are also consistent with physical property measurements from dis-crete samples. Except for a 30-m interval (between 125 and 155 mbsf)where core measurements were not made because of poor recovery, theMAD density and porosity data available generally agree well with thelogs.
Because of the short length of the open hole interval (~117 m), a sec-ond pass was made over its entire length to control the quality of thedata. Figure F26 compares some of the logs of the two passes (pass 1 =dashed green line and pass 2 = solid red line). The gamma ray valuesfrom the second pass are slightly higher than those for the first pass, in-dicating that the formation was still activated because of the minitronsource of the Accelerator Porosity Sonde used during the first pass (see“Downhole Logging,” p. 53, in the “Explanatory Notes” chapter). De-spite this generally uniform offset, both gamma ray logs agree very well.The density and resistivity curves also display a good repeatability overmost of the interval, except between 136 and 150 mbsf, where there is adepth offset of almost a meter in some places between the two passes.All identifiable features are apparent and similar in both passes, but thedepth offset indicates that the tool was sticking more strongly to theformation during pass 1 over this interval, generating higher depth val-ues.
Logging Stratigraphy
The general trend of the logs is characterized by a succession of depo-sition phases of various nature, in particular fining-upward sequencesand intervals with a strong biogenic component. The fining-upward se-quences indicate changing terrigenous sedimentation controlled by sealevel rise or sinking of the basin. Whereas overall the sediments recov-ered are mostly terrigenous, the relative importance of the types of sed-imentation can be seen in the ratio of thorium to uranium concentra-tion (Fig. F25D), which can be used as an indicator of the relativestrength of marine and terrestrial deposition (Rider, 1996). High valuesof this ratio indicate a greater relative input of terrestrial material. Lowvalues indicate sediments of marine origin. Based on variations of thisindicator and on individual deposition cycles, we have identified threelogging units. We divided these units into logging subunits that corre-spond to distinct sedimentation phases.
Logging Unit 1 (70–87 mbsf) is characterized by high porosity(~65%) and relatively low resistivity and density. The thorium/urian-ium ratio increases steadily upward, indicating an increase in terrige-nous sediments. The two logging Subunits 1A (70–76 mbsf) and 1B (76–87 mbsf) correspond to two distinct sequences. These sequences areseparated by peaks in gamma ray, density, and resistivity that could in-dicate phosphorite layers generated by reworking of phosphate nodules
F26. Comparison between two passes of the tool string, p. 62.
SHIPBOARD SCIENTIFIC PARTYCHAPTER 10, SITE 1229 30
between sedimentation phases. Logging Subunit 1B is a well-definedfining-upward sequence indicating a sea level rise or subsidence of thebasin.
The top of logging Unit 2 (87–137 mbsf) is defined by a sharp in-crease in density and resistivity, which appears to be the top of a verydistinct fining-upward sequence corresponding to logging Subunit 2A(87–97 mbsf). This interval is also characterized by high values of tho-rium and of the thorium/uranium ratio, indicating the almost exclu-sively terrigenous nature of the sediments. This subunit corresponds tothe lower part of lithostratigraphic Subunit IB (see “Description ofLithostratigraphic Units,” p. 8, in “Lithostratigraphy”), and its base isdefined by a sharp drop in resistivity and density. The base of this sub-unit corresponds to an erosional surface overlain by shell debris (see“Lithostratigraphy,” p. 8). This erosional surface was also recovered atSite 681 during Leg 112 (Shipboard Scientific Party, 1988). Logging Sub-unit 2B (97–128 mbsf) corresponds to the two upper intervals of litho-stratigraphic Subunit IC (see “Description of LithostratigraphicUnits,” p. 8, in “Lithostratigraphy”), which display a downhole in-crease of biogenic sediments, mostly diatom ooze. This downhole in-crease in biogenic material in the cores corresponds to a steady down-hole decrease of the thorium and of the thorium/uranium ratio in thislogging subunit. The uphole increase in these properties indicates theprogressive shift in time from marine sedimentation in the lower halfof logging Subunit 2B to a mostly terrigenous, fining-upward sedimen-tation. At the base of logging Subunit 2B, peaks in gamma ray, uranium,density, and resistivity and the presence of phosphate nodules in thecore (see “Lithostratigraphy,” p. 8) indicate reworked phosphorite lay-ers. Logging Subunit 2C (128–137 mbsf) is a fining-upward sequencesimilar in character to logging Subunit 2A, with high thorium/uraniumvalues and slight upcore increase in density and resistivity. It corre-sponds to the lower portion of lithostratigraphic Subunit IC (see “De-scription of Lithostratigraphic Units,” p. 8, in “Lithostratigraphy”).
Logging Unit 3 (137–185 mbsf) corresponds to lithologic Unit II (see“Description of Lithostratigraphic Units,” p. 8, in “Lithostratigra-phy”). This lithologic unit is characterized by well-sorted and roundedsand and silt with variable clay content. The top of the logging unit isdefined by an increase in density and resistivity and by a drop in poros-ity. This logging unit is characterized by significant fluctuations in mostlogs, corresponding to the alternation of sand and silt as noted in the“Site 1229 Core Descriptions.” Logging Subunit 3B (155–185 mbsf)was logged fully only by the resistivity sonde, but it is marked by aslight decrease in resistivity, an apparent increase in porosity, and twodistinct 2-m-thick intervals with lower density (at 156 and 165 mbsf, re-spectively).
Temperature Log
Temperatures were recorded with the Lamont-Doherty Earth Obser-vatory (LDEO) Temperature/Acceleration/Pressure (TAP) memory toolattached at the bottom of the triple combo tool string. Because only afew hours had passed since the end of drilling operations and hole con-ditioning, the borehole temperature is not representative of the actualequilibrium temperature distribution of the formation. In the case ofHole 1229A, the surface seawater and the sepiolite mud pumped duringand after drilling generated borehole fluid temperatures higher than theformation temperatures. Discrete measurements made with the DVTP
SHIPBOARD SCIENTIFIC PARTYCHAPTER 10, SITE 1229 31
indicate a maximum formation temperature of 19.2°C at 164.8 mbsf(see “In Situ Temperature Measurements,” p. 27, in “DownholeTools”) and a temperature of 19.9°C was recorded at 187 mbsf at Site681 (Shipboard Scientific Party, 1988), whereas the maximum tempera-ture recorded by the TAP tool at 186 mbsf is 25.6°C (see Fig. F27). Thegenerally lower temperatures during the second pass indicate a progres-sive return to equilibrium. The variations measured at 70 and 80 mbsfwhile logging downhole correspond to the tool exiting the drill string.The drops in temperature on the uphole run at 100 and 150 mbsf arelikely related to operations, and the smoother second pass indicatessome recovery between the two passes. Surprisingly, these features werenot recorded on the downhole run and are difficult to explain becausethe logging speed was uniform during the two passes and no stop wasmade. The consistently small difference between the two passes in thetwo directions between 80 and 100 mbsf is also unexpected and willneed further explanation. 16 18 20 22 24 26
0
50
100
150
Log down - pass 1Log up - pass 1Log down - pass 2Log up - pass 2
Dep
th (
mbs
f)
Temperature (°C)
F27. Hole 1229A temperature log, p. 63.
SHIPBOARD SCIENTIFIC PARTYCHAPTER 10, SITE 1229 32
REFERENCES
Berggren, W.A., Kent, D.V., Swisher, C.C., and Aubry, M.P., 1995. A revised Cenozoicgeochronology and chronostratigraphy. In Berggren, Kent, Aubry, and Hardenbol,J., (Eds.), 1995. Geochronology, Time Scales and Global Stratigraphic Correlation. Spec.Pub.—SEPM, 59:129–212.
Cragg, B.A., Parkes, R.J., Fry, J.C., Herbert, R.A., Wimpenny, J.W.T., and Getliff, J.M.,1990. Bacterial biomass and activity profiles within deep sediment layers. In Suess,E., von Huene, R., et al., Proc. ODP, Sci. Results, 112: College Station, TX (OceanDrilling Program), 607–619.
Merrill, D.L., Ohnstad, T., and McCabe, R., 1990. Magnetic susceptibility measure-ments of Leg 112 cores. In Suess, E., von Huene, R., et al., Proc. ODP, Sci. Results,112: College Station, TX (Ocean Drilling Program), 677–683.
Parkes, R.J., Cragg, B.A., Bale, S.J., Getliff, J.M., Goodman, K., Rochelle, P.A., Fry, J.C.,Weightman, A.J., and Harvey, S.M., 1994. A deep bacterial biosphere in PacificOcean sediments. Nature, 371:410–413.
Rider, M., 1996. The Geological Interpretation of Well Logs (2nd ed.): Houston (GulfPublishing Co.).
Shipboard Scientific Party, 1988. Site 681. In Suess, E., von Huene, R., et al., Proc. ODP,Init. Repts., 112: College Station, TX (Ocean Drilling Program), 305–362.
Smith, R.L., Huyer, A., Godfrey, J.S., and Church, J.A., 1991. The Leeuwin Current offWestern Australia, 1986–1987. J. Phys. Oceanog., 21:323–345.
Smith, D.C., Spivack, A.J., Fisk, M.R., Haveman, S.A., Staudigel, H., and ODP Leg 185Shipboard Scientific Party, 2000. Methods for quantifying potential microbial con-tamination during deep ocean coring. ODP Tech. Note, 28 [Online]. Available fromthe World Wide Web: <http://www-odp.tamu.edu/publications/tnotes/tn28/INDEX.HTM>. [2002-03-30]
Suess, E., von Huene, R., et al., 1988. Proc. ODP, Init. Repts., 112: College Station, TX(Ocean Drilling Program).
SHIPBOARD SCIENTIFIC PARTYCHAPTER 10, SITE 1229 33
Figure F1. Lithostratigraphic summary for Site 1229. Color reflectance profile is from Hole 1229A. TD =total depth.
0 2 4 6 8 10
Dep
th (
mbs
f)
1H 1H1H 1H 1H
2H
3H
4H
5H
6H
7H
8H
9H
10H
11H
12H
13H
2H
3H
4H
5H
6H
7H
8H
9H
11H
12H
13H
14H
15H
10P
2H
3H
4MTD
25.4 mbsf
TD8.8 mbsf
TD115.8mbsf TD
121.5mbsf
2H
3H
4H
5H
6H
7H
8H
9H
10H
11H
12H
13H
14H
15H
16H
17H
18H
19H
21H
22H
20M
Drilled
Hole1229A
Hole1229B
Hole1229C
Hole1229D
Hole1229E
TD194.4 mbsf
Cor
e
Rec
over
y
Cor
e
Rec
over
y
Cor
e
Rec
over
y
Cor
e
Rec
over
y
Cor
e
Rec
over
y
10
20
30
40
60
70
80
90
110
120
130
140
160
170
180
190
50
100
150
200
Color Reflectance (b*)
Ph
Ph
Ph
PhPhPh
Ph
Ph
Ph
IA
IB
IC
Olive-green, yellowlaminated diatom- and
silt-bearing clayand diatom and clay-richsilt with nannofossil-rich
laminae andgray silty layers
Alternation between olive-green diatom- and silt-rich
clay, rich in dolomite and phosphate nodules
Well-laminated clay- andsilt-rich diatom ooze,
cross-bedding and erosionsurfaces at the top, silt and
SHIPBOARD SCIENTIFIC PARTYCHAPTER 10, SITE 1229 34
Figure F2. Lithostratigraphic summary for Site 1229 plotted together with natural gamma radiation (NGR)measured by wireline tool and multisensor track (MST) from Hole 1229A. TD = total depth.
NGR wireline (cps) NGR MST (cps)
50 100 150 50 100 150
Dep
th (
mbs
f)
1H 1H1H 1H 1H
2H
3H
4H
5H
6H
7H
8H
9H
10H
11H
12H
13H
2H
3H
4H
5H
6H
7H
8H
9H
11H
12H
13H
14H
15H
10P
2H
3H
4MTD
25.4 mbsf
TD8.8 mbsf
TD115.8mbsf TD
121.5mbsf
2H
3H
4H
5H
6H
7H
8H
9H
10H
11H
12H
13H
14H
15H
16H
17H
18H
19H
21H
22H
20M
Drilled
Hole1229A
Hole1229B
Hole1229C
Hole1229D
Hole1229E
TD194.4 mbsf
Cor
e
Rec
over
y
Cor
e
Rec
over
y
Cor
e
Rec
over
y
Cor
e
Rec
over
y
Cor
e
Rec
over
y
10
20
30
40
60
70
80
90
110
120
130
140
160
170
180
190
50
100
150
200
Ph
Ph
Ph
PhPhPh
Ph
Ph
Ph
IA
IB
IC
Epo
ch
Age
(M
a)
Uni
t
Sub
unit
I
II
Lithology
0.78
Ple
isto
cene
l. P
lio.
0°
SHIPBOARD SCIENTIFIC PARTYCHAPTER 10, SITE 1229 35
Figure F3. Close-up photographs. A. Cross-bedding in diatom-rich silt of Subunit IA. B. Dolomite nodulewith preserved sedimentary layering surrounded by pale yellow altered sediment. Smear slide analysis andX-ray diffractometry revealed almost pure dolomitic composition for disseminated rhombs in the yellowaltered parts (XRD Sample 201-1229A-1H-3, 84–85 cm). These features also seem to be concentrated in yel-low semilithified diatom ooze laminae. (Continued on next two pages.)
cm
110
120
100
90
A201-1229D-1H-2, 90-120 cm cm
90
80
70
B201-1229A-1H-3, 70-95 cm
SHIPBOARD SCIENTIFIC PARTYCHAPTER 10, SITE 1229 36
Figure F3 (continued). C. Fluid escape structure filled with quartz sand in Subunit IB. White and pale yel-low mineralizations are of dolomitic composition, as shown by X-ray diffractometry. D. Boundary betweenSubunits IB and IC. Onset of gray diatom-poor silt and clay sediments over olive-green diatom-rich siltyclay. The transition is marked by several erosional surfaces, each covered by a layer of shell debris. (Con-tinued on next page.)
cm
110
120
100
90
C201-1229A-10H-1, 90-120 cm cm
55
65
45
35
D201-1229A-11H-6, 35-65 cm
Subunit IB
Subunit IC
SHIPBOARD SCIENTIFIC PARTYCHAPTER 10, SITE 1229 37
Figure F3 (continued). E. Phosphatic hardground covering a gray clay layer in Subunit IC. The surface ofthe clay layer is affected by burrowing.
cm
135
140
130
125
E201-1229A-14H-4, 125-140 cm
Silt
Phosphatehardground
Clay
Silt
Burrow
SHIPBOARD SCIENTIFIC PARTYCHAPTER 10, SITE 1229 38
Figure F4. Diffractogram of dolomite precipitated near a fluid escape structure in Subunit IB. The measuredpeak shows an offset of 0.191°2θ relative to the peak of ordered dolomite indicating that the interval is acalcium-rich dolomite (Section 201-1229A-10H-1).
0
200
400
600
800
1000
1200
1400
1600
1800
2000
cps
10 20 30 40 50 60
Quartz, syn: JCPDS 33-1161: SiO2
Dolomite: JCPDS 36-0426: CaMg(CO3)2
4.257
3.342
2.457 2.282
2.237
2.1271.9792
1.8179
1.80211.6719
1.65911.6082
4.033 3.699
2.888
2.672.539
2.404
2.193
2.0652.015
2.0061.8473
1.80491.787
1.78
1.74611.5667
1.5446
Qua
rtz:
26.
674°
2θ
Ord
ered
dol
omite
: 30.
965°
2θ
30.7
2°2θ
26.6
2°2θ
°2θ CuKα
SH
IPB
OA
RD
SC
IEN
TIFIC P
AR
TY
CH
AP
TE
R 1
0, S
ITE 1
22
93
9
Figure kalinity, (B) dissolved in organic carbon (DIC),(C) su pages.)
0
25
50
75
100
125
150
175
200
Dep
th (
mbs
f)
A
0 10 20
Barium (µM)
F
0 4 8 12
Manganese(µM)
G
F5. Concentrations of various dissolved species in interstitial waters from Site 1229. (A) allfate, (D) chloride, (E) total sulfide, (F) barium, and (G) manganese. (Continued on next two
0 500 1000
Chloride(mM)
D
0 10 20 30 40
Sulfate(mM)
C
0 10 20
Alkalinity(mM)
Hole 1229A
Hole 1229D
0 10 20
DIC(mM)
B
0 4 8
Sulfide(mM)
E
SH
IPB
OA
RD
SC
IEN
TIFIC P
AR
TY
CH
AP
TE
R 1
0, S
ITE 1
22
94
0
Figure F5 (continued). (H) iron, (I) strontium, (J) lithium, (K) ammonium, (L) phosphate, and (M) silica. (Continued on next page.)
2
5
7
10
12
15
17
20
Dep
th (
mbs
f)
H I J K
20 40
osphate(µM)
L
0 1000
Silica(µM)
M
0 10 20
Iron(µM)
0
5
0
5
0
5
0
5
0
0 200 400
Strontium(µM)
Lithium(µM)
0 100 200 0 4000 8000
Ammonium(µM)
0
Ph
SH
IPB
OA
RD
SC
IEN
TIFIC P
AR
TY
CH
AP
TE
R 1
0, S
ITE 1
22
94
1
Figure F5 (continued). (N) acetate, (O) formate, (P) methane, (Q) ethane, (R) propane, and (S) hydrogen.
0 4 8 120
2
5
7
10
12
15
17
20
Acetate(µM)
Dep
th (
mbs
f)
N
0 4 8 12
Formate(µM)
O
0 1500 3000
Methane(µM)
P
0 1.5 3
Ethane(µM)
Q
0 1.5 3
Propane(µM)
R
0 2 4
Hydrogen(nM)
S
5
0
5
0
5
0
5
0
SH
IPB
OA
RD
SC
IEN
TIFIC P
AR
TY
CH
AP
TE
R 1
0, S
ITE 1
22
94
2
Figure MBIO core sections from Hole 1229A. The sequence of subsec-tions r ribonucleic acid, ATP = adenosine triphosphate. WRC = whole-round o 79 cm. See Table T2, p. 82, in the “Explanatory Notes” chapterfor ex
DN
A-O
DP
arc
hive
ATP
-DN
A
7 7 7 7 5 5 5 5 5 5 5 5 10
R FISHWR2 FISHWR DNAM DNAF DNAT DNAN DNAS DNAODP ATPS
60-mL + 3 x 5-mL syr 60-mL syr 60-mL + 2 x
5-mL syr60-mL + 3 x
5-mL syr WRC WRC WRC WRC WRC WRC WRC WRC WRC
g Anaer. Jar Anaer. Jar Al-bag Al-bag Al-bag Poly-bag Poly-bag Poly-bag Poly-bag Poly-bag Poly-bag Poly-bag Poly-bag
N2 N2 N2 N2 N2
+4˚C +4˚C on ice on ice +4˚C -80°C -80˚C -80˚C -80˚C -80˚C -80˚C -80˚C -80˚CSediment
F6. Graphical representation of subsampling and analysis program for theuns from the top of the core (right) towards the bottom (left). DNA = deoxy core. * = big piece of dolomite at 78–84 cm. ** = Dolomite samples from 64 tplanation of sampling codes.
Figure m for the MBIO core sections from Hole 1229D. The sequence of subsec-tionin A = deoxyribonucleic acid, ATP = adenosine triphosphate. WRC = whole-round explanation of sampling codes.
F7. Graphical representation of subsampling and analysis prograg runs from the top of the core (right) towards the bottom (left). DN core. See Table T2, p. 82, in the “Explanatory Notes” chapter for
SHIPBOARD SCIENTIFIC PARTYCHAPTER 10, SITE 1229 44
Figure F8. Total prokaryotic cells (solid circles) and the percentage of dividing cells (open circles) withdepth at Site 1229. Dividing cell percentages become increasingly unreliable as total cell counts decreasebelow 1 × 107 cm–3 as within-sample variability rises due to the low number of cells counted. Verticaldashed line on the left represents the detection limit at 5.8 × 10⁵ cells/cm3.
5 6 7 8 9 10
0 4 8 12 16 20
0
10
20
30
40
50
60
70
80
90
100
110
120
130
140
150
160
170
180
190
Dividing cells (%)
Dep
th (
mbs
f)
Total cells (log10
cells/cm3)
SHIPBOARD SCIENTIFIC PARTYCHAPTER 10, SITE 1229 45
Figure F9. Profile of total prokaryotic cells at Site 1229. The heavy dashed line is a regression line derivedfrom previous ODP legs, and updated from Parkes et al., 1994 (log10 cells = 8.03 – 0.66 log10 depth). Lighterdashed lines represent the ±2-σ envelopes of data based on censused data from previous ODP legs.
5 6 7 8 9 10 110.01
0.1
1
10
100
1000
Dep
th (
mbs
f)
Total cells (log 10 cells/cm3)
SHIPBOARD SCIENTIFIC PARTYCHAPTER 10, SITE 1229 46
Figure F10. Comparison of magnetic susceptibility data. A. MST for Site 1229. B. Postcruise data from Hole681A (Merrill et al., 1990).
IA
Unit
IB
IC
II
0
20
40
60
80
100
120
140
160
1800 10 20 30 40 50
Hole 1229AHole 1229D
Dep
th (
mbs
f)
Magnetic susceptibility(x 10-5 SI units)
Site 1229
Magnetic susceptibility(x 10-5 SI units)
Hole 681A
0 10 20 30
A B
SHIPBOARD SCIENTIFIC PARTYCHAPTER 10, SITE 1229 47
Figure F11. Magnetic intensity in Hole 1229A. Open squares = NRM intensity, solid squares = intensity af-ter 20-mT AF demagnetization.
Hole 1229A
Dep
th (
mbs
f)
Magnetic intensity (kA/m)
0
50
100
150
20010-7 10-410-510-6
Unit
IA
IB
IC
II
SHIPBOARD SCIENTIFIC PARTYCHAPTER 10, SITE 1229 48
Figure F12. Principal component analysis of natural remanent magnetization (NRM) of Sample 201-1229A-4H-6, 70–72 cm, including equal area projection of directions of magnetization during demagnetization,intensity of magnetization plotted vs. demagnetization, and vector component diagrams showing projec-tion of magnetic vector’s endpoints on horizontal and vertical planes. Number reflect demagnetizationsteps. Dashed line shows a 5- to 30-mT fitting direction.
J/Jmax Jmax = 3.60e-6
0 40
N, Up
E, E
N
2010 30
NRM
Equal Area projection
NRM
Sample 201-1229A-4H-6, 70-72 cm
N, Up
E, N
N
Demagnetization level (mT)
Lower hemisphere Upper hemisphere
Initial point (NRM)
NRM
15 20
25
30
5 mT10
Inclination = -22.0°Declination = 61.5°
HorizontalVertical
NRM
SHIPBOARD SCIENTIFIC PARTYCHAPTER 10, SITE 1229 49
Figure F13. Principal component analysis of natural remanent magnetization (NRM) of Sample 201-1229A-3H-3, 65–67 cm including equal area projection of directions of magnetization during demagnetization,intensity of magnetization plotted vs. demagnetization, and vector component diagrams showing projec-tion of magnetic vector’s endpoints on horizontal and vertical planes. Numbers reflect demagnetizationsteps. Dashed line shows a 5- to 30-mT fitting inclination.
J/Jmax Jmax = 4.99e-6
N, Up
E, E
N,Up
E,N
N
NRM
NRM
NRM
NRM
5 mT
10
15
20
2530
Inclination = -23.7°Sample 201-1229A-3H-3, 65-67 cm
N, Up
E, N
N
Equal Area projection
Lower hemisphere Upper hemisphere
0 402010 30
Demagnetization level (mT)
HorizontalVertical
Initial point (NRM)
NRM
SHIPBOARD SCIENTIFIC PARTYCHAPTER 10, SITE 1229 50
Figure F14. Principal component analysis of natural remanent magnetization (NRM) of Sample 201-1229A-14H-3, 110–112 cm, including equal area projection of directions of magnetization during demagnetiza-tion, intensity of magnetization plotted vs. demagnetization, and vector component diagrams showingprojection of magnetic vector’s endpoints on horizontal and vertical planes. Numbers reflect demagnetiza-tion steps. Dashed line shows a 20- to 40-mT fitting inclination.
J/Jmax Jmax = 3.10e-5
N, Up
E, E
N,Up
E,NN
0 402010 30
Demagnetization level (mT)
NRM
NRM
NRM
35 40
20mT2530
Inclination = 21.0°Sample 201-1229A-14H-3, 110-112 cm N, Up
E, NN
Lower hemisphere Upper hemisphere
Equal Area projection
Initial point (NRM)
NRM
NRM
HorizontalVertical
SH
IPB
OA
RD
SC
IEN
TIFIC P
AR
TY
CH
AP
TE
R 1
0, S
ITE 1
22
95
1
Figure e 1229A compared with the wirelinedensit ompared with the wireline porositylog fro
2
4
6
8
10
12
14
16
18
Dep
th (
mbs
f)
A
IA
Unit
IB
IC
II
e 1299A MADe 1229A Wireline (far)
70 90
rosity (%)
F15. A. Gamma ray attenuation (GRA) density and discrete moisture and density (MAD) data from Holy log from the same hole. B. Grain density from Hole 1229A. C. Porosity calculated from MAD data cm the same hole.
0
0
0
0
0
0
0
0
0
01.0 1.5 2.0 2.5
Hole 1229A GRA
Hole 1229A WirelineHole 1229A MADHole 1229D GRA
Bulk density (g/cm3)
base of drill pipe
2.0 2.5 3.0
Hole 1229A MAD
Grain density (g/cm3)
B
HolHol
30 50
Po
C
SHIPBOARD SCIENTIFIC PARTYCHAPTER 10, SITE 1229 52
Figure nterval of depositional cycles. A. Gamma ray at-tenuat ofile.
40
50
60
70
80
90
100
110
120
130
140
Dep
th (
mbs
f)
A
0 70 90
Hole 1229A MADHole 1229A Wireline
Porosity (%)
IB
IC
Unit
2
Cyc
les
1
3
4
F17. Mass/volume moisture and density (MAD) measurements for Hole 1229A over the iion (GRA) bulk density profiles. B. MAD and wireline porosity profile. C. Grain density pr
1.0 1.5 2.0 2.5
Hole 1229A GRAHole 1229D GRA
Bulk density (g/cm3)
2.2 2.6 3.0
Grain density (g/cm3)
B
30 5
C
SHIPBOARD SCIENTIFIC PARTYCHAPTER 10, SITE 1229 54
Figure F18. P-wave velocity profiles derived from P-wave logger (PWL) and PWS3 measurements. Peaks arehighlighted with arrows and are due to phosphatic or dolomitic nodules.
IA
Unit
IB
IC
II
Hole 1229A PWL
Hole 1229D PWL
Hole 1229A PWS
0
20
40
60
80
100
120
140
160
1801400 1600 1800
Phosphatic or dolomitic diagenesis
dolomite lens2250 m/s
P-wave velocity (m/s)
Dep
th (
mbs
f)
SH
IPB
OA
RD
SC
IEN
TIFIC P
AR
TY
CH
AP
TE
R 1
0, S
ITE 1
22
95
5
Figure ecord for Hole 1229A. B. Expandedscale o
2
4
6
8
10
12
14
16
18
Dep
th (
mbs
f)
A
IB
IC
Uni
t
2
Cyc
les
1
3
4
200
50 300
er scale)scale)
F19. A. Natural gamma radiation (NGR) profile from the MST track compared with the wireline log rf Subunits IA and IB showing the four gamma ray cycles described in the text.
SHIPBOARD SCIENTIFIC PARTYCHAPTER 10, SITE 1229 56
Figure F20. Thermal conductivity measurements for Hole 1229A. A. Thermal conductivity profile (needleprobe method). B. Mean-detrended bulk density and thermal conductivity profiles illustrate the control-ling effect of water content variability on thermal properties.
0
20
40
60
80
100
120
140
160
1800.6 0.8 1.0 1.2 1.4
Thermal conductivity (W/[m•K])
Dep
th (
mbs
f)
IA
Unit
IB
IC
II
60 80 100 120 140 160
Thermal conductivity (TC)Bulk density (BD)
Average-normalized TC and BD (%)
TC avg: 0.86 W/(m•K)
BD avg: 1.47 g/cm3
A B
SHIPBOARD SCIENTIFIC PARTYCHAPTER 10, SITE 1229 57
Figure F21. Formation factor profile for Hole 1229A. Three lithologies are indicated by the thick lines.
IA
Unit
IB
IC
II
0
20
40
60
80
100
120
140
160
1801 2 3 4 5 6
Dep
th (
mbs
f)
Formation factor
diatom ooze
interbedded siliciclastics
diatom- and quartz-bearing clay and silt
Lithology
SHIPBOARD SCIENTIFIC PARTYCHAPTER 10, SITE 1229 58
Figure F22. Temperature record for the DVTP deployment after Core 201-1229A-18H at 164.9 mbsf.
19.0
19.5
20.0
20.5
21.0
21.5
22.0
22.5
23.0
20 25 30 35 40
Tem
pera
ture
(o C
)
Time (min)
Lower thermistor
Upper thermistor
Fitted temperature = 19.2°C
After Core 201-1229A-18HDepth = 164.9 mbsf
SHIPBOARD SCIENTIFIC PARTYCHAPTER 10, SITE 1229 59
Figure F23. A. Temperature measured in Hole 1229A together with the temperature data from Site 681 plot-ted vs. depth with a best-fit linear profile for the combined data. B. Temperature data with steady-stateconductive temperature profile calculated using measured thermal conductivities from Hole 1229A anduniform heat flow. DVTP = Davis-Villinger Temperature Probe.
0
50
100
150
20013 14 15 16 17 18 19 20 21
Linear gradient
DVTP
Adara
Leg 112
Dep
th (
mbs
f)
Temperature ( oC)
Temperature gradient: 0.0355°C/m
12 13 14 15 16 17 18 19 20
Integrated profile
DVTP
Leg 112
Temperature ( oC)
Conductive heat flow:
35.5 mW/m2
SHIPBOARD SCIENTIFIC PARTYCHAPTER 10, SITE 1229 60
Figure F24. Pressure measured in Hole 1229A during the DVTP-P deployment after Core 201-1229-9H. BOH= bottom of hole.
1.5
2.0
2.5
3.0
30 40 50 60 70 80 90
Pre
ssur
e (M
Pa)
Time (min)
Stop at mudline Stop at
mudline
After Core 201-1229A-9H
Depth = 79.4 mbsf Water depth = 152.2 m
Stop at BOH
Stop at BOH
Estimated pressure = 2.42 MPa
SHIPBOARD SCIENTIFIC PARTYCHAPTER 10, SITE 1229 61
Figure F25. Main logs recorded in Hole 1229A. A. The hole diameter is measured by the caliper arm of thedensity sonde. B. The gamma ray is a measure of the natural radioactivity of the formation. C. Concentra-tions of potassium, thorium, and uranium derived from the gamma ray counts. D. Ratio of the thorium touranium concentrations. High values indicate sediments of terrigenous origin. E. Resistivity measured bythe Phasor Dual Induction Tool with three depths of investigation. F. Density log (red line) compared withdensity measurements made on core samples (shaded circles) (see “Density and Porosity,” p. 23, in “Phys-ical Properties”). G. Porosity log for the two receivers of the APS sonde compared with porosity measure-ments made on core samples (shaded circles) (see “Density and Porosity,” p. 23, in “Physical Properties”).HNGS = Hostile Environment Natural Gamma Sonde, SGT = Scintillation Gamma Ray Tool.
SHIPBOARD SCIENTIFIC PARTYCHAPTER 10, SITE 1229 62
Figure F26. Comparison between data from the two passes of the triple combo string in Hole 1229A. A.Gamma ray. B. Resistivity. C. Density. Green dashed lines = data from the first pass, red solid lines = datafrom the second pass. HNGS = Hostile Environment Gamma Ray Sonde.
Dep
th (
mbs
f)
Pass 2 Pass 2Pass 2
Pass 1 Pass 1Pass 1
20 180 0.2 1(Ωm) 1.2 (g/cm3)(gAPI)
HNGSgamma ray
Spher. focusedresistivity
Density
70
80
90
100
110
120
130
140
150
160
170
180
A B C
2.2
1A
3A
2C
2B
2A
1B
3B
Unit
SHIPBOARD SCIENTIFIC PARTYCHAPTER 10, SITE 1229 63
Figure F27. Temperature log recorded in Hole 1229A. Temperature data were recorded continuously duringthe two passes of the tool string.
16 18 20 22 24 26
0
50
100
150
Log down - pass 1Log up - pass 1Log down - pass 2Log up - pass 2
Dep
th (
mbs
f)
Temperature (°C)
SHIPBOARD SCIENTIFIC PARTYCHAPTER 10, SITE 1229 64
Table T1. Coring summary, Site 1229. (Continued onnext page.)
Hole 1229ALatitude: 10°58.5721′SLongitude: 77°57.4590′WTime on site (hr): 90.0 (1330 hr, 6 Mar–0730 hr, 10 Mar 2002)Time on hole (hr): 49.33 (1330 hr, 6 Mar–1450 hr, 8 Mar 2002)Seafloor (drill pipe measurement from rig floor, mbrf): 163.6Distance between rig floor and sea level (m): 11.4Water depth (drill pipe measurement from sea level, m): 152.2Total depth (drill pipe measurement from rig floor, mbrf): 358.0Total penetration (meters below seafloor, mbsf): 194.4Total length of cored section (m): 192.9Total length of drilled intervals (m): 1.5Total core recovered (m): 133.1Core recovery (%): 69.0Total number of cores: 22Total number if drilled intervals: 1
Hole 1229BLatitude: 10°58.5697′SLongitude: 77°57.4586′WTime on hole (hr): 3.33 (1450 hr, 8 Mar–1810 hr, 8 Mar 2002)Seafloor (drill pipe measurement from rig floor, mbrf): 165.1Distance between rig floor and sea level (m): 11.4Water depth (drill pipe measurement from sea level, m): 153.7Total depth (drill pipe measurement from rig floor, mbrf): 190.5Total penetration (meters below seafloor, mbsf): 25.4Total length of cored section (m): 25.4Total core recovered (m): 24.84Core recovery (%): 97.8Total number of cores: 4
Hole 1229CLatitude: 10°58.5683′SLongitude: 77°57.4683′WTime on hole (hr): 1.58 (1810 hr, 8 Mar–1945 hr, 8 Mar 2002)Seafloor (drill pipe measurement from rig floor, mbrf): 162.7Distance between rig floor and sea level (m): 11.5Water depth (drill pipe measurement from sea level, m): 151.2Total depth (drill pipe measurement from rig floor, mbrf): 171.5Total penetration (meters below seafloor, mbsf): 8.8Total length of cored section (m): 8.8Total core recovered (m): 8.8Core recovery (%): 100.0Total number of cores: 1
Hole 1229DLatitude: 10°58.5672′SLongitude: 77°57.4704′WTime on hole (hr): 24.08 (1945 hr, 8 Mar–1950 hr, 9 Mar 2002)Seafloor (drill pipe measurement from rig floor, mbrf): 162.7Distance between rig floor and sea level (m): 11.5Water depth (drill pipe measurement from sea level, m): 151.2Total depth (drill pipe measurement from rig floor, mbrf): 278.5Total penetration (meters below seafloor, mbsf): 115.8Total length of cored section (m): 115.8Total core recovered (m): 100.97Core recovery (%): 87.2Total number of cores: 15
Hole 1229ELatitude: 10°58.5655′SLongitude: 77°57.4808′WTime on hole (hr): 11.67 (1950 hr, 9 Mar–0730 hr, 10 Mar 2002)Seafloor (drill pipe measurement from rig floor, mbrf): 162.0Distance between rig floor and sea level (m): 10.7Water depth (drill pipe measurement from sea level, m): 151.3Total depth (drill pipe measurement from rig floor, mbrf): 283.5Total penetration (meters below seafloor, mbsf): 121.5Total length of cored section (m): 121.5Total core recovered (m): 99.64Core recovery (%): 82.0Total number of cores: 13
SHIPBOARD SCIENTIFIC PARTYCHAPTER 10, SITE 1229 65
SHIPBOARD SCIENTIFIC PARTYCHAPTER 10, SITE 1229 73
Table T5. Level of seawater contamination expected in coresbased on the concentration of PFT observed in sediment andparallel bead counts, Holes 1229A and 1229D.
Notes: Detection limit = 0.01 µL seawater/g sediment, BD = below detection. Thepotential for microbial contamination is based on 5 × 10⁸ cells/L surface sea-water. This may be viewed as an upper limit for microbial contamination becauseit requires the sediment be porous enough to allow all of the contaminating cellsto travel with the PFT. HTEW = high temperature (thermophile) enrichmentswhole-round core.
Core,section Sample details
ng PFT/g sediment
Potential µLseawater/
g sedimentBeads
counted Beads/g
201-1229A-2H-2 Center 0.03 0.032H-2 Outside 18.41 18.41 215 in 21 fields 8,8513H-2 Center 0.02 0.023H-2 Outside 15.33 15.33 209 in 20 fields 578,7844H-5 Center 0.05 0.054H-5 Outside 0.54 0.546H-2 Center 0.09 0.096H-2 Outside 0.52 0.529H-5 Center BD BD9H-5 Outside 0.03 0.0311H-5 Center 0.03 0.0311H-5 Outside 0.02 0.0214H-3 Center 0.05 0.0514H-3 Outside 0.11 0.1118H-2 Center 0.01 0.0118H-2 Outside 0.13 0.1322H-2 HTEW section BD BD
201-1229D-1H-1 Center 0.01 0.011H-1 Outside 0.02 0.021H-1 Outside (bead sample) 0.14 0.141H-3 Center 0.01 0.011H-3 Outside 2.32 2.3212H-2 Center 0.03 0.0312H-2 Outside 0.16 0.1615H-3 Center 0.03 0.0315H-3 Outside 0.89 0.89
SHIPBOARD SCIENTIFIC PARTYCHAPTER 10, SITE 1229 74
Table T6. Potential contamination of slurries basedon PFT results, Holes 1229A and 1229D.
Notes: E mperature (RT = 21°–25°C). DS* = dilution series, with 6steps 3 mL water slurry from the top of Core 1H. In addition, aform ee Table T7, p. 75). Media are defined in Table T9, p. 90,in th lanatory Notes” chapter).
Core:Depth
1229A-22H187
1229D-1H1
1229D-15H110
Sed 15°C: MPN 15°C: MPNPast-Se 15°C: MPN 15°C: MPNMono 15°C: MPN 15°C: MPNMono-Poly 15°C: MPN 15°C: MPNPoly-TiAro 15°C: MPN 15°C: MPNRad 15°C: MPN 15°C: MPNPast-Ra 15°C: MPN 15°C: MPNGrad 15°C: EN 15°C: ENFERM-G 60°C: EN 60°C: MPN 60°C: ENFERM-G 60°C: EN 60°C: MPN 60°C: ENFERM-X 60°C: EN 60°C: MPN 60°C: ENFERM-X 60°C: EN 60°C: MPN 60°C: ENSRB: 8. 60°C: EN 60°C: MPN 60°C: ENSRB: 8. 60°C: EN 60°C: MPN 60°C: ENSRB be 60°C: EN 60°C: MPN 60°C: ENH2/HCO 60°C: EN 60°C: MPN 60°C: ENH2/HCO 60°C: EN 60°C: MPN 60°C: ENH2/HCO 60°C: EN 60°C: MPN 60°C: ENH2/HCO 20°C: DS* 20°C, DS*;
60°C: MPN20°C, DS*; 60°C: EN
H2/HCO 60°C: ENC-18-lip 60°C: EN 60°C: MPN 60°C: ENC-18-lip 60°C: EN 60°C: MPN 60°C: ENChlor: 60°C: EN 60°C: EN 60°C: ENMethyl 20°C: DS* 20°C, DS*;
60°C: MPN20°C, DS*; 60°C: EN
CH4-ac 20°C: DS* 20°C, DS*; 60°C: EN 20°C, DS*; 60°C: EN201-1 RT, 50°C, 80°C: EN RT, 50°C, 80°C: EN201-4 RT: EN201-5 RT: EN201-8 RT: EN201-11 RT: EN RT: ENFe(III)re RT: EN RT: ENMn(IV) RT: EN RT: EN
T8. Media inoculated with sample material from different depths, Holes 1229A and 1229D.
nrichment assays were qualitative (EN or DS) or quantitative (MPN) and incubated at the temperature given or at room te of 1:10 dilutions. The first inoculation consists of 1 mL slurry. Controls were inoculated with 5 mL ocean surface water and aldehyde-poisoned control was prepared for every sample. Note that slurry 1229D-15D was not tested for contamination (se “Explanatory Notes” chapter (see also “Microbiology,” p. 14 and Tables T4, p. 84, T5, p. 85, and T7, p. 88, all in the “Exp
d 15°C: MPN 15°C: MPN15°C: EN 15°C: EN 15°C: EN 15°C: EN 15°C: EN
lyc: 8.0 60°C: EN 60°C: MPN 60°C: MPNlyc: 8.8 60°C: EN 60°C: MPNyl: 8.0 60°C: EN 60°C: MPNyl: 8.8 60°C: EN 60°C: MPN
0 60°C: EN 60°C: MPN 60°C: MPN6 60°C: EN 60°C: MPNnz: 8.0 60°C: EN 60°C: MPN
3–/FeIII: 7.9 60°C: EN 60°C: MPN
3–/FeIII: 8.5 60°C: EN 60°C: MPN
3–/MnIV: 7.8 60°C: EN 60°C: MPN
3–: 7.8 60°C: EN 20°C: DS* 20°C, DS*;
60°C:MPN20°C: DS*
3–: 8.8
o: 7.8 60°C: EN 60°C: MPNo: 9.0 60°C: EN 60°C: MPN
7.8 60°C: EN 60°C: MPNamine 60°C: EN 20°C: DS* 60°C: MPN; 20°C: DS*
e 60°C: EN 20°C: DS* 20°C: DS* 20°C: DS*RT, 50°C, 80°C: EN RT, 50°C, 80°C: EN RT, 50°C, 80°C: EN RT, 50°C, 80°C: EN RT, 50°C, 80°C: EN RT, 50°C, 80°C: EN
RT: ENRT: ENRT: EN
RT: EN RT: EN RT: EN RT: EN RT: EN RT: ENd RT: EN RT: ENred RT: EN RT: EN
SHIPBOARD SCIENTIFIC PARTYCHAPTER 10, SITE 1229 77
Table T9. Downhole temperature measurement summary, Holes 1229A, 1229D,681A, and 681B.
Notes: DVTP = Davis-Villinger Temperature Probe, T-probe = temperature probe. T = top of core, B = bot-tom of core. — = not applicable. * = extrapolated bottom-water temperature. † = average thermal con-ductivity. ‡ = projected temperature at base of hole. The last line shows the temperature extrapolated tothe base of the hole using linear fit in Figure F22, p. 58, and the mean thermal conductivity computedfrom data plotted in Figure F20A, p. 56.
Depth (mbsf) Tool
Measurement location
Thermal conductivity (W/[m·K])
Temperature (°C) Assessment
0.0 Adara Seafloor, T Core 201-1229A-1H 14.9 Possible annual variation0.0 — 13.5*
33.4 DVTP B Core 201-1229A-4H — — No clear start of decay; too high43.9 Adara B Core 112-681B-5H <15.0 Upper bound on formation value62.9 T-probe B Core 201-681B-7H — >15.6 Lower bound on formation value68.4 DVTP B Core 201-1229A-8H — — No decay profile; large oscillations77.8 DVTP B Core 201-1229D-10H — — No clear start of decay; too high
107.9 DVTP B Core 201-1229A-12H — Curve wrong shape; value too high124.5 T-probe B Core 112-681B-14X — >16.8 Lower bound on formation value164.9 DVTP B Core 201-1229A-18H 1.13 19.2 Good 187.0 T-probe B Core 112-681A-20X >19.9 Lower bound on formation value192.9 — 0.87† 20.2‡
SHIPBOARD SCIENTIFIC PARTYCHAPTER 10, SITE 1229 78
Table T10. Detail of logging operations, Hole 1229A.
Notes: UTC = Universal Time Coordinated. GMT = Greenwich Mean Time. TD = total depth. TAP = LDEO Temperature/Acceleration/Pressure tool, DIT-E = Dual Induction Tool, HLDT = Hostile Environment Litho-Density Tool, APS = Accel-erator Porosity Sonde, HNGS = Hostile Environment Gamma Ray Sonde, SGT = Scintillation Gamma Ray Tool.
Date(Mar 2002)
UTC(GMT – 6 hr)
Tool depth(mbsf) Remarks
8 0500 End of coring8 0530–0830 Wiper trip; hole displaced with sepiolite; bottom of pipe set at 80 mbsf8 0830–1015 Logging rig-up8 1030 Start going downward with triple combination tool string: TAP/DIT-E/HLDT/APS/HNGS/SGT8 1040 0 Stop 5 min at mudline for temperature calibration8 1105 80 Tool string in open hole8 1115 187 Tool at TD; start logging upward at 900 ft/hr8 1130 Pipe raised by 10 m8 1142 70 Tool back inside pipe; speed up to 1500 ft/hr to log mudline8 1150 0 Mudline indicated by gamma ray at 164 m below rig floor8 1152 –19 End of pass 1; standing 5 min and start going back downward8 1200 70 Tool string in open hole8 1212 201 Tool at TD; start logging upward pass 2 at 900 ft/hr8 1240 70 Tool back inside pipe 8 1242 47 End of pass 2; speed up to 8000 ft/hr8 1310 Tool back on rig floor8 1430 Finish rig-down