Page 1
.
https://cikguamirul.wordpress.com/electrical-engineering-mathematics/ 1
1.2 Measure of Central Tendency and Dispersion1.0 STATISTICS AND PROBABILITY
1.2.1 Calculate mean, median and mode for ungrouped data
1.2.2 Calculate mean, median and mode for grouped data by using formula
1.2.3 Calculate median and mode for grouped data by using graph
1.2.5 Calculate quartiles, deciles and percentiles for grouped data by
using formula and graph
1.2.4 Calculate mean deviation, variance, standard deviation for ungrouped
and grouped data
1
2
Page 2
.
https://cikguamirul.wordpress.com/electrical-engineering-mathematics/ 2
1.2.1 Calculate mean, median and mode for ungrouped data
MEAN, MEDIAN AND MODE FOR UNGROUPED DATA
Mean : The mean defined as the sum of all values in the set of data divided by the
number of values.
Mean, where: σ𝑥 = sum of all the data
N = number of values in the set of data
If a set of data is presented in the form of a frequency distribution table
(either grouped or ungrouped data), then the mean of the set of data is
defined as below.
σ𝑓𝑥 = sum of the value of frequency ×midpointwhere:
σ𝑓 = sum of frequency
3
4
Page 3
.
https://cikguamirul.wordpress.com/electrical-engineering-mathematics/ 3
Example 1:
1. Find the mean of the following data:
76 74 65 58 68 73
Example 2:
Solution:
x 1 2 3 4 5
f 20 43 20 15 12 ∑f = 110
fx 20 86 60 60 60 ∑fx = 286
5
6
Page 4
.
https://cikguamirul.wordpress.com/electrical-engineering-mathematics/ 4
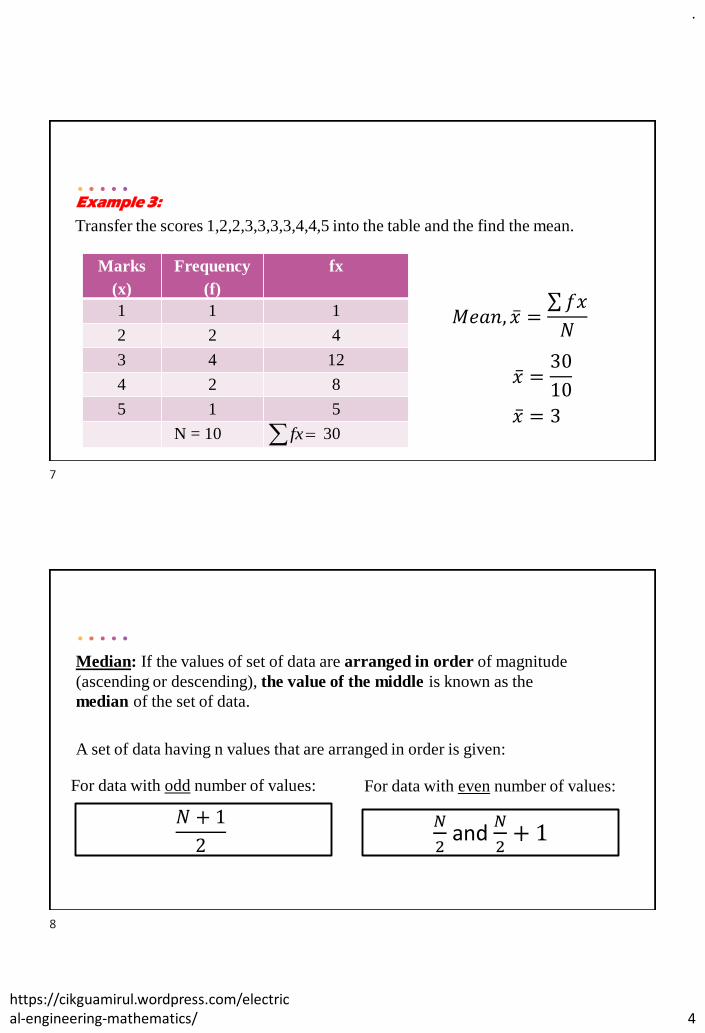
Transfer the scores 1,2,2,3,3,3,3,4,4,5 into the table and the find the mean.
Example 3:
Marks
(x)
Frequency
(f)
fx
1 1 1
2 2 4
3 4 12
4 2 8
5 1 5
N = 10 30 =fx
𝑀𝑒𝑎𝑛, ҧ𝑥 =σ 𝑓𝑥
𝑁
ҧ𝑥 =30
10
ҧ𝑥 = 3
Median: If the values of set of data are arranged in order of magnitude
(ascending or descending), the value of the middle is known as the
median of the set of data.
A set of data having n values that are arranged in order is given:
For data with odd number of values: For data with even number of values:
𝑁
2and
𝑁
2+ 1
𝑁 + 1
2
7
8
Page 5
.
https://cikguamirul.wordpress.com/electrical-engineering-mathematics/ 5
Example 4:
Determine the median of each of the following sets of data.
Solution:
Example 5:
Determine the median of each of the following sets of data.
Solution:
𝑁
2=
8
2= 4𝑡ℎ and
8
2+ 1 = 5th
9
10
Page 6
.
https://cikguamirul.wordpress.com/electrical-engineering-mathematics/ 6
Example 6:
Determine the median of each of the following sets of data.
Solution:
Total number of values = 25
Mode: The mode of a set of data is,
the value that has the highest frequency
the value that appears the most number
of times in the set of data
the most commonly occurring value in a
set of data
11
12
Page 7
.
https://cikguamirul.wordpress.com/electrical-engineering-mathematics/ 7
Example 7:
Determine the mode of each of the following sets of data.
Tutorial 1.2.1 :
1. Find the mode, median and mean for the data given :
a) 5, 7, 4, 8, 2, 5, 9
b) 2, 3, 1, 2, 6, 8, 9, 3, 2, 3
c)
d)
13
14
Page 8
.
https://cikguamirul.wordpress.com/electrical-engineering-mathematics/ 8
1.2.2 Calculate mean, median and mode for grouped data by using formula
Mean of grouped data
To find the mean of the data, we should use the following formula:
σ𝑓𝑥 = sum of the value of frequency ×midpointwhere:
σ𝑓 = sum of frequency
Example 8: Find the mean of mark of the student.
Mark Frequency (f)1 – 20 2
21 – 40 4
41 – 60 12
61 – 80 38
81 – 100 25
101 – 120 11
121 - 140 8
15
16
Page 9
.
https://cikguamirul.wordpress.com/electrical-engineering-mathematics/ 9
Solution :
Mark f x fx
1 – 20 2 10.5 21
21 – 40 4 30.5 122
41 – 60 12 50.5 606
61 – 80 38 70.5 2679
81 – 100 25 90.5 2262.5
101 – 120 11 110.5 1215.5
121 - 140 8 130.5 1044
∑f =100 ∑fx= 7950
Using Formula,
𝑀𝑒𝑑𝑖𝑎𝑛,𝑚 = 𝐿𝑚 +
𝑁2− 𝐹
𝑓𝑚𝐶
17
18
Page 10
.
https://cikguamirul.wordpress.com/electrical-engineering-mathematics/ 10
Example 9: Find the median mark of the student.
Mark Frequency (f)25 – 35 5
36 – 46 8
47 – 57 14
58 – 68 11
69 – 79 7
80 – 90 5
Solution :
Mark f F
25 – 35 5 5
36 – 46 8 13
47 – 57 14 27
58 – 68 11 38
69 – 79 7 45
80 – 90 5 50
Determine the class which median lies:
19
20
Page 11
.
https://cikguamirul.wordpress.com/electrical-engineering-mathematics/ 11
Therefore, median of the mark,
Mode of grouped data
where :
𝑴𝒐𝒅𝒆, 𝐿𝑚𝑜 +𝑑1
𝑑1 + 𝑑2𝐶
𝐿𝑚𝑜 = Lower boundary of the class in which the mode lies𝑑1 = Difference between the frequency of the mode class and the class before it𝑑2 = Difference between the frequency of the mode class and the class after it𝐶 = 𝐶𝑙𝑎𝑠𝑠 𝑠𝑖𝑧𝑒
21
22
Page 12
.
https://cikguamirul.wordpress.com/electrical-engineering-mathematics/ 12
Mark Frequency (f)25 – 35 536 – 46 847 – 57 1458 – 68 1169 – 79 780 – 90 5
Example 10: Find the mode mark of the student.
Solution :
Determine the modal class: 47-57 → modal class (has the highest frequency)
23
24
Page 13
.
https://cikguamirul.wordpress.com/electrical-engineering-mathematics/ 13
Find the mean, median, and mode of the following grouped data.
Example 11 :
Marks Frequency (f)
10 – 14 2
15 – 19 3
20 – 24 8
25 – 29 5
30 - 34 2
Solution :
Marks f F xClass
boundariesfx
10 – 14 2 2 12 9.5 – 14.5 24
15 – 19 3 5 17 14.5 – 19.5 51
20 – 24 8 13 22 19.5 – 24.5 176
25 – 29 5 18 27 24.5 – 29.5 135
30 - 34 2 20 32 29.5 – 34.5 64σ𝑓 =20 σ𝑓𝑥 =450
25
26
Page 14
.
https://cikguamirul.wordpress.com/electrical-engineering-mathematics/ 14
𝑀𝑒𝑎𝑛, ҧ𝑥 =σ𝑓𝑥
σ𝑓=450
20= 22.5
𝑀𝑒𝑑𝑖𝑎𝑛,𝑚 = 𝐿𝑚 +
𝑁2− 𝐹
𝑓𝑚𝐶 = 19.5 +
202− 5
85 = 22.63
𝑀𝑜𝑑𝑒 = 𝐿 +𝑑1
𝑑1+ 𝑑2𝐶 = 19.5 +
5
5 + 35 = 22.63
1.2.3 Calculate median and mode for grouped data by using graph
Calculate median by using an ogive
Where N is the total frequency of the distribution.
27
28
Page 15
.
https://cikguamirul.wordpress.com/electrical-engineering-mathematics/ 15
Example 12:
Find the median for the data below by using formula and an ogive.
Marks Frequency Cumulative
Frequency
20-29 2 2
30-39 4 6
40-49 8 14
50-59 12 26
60-69 6 32
70-79 4 36
Solution:
Marks Frequency Cumulative Frequency Upper boundary
10-19 0 0 19.5
20-29 2 2 29.5
30-39 4 6 39.5
40-49 8 14 49.5
50-59 12 26 59.5
60-69 6 32 69.5
70-79 4 36 79.5
29
30
Page 16
.
https://cikguamirul.wordpress.com/electrical-engineering-mathematics/ 16
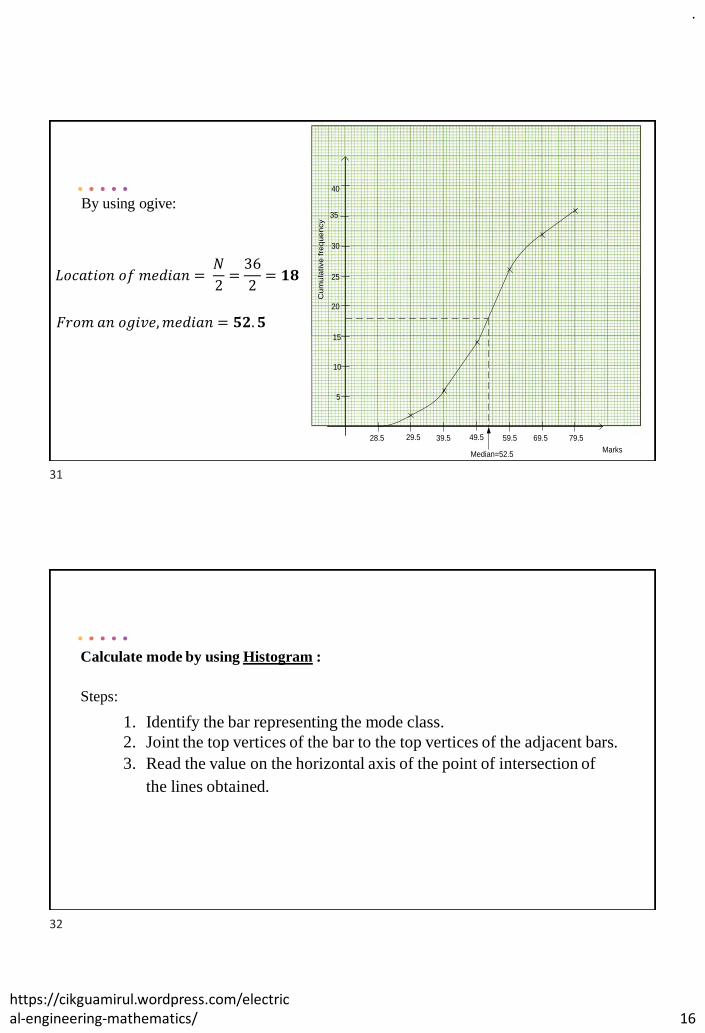
By using ogive:
5
30
25
20
15
10
28.5 29.5 39.5 49.5 59.5 69.5
Marks
Cu
mu
lative
fre
qu
en
cy
79.5
35
40
Median=52.5
𝐿𝑜𝑐𝑎𝑡𝑖𝑜𝑛 𝑜𝑓 𝑚𝑒𝑑𝑖𝑎𝑛 =𝑁
2=36
2= 𝟏𝟖
𝐹𝑟𝑜𝑚 𝑎𝑛 𝑜𝑔𝑖𝑣𝑒,𝑚𝑒𝑑𝑖𝑎𝑛 = 𝟓𝟐.𝟓
Calculate mode by using Histogram :
Steps:
1. Identify the bar representing the mode class.
2. Joint the top vertices of the bar to the top vertices of the adjacent bars.
3. Read the value on the horizontal axis of the point of intersection of
the lines obtained.
31
32
Page 17
.
https://cikguamirul.wordpress.com/electrical-engineering-mathematics/ 17
Example 13:
The data below shows test marks of a group of students. Find the Mode for
the data below by using formula and histogram.
Test
Marks
No. of
students
50 – 59 4
60 – 69 8
70 – 79 18
80 – 89 16
90 – 99 2
33
34
Page 18
.
https://cikguamirul.wordpress.com/electrical-engineering-mathematics/ 18
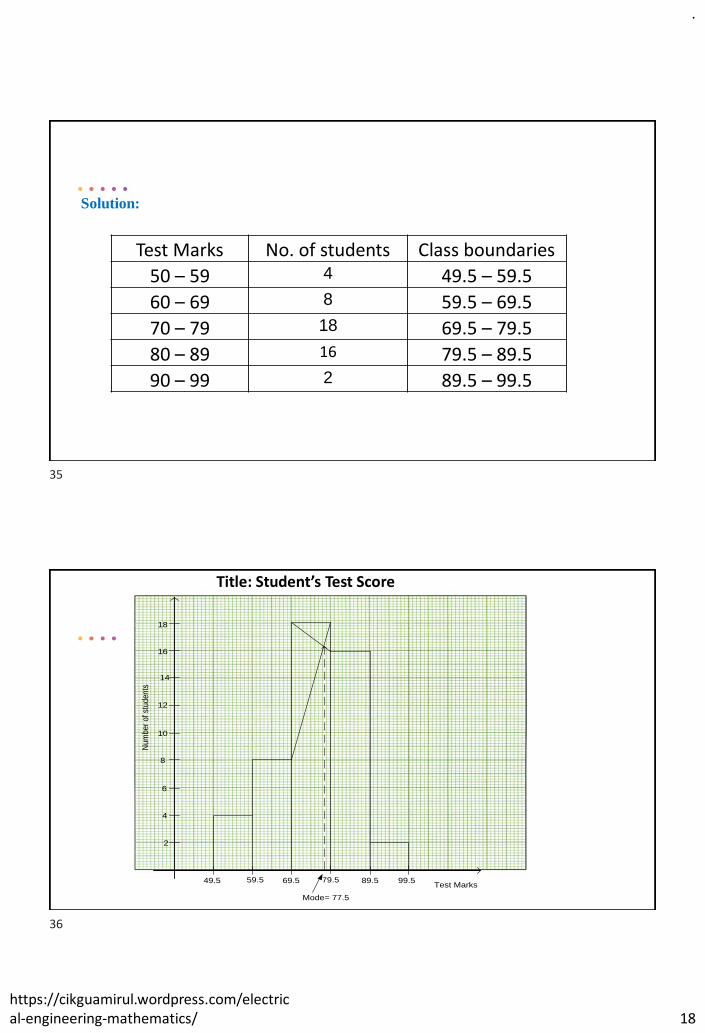
Solution:
Test Marks No. of students Class boundaries
50 – 59 4 49.5 – 59.5
60 – 69 8 59.5 – 69.5
70 – 79 18 69.5 – 79.5
80 – 89 16 79.5 – 89.5
90 – 99 2 89.5 – 99.5
Title: Student’s Test Score
2
18
16
14
12
10
8
6
4
49.5 59.5 69.5 79.5 89.5 99.5Test Marks
Nu
mb
er
of st
ud
en
ts
Mode= 77.5
35
36
Page 19
.
https://cikguamirul.wordpress.com/electrical-engineering-mathematics/ 19
TUTORIAL EXERCISE 1.
1.2.4 Calculate mean deviation, variance, standard deviation for
ungrouped and grouped data
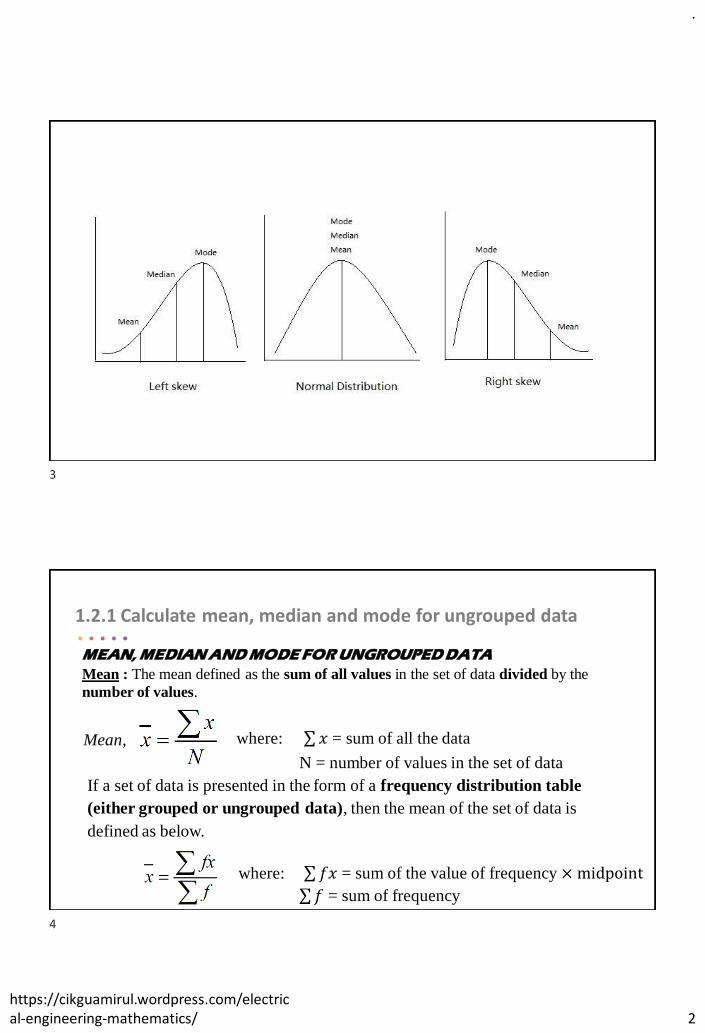
Data can be "distributed" (spread out) in different ways.
37
38
Page 20
.
https://cikguamirul.wordpress.com/electrical-engineering-mathematics/ 20
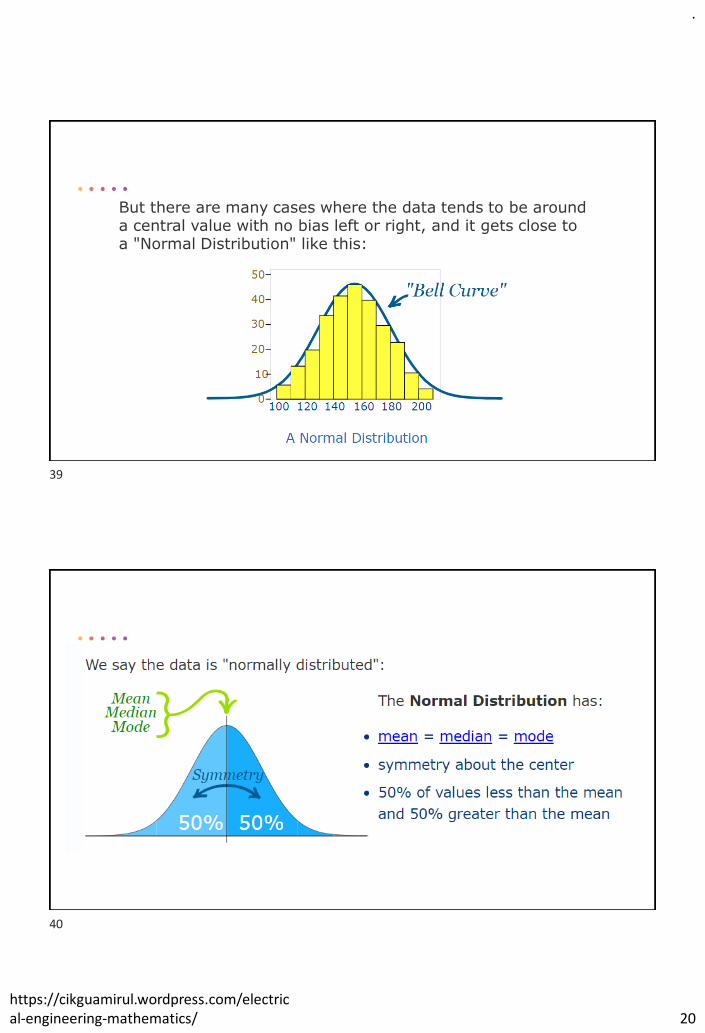
But there are many cases where the data tends to be around a central value with no bias left or right, and it gets close to a "Normal Distribution" like this:
39
40
Page 21
.
https://cikguamirul.wordpress.com/electrical-engineering-mathematics/ 21
The Standard Deviation is a measure of how spread out numbers
are.
Example: 95% of students at school are between 1.1m and 1.7m tall.
Assuming this data is normally distributed can you calculate the mean and standard deviation?
The mean is halfway between 1.1m and 1.7m:
Mean = (1.1m + 1.7m) / 2 = 1.4m
95% is 2 standard deviations either side of the mean (a total of 4 standard deviations) so:
1 standard deviation = (1.7m-1.1m) / 4
= 0.6m / 4 = 0.15m
41
42
Page 22
.
https://cikguamirul.wordpress.com/electrical-engineering-mathematics/ 22
And this is the result:
43
44
Page 23
.
https://cikguamirul.wordpress.com/electrical-engineering-mathematics/ 23
1.2.4 Calculate mean deviation, variance, standard deviation for
ungrouped and grouped data
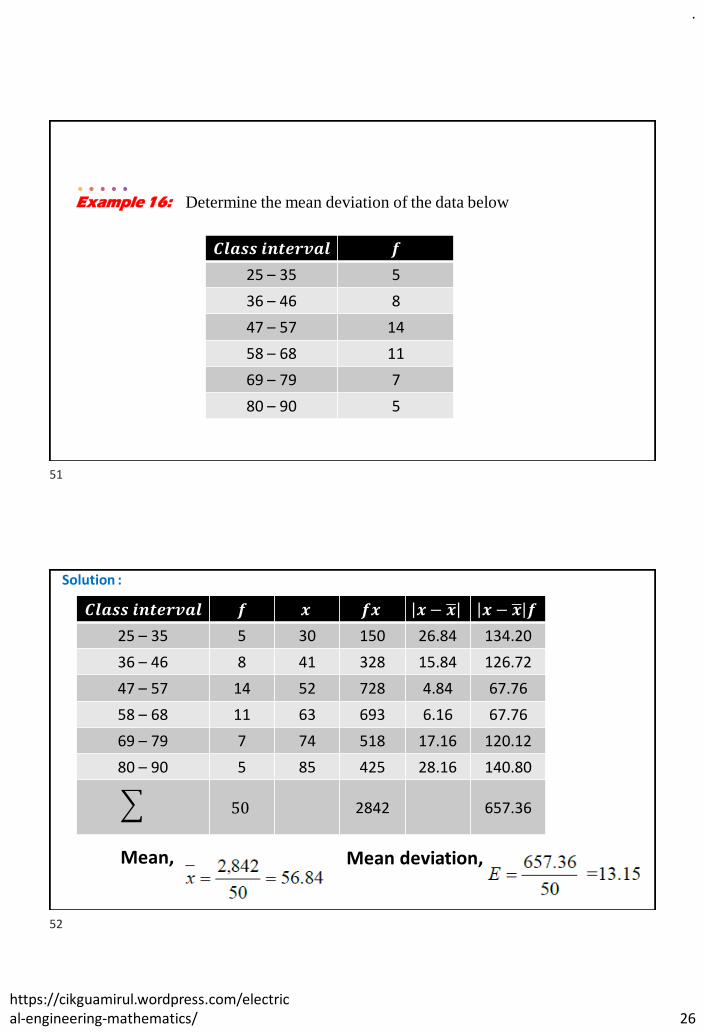
Mean deviation of ungrouped data
Example 14:
Determine mean deviation from the data below:
Solution :
45
46
Page 24
.
https://cikguamirul.wordpress.com/electrical-engineering-mathematics/ 24
Mean deviation, 𝑥 𝒙 − ഥ𝒙
23 2.5
20 0.5
15 5.5
17 3.5
18 2.5
30 9.5
σ 𝒙 − ഥ𝒙 =24
Example 15:
Determine mean deviation from the data below:
47
48
Page 25
.
https://cikguamirul.wordpress.com/electrical-engineering-mathematics/ 25
𝑥 𝒇 𝒇𝑥 𝒙 − ഥ𝒙 𝒙 − ഥ𝒙 𝒇
3 8 24 1.78 14.24
4 3 12 0.78 2.34
5 7 35 0.22 1.54
6 5 30 1.22 6.10
7 4 28 2.22 8.88
𝒇 = 𝟐𝟕 𝒇𝒙 = 𝟏𝟐𝟗 σ 𝒙 − ഥ𝒙 𝒇 =33.10
Solution :
Mean, Mean deviation,
Mean Deviation of grouped data
49
50
Page 26
.
https://cikguamirul.wordpress.com/electrical-engineering-mathematics/ 26
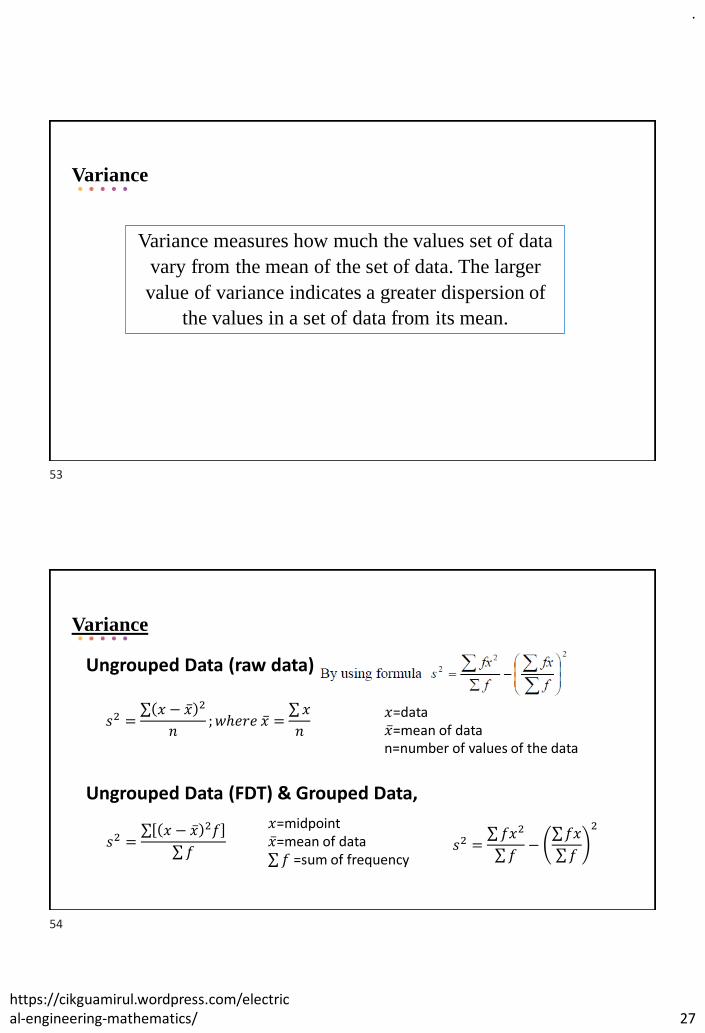
Example 16: Determine the mean deviation of the data below
𝑪𝒍𝒂𝒔𝒔 𝒊𝒏𝒕𝒆𝒓𝒗𝒂𝒍 𝒇
25 – 35 5
36 – 46 8
47 – 57 14
58 – 68 11
69 – 79 7
80 – 90 5
𝑪𝒍𝒂𝒔𝒔 𝒊𝒏𝒕𝒆𝒓𝒗𝒂𝒍 𝒇 𝒙 𝒇𝒙 𝒙− ഥ𝒙 𝒙 − ഥ𝒙 𝒇
25 – 35 5 30 150 26.84 134.20
36 – 46 8 41 328 15.84 126.72
47 – 57 14 52 728 4.84 67.76
58 – 68 11 63 693 6.16 67.76
69 – 79 7 74 518 17.16 120.12
80 – 90 5 85 425 28.16 140.80
50 2842 657.36
Solution :
Mean, Mean deviation,
51
52
Page 27
.
https://cikguamirul.wordpress.com/electrical-engineering-mathematics/ 27
Variance
Variance measures how much the values set of data
vary from the mean of the set of data. The larger
value of variance indicates a greater dispersion of
the values in a set of data from its mean.
Variance
Ungrouped Data (raw data),
Ungrouped Data (FDT) & Grouped Data,
𝑠2 =σ 𝑥 − ҧ𝑥 2
𝑛;𝑤ℎ𝑒𝑟𝑒 ҧ𝑥 =
σ𝑥
𝑛𝑥=dataҧ𝑥=mean of data
n=number of values of the data
𝑠2 =σ 𝑥 − ҧ𝑥 2𝑓
σ𝑓
𝑥=midpointҧ𝑥=mean of dataσ𝑓 =sum of frequency
𝑠2 =σ𝑓𝑥2
σ𝑓−
σ𝑓𝑥
σ𝑓
2
53
54
Page 28
.
https://cikguamirul.wordpress.com/electrical-engineering-mathematics/ 28
Standard Deviation
Standard deviation is also a measure which tells us
how much values in a set of data disperse from the
mean of the set of data.
@ 𝑠 = 𝑠2
Example 17:
Determine the variance and standard deviation of each of the following
3 5 8 2 4 11 and 9
Solution :
55
56
Page 29
.
https://cikguamirul.wordpress.com/electrical-engineering-mathematics/ 29
𝑠2 =σ 𝑥 − ҧ𝑥 2
𝑛
=68
7
= 9.71
𝑠 = 𝑠2
= 9.71
= 3.12
𝑥 𝑥 − ҧ𝑥 𝑥 − ҧ𝑥 2
3 3 9
5 1 1
8 2 4
2 4 16
4 2 4
11 5 25
9 3 9
68
Example 18:
Determine the variance and standard deviation of each of the following
Solution :ҧ𝑥 =
σ𝑥
𝑛
=0𝑥3 + 1𝑥4 + 2𝑥6 + 3𝑥5 + (4𝑥2)
3 + 4 + 6 + 5 + 2
=39
20
= 1.95
57
58
Page 30
.
https://cikguamirul.wordpress.com/electrical-engineering-mathematics/ 30
𝑥 𝑓 𝑓𝑥 𝑥 − ҧ𝑥 2 𝑥 − ҧ𝑥 2𝑓
0 3 0 3.80 11.4
1 4 4 0.90 4.9
2 6 12 0.0025 0.015
3 5 15 1.10 5.5
4 2 8 4.20 8.4
20 39 30.22
=30.22
20
=1.511
𝑠 = 𝑠2
= 1.511
=1.23
𝑠2 =σ 𝑥 − ҧ𝑥 2𝑓
σ𝑓
Example 19: Determine the variance and standard deviation of :
Class interval f
25 - 35 536 - 46 847 - 57 1458 - 68 1169 - 79 780 - 90 5
59
60
Page 31
.
https://cikguamirul.wordpress.com/electrical-engineering-mathematics/ 31
Solution :𝑪𝒍𝒂𝒔𝒔 𝒊𝒏𝒕𝒆𝒓𝒗𝒂𝒍 𝒇 𝒙 𝒇𝒙 𝑥 − ҧ𝑥 𝑥 − ҧ𝑥 2𝒇
25 – 35 5 30 150 26.84 3601.93
36 – 46 8 41 328 15.84 2007.24
47 – 57 14 52 728 4.84 327.96
58 – 68 11 63 693 6.16 417.40
69 – 79 7 74 518 17.16 2061.26
80 – 90 5 85 425 28.16 3964.93
50 2842 12,380.72
𝑠2 =σ 𝑥 − ҧ𝑥 2𝑓
σ𝑓
Variance, Standard deviation,
𝑠 = 𝑠2 = 247.61 = 𝟏𝟓.𝟕𝟒=12380.72
50= 𝟐𝟒𝟕.𝟔𝟏
Solution :𝑪𝒍𝒂𝒔𝒔 𝒊𝒏𝒕𝒆𝒓𝒗𝒂𝒍 𝒇 𝒙 𝒇𝒙 𝒙𝟐 𝒇𝒙𝟐
25 – 35 5 30 150 900 4500
36 – 46 8 41 328 1681 13448
47 – 57 14 52 728 2704 37856
58 – 68 11 63 693 3969 43659
69 – 79 7 74 518 5476 38332
80 – 90 5 85 425 7225 36125
50 2842 173920
Variance, Standard deviation,
𝑠 = 𝑠2 = 247.61 = 𝟏𝟓.𝟕𝟒=173920
50−
2842
50
2
= 𝟐𝟒𝟕.𝟔𝟏
𝑠2 =σ𝑓𝑥2
σ𝑓−
σ𝑓𝑥
σ𝑓
2
OR
61
62
Page 32
.
https://cikguamirul.wordpress.com/electrical-engineering-mathematics/ 32
TUTORIAL EXERCISE:
TUTORIAL EXERCISE 2
63
64
Page 33
.
https://cikguamirul.wordpress.com/electrical-engineering-mathematics/ 33
1.2.5 Calculate quartiles, deciles and percentiles for grouped
data by using formula and graph
Quartile: Divide a set of data into
four equal parts with all the data
arranged in ascending or
descending order.
Q1 = first quartile
Q2 = second quartile = median
Q3 = third quartile
Interquartile range = Q3 - Q1
𝑪 =class size
𝑸𝒌 = 𝑳𝑸𝒌 +
𝒌𝑵4 − 𝑭
𝒇𝑸𝒌𝑪; 𝒌 = 1, 2, 3
𝑳𝑸𝒌 = lower boundary of the class in which the first quartile lies
𝑵 =sum of frequency
𝑭 =cumulative frequency before the class in which first quartile lies
𝒇𝑸𝒌 =frequency of the class in which the first quartile lies
Calculate quartiles, deciles and percentiles for grouped
data by using formula
65
66
Page 34
.
https://cikguamirul.wordpress.com/electrical-engineering-mathematics/ 34
Quartile of ungrouped data
Find first quartile, third quartile and interquartile range for data below:
Example 20:
Example 21:
67
68
Page 35
.
https://cikguamirul.wordpress.com/electrical-engineering-mathematics/ 35
Decile: Any one of the numbers or values in a series dividing the distribution
of the individuals in the series into ten groups of.
𝑫𝒌 = 𝑳𝑫𝒌+
𝒌𝑵10
− 𝑭
𝒇𝑫𝒌
𝑪; 𝒌 = 1, 2, 3,… 9
𝑪 = class size
𝑳𝑫𝒌= lower boundary of the class in which the decile lies
𝑵 = sum of frequency
𝑭 = cumulative frequency before the class in which decile lies
𝒇𝑫𝒌= frequency of the class in which the decile lies
Calculate quartiles, deciles and percentiles for grouped
data by using formula
Percentile: Any one of the numbers or values in a series dividing the distribution
of the individuals in the series into hundred groups of.
𝑷𝒌 = 𝑳𝑷𝒌 +
𝒌𝑵100
− 𝑭
𝒇𝑷𝒌𝑪; 𝒌 = 1, 2, 3,… 99
𝑳𝑷𝒌 = lower boundary of the class in which the percentile lies
𝑵 = sum of frequency
𝑭 = cumulative frequency before the class in which percentile lies
𝒇𝑷𝒌 = frequency of the class in which the percentile lies
𝑪 = class size
Calculate quartiles, deciles and percentiles for grouped
data by using formula
69
70
Page 36
.
https://cikguamirul.wordpress.com/electrical-engineering-mathematics/ 36
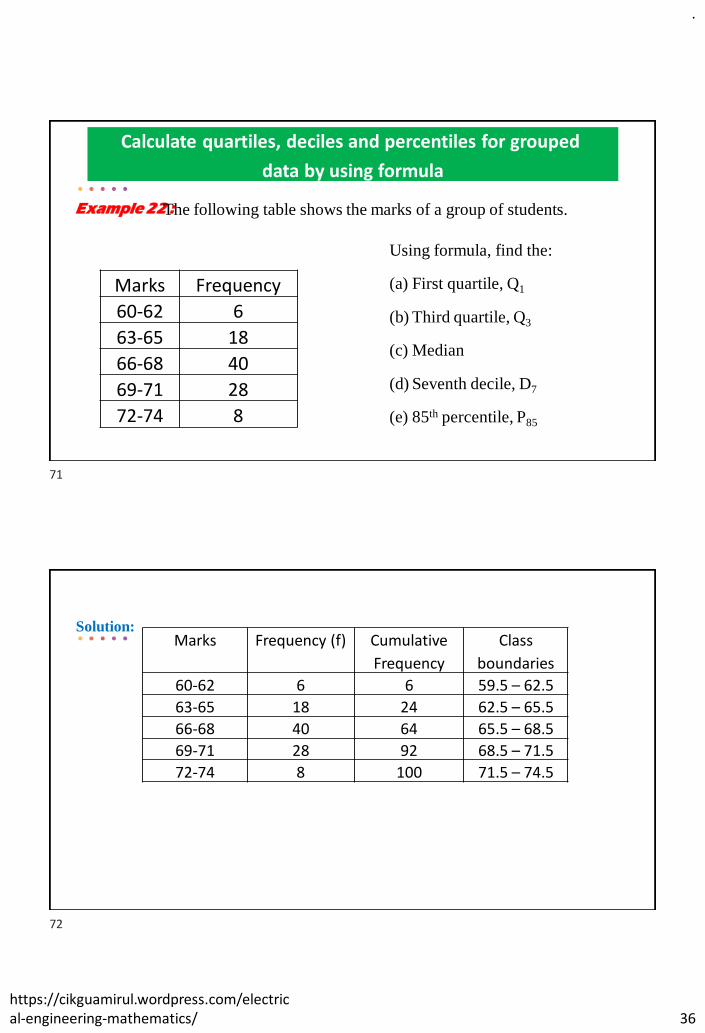
Example 22 :The following table shows the marks of a group of students.
Marks Frequency
60-62 6
63-65 18
66-68 40
69-71 28
72-74 8
Using formula, find the:
(a) First quartile, Q1
(b) Third quartile, Q3
(c) Median
(d) Seventh decile, D7
(e) 85th percentile, P85
Calculate quartiles, deciles and percentiles for grouped
data by using formula
Solution:Marks Frequency (f) Cumulative
Frequency
Class
boundaries
60-62 6 6 59.5 – 62.5
63-65 18 24 62.5 – 65.5
66-68 40 64 65.5 – 68.5
69-71 28 92 68.5 – 71.5
72-74 8 100 71.5 – 74.5
71
72
Page 37
.
https://cikguamirul.wordpress.com/electrical-engineering-mathematics/ 37
(a) First quartile, Q1
𝑄1 = 𝐿𝑄1 +
𝑁4− 𝐹
𝑓𝑄1𝐶
= 65.5 +
1004
− 24
403
= 𝟔𝟓.𝟓𝟖
(b) Third quartile, Q3
𝑄3 = 𝐿𝑄3 +
3𝑁4− 𝐹
𝑓𝑄3𝐶
= 68.5 +
3)(1004 − 64
283
= 𝟔𝟗.𝟔𝟖
= 𝟔𝟕.𝟒𝟓
(c) Median
𝑄2 = 𝐿𝑄2 +
2𝑁4 − 𝐹
𝑓𝑄2𝐶
= 65.5 +
(2)(100)4 − 24
403
= 𝟔𝟑.𝟏𝟕
(d) First decile, D1
𝐷1 = 𝐿𝐷1 +
1𝑁10 − 𝐹
𝑓𝐷1𝐶
= 62.5 +
1(100)10 − 6
183
73
74
Page 38
.
https://cikguamirul.wordpress.com/electrical-engineering-mathematics/ 38
= 𝟕𝟐.𝟔𝟑
(e) 95th percentile, P95
𝑃95 = 𝐿𝑃𝑘 +
𝑘𝑁100
− 𝐹
𝑓𝑃𝑘𝐶
= 71.5 +
95(100)100 − 92
83
Example 23: The following table shows the marks of a group of students.
Marks Frequency
60-62 6
63-65 18
66-68 40
69-71 28
72-74 8
Draw an ogive and find the:
(a) First quartile, Q1
(b) Third quartile, Q3
(c) Seventh decile, D1
(d) 95th percentile, P95
Calculate quartiles, deciles and percentiles for grouped
data by using graph
75
76
Page 39
.
https://cikguamirul.wordpress.com/electrical-engineering-mathematics/ 39
𝑛 Quartile = the 𝑛
4𝑡ℎ value of the cumulative frequency, where 𝑘 = 1, 2, 3
By using an ogive,
Interquartile range= 3𝑟𝑑 𝑄𝑢𝑎𝑟𝑡𝑖𝑙𝑒 − 1𝑠𝑡 𝑄𝑢𝑎𝑟𝑡𝑖𝑙𝑒
Decile = 𝑘
10𝑡ℎ value of the cumulative frequency, where, 𝑘 = 1, 2, 3,… 9
Percentile = 𝑘
100𝑡ℎ value of the cumulative frequency, where, 𝑘 = 1, 2, 3, …99
Solution:
Marks Frequency (f) Cumulative
Frequency
Class
boundaries
57-59 0 0 56.5 – 59.5
60-62 6 6 59.5 – 62.5
63-65 18 24 62.5 – 65.5
66-68 40 64 65.5 – 68.5
69-71 28 92 68.5 – 71.5
72-74 8 100 71.5 – 74.5
77
78
Page 40
.
https://cikguamirul.wordpress.com/electrical-engineering-mathematics/ 40
(d) Location on the y-axis:1
10× 100 = 10;
From the graph, 𝐷1 =63.4
(b) Location on the y-axis:3
4× 100 = 75;
From the graph, 𝑄3 =69.5
D1=63.4Q3=69.5 P95=72.1
Median=67.3
Q1=65.5
(a) Location on the y-axis: 1
4× 100 = 25;
From the graph, 𝑄1 =65.5
(c) Location on the y-axis:1
2× 100 = 50;
From the graph, 𝑄2=67.3
(d) Location on the y-axis: 95
100× 100 = 95;
From the graph, 𝑃95 =72.1
TUTORIAL EXERCISE 3.1:
12 10 22 23 25 41 41 20 90 25
65 13 89 47 33 52 47 65 66 32
55 13 88 37 81 53 50 64 71 90
45 90 19 57 73 53 11 30 72 44
34 87 17 67 80 11 14 15 70 40
i. Based on the data above, draw a “less than” ogive graph, using 5-14 as a first class
ii. Then, determine the first quartile, 7th decile, and median from the given data.
79
80
Page 41
.
https://cikguamirul.wordpress.com/electrical-engineering-mathematics/ 41
TUTORIAL EXERCISE 3.2:
81