18
10/20/2015 Rocky Mountain West Pavement Preservation Partnership Meeting October 19-21, 2015
| Date post: | 01-Jul-2018 |
| Category: |
Documents |
| Upload: | dinhnguyet |
| View: | 217 times |
| Download: | 0 times |
10/20/2015 Rocky Mountain West Pavement Preservation Partnership Meeting October 19-21, 2015

Overview
• Background • MTC’s Data Quality
Management Plan • Performance
Measures
2

Why is it Important?
MAP-21 Requirements Focus on:
• Performance • Accountability • Transparency
5/20/2015 9th International Conference on Managing Pavement Assets | May 18-21, 2015 3

Background
4
Pavement Technical
Assistance Program
Data Quality
Mgt Plan
StreetSaver PMS
Regional Transport.
Plan

Goals of DQM
(1) Provide consistent pavement distress identification
(2) Improve data quality (3) Provide industry standards and
accountability (4) Meet the minimum qualifications
required for responding to RFP
5

Garbage In – Garbage Out
6

Data Quality Management Plan
1. Consultant prequalification 2. Quality control plan - before,
during, and after production 3. Quality acceptance 4. Rater Certification Program
7
Source: http://tinyurl.com/mm39ptx

Consultant Prequalification
5/20/2015 9th International Conference on Managing Pavement Assets | May 18-21, 2015 8

Key Performance Indicators
Keys Questions on Asset Management Plan: • Existing condition? • Maintenance $ currently invested? • Maintenance $ for SGR? • Effectiveness of pavement preservation?
9

Level of Performance Metrics
10

Guiding Principles
• Measurable • As objective as possible • Can be fairly applied • Utilize data widely available • Meaningful (e.g. promotes pavement
preservation)
11
12
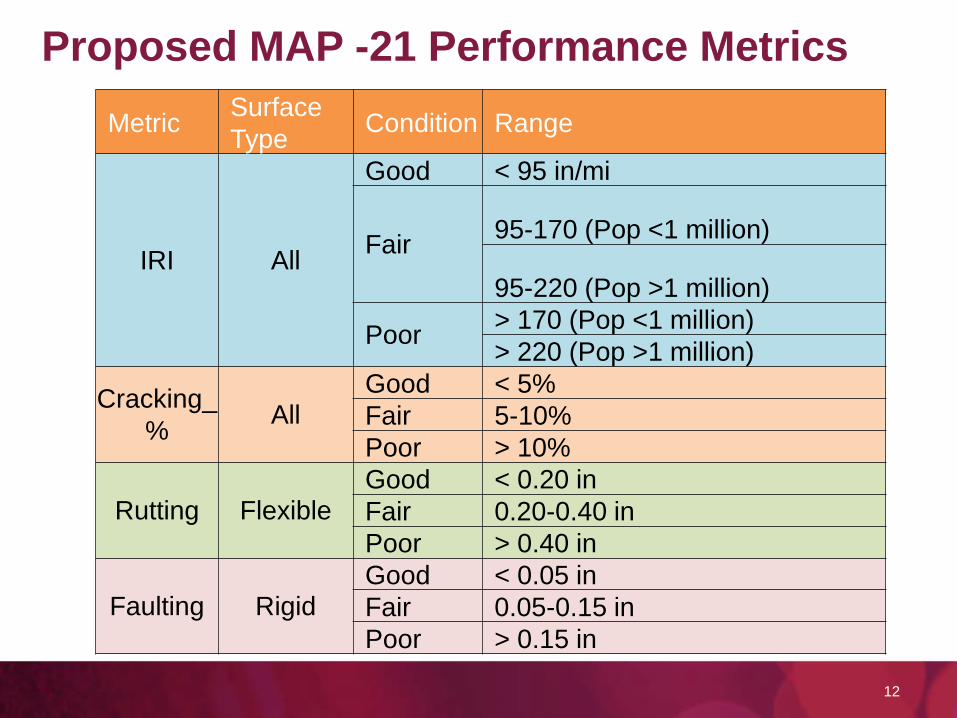
Metric Surface Type Condition Range
IRI All
Good < 95 in/mi
Fair 95-170 (Pop <1 million)
95-220 (Pop >1 million)
Poor > 170 (Pop <1 million) > 220 (Pop >1 million)
Cracking_% All
Good < 5% Fair 5-10% Poor > 10%
Rutting Flexible Good < 0.20 in Fair 0.20-0.40 in Poor > 0.40 in
Faulting Rigid Good < 0.05 in Fair 0.05-0.15 in Poor > 0.15 in
Proposed MAP -21 Performance Metrics

KPI:
13
% Poor or Failed; % of Very Good or Better Network PCI, 3-yr Moving Avg PCI
Current Level of Service
2012 PCI 3-yr Moving
Average
County Jurisdiction
Total Lane Miles
Total CL Miles
% Poor or
Failed
% Very Good
or Better Art Coll Res NET 2010 2011 2012
Regional Benchmarks (weighted)
42,788
20,634 24% 31% 73 66 63 66 66 66 66
ALA ALAMEDA 303.9 137.8 22% 29% 70 72 62 66 66 67 68 ALAMEDA CO. 990.3 471.8 9% 16% 71 73 71 71 72 73 71 ALBANY 59.1 29.4 36% 20% 64 60 54 58 60 58 57 BERKELEY 452.8 216.2 38% 28% 70 50 58 58 60 59 59 DUBLIN 254.0 116.0 0% 84% 88 85 88 87 82 84 86 EMERYVILLE 47.1 19.8 5% 51% 77 75 70 75 77 78 78 FREMONT 1064.9 496.9 30% 31% 73 61 57 63 64 63 63

KPI:
5/20/2015 9th International Conference on Managing Pavement Assets | May 18-21, 2015 14
Sustainability Index = Actual M&R
Annualized 10-Year Needs
14
County Jurisdiction Network PCI
Actual M&R /Lane
Mile Needs/
Lane Mile Sustainability
Index
Regional Benchmarks 66 $10,400 $27,000 39%
Alameda ALAMEDA 66 $9,800 $26,900 36%
ALAMEDA COUNTY
71 $3,600 $16,200 22%
ALBANY 58 $12,700 $29,800 43% BERKELEY 58 $11,600 $32,400 36% DUBLIN 87 $6,300 $5,600 113% EMERYVILLE 75 $0 $16,100 0% FREMONT 63 $11,900 $29,100 41% HAYWARD 69 $14,000 $22,600 62% LIVERMORE 76 $5,800 $15,000 39%
KPI:
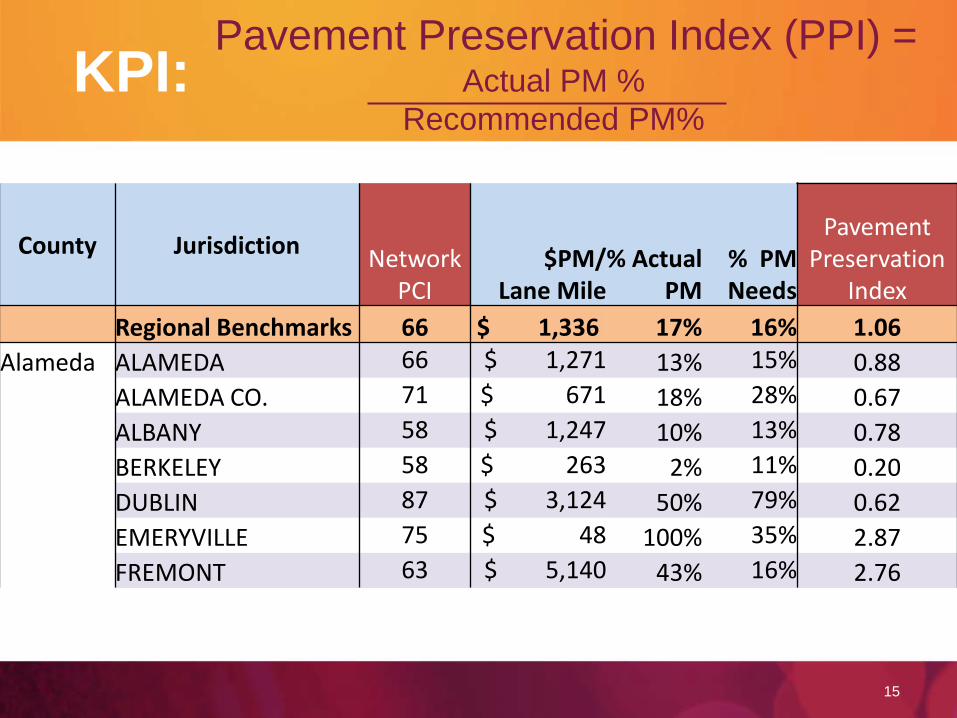
15
Pavement Preservation Index (PPI) = Actual PM %
Recommended PM%
County Jurisdiction Network PCI
$PM/ Lane Mile
% Actual PM
% PM Needs
Pavement Preservation
Index Regional Benchmarks 66 $ 1,336 17% 16% 1.06 Alameda ALAMEDA 66 $ 1,271 13% 15% 0.88 ALAMEDA CO. 71 $ 671 18% 28% 0.67 ALBANY 58 $ 1,247 10% 13% 0.78 BERKELEY 58 $ 263 2% 11% 0.20 DUBLIN 87 $ 3,124 50% 79% 0.62 EMERYVILLE 75 $ 48 100% 35% 2.87 FREMONT 63 $ 5,140 43% 16% 2.76 15
County Jurisdiction Network PCI
$PM/ Lane Mile
% Actual PM
% PM Needs
Pavement Preservation
Index Regional Benchmarks 66 $ 1,336 17% 16% 1.06 Alameda ALAMEDA 66 $ 1,271 13% 15% 0.88 ALAMEDA CO. 71 $ 671 18% 28% 0.67 ALBANY 58 $ 1,247 10% 13% 0.78 BERKELEY 58 $ 263 2% 11% 0.20 DUBLIN 87 $ 3,124 50% 79% 0.62 EMERYVILLE 75 $ 48 100% 35% 2.87 FREMONT 63 $ 5,140 43% 16% 2.76

Just Remember…
5/20/2015 9th International Conference on Managing Pavement Assets | May 18-21, 2015 16
If it wasn’t documented, it didn’t happen!

Questions?
17
Sui Tan, PE StreetSaver Program Manager Metropolitan Transportation Commission [email protected]
References
• NCHRP Synthesis of Highway Practice 401 – Quality Management of Pavement Condition Data Collection (Flintsch and McGhee 2009)
• Practical Guide for Quality Management of Pavement Condition Data Collection, FHWA 2013
18


