56
2017/2018 Full Year Results MAKING HEADWAY DESPITE HEADWINDS 14 June 2018

2017/2018 Full Year Results
MAKING HEADWAY
DESPITE HEADWINDS
14 June 2018

Disclaimer
2
• This Document comprises the written materials/slides for a presentation concerning Majestic Wine PLC (the “Company”) and its 2018 Full YearResults.
• By reviewing this presentation you agree to be bound by the conditions set out below.
• No reliance may be placed for any purposes whatsoever on the information in this document or on its completeness. The presentation is intended toprovide a general overview of the Company’s business and does not purport to deal with all aspects and details regarding the Company. Accordingly,neither the Company nor any of its respective directors, officers, employees or advisers nor any other person makes any representation or warranty,express or implied, as to, and accordingly no reliance may be placed on, the fairness, accuracy or completeness of the information contained in thepresentation or of the views given or implied. Neither the Company nor any of its respective directors, officers, employees or advisers nor any otherperson shall have any liability whatsoever for any errors or omissions or any loss howsoever arising, directly or indirectly, from any use of thisinformation or its contents or otherwise arising in connection therewith.
• Certain statements in this presentation regarding the Company are or may be forward-looking statements. These forward-looking statements areneither historical facts or guarantees of future performance. Such statements are based on current expectations and belief and, by their nature, aresubject to a number of known and unknown risks and uncertainties which may cause the actual results, prospects and developments of the Companyto differ materially from those expressed or implied by these forward-looking statements.
• The information contained in this presentation is for background purposes only. The subject matter of the presentation may be subject to change andthe Company does not take any responsibility for updating or amending the contents to reflect such changes. The material contained in thispresentation reflects current legislation and the business and financial affairs of the Company which are subject to change without notice and audit,and is subject to the provisions contained within legislation.
• This presentation summarises information contained in the 2018 Full Year Results. Without prejudice to the generality of these conditions, thissummary information, including any views given or implied, or any statement made, in relation to such information should not be relied upon, norshould it be treated as accurate or complete. This presentation and all such information contained herein should be read subject to the Interim Results.
• The information contained in this presentation has been obtained from Company sources and from sources which the Company believes to be reliablebut it has not independently verified such information and does not guarantee that it is accurate or complete.
• No statement in this presentation is intended to be a profit forecast and no statement in this presentation should be interpreted to mean that earningsper Company share for current or future financial years would necessarily match or exceed the historical published earnings per Company share.

3
Keep doing what we’re doing
Do it faster Do it better
122 3
Making headway despite headwinds:

Keep doing what we’re doing Faster Better
122 3
Making headway despite headwinds:
We delivered profitable growth despite tough UK
market
i) Underlying revenue up 4.0%
ii) Adjusted EBIT up £6.4m
iii) KPIs heading the right way
iv) 20% of Sales International, 45% of Sales Online
The plan is working - So we are sticking to it4

Keep doing what we’re doing Faster Better
122 3
We plan to double our investment in new customer
acquisition from £14m to £28m because:
i) The potential investment pool is bigger than we thought
ii) The returns are trending up, not down
iii) We have good early indications that the same tactics
work in Majestic Retail
5
Making headway despite headwinds

Keep doing what we’re doing Faster Better
122 3
6
Making headway despite headwinds
We don’t just want to grow faster – we want to do it
better, by:
i) Continuing to optimise our new customer investment
ii) Removing unproductive work, so our people can focus
on customers
iii) Delivering a step change in efficiency
iv) And finally, getting Majestic Commercial growing
again
Keep doing what we’re doing Faster Better
122 3
Making headway:
7

Keep doing what we’re doing
8
What we said we’d do What we’ve done
Be close to completing the last heavy
lifting projects
Completed integration of Majestic and
Naked supply chain
Pay a dividend in line with expectations 7.2p total dividend vs FY17 5.1p
End the year with a strong balance sheet Net Debt: Adjusted EBITDA of 0.35x
We would focus on growth in year 3 of
the transformation plan
Now doubling new customer investment
Deliver an increased ROI 4.7x Payback on customers recruited in
the year vs 4.4x in FY17
Deliver profitable growth Adjusted EBIT up 29% on FY17 (55%
underlying)
Grow international and online International 20% and online 45% of
Group sales
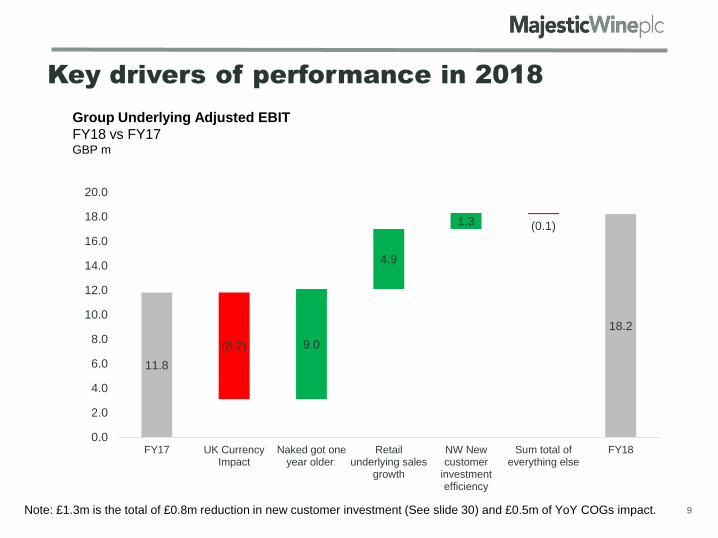
11.8
(8.7) 9.0
4.9
1.3 (0.1)
18.2
0.0
2.0
4.0
6.0
8.0
10.0
12.0
14.0
16.0
18.0
20.0
FY17 UK CurrencyImpact
Naked got oneyear older:
Retailunderlying sales
growth
NW Newcustomer
investmentefficiency
Sum total ofeverything else
FY18
9
Key drivers of performance in 2018
Group Underlying Adjusted EBIT
FY18 vs FY17GBP m
Note: £1.3m is the total of £0.8m reduction in new customer investment (See slide 30) and £0.5m of YoY COGs impact.
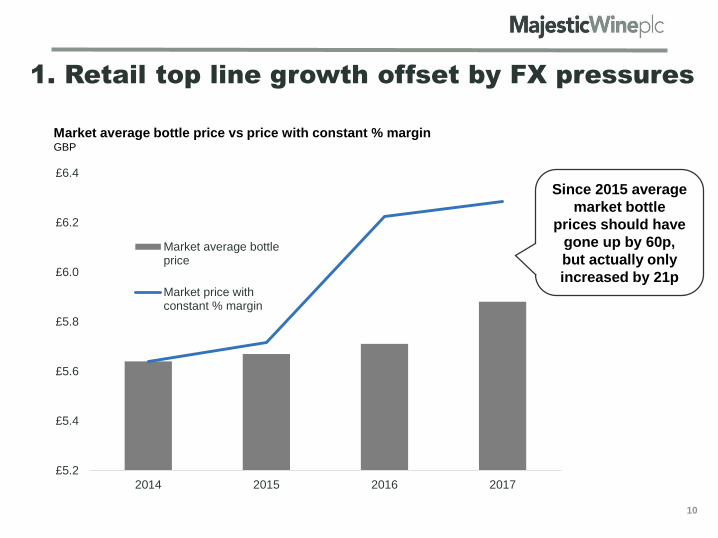
1. Retail top line growth offset by FX pressures
10
Since 2015 average
market bottle
prices should have
gone up by 60p,
but actually only
increased by 21p
Market average bottle price vs price with constant % marginGBP
£5.2
£5.4
£5.6
£5.8
£6.0
£6.2
£6.4
2014 2015 2016 2017
Market average bottleprice
Market price withconstant % margin

0
20
40
60
80
100
120
140
FY18
FY17
FY16
FY15
FY14
FY13
FY12
FY11
FY10
FY09
2. Naked got one year older..
11
Contribution from
existing customers
grew by £6.9m in
FY18
Naked Wines
Repeat Customer Sales FY08-18GBP m

3. Improved efficiency of New Customer
Investments
12
Naked Wines Payback
FY17-FY18 by Monthly CohortLTV/Acquisition Cost
0.0x
0.5x
1.0x
1.5x
2.0x
2.5x
3.0x
3.5x
Y1 Y2 Y3 Y4 Y5 Y6
FY18 FY17
FY16 FY15
FY14 FY13
9.5%
improvement
in payback
after one year

Keep doing what we’re doing Faster Better
122 3
Making headway:
13

-
5
10
15
20
25
2013 2014 2015 2016 2017 2018 2019
UK base International Digital Retail
The investment pool is bigger
14
1
We have grown
investment in Naked UK at
around 15% on a like for
like basis for 10 years
2We have proven
returns in USA and
Aus over 5 years
3
In the last 2 years we
have proven digital new
customer acquisition as
a viable channel 4We have early
indications of
success in
Majestic
Group Investment in New Customer Acquisition
FY2013 – FY2019FGBP m
Forecast
£5 – 8m
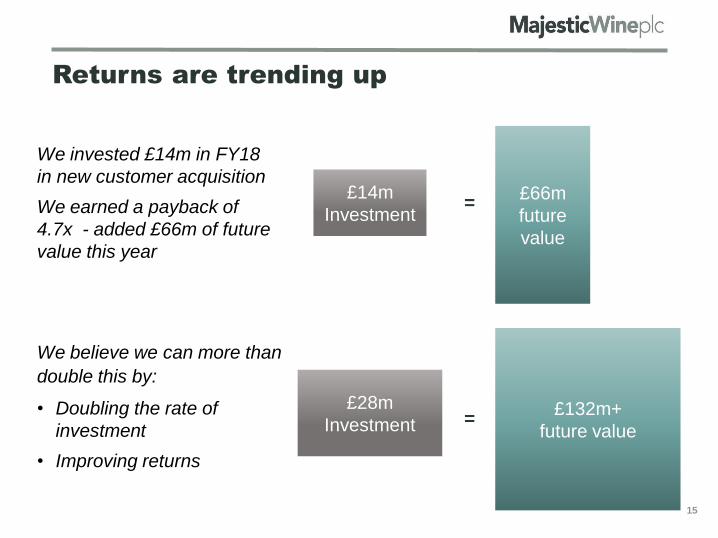
Returns are trending up
15
We believe we can more than
double this by:
• Doubling the rate of
investment
• Improving returns
£14m
Investment
We invested £14m in FY18
in new customer acquisition
We earned a payback of
4.7x - added £66m of future
value this year
£66m
future
value
£132m+
future value
£28m
Investment
=
=
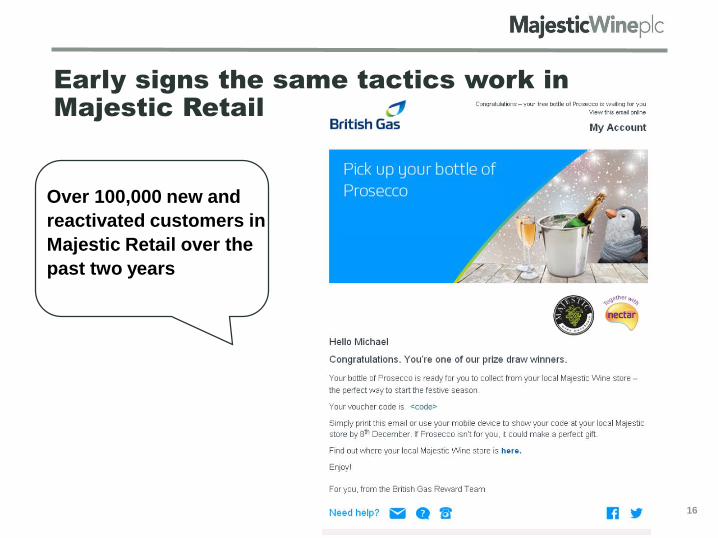
Early signs the same tactics work in
Majestic Retail
16
Over 100,000 new and
reactivated customers in
Majestic Retail over the
past two years

Keep doing what we’re doing Faster Better
122 3
Making headway:
17
11.8
(8.7) 9.0
4.9
1.3 (0.1)
18.2
0.0
2.0
4.0
6.0
8.0
10.0
12.0
14.0
16.0
18.0
20.0
FY17 UK CurrencyImpact
Naked got oneyear older:
Retailunderlying sales
growth
NW Newcustomer
investmentefficiency
Sum total ofeverything else
FY18
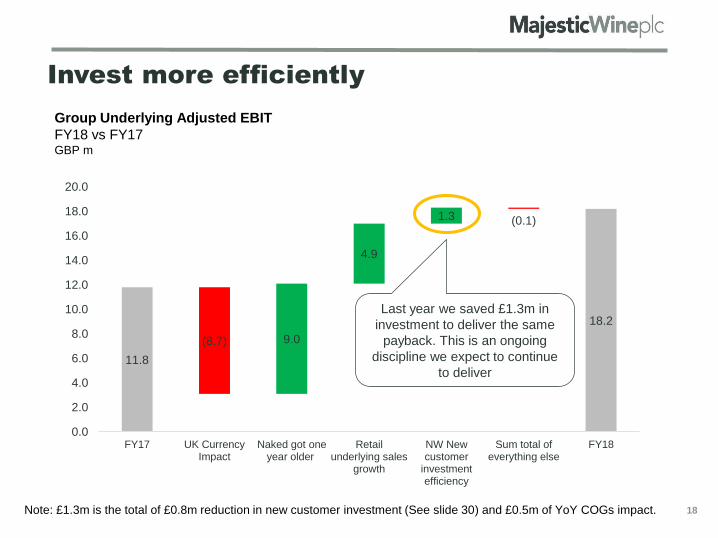
18
Invest more efficiently
Last year we saved £1.3m in
investment to deliver the same
payback. This is an ongoing
discipline we expect to continue
to deliver
Group Underlying Adjusted EBIT
FY18 vs FY17GBP m
Note: £1.3m is the total of £0.8m reduction in new customer investment (See slide 30) and £0.5m of YoY COGs impact.
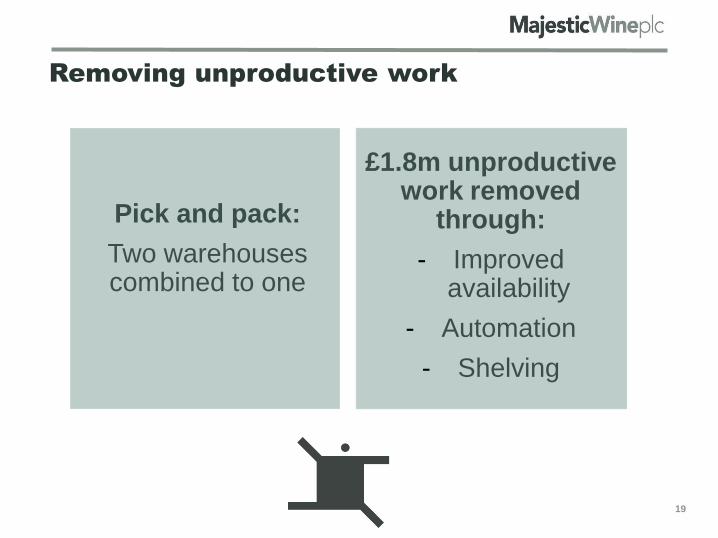
Removing unproductive work
19
£1.8m unproductive work removed
through:
- Improved availability
- Automation
- Shelving
Pick and pack:
Two warehouses combined to one
81%
82%
83%
84%
85%
86%
87%
88%
89%
90%
91%
20
16 6
20
16 9
20
16 1
2
20
17 3
20
17 6
20
17 9
20
17 1
2
20
18 3
20
18 6
20
18 9
20
18 1
2
20
19 3
0%
10%
20%
30%
40%
50%
60%
70%
201
7 1
201
7 1
1
201
7 2
1
201
7 3
1
201
7 4
1
201
8 5
1
201
8 9
201
9 1
9
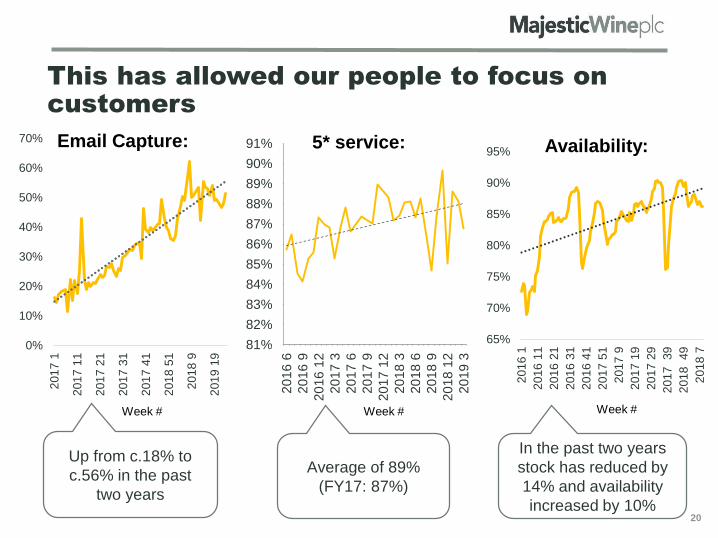
This has allowed our people to focus on
customers
20
Up from c.18% to
c.56% in the past
two years
Average of 89%
(FY17: 87%)
Email Capture: 5* service:
65%
70%
75%
80%
85%
90%
95%
201
6 1
201
6 1
1
201
6 2
1
201
6 3
1
201
6 4
1
201
7 5
1
201
7 9
201
7 1
9
201
7 2
9
201
7
39
201
8
49
201
8 7
Availability:
In the past two years
stock has reduced by
14% and availability
increased by 10%
Week #Week # Week #

Franchise-Lite is working
21
Gross Profit Performance Partners vs Total Stores – 39 weeks since launch
FY2018% growth
We now have 43 Stores
on the Franchise-Lite
Partner scheme who
are delivering a
stronger performance
vs the rest of the store
base
1 2 3
1.5%
1.0%
0.5%
0.0%
-0.5%
-1.0%
-1.5%
Partner
Stores
Non- Partner
Stores

22
The Proposition:
1. Targeting independent pubs, restaurants and companies
2. With the proposition - we will help you make more money from your wine list
Majestic Commercial - the time has come
- Clear sales proposition
- Automation to free up people
- Improve sales training and discipline
Three competitive advantages:
Nationwide next day
delivery
Data – we know what
local people buy
Training – Over 1,000 people
who can train our customer’s
staff to sell wine
The Plan:
New Leadership Get the basics right:
- Olivia Fitzgerald started in
April 2018
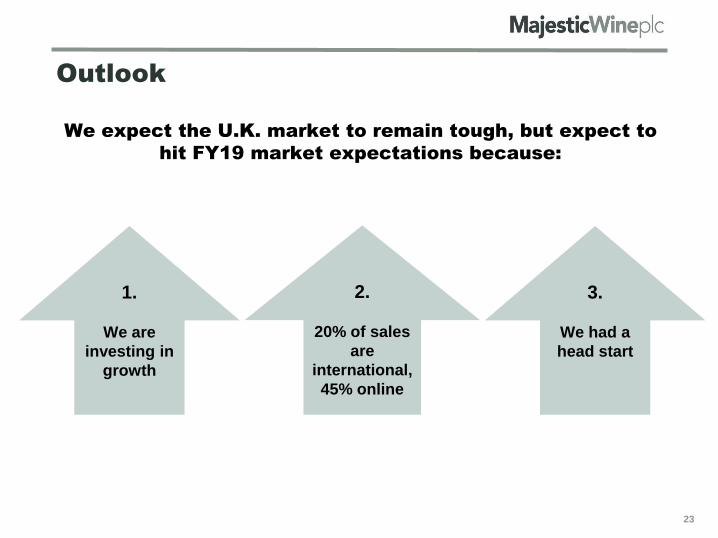
Outlook
1.
We are
investing in
growth
2.
20% of sales
are
international,
45% online
3.
We had a
head start
23
We expect the U.K. market to remain tough, but expect to
hit FY19 market expectations because:

Financial Review
In a year where
we paused for
breath, we
delivered a big
step up in
profitability
…and we choose
to invest it,
driving future
growth
We are a strong
business with
capital to invest…
1 2 3
24

Financial Review
In a year where
we paused for
breath, we
delivered a big
step up in
profitability
…and we choose
to invest it,
driving future
growth
We are a strong
business with
capital to invest..
1 2 3
25

Naked Wines
Commercial
Retail
Underlying Sales
Growth
TOTAL
Lay & Wheeler
+4.0%
%
+11.3%
+0.2%
-5.6%
+1.9%
We maintained sales growth but at a lower rate
as we eliminated unproductive activity
26

Hence strong conversion to profits
-
2
4
6
8
10
12
14
Revenue growthat FY17 Gross
Margin
Gross MarginImprovement
Admin costmovement
Increase inadjusted EBIT
Financing costsreduction
Adjusted Items Underlying PBTmovement
4.7
3.2(1.5)
6.4
0.2
5.4
12.0
Drivers of Group PBT movement
FY18 vs FY17, GBP m
27
• +28bps business mix
• +39bps BU margin
improvement
Predominantly Central:
• Digital marketing
• IT

Group profit movement is driven by Naked
Wines…
-
5
10
15
20
25
Adj EBIT FY17 Naked Central Other Adj EBIT FY18
Group Adjusted EBIT
FY18GBP m
28
11.7
7.4(1.0)
0.1
18.2

...which is a year older and spending less
1.3
4.4
2.4
0.8 (0.2)
8.7
0
1
2
3
4
5
6
7
8
9
10
FY17 Adj. EBIT Growth in Angels IncreasedContribution
Angel
Change ininvestment
Change in FixedCosts
FY18 Adj. EBIT
29
Naked Wines Adjusted EBIT
FY18GBP m
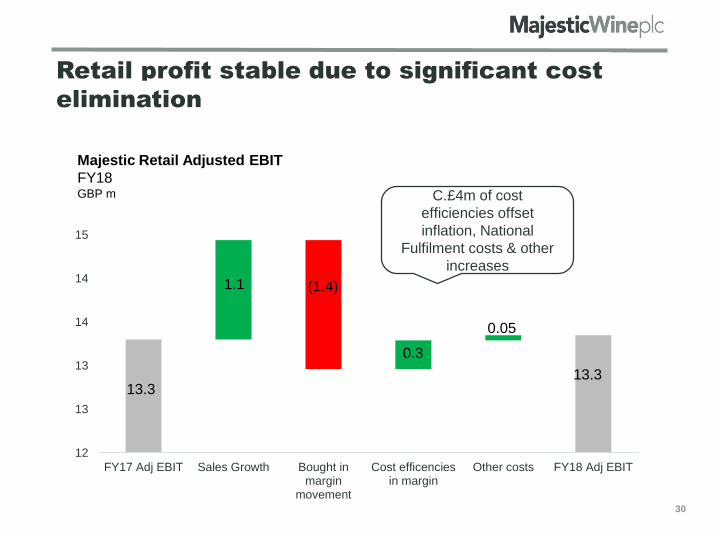
Retail profit stable due to significant cost
elimination
12
13
13
14
14
15
15
FY17 Adj EBIT Sales Growth Bought inmargin
movement
Cost efficenciesin margin
Other costs FY18 Adj EBIT
Majestic Retail Adjusted EBIT
FY18GBP m
13.3
1.1 (1.4)
0.3
0.05
13.3
30
C.£4m of cost
efficiencies offset
inflation, National
Fulfilment costs & other
increases

Retail sales slowed due to lower retention
Retail Repeat Customer Sales Retention
FY13-18 %
75.0%
80.0%
85.0%
90.0%
95.0%
100.0%
2013 2014 2015 2016 2017 2018
After years of improving sales retention, growth slowed as FX related
cost pressures flowed through to selling prices
31
250
260
270
280
290
300
310
320
Ma
r-1
3
Au
g-1
3
Jan
-14
Jun
-14
Nov-1
4
Ap
r-15
Se
p-1
5
Fe
b-1
6
Jul-
16
Dec-1
6
Ma
y-1
7
Oct-
17
Ma
r-1
8
Retail Sales growth
FY13-18 GBP m

Financial Review
In a year where
we paused for
breath, we
delivered a big
step up in
profitability
…and we choose
to invest it,
driving future
growth
We are a strong
business with
capital to invest..
1 2 3
32
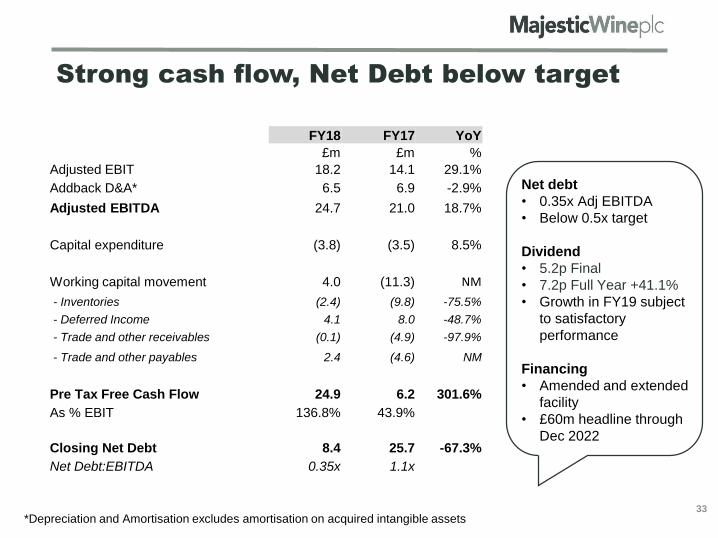
Strong cash flow, Net Debt below target
Net debt
• 0.35x Adj EBITDA
• Below 0.5x target
Dividend
• 5.2p Final
• 7.2p Full Year +41.1%
• Growth in FY19 subject
to satisfactory
performance
Financing
• Amended and extended
facility
• £60m headline through
Dec 2022
FY18 FY17 YoY
£m £m %
Adjusted EBIT 18.2 14.1 29.1%
Addback D&A* 6.5 6.9 -2.9%
Adjusted EBITDA 24.7 21.0 18.7%
Capital expenditure (3.8) (3.5) 8.5%
Working capital movement 4.0 (11.3) NM
- Inventories (2.4) (9.8) -75.5%
- Deferred Income 4.1 8.0 -48.7%
- Trade and other receivables (0.1) (4.9) -97.9%
- Trade and other payables 2.4 (4.6) NM
Pre Tax Free Cash Flow 24.9 6.2 301.6%
As % EBIT 136.8% 43.9%
Closing Net Debt 8.4 25.7 -67.3%
Net Debt:EBITDA 0.35x 1.1x
33*Depreciation and Amortisation excludes amortisation on acquired intangible assets
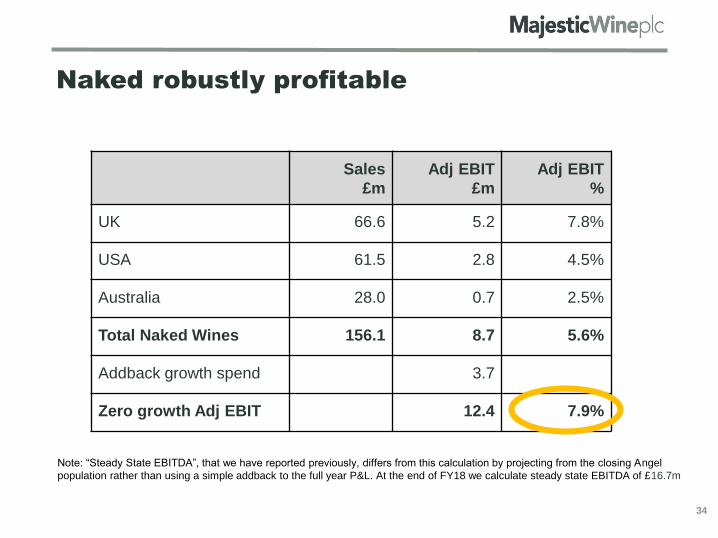
Naked robustly profitable
Sales
£m
Adj EBIT
£m
Adj EBIT
%
UK 66.6 5.2 7.8%
USA 61.5 2.8 4.5%
Australia 28.0 0.7 2.5%
Total Naked Wines 156.1 8.7 5.6%
Addback growth spend 3.7
Zero growth Adj EBIT 12.4 7.9%
34
Note: “Steady State EBITDA”, that we have reported previously, differs from this calculation by projecting from the closing Angel
population rather than using a simple addback to the full year P&L. At the end of FY18 we calculate steady state EBITDA of £16.7m
Financial Review
In a year where
we paused for
breath, we
delivered a big
step up in
profitability
…and we choose
to invest it,
driving future
growth
We are a strong
business with
capital to
invest…
1 2 3
35
36
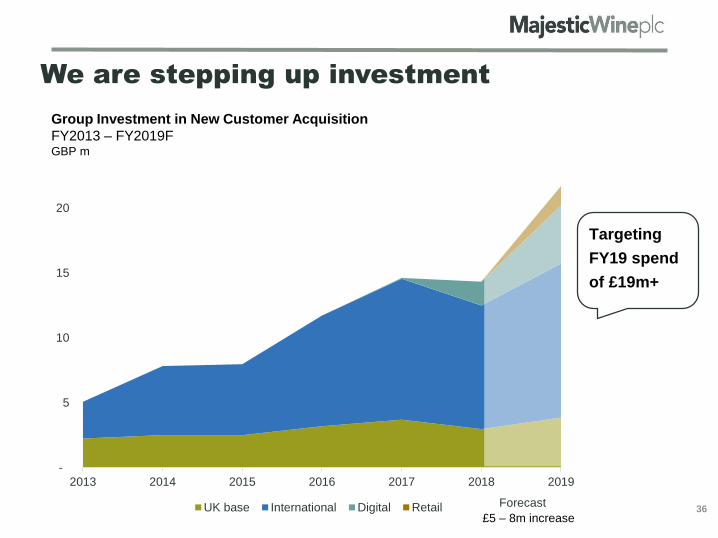
We are stepping up investment
-
5
10
15
20
25
2013 2014 2015 2016 2017 2018 2019
UK base International Digital Retail
Group Investment in New Customer Acquisition
FY2013 – FY2019FGBP m
Forecast
£5 – 8m increase
Targeting
FY19 spend
of £19m+
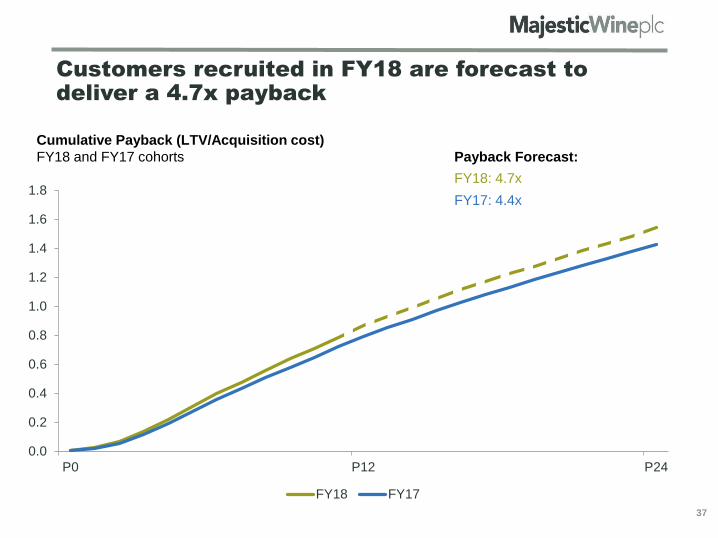
Customers recruited in FY18 are forecast to
deliver a 4.7x payback
Payback Forecast:
FY17: 4.4x
FY18: 4.7x
Cumulative Payback (LTV/Acquisition cost)
FY18 and FY17 cohorts
0.0
0.2
0.4
0.6
0.8
1.0
1.2
1.4
1.6
1.8
P0 P12 P24
FY18 FY17
37

70%
75%
80%
85%
90%
95%
100%
105%
2013 2014 2015 2016 2017 2018
FX rates
Sales uplift may be muted by headwinds
Recent FX rates could reduce sales growth by 1-2%
“Bordeaux and Burgundy Vintages 2017
are not expected to be as popular as recent
years. L&W sales may decline”
Fine Wine Vintages
UK Market
Commercial sales retention
38
“The UK market will be tough, and sales
and margins will be under pressure BUT
we are on track to achieve FY19 market
expectations despite the market”
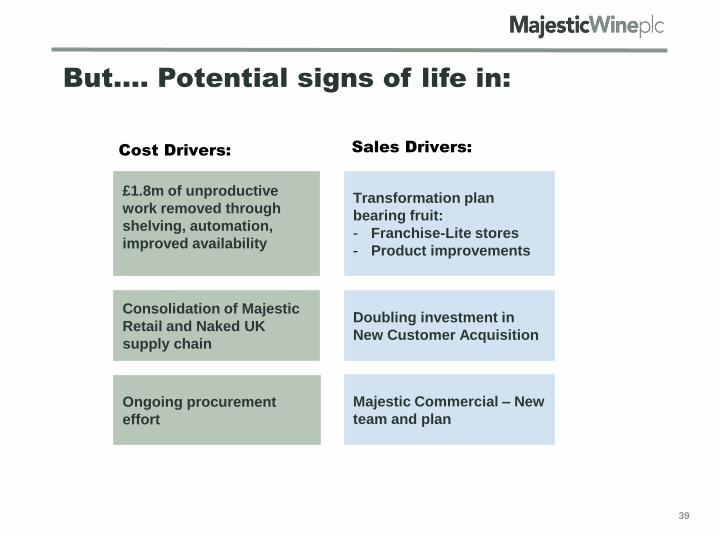
But…. Potential signs of life in:
£1.8m of unproductive
work removed through
shelving, automation,
improved availability
Majestic Commercial – New
team and plan
Transformation plan
bearing fruit:
- Franchise-Lite stores
- Product improvements
Doubling investment in
New Customer Acquisition
Consolidation of Majestic
Retail and Naked UK
supply chain
Ongoing procurement
effort
Cost Drivers: Sales Drivers:
39
Financial Summary
In a year where
we paused for
breath, we
delivered a big
step up in
profitability
…and we choose
to invest it,
driving future
growth
We are a strong
business with
capital to invest..
1 2 3
40

Outlook
41
1.
We are
investing in
growth
2.
20% of our
business is
international
& 45% online
3.
We had a
head start
We expect the U.K. market to remain tough, but expect to
hit FY19 market expectations because:

QUESTIONS?
42

APPENDICES
43

44
2017/18 Results Summary
Reported Underlying(4)
FY2018 FY2017 FY2018 FY2017
% YoY
Underlying
52
weeks 53 weeks
52
weeks
52
weeks
Revenue £m 476.1 465.4 477.7 459.5 +4.0%
Adjusted EBIT £m 18.2 14.1 18.2 11.8 +54.5%
Adjusted PBT £m 17.2 12.9 17.2 10.5 +63.0%
Adjusted EPS p 23.9p 17.7p
Profit/(Loss) before tax £m 8.3 (1.5)
Basic EPS p 10.9p (4.1p)
Final Dividend per share p 5.2p 3.6p
Free Cash Flow £m 24.9 6.1
Reported net debt £m (8.4) (25.7)

Group structure
45
Market size
Reported Sales
for the year to
April 2018
Underlying sales
growth
Proposition
Competitive
advantage
£2.2bn(UK)
£263.8m+1.9%
We help people find wines they will love
- People – 1,000 helpful, friendly and trained team members (we employ wine lovers, not shelf stackers!)
- We control the last mile delivery
- We have data on what our customers like and don’t like
£17bn(Global)
£156.1m+11.3%
Making luxury wines affordable by supporting winemakers.
The model delivers better wine for less money, and customers become friends with the winemakers
£2.0bn
£43.4m-5.6%
We help businesses make more money from their wine lists
The only Company offering local service with national scale and pricing
£0.7bn
£14.5m+0.2%
We help people discover fine wine risk free
A highly trained sales team, who know how to make fine wine accessible for everyone
Adjusted
EBIT £13.3m £8.7m £2.4m £0.9m
Why invest in us? Cash generative retail business transforming into a multichannel business
Subscription business model with direct marketing expertise and multiyear customer retention
Focused on an unloved section of the trade market
Creating a business opportunity out of the demise of en-primeur
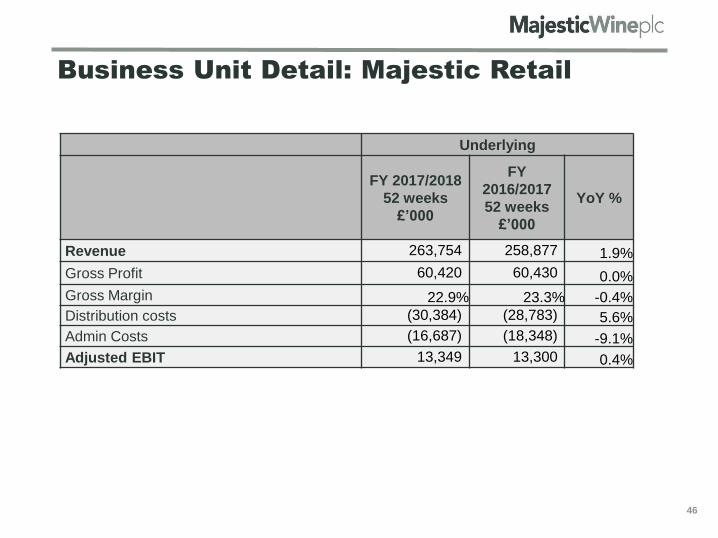
Business Unit Detail: Majestic Retail
Underlying
FY 2017/2018
52 weeks
£’000
FY
2016/2017
52 weeks
£’000
YoY %
Revenue 263,754 258,877 1.9%
Gross Profit 60,420 60,430 0.0%
Gross Margin 22.9% 23.3% -0.4%
Distribution costs (30,384) (28,783) 5.6%
Admin Costs (16,687) (18,348) -9.1%
Adjusted EBIT 13,349 13,300 0.4%
46
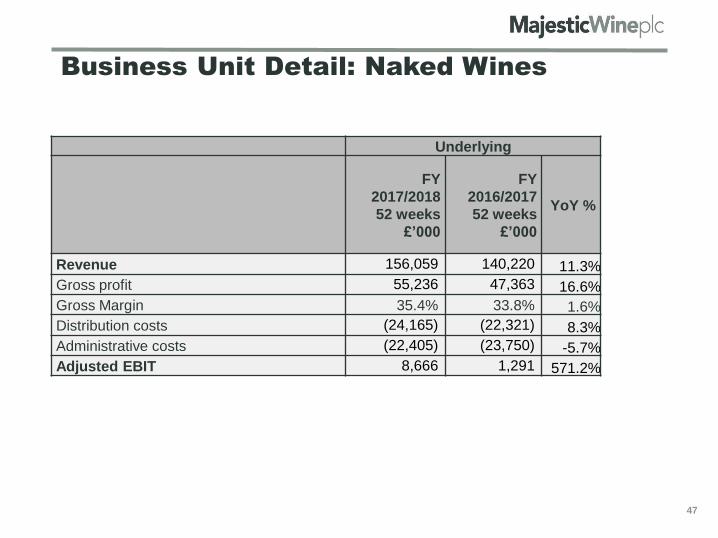
Business Unit Detail: Naked Wines
Underlying
FY
2017/2018
52 weeks
£’000
FY
2016/2017
52 weeks
£’000
YoY %
Revenue 156,059 140,220 11.3%
Gross profit 55,236 47,363 16.6%
Gross Margin 35.4% 33.8% 1.6%
Distribution costs (24,165) (22,321) 8.3%
Administrative costs (22,405) (23,750) -5.7%
Adjusted EBIT 8,666 1,291 571.2%
47
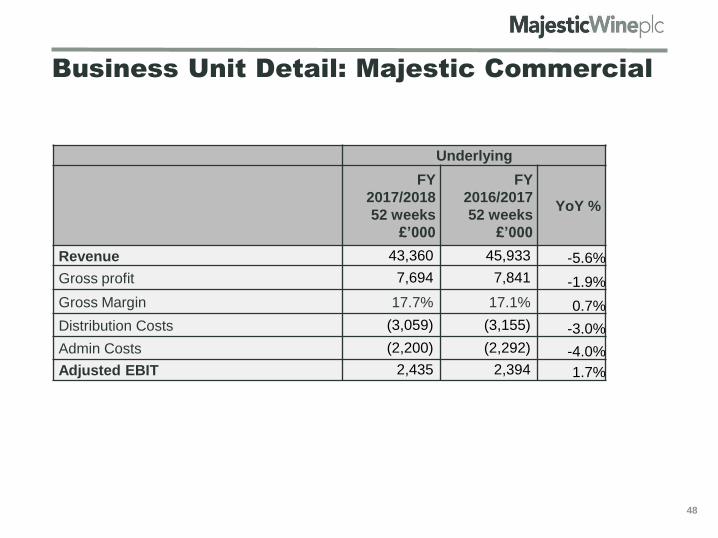
Business Unit Detail: Majestic Commercial
Underlying
FY
2017/2018
52 weeks
£’000
FY
2016/2017
52 weeks
£’000
YoY %
Revenue 43,360 45,933 -5.6%
Gross profit 7,694 7,841 -1.9%
Gross Margin 17.7% 17.1% 0.7%
Distribution Costs (3,059) (3,155) -3.0%
Admin Costs (2,200) (2,292) -4.0%
Adjusted EBIT 2,435 2,394 1.7%
48
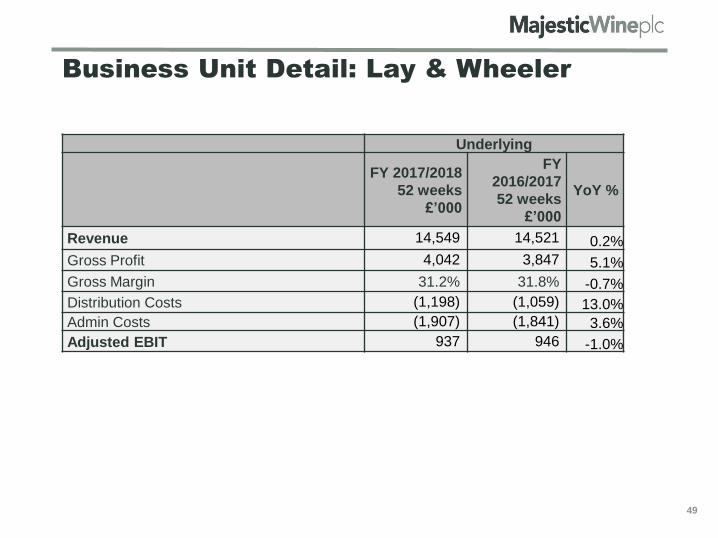
Business Unit Detail: Lay & Wheeler
Underlying
FY 2017/2018
52 weeks
£’000
FY
2016/2017
52 weeks
£’000
YoY %
Revenue 14,549 14,521 0.2%
Gross Profit 4,042 3,847 5.1%
Gross Margin 31.2% 31.8% -0.7%
Distribution Costs (1,198) (1,059) 13.0%
Admin Costs (1,907) (1,841) 3.6%
Adjusted EBIT 937 946 -1.0%
49
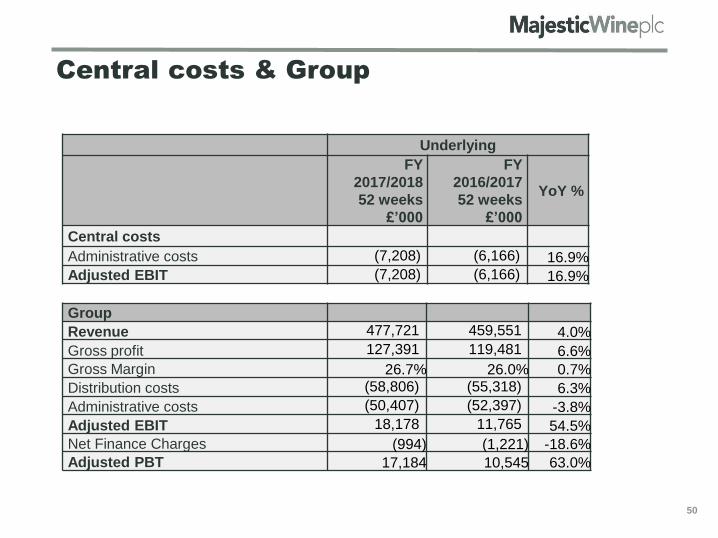
Central costs & Group
50
Underlying
FY
2017/2018
52 weeks
£’000
FY
2016/2017
52 weeks
£’000
YoY %
Central costs
Administrative costs (7,208) (6,166) 16.9%
Adjusted EBIT (7,208) (6,166) 16.9%
Group
Revenue 477,721 459,551 4.0%
Gross profit 127,391 119,481 6.6%
Gross Margin 26.7% 26.0% 0.7%
Distribution costs (58,806) (55,318) 6.3%
Administrative costs (50,407) (52,397) -3.8%
Adjusted EBIT 18,178 11,765 54.5%
Net Finance Charges (994) (1,221) -18.6%
Adjusted PBT 17,184 10,545 63.0%

Glossary
51
Definitions
Contribution A profit measure between Gross Profit and EBIT, calculated as Gross Profit less the costs of fulfilling and
servicing (e.g. credit card fees, delivery costs, customer facing staff costs) and marketing expenses. We often
split Contribution into that from New and Repeat customers as they can have different levels of profitability.
Repeat customer A customer that has bought from one of our businesses more than once, recently. For Naked Wines these are
“Angels” who have subscribed. For Majestic they are people who have shopped with us at least once within
the last 12 months, with that shop not being their first time.
New Customer A customer who, at the time of purchase, does not meet our definition of a Repeat Customer, for example
because they are brand new, were previously a repeat customer and have stopped shopping with us at some
point or cannot be identified.
Product Availability % of targeted range available in stores/on websites as indicated by our inventory reporting
Team Retention % of key staff (e.g. store managers) as of 12 months ago still working per payroll records
Buy It Again
Ratings
% of “Yes” scores in the last 12 months as recorded by websites/apps
5* Service Ratings % of service ratings scoring 5* in last two months as recorded by websites/apps/telephone feedback
Contribution per
New Mature Angel
Contribution after subtracting all direct costs that are associated with maintaining that Angel (E.g Fulfilment,
Customer Service, Cost of Sales, Returns etc)
Cohort Group of Mature Angels recruited in the same Financial year
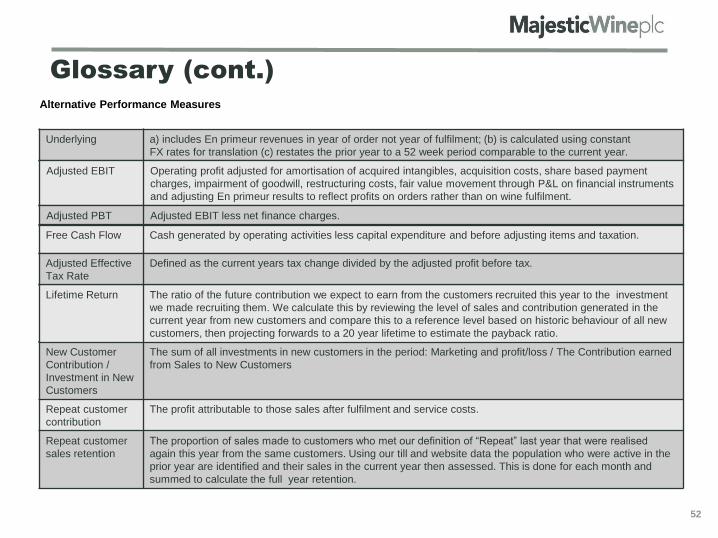
Glossary (cont.)
52
New Customer
Contribution /
Investment in New
Customers
The sum of all investments in new customers in the period: Marketing and profit/loss / The Contribution earned
from Sales to New Customers
Repeat customer
contribution
The profit attributable to those sales after fulfilment and service costs.
Repeat customer
sales retention
The proportion of sales made to customers who met our definition of “Repeat” last year that were realised
again this year from the same customers. Using our till and website data the population who were active in the
prior year are identified and their sales in the current year then assessed. This is done for each month and
summed to calculate the full year retention.
Alternative Performance Measures
Underlying a) includes En primeur revenues in year of order not year of fulfilment; (b) is calculated using constant
FX rates for translation (c) restates the prior year to a 52 week period comparable to the current year.
Adjusted EBIT Operating profit adjusted for amortisation of acquired intangibles, acquisition costs, share based payment
charges, impairment of goodwill, restructuring costs, fair value movement through P&L on financial instruments
and adjusting En primeur results to reflect profits on orders rather than on wine fulfilment.
Adjusted PBT Adjusted EBIT less net finance charges.
Free Cash Flow Cash generated by operating activities less capital expenditure and before adjusting items and taxation.
Lifetime Return The ratio of the future contribution we expect to earn from the customers recruited this year to the investment
we made recruiting them. We calculate this by reviewing the level of sales and contribution generated in the
current year from new customers and compare this to a reference level based on historic behaviour of all new
customers, then projecting forwards to a 20 year lifetime to estimate the payback ratio.
Adjusted Effective
Tax Rate
Defined as the current years tax change divided by the adjusted profit before tax.
Revised Naked Wines measurement and
forecasting
53

Naked Wines Business Split Reconciliation
As presented
April 17th CMD
Move immature As presented at
final results
New Customers
Sales 31.9 (10.3) 21.6
Contribution (13.0) (1.0) (14.0)
Repeat Customers
Sales 124.2 10.3 134.5
Contribution 32.8 1.0 33.8
Fixed Costs (11.1) (11.1)
Adj EBIT 8.7 8.7
54
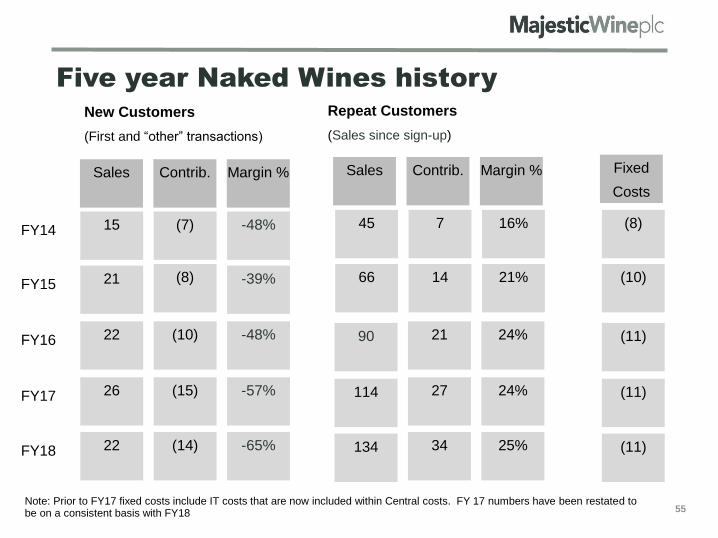
Five year Naked Wines history
New Customers
(First and “other” transactions)
Sales Contrib. Margin % Sales Contrib. Margin % Fixed
Costs
FY15 21 (8) -39% 66 14 21% (10)
FY16 22 (10) -48% 90
Repeat Customers
(Sales since sign-up)
21 24% (11)
FY14 15 (7) -48% 45 7 16% (8)
FY17 26 (15) -57% 114 27 24% (11)
55
FY18 22 (14) -65% 134 34 25% (11)
Note: Prior to FY17 fixed costs include IT costs that are now included within Central costs. FY 17 numbers have been restated to be on a consistent basis with FY18

Forecasting Example
Sales Contrib. Margin % Sales Contrib. Margin % Fixed
Costs
FY15 21 (8) -39% 66 14 21% (10)
FY16 22 (10) -48% + 56
(retained)
34 (new)
Total
90
21 24% (11)
Guidance 10-20%
growth, (900)bps
margin
Calculate
based on
margin
New Business
(First and “other” transactions)
Mature Angels
(Sales since sign-up)
Retention
~85%Calculate based on
margin, guidance +150bps
Guidance
10-20%
growth
~155% in year
conversion
123
4
5 6
56
2016 EBIT = £0.6mRevision in definition
impacts this metric
materially


