www.globaljournalseries.com, Email: [email protected] ASSESSMENT OF IRRIGATION WATER QUALITIES OF ABAK RIVER, ABAK, AKWA IBOM STATE, NIGERIA
E. A. UDOM, A. E. EKPO AND S. I. OLUKA
(Received 15 April, 2019; Revision Accepted 17 June 2019)
ABSTRACT
Irrigated agriculture is dependent on an adequate water supply of usable quality. Since water quality is very important for any intended use, the Abak River water which is used for irrigation by the Cross River Basin Development Authority and the rural communities around the river bank was assessed for irrigation purposes. The River water samples were assessed for four months (from November, 2016 to February, 2017 for its irrigation water qualities. The water samples were analyzed for major cations: Na
+, Ca
2+,K
+,Mg
2+ and anions: Cl
-, SO4
2-,
HCO3-, CO3
2- and NO3.
The important constituents that influence the water quality for irrigation such as Electrical Conductivity (EC), Total Dissolved Solid (TDS), Sodium Adsorption Ratio (SAR), Magnesium Adsorption Ratio (MAR), Permeability Index (PI), Kelly’s Ratio (KR), Residual Sodium Bicarbonate (RSBC), Soluble Sodium Percentage (SSP), (RSC) Residual Sodium Carbonate and Potential Salinity (PS) were assessed and compared with standard limits. The values of Sodium Adsorption Ratio (0.4 to 0.64), Soluble Sodium Percentage (28.16 to 34.68%), Residual Sodium Bicarbonate (2.82 to 3.15 meq/L), Permeability Index (3.20 to 3.98%), Magnesium Adsorption Ratio (77.78 to
87.59%), Kelly’s Ratio (0.13 to 0.161 meq/L), Electrical Conductivity (20.5 to 22.5 µs/cm), Total Dissolved Solids (10.20 to 12.60 Mg/l) Residual Sodium Carbonate (0.298 to 0.8 meq/L) and Potential Salinity (1.09 – 1.358 meq/L) were found to be within the safe limits and thus suitable for irrigation purposes, except MAR which is above 50% the safe limit. The river water will thus cause neither salinity hazard nor has an adverse effect on the soil properties of the study area or on crops. KEYWORDS: Abak River, Water Quality Irrigation, Parameters, Assessment. INTRODUCTION The knowledge of irrigation water quality is critical to soil conservation and optimal agricultural productivity. Abak is an urban area that is basically dominated by agricultural activities. Abak River is the only river that is available in Abak suburb. Irrigation is being carried out within the region for all year round vegetable production. Water quality is mostly affected in dry season. Therefore, there is a need to study the quality of the Abak River. This would give an insight into the
quality of the available surface water, since poor irrigation quality water will create a negative impact on the crop and the soil over time which will have an impact on the humans and the environment at large. Water resource has a unique position among other natural resources and is the most extensively distributed substance in the world (Megersa and Abdulahi, 2015). Water plays a key role in the human life and surrounding environment (Saleh et. al., 2001 and Onoja et.al., 2013). Fresh water is most essential among water resources, it is essential for
E. A. Udom, Cross River Basin Development Authority, Calabar, Cross Rivers State. A. E. Ekpo, Department of Agricultural and Bioresource Engineering, Nnamdi Azikiwe University, Awka, Anambra State, Nigeria. S. I. Oluka, Department of Agricultural and Bioresource Engineering Enugu State University of Science & Technology – Enugu – Enugu State.
human being’s life and activities. The availability of clean fresh water is one of the greatest challenges facing mankind today as millions of people especially in rural areas still lack access to potable water (Dan Hassan et. al., 2012 and Amadi et. al., 2015). About 1.4 billion km
3 water is available on earth. Among
them approximately 35 million km3 fresh water
resources are present i.e. about 2.5% of total volume (UNEP, 2001). However, the way that water has been managed in agriculture has caused wide scale change in land cover with water courses, contributing to ecosystem degradation and undermining the process that supports ecosystem and the provision of a wide range of ecosystem services essential for human well-being. (Megersa and Abdulahi 2015, Malin et. al., 2007, Adelana and Olusehinde, 2003). Water resources are depleting due to exceeding demand and consumption ratio as result of over pumping and demanding human activities thus worsening the water quality resources. Water quality refers to the characteristics of water supply that will influence its suitability for a specific use; that is how well the quality meets the needs of the user. Water quality is defined by physical, chemical and biological characteristics. This classification although primary and simple seems convenient for a more or less broad evaluation to cover the whole spectrum of irrigation water quality for crop production. It is further broadened in order to cover all the physicochemical, biological and microbiological properties of water that may cause any impact on soil, plants, environment and the consumer, human or livestock. Irrigation waters whether derived from springs, diverted from streams or pumped from well contain appreciable quantities of chemical substances in
solution that may reduce crop yield and deteriorate soil fertility. Also it may carry substances derived from its natural environment or from the waste products of man’s activities (domestic and industrial effluents). Understanding irrigation water quality is critical for sustainability of vegetable production (Dukes et. al., 2015). Water used for irrigation can vary greatly in quality depending upon types and quantity of dissolves salts, these salts are applied with the water and remained behind in the soil as water evaporates or is used by the crop (Tanji, 1990, Longenecker and Lyerly1974). However water quality in irrigated agriculture include salinity hazard (Total Soluble Salt Content), Sodium hazard, (ratio of Sodium (Na
+) to
Calcium (Ca2+
) and Magnesium (Mg2+
) ions, water pH, Alkalinity (Carbonate and Bicarbonate) specific ions: Chloride (Cl
-) Sulfate (So4
2-), Boron (Bo) and nitrate –
nitrogen (NO3N), Organic contaminant (Oil pollutant) and other factors such as heavy metals (Bauder et. al., 2007). Salts in water or soil reduce water availability to crops which eventually affects crop yield. Relatively high sodium or low calcium content of soil or water reduces the rate at which irrigation water enters the soil to such an extent that sufficient water cannot be infiltrated to supply the crop adequately from one irrigation period to the next. Ions such as those from sodium, chloride or boron from water or soil if accumulated in sensitive crops with high concentration cause damage to the crops and reduce yield of the crops. Also excessive nutrients in irrigation water reduce yield or quality of crops, sprinkler irrigation water with high bicarbonate content cause unsightly deposits on fruit or leaves. The scope of the study is limited to Abak River water quality for irrigation cropping in dry season.
OBJECTIVE OF THE STUDY The objective of this study is to assess the irrigation water qualities of Abak River, Abak, Akwa Ibom State, Nigeria
METHODOLOGY STUDY LOCATION: The Abak River is located on the south western part of Uyo, the Akwa Ibom State capital which lies in the rain forest zone of Nigeria. Abak is within the co-ordinates of latitude 4
o50
1 and 5
o10
1N, longitude, 7
o40
1E and
7o50
1E, with an elevation of 30 meter above sea level,
having a population of 139,090 with a land mass of 190 Km
2 (2006 National Census, Wikipedia 2016),
Attai et. al., (2015).
136 E. A. UDOM, A. E. EKPO AND S. I. OLUKA
Fig 2.1a & b Map of Nigeria showing Akwa Ibom State and Abak Local Government of Akwa Ibom State MATERIALS AND METHODS Sampling The River serves the Cross River Basin Development Authority as a source of irrigation water for her dry season cropping and the rural farmers of Abak Midim, Oku-Abak, Abak Usung Idim and Abak Usung Atai in Abak Local Government of Akwa Ibom State, Nigeria. Abak River water samples were collected in clean 1000ml polyethylene bottle for the Analysis of various physico-chemical parameters on monthly basis from November 2016 to February 2017. Nine samples were
collected for period of four months and a total of thirty-six samples were samples collected. Field Analysis Parameters such as water temperature and pH were measured on the spot by means of a mercury thermometer and digital pH meter. The samples were then carefully sealed, labeled and taken for analysis.
ASSESSMENT OF IRRIGATION WATER QUALITIES OF ABAK RIVER, ABAK, AKWA IBOM STATE, 137
Laboratory Analysis Chemical analyses were performed in the laboratory of University of Uyo. Atomic Absorption Spectrophotometry for cations and conventional titration for anions (chopra and kanwar, 1980). Ions were converted from milligram per liter to mill equivalent per liter and anions balanced against cations as a control check of the reliability of the analysis of the results. Data Analysis The data were analyzed statistically using the standard methods of mean and standard deviation methods from the data obtained. The analytical results were compared with the standard specification (WHO, 2006).
x = ∑x 2.1 N x = mean ∑x = the sum of x N = Number of data � = ∑(x – x)
2 2.2
n � = Standard deviation ∑ = Sum of x = each value in the data set x = Mean of all values in the data set n = Number of value in the data set
Table 2.1 Showing the Irrigation Water Parameters and their Respective Formulas
Parameters Formula References
Sodium Adsorption Ratio (SAR) Na+
(�CA�� + Mg��
2)
Richards (1954)
Soluble Sodium Percentage (SSP)
(Na++ K
+) x 100
Ca2+
+ Mg2+
+ Na+
+ K+
Todd (1995)
Residual Sodium Bicarbonate (RSBC)
HCO3 - Ca2+
Gupta and Gupta (1987)
permeability Index (PI)
Na + �HCO��X 100
CA�� + Mg�� + Na� Doneen (1964)
Magnesium Adsorption Ratio (MAR)
Mg2+
x 100 Ca
2+ + Mg
2+
Raghunath (1987)
Kelly’s Ratio (KR)
Na+
Ca2+
+ Mg2+
Kelly (1963)
Residual Sodium Carbonate (RSC)
(HCO
-3 + CO
2-3) – (Ca
2+ + Mg
2+)
Richards (1954)
Potential Salinity
Cl- +
�
� SO4
2-
Doneen (1961)
All ions are expressed in meq/L
138 E. A. UDOM, A. E. EKPO AND S. I. OLUKA
RESULT AND DISCUSSION
The analyzed physicochemical qualities of Abak River water is as indicated in table 3.1 with effect from November 2016 to February, 2017.
TABLE 3.1: RESULT OF PHYSICO CHEMICAL ANALYSIS OF ABAK RIVER
Parameters
Months
Statistics
WHO
Nov Dec Jan Feb Min
Max
Mean
SD
Temperature 26.20 27.00 25.80 27.80 25.80
27.80
26.70
0.89
30
pH 6.51 6.30 6.18 6.20 6.18
6.51
6.30
0.15
6.5 – 8.5
EC 22.00 21.20 20.5 22.5 20.50
22.50
21.55
0.88
3
TDS 11.70 10.20 11.20 12.60 10.20
12.60
11.43
1.00
2000
Na 20.06 15.8 14.72 13.8 13.80
20.06
16.10
2.77
200
K 49.07 64.00 65.29 50.83 49.07
65.29
57.30
8.53
45
Ca 14.86 15.00 10.8 20.00 10.80
20.00
15.17
3.77
400
Mg 57.13 48.20 46.48 42.7 42.70
57.13
48.63
6.12
60
B 0.34 0.31 0.35 0.37 0.31
0.37
0.34
0.03
Cl 39.28 38.10 37.28 36.57 36.57
39.28
37.81
1.16
1100
SO4 22. 64 18.12 20.64 5.76 5.76
22.64
16.79
7.58
1000
HCO3 227.09 220.00 225.09 233.02 220.00
233.02
226.30
5.38
600
CO3 66.4 45 43.8 39.00 39.00
66.40
48.55
12.18
NO3 1.05 28.52 1.05 8.06 1.05
28.52
9.67
13.00
10
All units are in mg/l except Temp (
oc) EC µs/cm, and pH (no unit)
TABLE 3.2: IONS AND THEIR MILLIEQUIVALENT (NOVEMBER, 2016 – FEBRUARY, 2017) MONTHLY
VALUES IONS NOVEMBER DECEMBER JANUARY FEBRUARY
Ca2+
0.743 0.75 0.54 1.00
Mg2+
4.682 3.95 3.81 3.50
Na+ 0.872 0.68 0.64 0.60
K+ 1.255 1.64 1.67 1.30
Cl- 1.122 1.07 1.06 1.03
SO42-
0.472 0.38 0.43 0.12
HCO3- 3.723 3.61 3.69 3.82
CO2-
3 2.213 1.50 1.46 1.30
NO3- 0.017 0.46 0.02 0.13
The ions were converted from milligram per litre (mg/l) to milliequivalent per liter (meq/L) as presented in table 3.2
ASSESSMENT OF IRRIGATION WATER QUALITIES OF ABAK RIVER, ABAK, AKWA IBOM STATE, 139
TABLE 3.3: WATER QUALITYPARAMETER INDICES FOR ABAK RIVER AND ITS SUSTAINABILITY IN IRRIGATION (NOVEMBER, 2016 – FEBRUARY, 2017)
The results of the different irrigation indices for assessing irrigation water quality of Abak River are summarized
and in presented table 3.
SODIUM ADSORPTION RATIO (SAR) The Sodium Adsorption Ratio gives a clear idea about the adsorption of sodium by the soil. It is the proportion of sodium to calcium and magnesium which affect the availability of the water to crop. The
sodium adsorption ratio of Abak River obtained in the present study within the four months (Nov. 2016 - Feb. 2017) are generally less than 9 and fall under the category of C1S1 indicating low alkali hazards and excellent irrigation water as shown on Table 3.4, Fig 3.1 Salinity Laboratory’s Staff (1954)
140 E. A. UDOM, A. E. EKPO AND S. I. OLUKA
Fig. 3.1: Classification of the analyzed water sample with respect to sodium adsorption ratio and salinity hazard
(After US Salinity Lab. (1954).
TABLE 3.4: LIMITS OF SOME PARAMETER INDICES FOR RATING WATER QUALITY AND ITS SUSTAINABILITY IN IRRIGATION
CATEGORY
EC(µµµµMHOS/CM) SAR SSP % SUSTAINABILITY FOR IRRIGATION
1. < 117 - 503 < 10 < 20 Excellent
2. 117 - 503. 61 10 - 18 20 - 40 Good
3. 503. 61 18 - 26 40 - 80 Fair
4. > 503. 61 > 26 > 80 Poor
SOLUBLE SODIUM PERCENTAGE (SSP) Sodium percentage is an import factor for rating sodium hazard. It is also used for adjudging the quality of water for agricultural purposes. High percentage sodium water for irrigation purpose may stunt the plant growth, and reduces soil permeability (Joshi et. al., 2009). The soluble sodium percentage values of Abak River Water in the study area ranged between 28.16-34.69% indicating class II and good irrigation water quality (Wilcox (1950) as shown on Table 3.4. RESIDUAL SODIUM BICARBONATE (RSBC) The concentration of bicarbonate and carbonate influence the suitability of water for irrigation purposes. The water with high RSBC has high pH. Therefore, land irrigated with such water is rendered infertile owing to the deposition of Sodium Carbonate
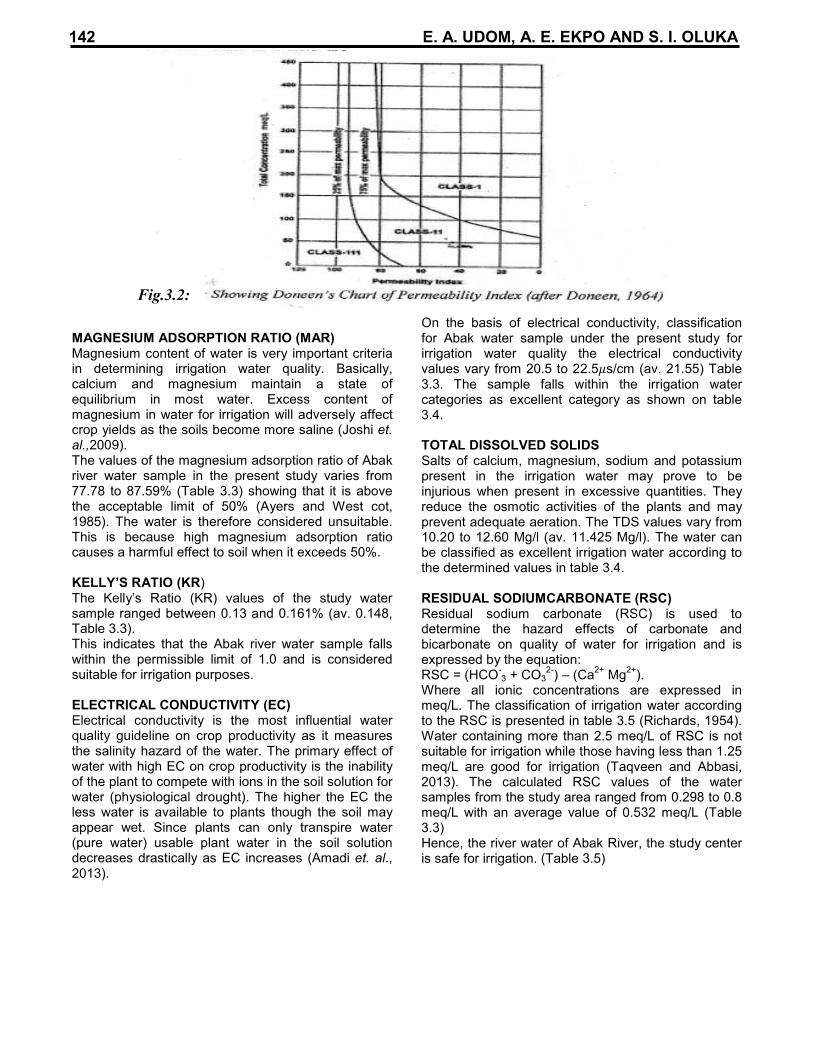
(Eaton, 1950). The residual sodium bicarbonate values of water from the study area vary 2.82 to 3.15 meq/L (Table 3.4). The residual sodium bicarbonate values are less than 5Meq/Land are therefore considered safe for irrigation (Gupta 1987, Oladeji et. al., 2012). PERMEABILITYINDEX (PI) The soil permeability is characterized by the long-term use of irrigated water and the influencing constituents are the total dissolved solids, sodium bicarbonate and the type of soil. During the present study, the permeability index values range between 3.20% to 3.98% (av. 3.698) as contained in table 3.3. The results therefore suggest that the water sample fall within class I and class II and can be regarded as good irrigation water Doneen,1964; obtained from fig 3.2
ASSESSMENT OF IRRIGATION WATER QUALITIES OF ABAK RIVER, ABAK, AKWA IBOM STATE, 141
MAGNESIUM ADSORPTION RATIO (MAR) Magnesium content of water is very important criteria in determining irrigation water quality. Basically, calcium and magnesium maintain a state of equilibrium in most water. Excess content of magnesium in water for irrigation will adversely affect crop yields as the soils become more saline (Joshi et. al.,2009). The values of the magnesium adsorption ratio of Abak river water sample in the present study varies from 77.78 to 87.59% (Table 3.3) showing that it is above the acceptable limit of 50% (Ayers and West cot, 1985). The water is therefore considered unsuitable. This is because high magnesium adsorption ratio causes a harmful effect to soil when it exceeds 50%. KELLY’S RATIO (KR) The Kelly’s Ratio (KR) values of the study water sample ranged between 0.13 and 0.161% (av. 0.148, Table 3.3). This indicates that the Abak river water sample falls within the permissible limit of 1.0 and is considered suitable for irrigation purposes. ELECTRICAL CONDUCTIVITY (EC) Electrical conductivity is the most influential water quality guideline on crop productivity as it measures the salinity hazard of the water. The primary effect of water with high EC on crop productivity is the inability of the plant to compete with ions in the soil solution for water (physiological drought). The higher the EC the less water is available to plants though the soil may appear wet. Since plants can only transpire water (pure water) usable plant water in the soil solution decreases drastically as EC increases (Amadi et. al., 2013).
On the basis of electrical conductivity, classification for Abak water sample under the present study for irrigation water quality the electrical conductivity values vary from 20.5 to 22.5�s/cm (av. 21.55) Table 3.3. The sample falls within the irrigation water categories as excellent category as shown on table 3.4. TOTAL DISSOLVED SOLIDS Salts of calcium, magnesium, sodium and potassium present in the irrigation water may prove to be injurious when present in excessive quantities. They reduce the osmotic activities of the plants and may prevent adequate aeration. The TDS values vary from 10.20 to 12.60 Mg/l (av. 11.425 Mg/l). The water can be classified as excellent irrigation water according to the determined values in table 3.4. RESIDUAL SODIUMCARBONATE (RSC) Residual sodium carbonate (RSC) is used to determine the hazard effects of carbonate and bicarbonate on quality of water for irrigation and is expressed by the equation: RSC = (HCO
-3 + CO3
2-) – (Ca
2+ Mg
2+).
Where all ionic concentrations are expressed in meq/L. The classification of irrigation water according to the RSC is presented in table 3.5 (Richards, 1954). Water containing more than 2.5 meq/L of RSC is not suitable for irrigation while those having less than 1.25 meq/L are good for irrigation (Taqveen and Abbasi, 2013). The calculated RSC values of the water samples from the study area ranged from 0.298 to 0.8 meq/L with an average value of 0.532 meq/L (Table 3.3) Hence, the river water of Abak River, the study center is safe for irrigation. (Table 3.5)
Fig.3.2:
142 E. A. UDOM, A. E. EKPO AND S. I. OLUKA
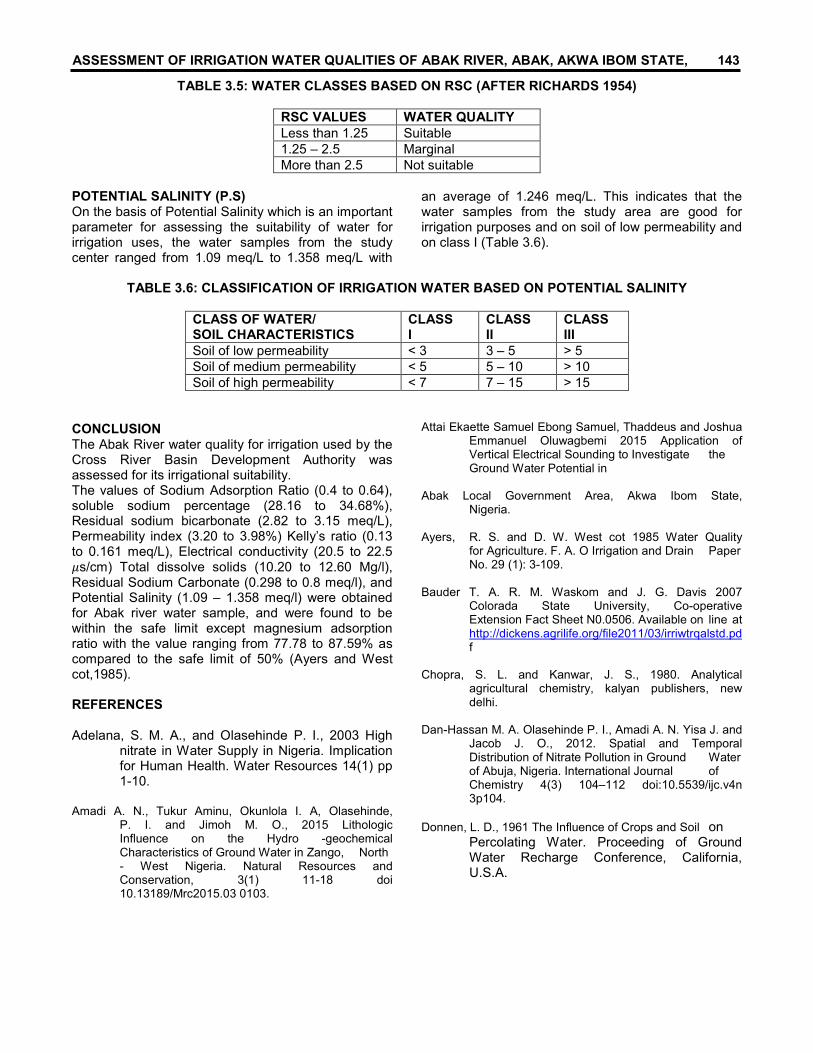
TABLE 3.5: WATER CLASSES BASED ON RSC (AFTER RICHARDS 1954)
RSC VALUES WATER QUALITY
Less than 1.25 Suitable
1.25 – 2.5 Marginal
More than 2.5 Not suitable
POTENTIAL SALINITY (P.S) On the basis of Potential Salinity which is an important parameter for assessing the suitability of water for irrigation uses, the water samples from the study center ranged from 1.09 meq/L to 1.358 meq/L with
an average of 1.246 meq/L. This indicates that the water samples from the study area are good for irrigation purposes and on soil of low permeability and on class I (Table 3.6).
TABLE 3.6: CLASSIFICATION OF IRRIGATION WATER BASED ON POTENTIAL SALINITY
CLASS OF WATER/ SOIL CHARACTERISTICS
CLASS I
CLASS II
CLASS III
Soil of low permeability < 3 3 – 5 > 5
Soil of medium permeability < 5 5 – 10 > 10
Soil of high permeability < 7 7 – 15 > 15
CONCLUSION The Abak River water quality for irrigation used by the Cross River Basin Development Authority was assessed for its irrigational suitability. The values of Sodium Adsorption Ratio (0.4 to 0.64), soluble sodium percentage (28.16 to 34.68%), Residual sodium bicarbonate (2.82 to 3.15 meq/L), Permeability index (3.20 to 3.98%) Kelly’s ratio (0.13 to 0.161 meq/L), Electrical conductivity (20.5 to 22.5 �s/cm) Total dissolve solids (10.20 to 12.60 Mg/l), Residual Sodium Carbonate (0.298 to 0.8 meq/l), and Potential Salinity (1.09 – 1.358 meq/l) were obtained for Abak river water sample, and were found to be within the safe limit except magnesium adsorption ratio with the value ranging from 77.78 to 87.59% as compared to the safe limit of 50% (Ayers and West cot,1985). REFERENCES Adelana, S. M. A., and Olasehinde P. I., 2003 High nitrate in Water Supply in Nigeria. Implication for Human Health. Water Resources 14(1) pp 1-10. Amadi A. N., Tukur Aminu, Okunlola I. A, Olasehinde, P. I. and Jimoh M. O., 2015 Lithologic Influence on the Hydro -geochemical Characteristics of Ground Water in Zango, North - West Nigeria. Natural Resources and Conservation, 3(1) 11-18 doi 10.13189/Mrc2015.03 0103.
Attai Ekaette Samuel Ebong Samuel, Thaddeus and Joshua Emmanuel Oluwagbemi 2015 Application of Vertical Electrical Sounding to Investigate the Ground Water Potential in Abak Local Government Area, Akwa Ibom State, Nigeria. Ayers, R. S. and D. W. West cot 1985 Water Quality for Agriculture. F. A. O Irrigation and Drain Paper No. 29 (1): 3-109. Bauder T. A. R. M. Waskom and J. G. Davis 2007 Colorada State University, Co-operative Extension Fact Sheet N0.0506. Available on line at http://dickens.agrilife.org/file2011/03/irriwtrqalstd.pd f Chopra, S. L. and Kanwar, J. S., 1980. Analytical agricultural chemistry, kalyan publishers, new delhi. Dan-Hassan M. A. Olasehinde P. I., Amadi A. N. Yisa J. and Jacob J. O., 2012. Spatial and Temporal Distribution of Nitrate Pollution in Ground Water of Abuja, Nigeria. International Journal of Chemistry 4(3) 104–112 doi:10.5539/ijc.v4n 3p104.
Donnen, L. D., 1961 The Influence of Crops and Soil on Percolating Water. Proceeding of Ground Water Recharge Conference, California, U.S.A.
ASSESSMENT OF IRRIGATION WATER QUALITIES OF ABAK RIVER, ABAK, AKWA IBOM STATE, 143
Doneen, L. D., 1964 Note on Water Quality in Agriculture Published as a Water Science and Engineering Paper 4001, Department of Water Science Engineering University of California. Dukes, M. D., L. Zotarelli, G. D. Liu and E. H. Simonne 2005 Principles and Practices of Irrigation Management for Vegetables UF/IAS Extension AE 260. Eaton, F. M., 1950. Significance of Carbonate in Irrigation Waters Soil Sci. 67 (3): 126 – 133. Gupta, S. K. and I. C. Gupta, 1987 Management of Saline Soils and Water. Oxford and IBH Publication Coy, New Delhi, India, pp 399. Hopkins, B. G., Horneck, D. A., Steven, R. G., Ellsworth, J. W., and Sullivan D. M., 2007 Managing Irrigation Water Quality for Crop Production in the Pacific Northwest. Pacific Northwest Extension Publication.PNW 597-E. Joshi, D. M., A. Kumar and N. Agrawal 2009. Assessment of the Irrigation Water Quality of River Ganga in Haridwar District, India. J. Chem, 2(2): 285-291. Kelly W. P., 1963 Use of Saline Irrigation Water, Soil Sci 95 (4) 355-391. Longenecker D. E. and P. F. Lyerly 1974 B-876 Control of Soluble Salts in Farming and Gardening. Texas Agricultural Experiment Station, Texas A&M University System, College Station. June 36pp. Malin F., Max C., Finlayson, Line J. G., 2007 Agriculture, Water and Ecosystem: Avoiding the Costs of Going too far. Natural Ecosystem Services. Peter Grundy, United Kingdom. Megersa Girma and Abdulahi, Jemal 2005 Irrigation System in Israel: A Review Internal Journal of Water Resources and Environmental Engineering. Available on line http://www.academicjoumais.org/UWREE. Nigeria National Census 2006 Official Website of the Akwa Ibom State Government. Oladeji, S. O. Adewoye, A. O. and Adegbola A. A. 2012.Suitability Assessment of Ground Water Resources for Irrigation around Otte Village, Kwara State, Nigeria. Int. J. of Applied Sciences and Engineering Research Vol.1 Issue 3, 434.445.
Onoja, P. K. Odin, E. M. and Ochala A. U., 2013 Physicochemi- cal Studies and Bacteriological Assay of Sachet Water, Water Samples Marketed in Kogi State University Compound, Anyigba. International Journal of Analyti- cal and Bio Analytical Chemistry, 3(4): 147-151. Raghunath, I. M., 1987 Ground Water 2
ndEdn.Wiley
Eastern Ltd. New Delhi, India. Richards L. A., 1954 Diagnosis and Improvement of Saline and Alkali Soils. Agric Handbook 60, USDA and IBH Pub. Coy Ltd, New Delhi, India, pp: 98-99. Saleh, Mohmoud A., Emmanuel Ewane, Joseph Jones and Bobby L. Wilson 2001 Chemical Evaluation of Commercial Bottled Drinking water from Egypt, Journal of Food Composition and Analysis 2001 14, 127d152. doi 10.006/jca 2000. 0858. Available on Line at http:/www.idealibrary.com Salinity Laboratory Staff 1954. Diagnosis and Improvement of Saline and Alkali Soils. Department of Agriculture, US Handbook 60. Tanji, K. K., 1990 Agricultural Salinity Assessment and Management. America Society of Civil Engineers. Taqueem, A. K. and Abbasi, A. M., 2013 Synthesis of Parameters Used to Check the Suitability of Water for Irrigation Purposes. International J. of Environmental Science, Vol.3 No.6, 2030 – 2039. Todd, D. K., 1995 Ground Water Hydrology. J. 3
rdEdn.
Wiley and Sons Inc, New York, U.S. UNEP 2001 The Mesopotamian Marshlands Demise of an Ecosystem. UNEP/DEW A/TR.01- 3.UNEP Division of Early Warning and Assessment/GRID–Europe. Geneva in co- operation with GRID Sioux Falls and the Regional Office for West Asia (ROWA) Geneva http://www.gridunep.ch/activities/sustainable/ tigris/Messopotamia Pdf accessed on 9 Sept., 2016. WHO 2006 Guideline for Drinking Water Quality Vol.1 Recommendations. World Health Organization. Geneva pp131. Wikipedia 2016 Wilcox, L. U. 1950 Classification and Use of Irrigation Waters. Department of Agriculture, United States, Circular No.696 Washington D. C. pp:16