Page 1
Auto-acoustic compaction in steady shear flows: Experimental evidence for 1
suppression of shear dilatancy by internal acoustic vibration 2
Nicholas J. van der Elst1, Emily E. Brodsky1, Pierre-Yves Le Bas2 and Paul A. Johnson2 3
1Dept. of Earth and Planet. Science, 1156 High St., Univ. of California, Santa Cruz, California 95060 4 2Geophysics Group, Los Alamos National Laboratory, P.O. Box 1663, Los Alamos, New Mexico 87545 5
6
Abstract: Granular shear flows are intrinsic to many geophysical processes, ranging from 7
landslides and debris flows to earthquake rupture on gouge-filled faults. The rheology of 8
a granular flow depends strongly on the boundary conditions and shear rate. Earthquake 9
rupture involves a transition from quasi-static to rapid shear rates. Understanding the 10
processes controlling the transitional rheology is crucial for understanding the rupture 11
process and the coseismic strength of faults. Here we explore the transition 12
experimentally using a commercial torsional rheometer. We measure the dilatation of a 13
steady shear flow at velocities between 10-3 and 102 cm/s, and observe that dilatation is 14
suppressed at intermediate velocities (0.1 - 10 cm/s) for angular particles, but not for 15
smooth glass beads. The maximum reduction in thickness is on the order of 10% of the 16
active shear zone thickness, and scales with the amplitude of shear-generated acoustic 17
vibration. By examining the response to externally applied vibration, we show that the 18
suppression of dilatancy reflects a feedback between internally generated acoustic 19
vibration and granular rheology. We link this phenomenon to acoustic compaction of a 20
dilated granular medium, and formulate an empirical model for the steady-state thickness 21
of a shear-zone in which shear-induced dilatation is balanced by a newly-identified 22
mechanism we call auto-acoustic compaction. This mechanism is activated when the 23
acoustic pressure is on the order of the confining pressure, and results in a velocity-24
Page 2
weakening granular flow regime at shear rates four orders of magnitude below those 25
previously associated with the transition out of quasi-static granular flow. 26
27
1. Introduction 28
Frictional sliding processes in geophysics often involve granular shear flows at the 29
sliding interface. This is true for landslides and debris flows, as well as for earthquake 30
ruptures within granulated damage zones or gouge-filled faults. The frictional strength in 31
these contexts is controlled by the rheology of the granular flow, which has a strong 32
dependence on shear rate and boundary conditions [Campbell, 2006; Clement, 1999; 33
Iverson, 1997; Savage, 1984]. 34
35
For different shear rates, confining stresses, and packing densities, the description of a 36
granular flow can range from “solid-like” to “gas-like” [Jaeger et al., 1996], albeit with 37
complicated second-order behavior in each regime. In the solid-like or quasi-static 38
regime, forces are transmitted elastically through a network of grain contacts, called force 39
chains, and the shear and normal stresses at the boundaries are related to the stiffness and 40
orientations of these chains (Fig. 1a) [Majmudar and Behringer, 2005]. In this regime, 41
force chains are continually created and destroyed through shearing, but the rate of 42
buckling and destruction of old force chains is equal to the rate of creation of new ones, 43
and the shear resistance is, to first order, independent of the shear rate (Fig 1c). This 44
results in a solid-like frictional rheology. In the gas-like, inertial flow regime, stresses 45
are supported through grain-grain or grain-boundary collisions, analogous to a kinetic gas 46
model (Fig. 1b). The shear and normal stresses are related to the particle momentum 47
Page 3
transfer rate, resulting in a power-law viscous-like rheology (Fig. 1c) [Bagnold, 1954; 48
Campbell, 2005]. 49
50
Earthquake rupture involves a transition between quasi-static and rapid inertial shear, in 51
which vibration and momentum become important for the rheology of the flow. A 52
description of granular rheology in this transitional regime is therefore required for a full 53
understanding of the process of rupture nucleation and propagation. However, our 54
understanding of the rheology of dense, rapid granular flows is far from complete. 55
56
Some of the dificulty in describing the rheology of a dense, rapid granular flow arises 57
from the athermal nature of the granular medium. Unlike a traditional gas or liquid, a 58
granular material does not explore particle configurations and approach an equilibrium 59
state in the absence of an external energy source [Jaeger et al., 1996]. Consequently, the 60
rheology of a granular medium depends strongly on the detailed configuration of grains. 61
Under the same pressure or volume conditions, some grain (packing) configurations can 62
be very stiff, while others may be soft or ‘fluidized.’ A striking example of this 63
dependency on grain configuration is the phenomenon of jamming/unjamming [Liu and 64
Nagel, 2010] where a granular medium transitions dramatically from a solid-like to a 65
fluid-like phase, or vice-versa, under small perturbations to particle configuration or 66
loading direction [Aharonov and Sparks, 1999; Cates et al., 1998; Liu and Nagel, 1998]. 67
68
A good way to un-jam a granular material is to add vibration. This provides an external 69
energy source that allows a granular system to explore packing configurations. Vibration 70
Page 4
usually leads to a more compact configuration, depending on the initial packing density 71
and the amplitude of the vibration [Knight et al., 1995; Nowak et al., 1997]. Another 72
source of external energy is imposed shear. Under shear, a granular medium may dilate 73
or compact, depending on its starting configuration. Starting from a dense state, such as 74
random close packing, it must dilate in order to allow geometrically frustrated grains to 75
move past each other (i.e. un-jam) [Lu et al., 2007; Marone, 1991; Reynolds, 1885]. 76
Acoustic vibration and imposed shear are thus two sources of external energy that tend to 77
drive the packing density of a granular system in opposite directions. 78
79
For gouge-filled faults, both of these energy sources may be present, with acoustic energy 80
generated during rupture, or arriving in seismic waves from nearby earthquakes. In 81
granular shear experiments, bursts of acoustic vibration can trigger stick-slip events or 82
generate lasting changes in rheology [Johnson et al., 2008]. Acoustic fluidization, in 83
which scattered wave energy produces transient reductions in fault normal stress, has 84
been proposed as a mechanism for reducing shear resistance during earthquake slip 85
[Melosh, 1996]. 86
87
Here we perform experiments that explore the behavior of a sheared granular medium 88
when the shearing itself generates acoustic vibration. Our starting point is a recent 89
experiment that showed that the dilatation of a steady, shear-driven flow is non-90
monotonic with respect to shear velocity [Lu et al., 2007]. That is, at velocities 91
intermediate between quasi-static and grain-inertial flow (the transitional regime, Fig 1c), 92
dilatation of the shear zone is markedly reduced. This behavior is not anticipated by 93
Page 5
theoretical treatments of granular flow, which predict a monotonic increase of dilatation 94
with shear rate [Bagnold, 1954; Campbell, 1990; 2006; Clement, 1999] nor by dilatation 95
experiments carried out at lower shear rates [Marone et al., 1990; Marone, 1991]. 96
Numerical experiments using spherical or circular particles also fail to anticipate this 97
transitional compaction [da Cruz et al., 2005; GDR MiDi, 2004]. This phenomenon is 98
only observed for highly angular particles, and is negligible or non-existent for smooth 99
particles. 100
101
We propose in this paper that this intermediate shear-rate thinning can be explained as 102
auto-acoustic compaction. At moderate shear rates, grain interactions generate acoustic 103
vibration that causes compaction of shear-induced dilation. The tradeoff between shear-104
induced dilation and shear-induced acoustic compaction results in a shear-rate dependent 105
steady-state thickness of the shear zone. 106
107
In this study, we reproduce the observations of Lu et al., [2007], and compare the shear-108
induced compaction (weakening) at intermediate shear rates to the compaction of a 109
sheared granular layer under externally applied acoustic vibration. We first measure the 110
steady-state thickness of a sheared granular material over a range of shear rates. We take 111
the additional step of recording the amplitude of acoustic emissions over the range of 112
experimental velocities. We then apply similar amplitudes of acoustic vibration using an 113
external vibration transducer and characterize the effect on the steady-state thickness of 114
the actively shearing layer. We find that acoustic vibration reduces the steady-state 115
thickness of the shear zone in the same way, regardless of whether it is externally or 116
Page 6
internally generated. We also perform acoustic pulse and transient shear-rate step 117
experiments to combine the time-dependent evolution of shear dilation and acoustic 118
compaction into a quantitative model of steady-state layer thickness. The experiments 119
motivate a scaling analysis that allows prediction to be made about behavior at depth. 120
121
2. Method 122
2.1 Experimental apparatus 123
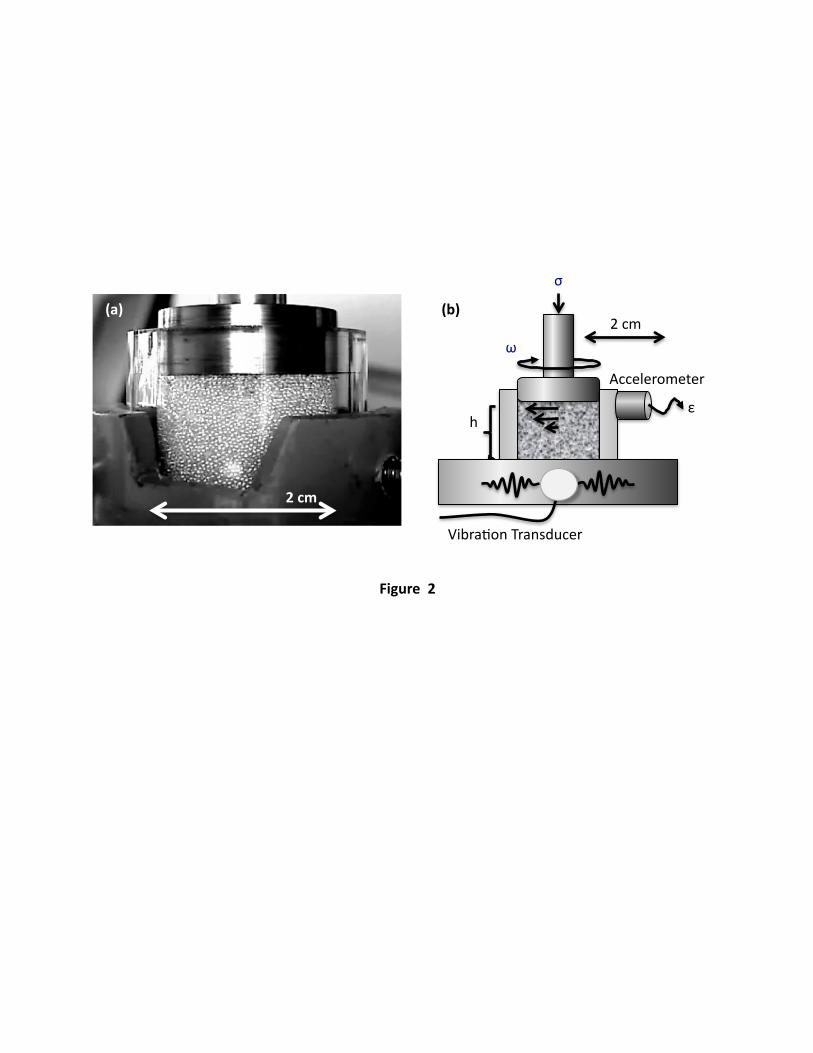
The experimental apparatus is a TA Instruments AR2000ex commercial torsional 124
rheometer with rotating parallel plate geometry (Fig. 2). This instrument is capable of 125
sensitive measurement and control of torque, angular velocity, normal stress, and layer 126
thickness, and covers a large range of velocities (~10-5 to 300 rad/s), but is limited in the 127
magnitude of the applied forces (50 N normal force, 0.2 N-m torque). This is nearly 128
identical to the instrument used in Lu et al. [2007]. 129
130
The granular sample is housed in a quartz glass cylindrical jacket with dimensions 19 mm 131
diameter by 15 mm height (Fig. 2). A layer of angular sand grains is epoxied to the base 132
of the chamber and to the upper rotor, to force internal shear rather than slip at the 133
boundaries. The quartz cylinder is filled to ~12 mm depth, so that the rotor plate is 134
jacketed as well. Friction between the rotor and the quartz jacket is minimized by 135
carefully centering the sample. Since the primary observation of interest in these 136
experiments is the sample thickness, the friction between the rotor and jacket is relatively 137
unimportant. 138
139
Page 7
2.2 Granular Media 140
We test two different granular materials with different grain shapes (Fig. 3), but 141
equivalent sizes and densities: spherical glass beads (mean diameter: 350 µm) and 142
angular beach sand (from Cowell’s Beach next to the Santa Cruz wharf) (range: 250-143
500 µm, mean: 350 µm). The beach sand is chosen for its high angularity and high 144
fracture resistance. The composition of the sand is roughly 44% quartz, 37% lithics, and 145
19% feldspars [Paull et al., 2005]. The composition of the heavy minerals and lithic 146
fragments is detailed by Hutton [1959]. 147
148
2.3 Acoustic Vibration 149
External acoustic vibration is produced by a ceramic transducer (PZT-5) affixed to the 150
base plate of the rheometer, adjacent to the sample chamber. An accelerometer (Bruel 151
and Kjaer 4373 charge accelerometer) attached directly to the cylindrical jacket allows 152
measurement of the acoustic acceleration within the sample, from which the strain 153
amplitude can be calculated. The accelerometer has a flat response up to 35 kHz. In 154
order to achieve high strain amplitude with a small source transducer, we vibrate at the 155
resonant frequency of the mechanical system (found to be 40.2 kHz). Note that this is the 156
natural frequency of the entire apparatus, not the sample chamber itself. Detailed studies 157
of the shear-generated acoustic spectrum and the frequency dependence of the sample 158
response are beyond the scope of this study. 159
160
2.4 Experimental Procedure 1: Velocity ramps 161
Page 8
The primary experiment consists of a suite of velocity steps between an angular velocity 162
of 10-3 to 100 rad/s (9.5×10⁻⁴ to 95 cm/s at the outer rim of the rotor) under controlled 163
normal stress, and we report sample thickness. The velocity is incremented gradually 164
from slow to fast and fast to slow, multiple times per sample. The repeated velocity 165
ramps extend the work of Lu et al. [2007], who focused mostly on a single velocity ramp 166
per sample. Each velocity step lasts 20 seconds, and the reported thickness is averaged 167
over the last 10 seconds of each step. The duration of the steps is chosen to allow the 168
shear zone to evolve to a new steady-state thickness value after the small step in velocity. 169
Using a longer step duration does not change the results. Throughout this paper, we refer 170
to this experimental procedure as a velocity ramp, although in reality it consists of small 171
discrete velocity steps, run to steady-state. 172
173
We first run the velocity ramp in the absence of acoustic vibration to establish the 174
baseline steady-state thickness of the shear zone as a function of shear rate. During these 175
experiments, we record the amplitude of acoustic vibration produced internally by grain 176
interactions during shearing. We then perform velocity ramps in the presence of constant 177
amplitude external vibration of similar amplitude and examine the effect on the steady-178
state thickness of the shearing sample. 179
180
2.5 Experimental Procedure 2: Acoustic pulses and shear-rate steps 181
In the second experiment we subject the sample to acoustic pulses and sudden velocity 182
steps. We fit the resulting compaction as a function of time, and use this equation to 183
match the steady-state thickness observations from the velocity ramp experiments. We 184
Page 9
also compare the magnitude of compaction produced by similar amplitude external and 185
shear-induced acoustic vibration. 186
187
In the acoustic pulse experiment we shear the sample at a slow, constant rate of 0.01 rad/s 188
to minimize internally generated vibration and shear dilatation, and then introduce 60-189
second pulses of acoustic vibration at various amplitudes. In the shear-rate step 190
experiment, the sample is sheared at a constant rate of 0.1 rad/s, and then subjected to 60-191
second jumps in shear rate. The amplitude of the shear-induced acoustic vibration is 192
captured by the accelerometer, allowing us to compare the magnitude of compaction 193
under equivalent-amplitude external and shear-induced acoustic vibration. 194
195
The velocity ramp experiments are summarized in Table 1, and the pulse experiments are 196
summarized in Table 2. 197
198
2.6 Boundary conditions and relation to controlled volume experiments 199
All experiments are carried out under controlled normal stress conditions. Normal stress 200
is maintained by the rheometer controller software through adjustment of the sample 201
thickness. These experiments explore the non-fracture deformation regime (in which 202
strain is accommodated primarily through grain rolling and sliding, rather than 203
cataclasis), over a range of velocities that includes both quasi-static behavior and inertial 204
behavior where collisions between grains become important. To reach the inertial 205
granular flow regime with this apparatus, the normal stress must be limited to < 10 kPa. 206
207
Page 10
We employ constant normal stress rather than constant volume boundary conditions 208
because the large variations in shear zone thickness would otherwise result in either 209
decoupling of the sample during compaction phases, or locking up of the mechanical 210
drive during dilatation. However, qualitatively similar results are obtained when 211
measuring the evolution of normal stress under constant volume conditions [Lu et al., 212
2007]. 213
214
The correspondence between normal stress and layer thickness for alternate boundary 215
conditions is a consequence of the cyclic rule, which states the relationship between the 216
partial derivatives of a three variable system 217
∂V∂ γ
⎛⎝⎜
⎞⎠⎟ σ
= −∂V∂σ
⎛⎝⎜
⎞⎠⎟ γ
dσd γ
⎛⎝⎜
⎞⎠⎟V
. (1) 218
The change in volume or layer thickness is related to the change in stress with shear rate 219
through the compressibility term ∂V ∂σ( ) γ . Layer compaction under constant load thus 220
implies normal stress reduction under constant volume [Lu et al., 2007]. 221
222
3. Results 223
3.1. Velocity ramps – shear induced compaction 224
In the absence of acoustic vibration, the sample thickness is a well-defined, reproducible 225
function of shear rate (Fig. 4), regardless of whether the velocity ramp is increasing or 226
decreasing. Both angular sand and smooth glass beads deform with a thickness that is 227
independent of shear-rate at very low shear rates (10-3 - 10-1 cm/s), and show strong 228
dilation at very high shear rates (>10 cm/s). However, the behavior of the two granular 229
Page 11
media differs greatly at intermediate shear rates (0.1-7 cm/s), where the thickness of the 230
angular sand decreases markedly with shear rate. The glass beads show only a hint of 231
this thinning at intermediate shear-rates. 232
233
The reversible behavior shown in Figure 4 follows an initial run-in phase that consists of 234
a relatively gradual compaction trend that diminishes with total displacement, and 235
essentially vanishes over a few velocity ramp cycles. Most of the experiments are 236
reported after this run-in phase is complete, but in one velocity ramp experiment we 237
subtract a linear trend with displacement to remove the tail end of the run-in phase. The 238
velocity ramp experiments are summarized in Table 1. In the following, we focus 239
exclusively on the reversible and repeatable component of compaction, which we 240
interpret as reflecting thickness changes in the actively shearing layer (Appendix A). 241
242
The dilatational behavior of the granular media at either end of the velocity range can be 243
understood in terms of the end-members of granular flow (Fig. 1). In granular physics, 244
the flow regime is thought to be determined by the dimensionless inertial number, which 245
compares the magnitude of the grain inertial stress to the confining stress [Bagnold, 1954; 246
Bocquet et al., 2001; Campbell, 2006; Iverson, 1997; Savage, 1984]. As discussed 247
above, at low shear rates grain inertial stresses are very small, and stresses are carried 248
frictionally or elastically along force chains/networks. In this regime, shear and normal 249
stresses and sample thickness are independent of shear rate [Thompson and Grest, 1991]. 250
At high shear rates grain inertial stresses are of similar order as the confining stress, 251
Page 12
supporting dilation of the shear zone. The thickness of the sample is then strongly 252
dependent on the shear rate. 253
254
The glass beads show a relatively monotonic transition between the regimes, where the 255
thickness of the sample is constant in the quasi-static regime, and then increases as the 256
sample enters the grain inertial regime (Fig. 4). For the angular sand, complex behavior 257
is observed that is not anticipated by either end-member granular flow regime. At 258
intermediate shear rates there is a robust reduction in steady-state layer thickness, 259
reproducing the findings of Lu et al., [2007]. This transitional compaction, on the order 260
of 50 µm at maximum, occurs regardless of the direction of the velocity ramp. The 261
active shear zone thickness is on the order of a few grains, with a scale depth of ~600 µm 262
(Appendix A). The maximum compaction is therefore on the order of 10% of the shear 263
zone thickness. 264
265
3.2 Velocity ramps with acoustic vibration 266
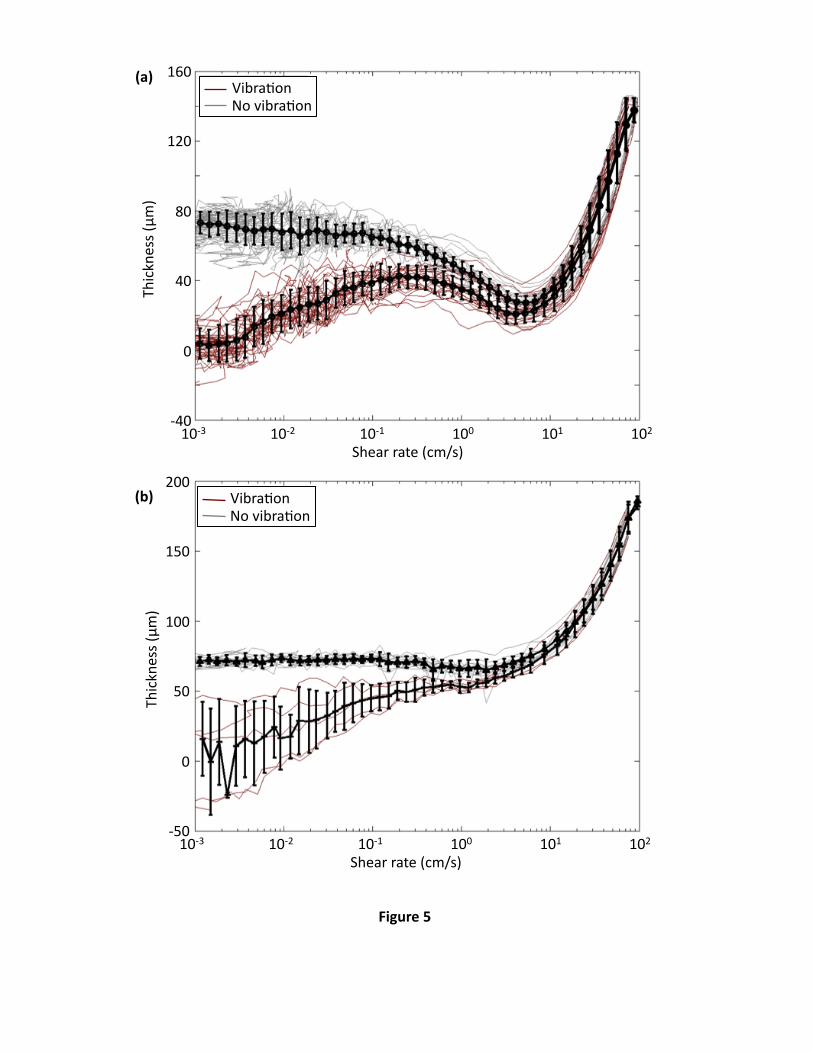
We next perform velocity ramps in the presence of external vibration (Fig. 5). The 267
introduction of acoustic vibration has two effects. First, it causes additional irreversible 268
compaction that decays linearly with log time from the start of the vibration, similar to 269
the run-in phase in the absence of vibration (Fig. 6). Second, it induces a strong 270
dependence between steady state thickness and shear rate at low shear rates that was not 271
seen in the previous experiment. This low shear rate behavior is seen for the glass beads 272
as well as the angular sand (Fig. 5b). At low shear rates, the layer thickness is 273
significantly reduced compared to the non-vibrated case. This reduced thickness is again 274
Page 13
a steady-state value, and is reproducible regardless of whether the velocity ramp is 275
increasing or decreasing. The layer thickness increases with shear rate, up to the 276
transitional regime for angular sand (Fig. 5a). At higher shear rates, there is negligible 277
difference between the experiments with and without external acoustic vibration. The 278
vibrational compaction of the sample at low shear rates is reminiscent of acoustic 279
vibration experiments performed in the absence of shear, in which vibration is observed 280
to induce rapid compaction that is recoverable over long time scales [Johnson and Jia, 281
2005]. 282
283
A representative acoustic experiment (VRS3, Table 1) is shown as a function of 284
experimental time in Figure 6, to give a better sense of the total evolution of sample 285
thickness over the course of multiple velocity ramps. This illustrates the irreversible 286
compaction during the acoustic vibration, and shows that the additional dip at low shear 287
rates in the vibration experiment is not an artifact of removing the irreversible trend. For 288
the example in Figure 6, the sample is first sheared through several velocity ramps in the 289
absence of acoustic vibration to establish the baseline shear-rate dependent behavior. 290
The pattern of thickness vs. shear rate (c.f. Figure 5) is traced and then retraced in reverse 291
as velocity is varied over experimental time. Acoustic vibration is then switched on and 292
the sample is run through several more velocity ramp cycles. Finally, vibration is 293
switched off and the sample is allowed to recover back to its original thickness vs. shear-294
rate behavior. 295
296
Page 14
For the constant normal load boundary conditions used here, this compaction is not 297
accompanied by a shear stress decrease, i.e. the coefficient of friction remains the same. 298
If the experiment were carried out at constant volume, this compaction would correspond 299
to a reduction in both normal and shear stress. 300
301
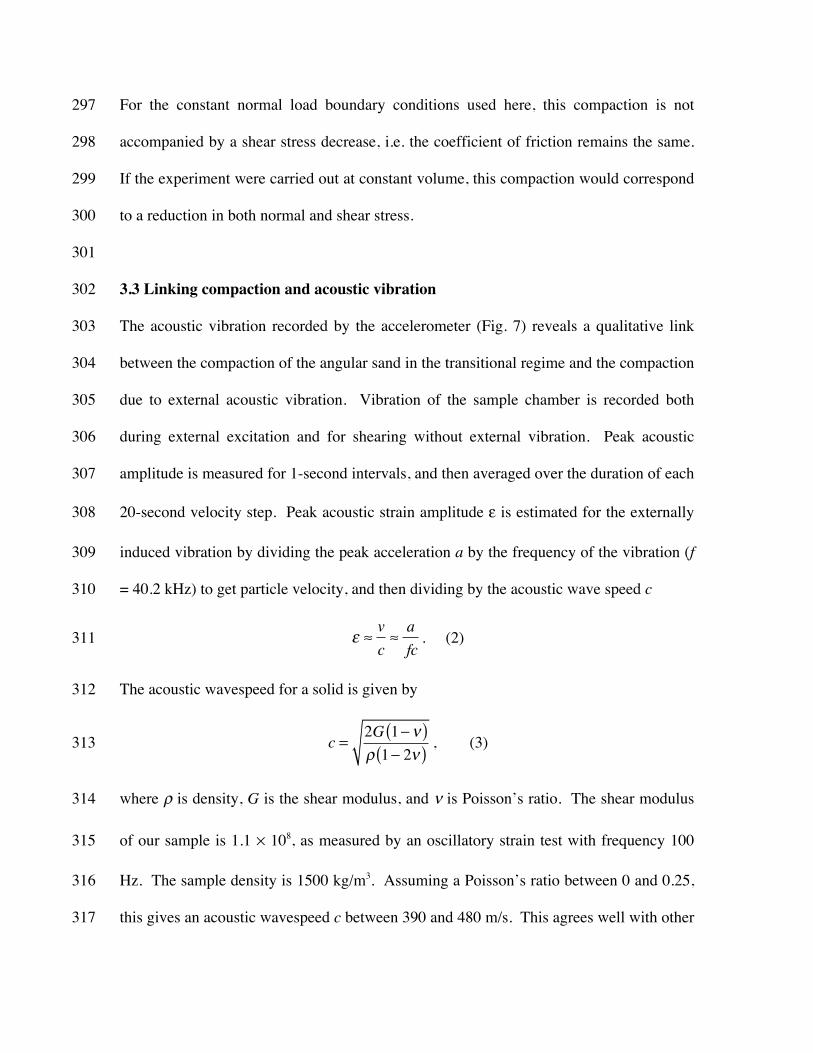
3.3 Linking compaction and acoustic vibration 302
The acoustic vibration recorded by the accelerometer (Fig. 7) reveals a qualitative link 303
between the compaction of the angular sand in the transitional regime and the compaction 304
due to external acoustic vibration. Vibration of the sample chamber is recorded both 305
during external excitation and for shearing without external vibration. Peak acoustic 306
amplitude is measured for 1-second intervals, and then averaged over the duration of each 307
20-second velocity step. Peak acoustic strain amplitude ε is estimated for the externally 308
induced vibration by dividing the peak acceleration a by the frequency of the vibration (f 309
= 40.2 kHz) to get particle velocity, and then dividing by the acoustic wave speed c 310
ε ≈ vc≈afc
. (2) 311
The acoustic wavespeed for a solid is given by 312
c =2G 1−ν( )ρ 1− 2ν( ) , (3) 313
where ρ is density, G is the shear modulus, and ν is Poisson’s ratio. The shear modulus 314
of our sample is 1.1 × 10⁸, as measured by an oscillatory strain test with frequency 100 315
Hz. The sample density is 1500 kg/m3. Assuming a Poisson’s ratio between 0 and 0.25, 316
this gives an acoustic wavespeed c between 390 and 480 m/s. This agrees well with other 317
Page 15
experiments on acoustic travel time in granular media, extrapolated to slightly lower 318
pressures [Coghill and Giang, 2011; Jia et al., 1999], as well as with theoretical 319
predictions using effective medium theory [Makse et al., 2004; Walton, 1987]. 320
321
Figure 7 shows several suggestive features linking steady-state compaction to acoustic 322
amplitude. First, the beginning of the transitional compaction for angular sand begins 323
when internally produced acoustic vibration becomes detectable. The amplitude for glass 324
beads is smaller at this shear rate, consistent with the much smaller transitional thinning. 325
Second, at high shear rates, the internally generated vibration overwhelms the external 326
vibration such that there is no difference in the recorded vibration amplitude with or 327
without external vibration. This corresponds to the joining of the thickness vs. velocity 328
curves from the two experiments (Fig. 5). These observations suggest that acoustic 329
vibration produces compaction in a similar way regardless of whether the vibration is 330
externally or internally generated. 331
332
The rollover in amplitude at higher shear rates (Fig. 7) is due to the fact that the recorded 333
peak amplitude begins to clip at higher shear rates. To get a more robust estimate of the 334
scaling of vibration amplitude with shear rate, we also compute the signal power of the 335
shear-induced vibration signal for angular sand (Fig. 8). Power is computed from 336
periodograms in a pass band between 1 and 35 kHz. This pass band avoids instrument 337
and electronic noise at low frequencies and resonance peaks at higher frequencies (where 338
the amplitude clips). The signal power is defined as the integral of the spectrum within 339
the pass band [Stearns, 2003]. Shear-induced acoustic power increases linearly with 340
Page 16
shear rate (Fig. 8). We will see in a subsequent section that the compaction magnitude 341
also increases linearly with shear rate, indicating a correlation between acoustic power 342
and compaction. 343
344
3.4 A qualitative model for shear zone thickness 345
These observations suggest a qualitative model for the steady state thickness of a sheared 346
layer in the presence of acoustic vibration. Both acoustic vibration and shear 347
displacement provide external energy and drive the system to explore packing densities, 348
but in opposite directions and with different timescales. Acoustic vibration produces 349
compaction in the shear zone at a rate proportional to the dilation beyond random close 350
packing, while shear deformation continually renews contacts and re-dilates the sample at 351
a rate proportional to the compaction below the critical dilatancy required for shearing. 352
At some thickness, these two mechanisms are balanced, and a steady state is reached. 353
354
These ingredients qualitatively explain the shear-rate dependent behavior seen in Figure 355
5. At low shear rates, dilation is slow, and acoustic compaction has a relatively long time 356
period over which to operate. At somewhat higher shear rates, dilation becomes more 357
rapid, and steady-state compaction is reduced. At even higher shear rates, additional 358
acoustic energy is produced by the shearing itself (Fig. 7), driving renewed acoustic 359
compaction of the shearing layer. This is most pronounced for angular sand grains, 360
which generate high amplitude acoustic vibrations during shear, but is also noticeable for 361
the quieter smooth glass beads. Eventually, grain inertial effects dominate the dilatation, 362
and shear dilatancy and acoustic compaction become irrelevant. 363
Page 17
364
To develop a more quantitative model of the steady-state shear zone thickness, we now 365
investigate the time dependent evolution of thickness in the presence of externally 366
applied acoustic vibration and internally generated vibration arising from shear-rate 367
pulses. This investigation will constrain the rate of acoustic compaction. Combined with 368
a measurement of the rate of shear dilatation, a prediction can be made for the steady-369
state thickness as a function of shear rate. 370
371
3.5 Acoustic pulse experiments 372
In the externally applied vibration pulse experiments, the angular sand is sheared at a 373
constant 0.01 rad/s and subjected to 60-second bursts of acoustic vibration, after which it 374
is allowed to recover for up to 10 minutes (Fig. 9). The bursts are repeated 5-10 times for 375
each acoustic amplitude in order to characterize precision. The experiments are 376
summarized in Table 2. The pulses of acoustic vibration produce compaction in the 377
angular sand that increases with the amplitude of the pulse. After cessation of the 378
acoustic burst, the sample recovers a significant component of the thickness that was lost 379
during the acoustic burst, over ~100 seconds. 380
381
The evolution of thickness h during compaction over the acoustic burst is fit with a 382
logarithmic function of time t 383
h t( ) = h0 − b logtτ − +1⎛
⎝⎜⎞⎠⎟ , (4) 384
Page 18
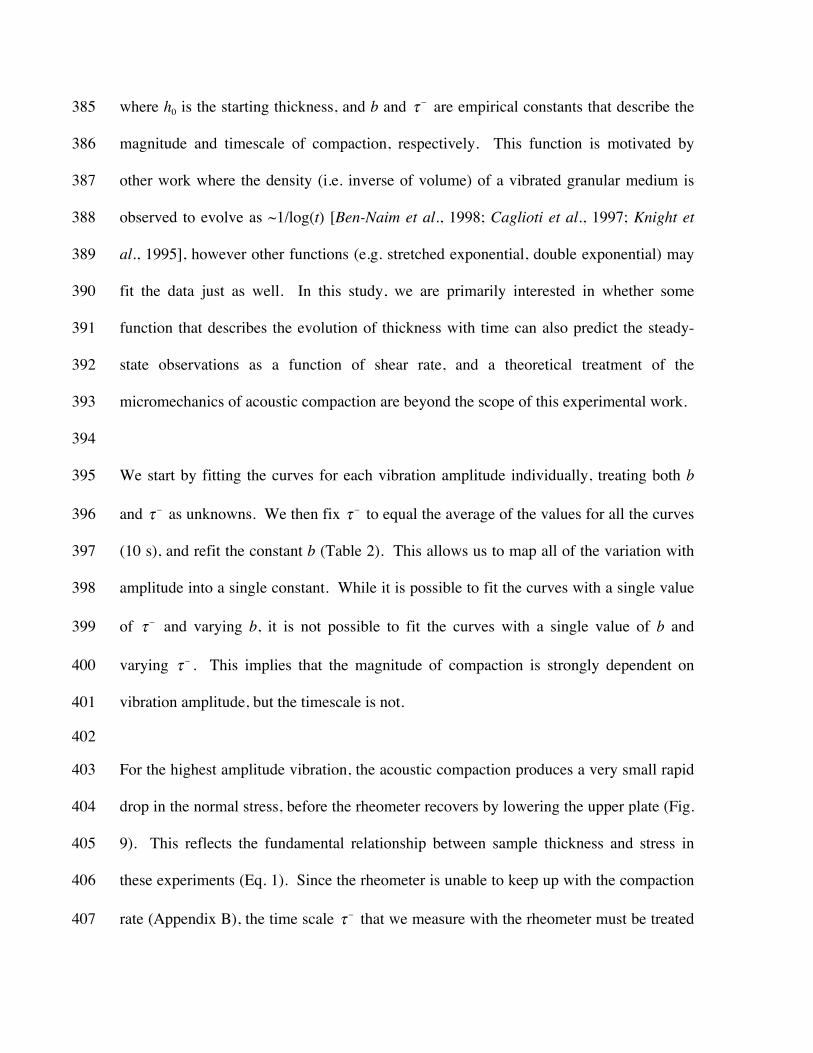
where h0 is the starting thickness, and b and τ − are empirical constants that describe the 385
magnitude and timescale of compaction, respectively. This function is motivated by 386
other work where the density (i.e. inverse of volume) of a vibrated granular medium is 387
observed to evolve as ~1/log(t) [Ben-Naim et al., 1998; Caglioti et al., 1997; Knight et 388
al., 1995], however other functions (e.g. stretched exponential, double exponential) may 389
fit the data just as well. In this study, we are primarily interested in whether some 390
function that describes the evolution of thickness with time can also predict the steady-391
state observations as a function of shear rate, and a theoretical treatment of the 392
micromechanics of acoustic compaction are beyond the scope of this experimental work. 393
394
We start by fitting the curves for each vibration amplitude individually, treating both b 395
and τ − as unknowns. We then fix τ − to equal the average of the values for all the curves 396
(10 s), and refit the constant b (Table 2). This allows us to map all of the variation with 397
amplitude into a single constant. While it is possible to fit the curves with a single value 398
of τ − and varying b, it is not possible to fit the curves with a single value of b and 399
varying τ − . This implies that the magnitude of compaction is strongly dependent on 400
vibration amplitude, but the timescale is not. 401
402
For the highest amplitude vibration, the acoustic compaction produces a very small rapid 403
drop in the normal stress, before the rheometer recovers by lowering the upper plate (Fig. 404
9). This reflects the fundamental relationship between sample thickness and stress in 405
these experiments (Eq. 1). Since the rheometer is unable to keep up with the compaction 406
rate (Appendix B), the time scale τ − that we measure with the rheometer must be treated 407
Page 19
as an upper bound. We will eventually solve for this timescale more accurately by fitting 408
the steady-state velocity ramp experiments. This effect is relatively negligible for the 409
small-amplitude external vibration experiments, but will be considerably larger for the 410
shear-rate pulses examined in the next section. 411
412
413
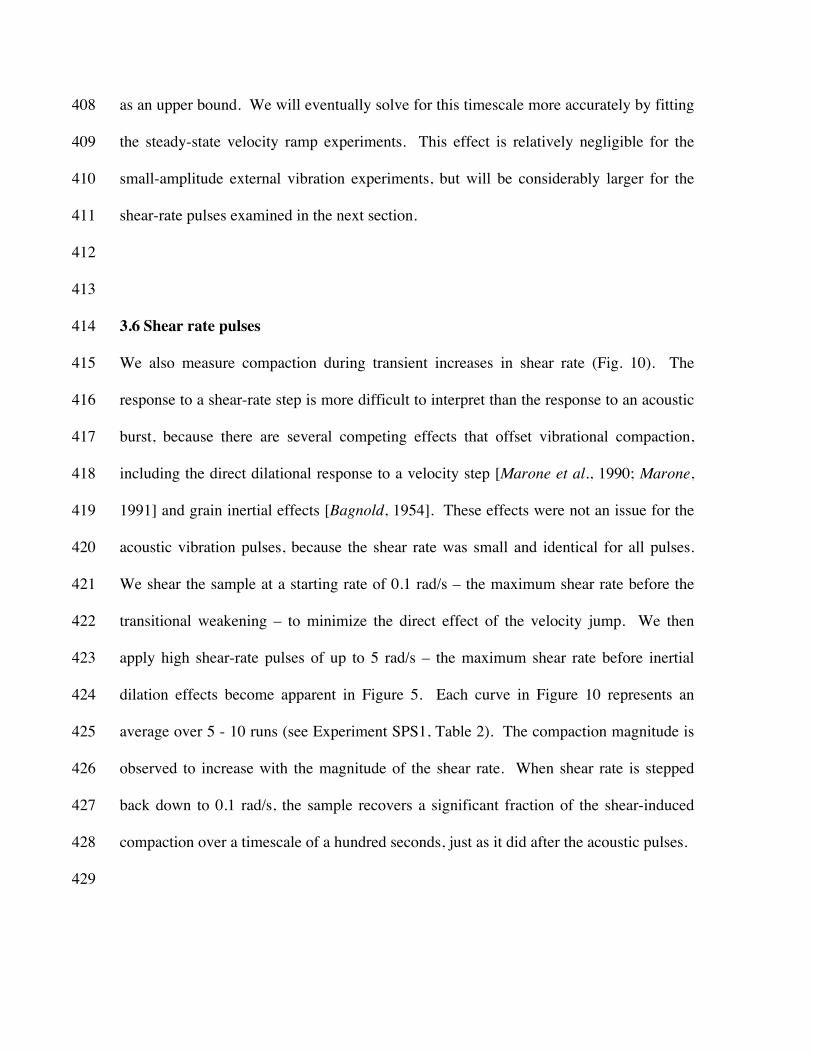
3.6 Shear rate pulses 414
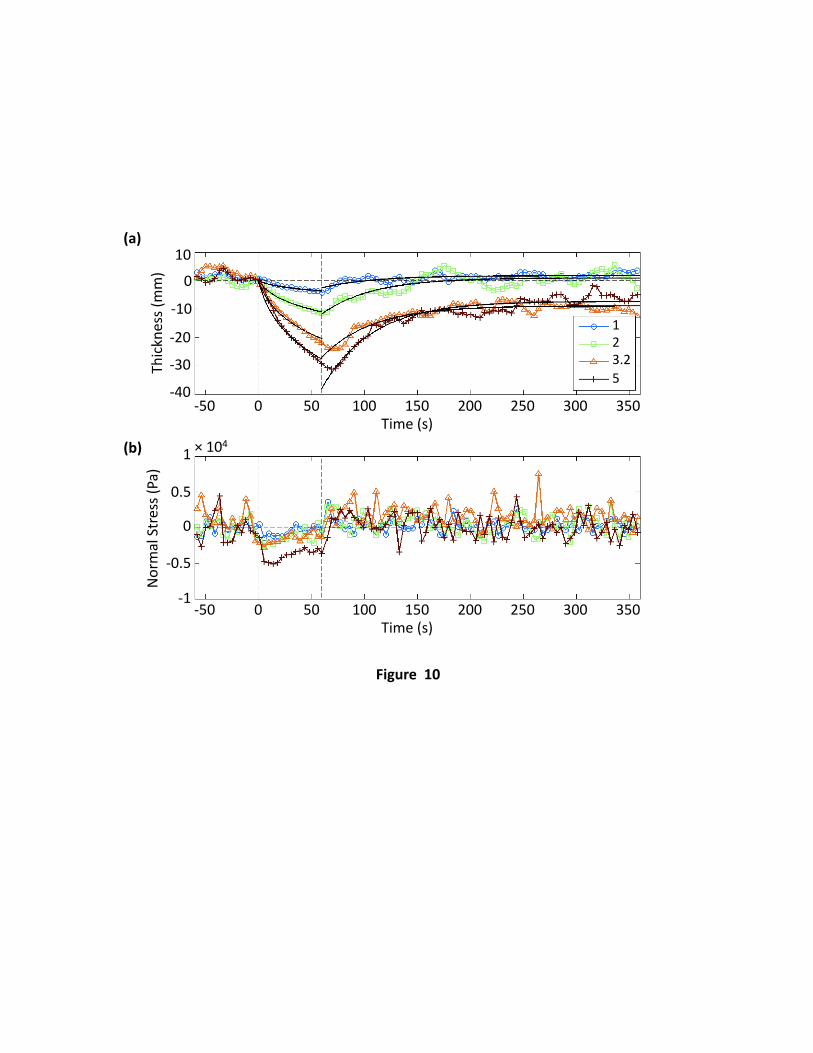
We also measure compaction during transient increases in shear rate (Fig. 10). The 415
response to a shear-rate step is more difficult to interpret than the response to an acoustic 416
burst, because there are several competing effects that offset vibrational compaction, 417
including the direct dilational response to a velocity step [Marone et al., 1990; Marone, 418
1991] and grain inertial effects [Bagnold, 1954]. These effects were not an issue for the 419
acoustic vibration pulses, because the shear rate was small and identical for all pulses. 420
We shear the sample at a starting rate of 0.1 rad/s – the maximum shear rate before the 421
transitional weakening – to minimize the direct effect of the velocity jump. We then 422
apply high shear-rate pulses of up to 5 rad/s – the maximum shear rate before inertial 423
dilation effects become apparent in Figure 5. Each curve in Figure 10 represents an 424
average over 5 - 10 runs (see Experiment SPS1, Table 2). The compaction magnitude is 425
observed to increase with the magnitude of the shear rate. When shear rate is stepped 426
back down to 0.1 rad/s, the sample recovers a significant fraction of the shear-induced 427
compaction over a timescale of a hundred seconds, just as it did after the acoustic pulses. 428
429
Page 20
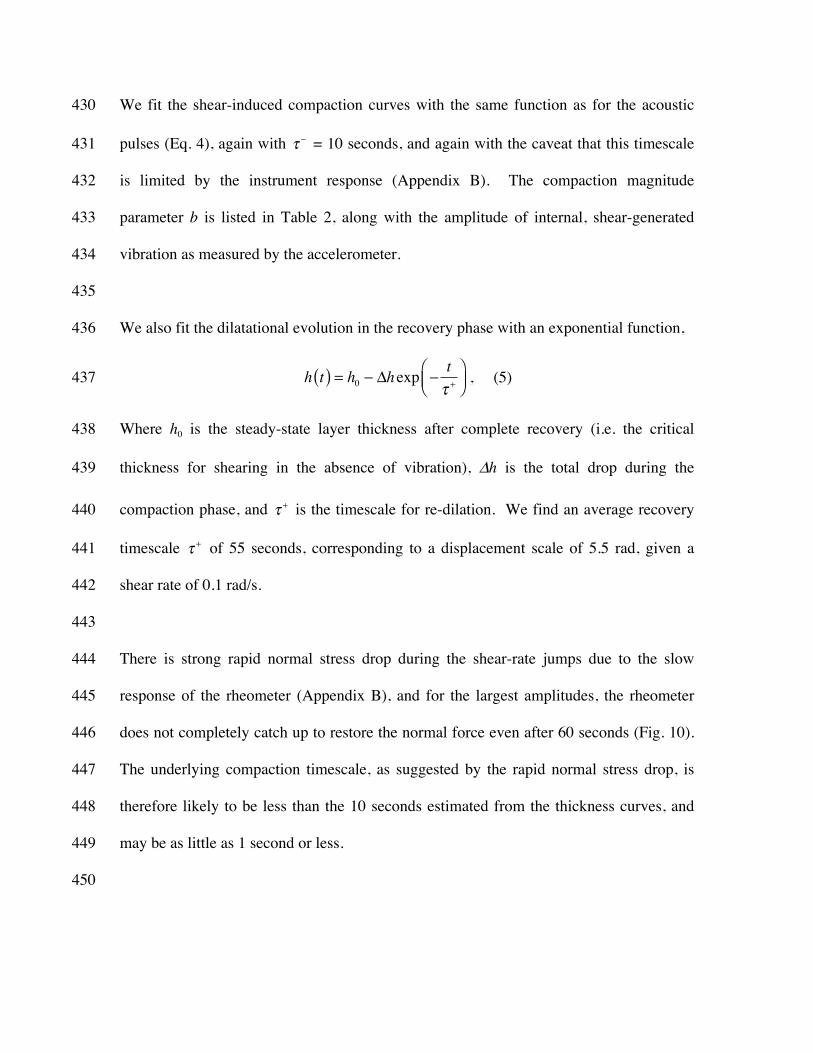
We fit the shear-induced compaction curves with the same function as for the acoustic 430
pulses (Eq. 4), again with τ − = 10 seconds, and again with the caveat that this timescale 431
is limited by the instrument response (Appendix B). The compaction magnitude 432
parameter b is listed in Table 2, along with the amplitude of internal, shear-generated 433
vibration as measured by the accelerometer. 434
435
We also fit the dilatational evolution in the recovery phase with an exponential function, 436
h t( ) = h0 − Δhexp −tτ +
⎛⎝⎜
⎞⎠⎟ , (5) 437
Where h0 is the steady-state layer thickness after complete recovery (i.e. the critical 438
thickness for shearing in the absence of vibration), Δh is the total drop during the 439
compaction phase, and τ + is the timescale for re-dilation. We find an average recovery 440
timescale τ + of 55 seconds, corresponding to a displacement scale of 5.5 rad, given a 441
shear rate of 0.1 rad/s. 442
443
There is strong rapid normal stress drop during the shear-rate jumps due to the slow 444
response of the rheometer (Appendix B), and for the largest amplitudes, the rheometer 445
does not completely catch up to restore the normal force even after 60 seconds (Fig. 10). 446
The underlying compaction timescale, as suggested by the rapid normal stress drop, is 447
therefore likely to be less than the 10 seconds estimated from the thickness curves, and 448
may be as little as 1 second or less. 449
450
Page 21
Plotting the values of compaction magnitude vs. acoustic strain amplitude for both shear 451
and acoustic pulses (from Table 2), we find that, for both pulse types, the compaction 452
magnitude is comparable for the same amplitude vibration (Fig. 11). This indicates that 453
the acoustic compaction mechanism is activated by vibration in the same way regardless 454
of whether the acoustic energy is generated by grain interactions during shear, or injected 455
from an external source. The recovery of dilatation after the cessation of the pulse shows 456
that the acoustic vibration is causing compaction within the actively shearing layer, 457
essentially suppressing shear dilatation and allowing the grains to shear in a more 458
compact configuration at the same stress. 459
460
We infer that the compaction observed in the transitional regime during the velocity ramp 461
experiments (Fig. 5) is also the result of internally-generated acoustic vibration that feeds 462
back on the rheology of the medium. The empirical compaction and dilatation functions 463
that we have measured (Eqs. 4,5) now allow us to formulate a quantitative model for the 464
steady-state thickness of a sheared layer that reflects the competition between acoustic 465
compaction and shear dilation. 466
467
4. Discussion 468
4.1 Key components of the steady-state thickness model 469
Any model that explains the observations presented in Figure 5 must meet at least the 470
following fundamental criteria: 1) At low shear rates, the dilation rate must scale with 471
shear rate in order for external acoustic vibration to produce more steady-state 472
compaction at lower velocities. 2) For angular sand, the shear-induced compaction rate 473
Page 22
must increase faster with shear rate than the shear-induced dilation rate, in order to 474
produce the transitional compaction regime. 3) The external and internally generated 475
acoustic compaction should behave similarly for equivalent amplitude vibrations. 476
477
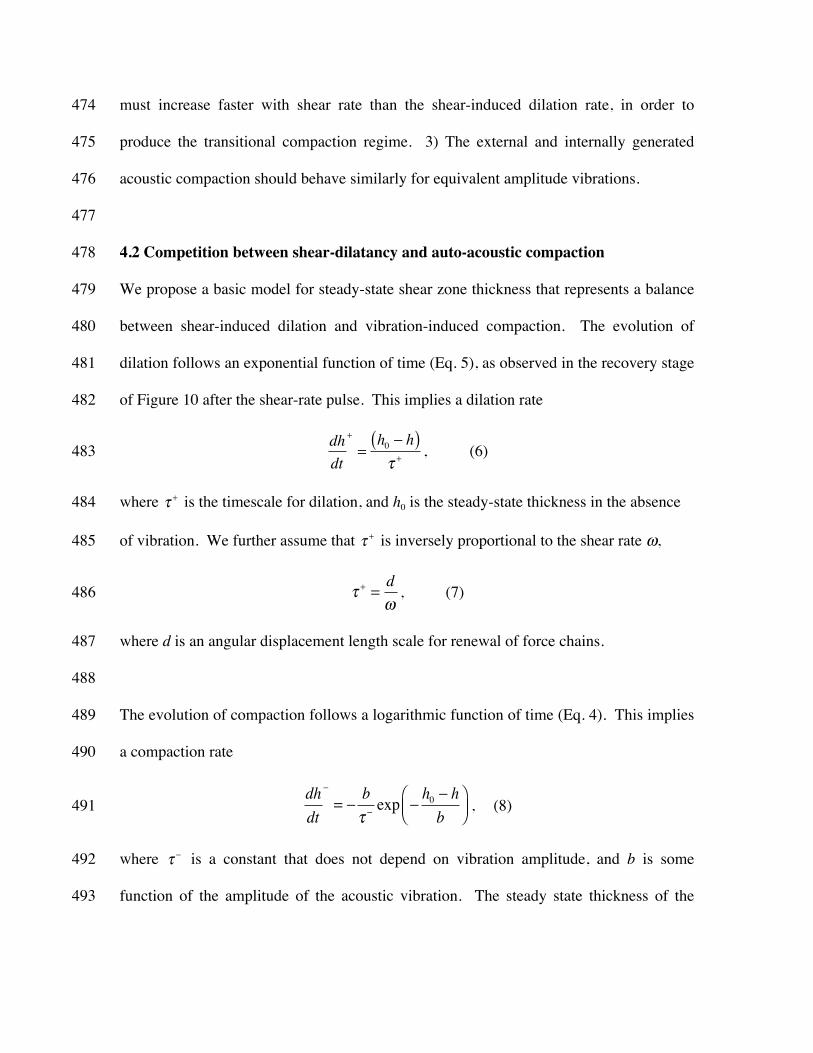
4.2 Competition between shear-dilatancy and auto-acoustic compaction 478
We propose a basic model for steady-state shear zone thickness that represents a balance 479
between shear-induced dilation and vibration-induced compaction. The evolution of 480
dilation follows an exponential function of time (Eq. 5), as observed in the recovery stage 481
of Figure 10 after the shear-rate pulse. This implies a dilation rate 482
dhdt
+
=h0 − h( )τ + , (6) 483
where τ + is the timescale for dilation, and h0 is the steady-state thickness in the absence 484
of vibration. We further assume that τ + is inversely proportional to the shear rate ω, 485
τ + =dω
, (7) 486
where d is an angular displacement length scale for renewal of force chains. 487
488
The evolution of compaction follows a logarithmic function of time (Eq. 4). This implies 489
a compaction rate 490
dhdt
−
= −bτ − exp −
h0 − hb
⎛⎝⎜
⎞⎠⎟ , (8) 491
where τ − is a constant that does not depend on vibration amplitude, and b is some 492
function of the amplitude of the acoustic vibration. The steady state thickness of the 493
Page 23
shear zone is the thickness h at which the dilation rate (Eq. 6) and compaction rate (Eq. 8) 494
are balanced, i.e. 495
dhdt
+
= −dhdt
−
, (9) 496
Substituting Equation 7 into Equation 6, Equation 9 gives 497
h − h0d
ω =bτ − exp
h − h0b
⎛⎝⎜
⎞⎠⎟ , (10) 498
where, again the constant b depends on the internally or externally generated vibration 499
amplitude. 500
501
4.3 Experimental fit 502
We now return to the steady-state thickness (velocity ramp) experiments (Fig. 5), and use 503
Equation 10 to solve for b as a function of shear rate. We use the same equation to solve 504
independently for b in the case with and without external vibration, and refer to the fit 505
parameters as bacoustic and bshear, respectively. 506
507
In order to constrain the compaction magnitude parameter b (Eq. 10) we use the 508
dilatational recovery length scale d = 5.5 radians, estimated from the shear-rate pulse 509
experiments, and the compaction timescale τ − , from the acoustic pulse experiments 510
(Table 3). As previously discussed, the timescale τ − is poorly constrained by the pulse 511
experiments because of the finite response time of the rheometer (Appendix B). We 512
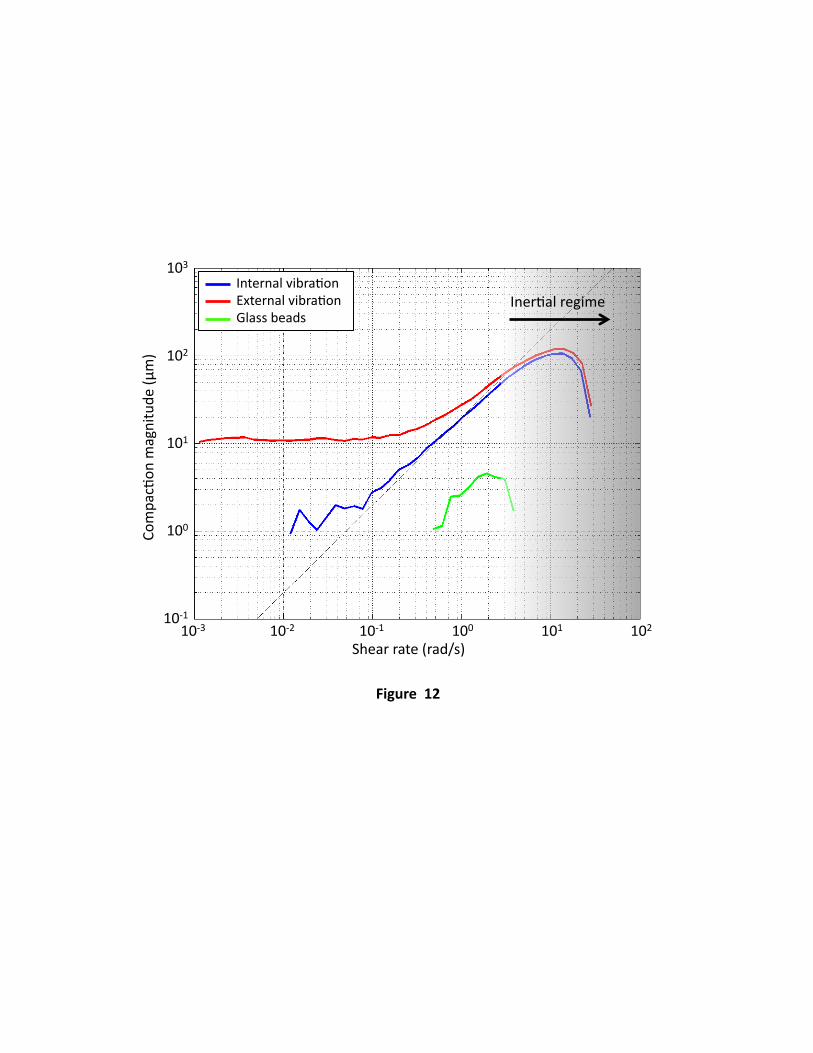
instead choose a value of τ − that gives a constant compaction magnitude bacoustic over the 513
range of shear rates where the contribution of shear-induced vibration is negligible (Fig. 514
12). This requires a compaction timescale τ − = 1 second. 515
Page 24
516
The steady-state layer thickness in the presence of vibration can be explained quite well 517
by a constant compaction magnitude bacoustic at low shear rates (Fig. 12). The systematic 518
relationship between steady-state thickness and shear rate simply reflects the longer 519
timescale for shear dilatation at low shear rates τ + = d ω( ) . At low shear rates, the 520
acoustic compaction has a relatively long time to operate. As the shear rate increases, 521
less and less compaction can occur within the timescale for dilatation. 522
523
In the absence of external vibration (shear-induced vibration only) the compaction 524
magnitude bshear increases linearly with shear-rate (Fig. 12), consistent with the linear 525
increase in shear-induced acoustic power observed earlier (Fig. 8). A possible 526
interpretation of the linear increase with shear rate would be that each discrete acoustic 527
emission event has a constant amplitude, independent of shear rate, and the rate of 528
acoustic emission events increases proportional to shear rate. Compaction magnitude 529
continues to increase until the inertial granular flow regime is reached and inertial 530
dilation overwhelms vibration-induced compaction. Note that this transition is reached at 531
much lower shear rates for the quieter glass beads. 532
533
We plot the observed and modeled (Equation 10) steady-state thickness vs. shear-rate in 534
Figure 13. The shear-induced compaction magnitude (bshear = 18 µm (rad/s)-1) is found by 535
fitting a straight line to the shear-induced compaction curve in Figure 12. The external 536
acoustic compaction magnitude (bacoustic = 10 µm) is found by fitting a horizontal line to 537
the low shear rate, acoustic compaction curve in Figure 12. The steady-state compaction 538
Page 25
in the presence of both shear-induced and external acoustic compaction is very nearly 539
predicted by a linear sum between the acoustic and shear-induced compaction 540
components (Fig. 13), i.e. 541
btotal = bacoustic + bshear . (11) 542
We conclude that the mechanism for acoustic compaction of the actively shearing layer is 543
identical, regardless of whether the vibration is generated internally or externally. 544
545
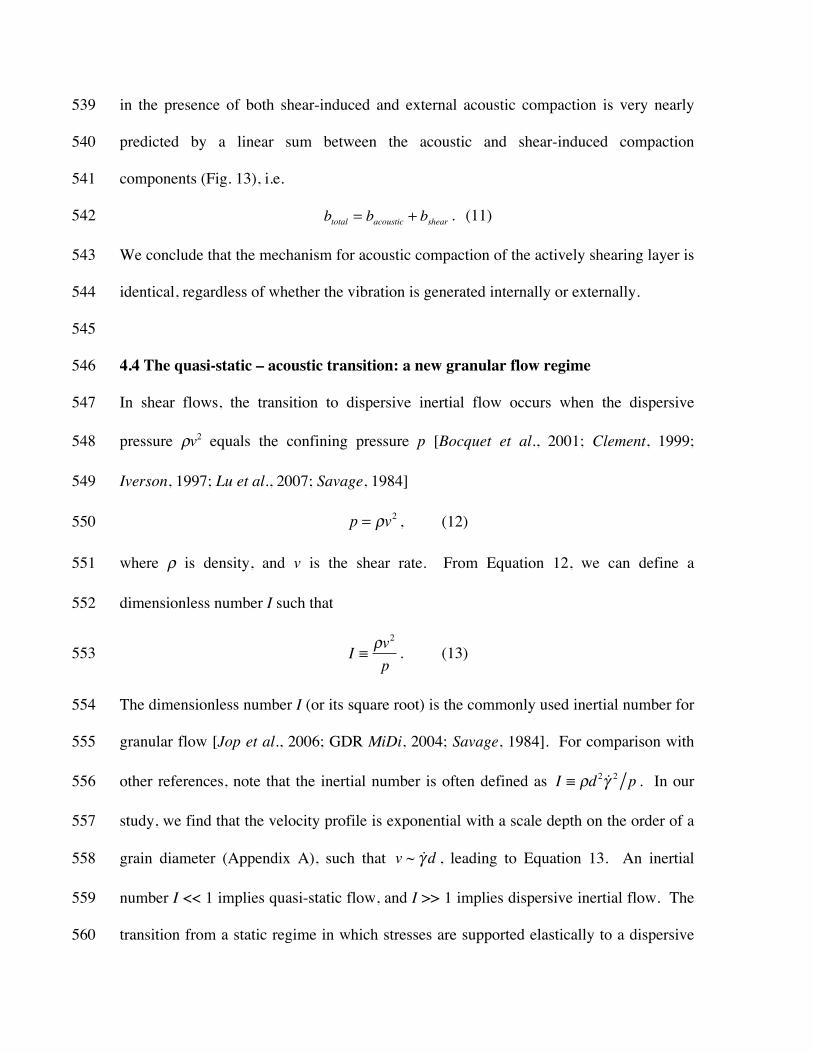
4.4 The quasi-static – acoustic transition: a new granular flow regime 546
In shear flows, the transition to dispersive inertial flow occurs when the dispersive 547
pressure ρv2 equals the confining pressure p [Bocquet et al., 2001; Clement, 1999; 548
Iverson, 1997; Lu et al., 2007; Savage, 1984] 549
p = ρv2 , (12) 550
where ρ is density, and v is the shear rate. From Equation 12, we can define a 551
dimensionless number I such that 552
I ≡ ρv2
p. (13) 553
The dimensionless number I (or its square root) is the commonly used inertial number for 554
granular flow [Jop et al., 2006; GDR MiDi, 2004; Savage, 1984]. For comparison with 555
other references, note that the inertial number is often defined as I ≡ ρd 2 γ 2 p . In our 556
study, we find that the velocity profile is exponential with a scale depth on the order of a 557
grain diameter (Appendix A), such that v ~ γ d , leading to Equation 13. An inertial 558
number I << 1 implies quasi-static flow, and I >> 1 implies dispersive inertial flow. The 559
transition from a static regime in which stresses are supported elastically to a dispersive 560
Page 26
regime where stresses are supported by inertial collisions is inherently dilatational 561
[Bagnold, 1954] 562
563
The maximum shear rate in our experiments is 100 cm/s, corresponding to an inertial 564
number of 0.3. Consequently, we never reach the fully inertial regime where stresses and 565
dilatation should scale as the square of shear rate [Bagnold, 1954]. Nevertheless, we 566
observe dilatation that exceeds quasi-static values at shear rates above ~30 cm/s, 567
corresponding to a dispersive pressure ~200 Pa (ρ = 2x10³ kg/m3), which is only about 568
3% of the normal pressure p = 7 kPa. 569
570
The transition to the acoustic regime is observed at shear rates as low as 1 mm/s. The 571
dispersive pressure at this velocity is < 10-6 times the confining pressure, and the 572
compaction cannot be attributed to inertial behavior. Instead, this low-velocity transition 573
represents the transition to acoustic fluidization. The acoustic pressure pa equals the bulk 574
modulus (K=ρc2) times the acoustic strain ε, giving 575
pa = ρc2ε , (14) 576
where ρ is the density of the medium, c is the acoustic wave speed [Thompson, 1971, 577
chap. 4]. We experimentally identify acoustic compaction at a threshold strain ε on the 578
order of 10-5 (Fig. 9). Taking the acoustic velocity c ~ 500 m/s, and ρ = 2000 kg/m3, the 579
threshold acoustic pressure (Eq. 13) is 5 kPa, on the order of the confining stress (7 kPa). 580
This suggests another non-dimensional number 581
J ≡ ρc2εp
, (15) 582
Page 27
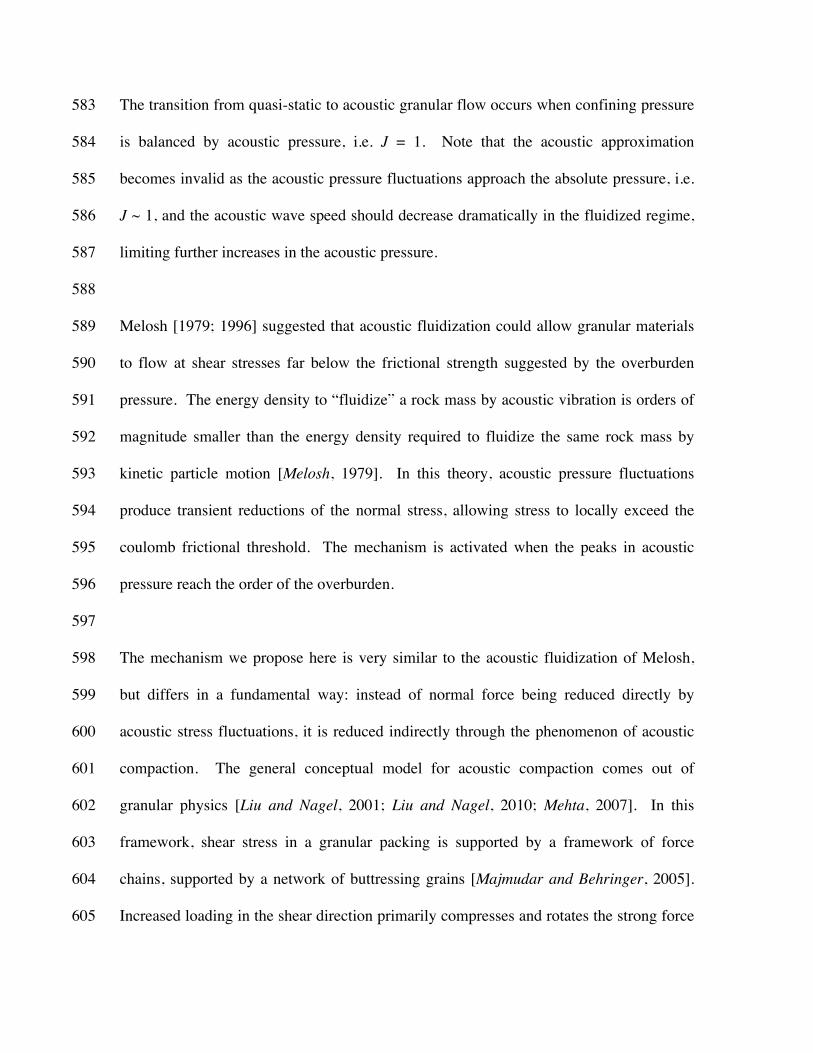
The transition from quasi-static to acoustic granular flow occurs when confining pressure 583
is balanced by acoustic pressure, i.e. J = 1. Note that the acoustic approximation 584
becomes invalid as the acoustic pressure fluctuations approach the absolute pressure, i.e. 585
J ~ 1, and the acoustic wave speed should decrease dramatically in the fluidized regime, 586
limiting further increases in the acoustic pressure. 587
588
Melosh [1979; 1996] suggested that acoustic fluidization could allow granular materials 589
to flow at shear stresses far below the frictional strength suggested by the overburden 590
pressure. The energy density to “fluidize” a rock mass by acoustic vibration is orders of 591
magnitude smaller than the energy density required to fluidize the same rock mass by 592
kinetic particle motion [Melosh, 1979]. In this theory, acoustic pressure fluctuations 593
produce transient reductions of the normal stress, allowing stress to locally exceed the 594
coulomb frictional threshold. The mechanism is activated when the peaks in acoustic 595
pressure reach the order of the overburden. 596
597
The mechanism we propose here is very similar to the acoustic fluidization of Melosh, 598
but differs in a fundamental way: instead of normal force being reduced directly by 599
acoustic stress fluctuations, it is reduced indirectly through the phenomenon of acoustic 600
compaction. The general conceptual model for acoustic compaction comes out of 601
granular physics [Liu and Nagel, 2001; Liu and Nagel, 2010; Mehta, 2007]. In this 602
framework, shear stress in a granular packing is supported by a framework of force 603
chains, supported by a network of buttressing grains [Majmudar and Behringer, 2005]. 604
Increased loading in the shear direction primarily compresses and rotates the strong force 605
Page 28
chains, which leads to bulk dilatation [Tordesillas et al., 2011]. Particle reconfiguration 606
(compaction) can only occur when strongly loaded force chains buckle catastrophically. 607
When static equilibrium is restored by the formation of new force chains, the packing is 608
again in a jammed state and unable to explore configurations. Acoustic vibration, on the 609
other hand, accesses both strong force chain grains and buttressing grains directly, and 610
may disrupt grain contacts without catastrophic buckling of force chains. This promotes 611
incremental compaction into a lower energy configuration. 612
613
Auto-acoustic fluidization, as observed in these experiments, is related to the amplitude 614
of acoustic vibration produced through grain interactions during shear. As such, it is 615
strongly dependent on the characteristics of the grains. Angular grains generate sufficient 616
acoustic energy to strongly affect the rheology of the flow, but smooth glass beads do 617
not. This implies that the physical characteristics of gouge particles observed in fault 618
zones can tell us something about the rheology of the flow during rupture. 619
620
For this mechanism to be active at seismogenic depths of ~10 km, with overburden 621
pressure on the order of 3×10⁸ Pa, assuming c = 3x10³ m/s, and ρ = 3x10³ kg/m3, 622
Equation 14 requires that the acoustic strain amplitude ε be on the order of 10-2. It is not 623
known how internally generated acoustic strain amplitude should scale with slip rate at 624
these conditions, and this value is at the upper limit of plausible elastic strain in rock. 625
However, if the effective confining pressure is reduced by fluid pressure or some other 626
mechanism, the required acoustic strain amplitude will be reduced accordingly. There is 627
Page 29
considerable evidence supporting the idea that effective pressures may indeed be low in 628
many faults [Hickman et al., 1995; Sleep and Blanpied, 1992]. 629
630
Future experiments must 1) establish what range of grain charateristics (angularity, aspect 631
ratio, etc.) are capable of generating sufficient acoustic vibration to feed back on the 632
rheology of the shear flow, and 2) quantify how the amplitude of acoustic vibration scales 633
with shear rate at seismically relevant confining stresses. 634
635
4.5 The acoustic – inertial transition 636
The acoustic transition defines the point at which the active shear zone compacts relative 637
to the quasi-static thickness. This compaction grows larger until the inertial regime is 638
encountered. We define the acoustic-inertial transition as the shear rate at which the 639
dispersive pressure of granular collisions exceeds the acoustic pressure, that is, when the 640
non-dimensional number K > 1, where 641
K ≡ρv2
ρc2ε=IJ
. (16) 642
Assuming the maximum acoustic strain ε = 1 (where the wave particle velocity equals the 643
wave speed and the acoustic approximation breaks down), Equation 16 reduces to a ratio 644
of velocities that can be thought of as the timescale for the transmission of stresses over 645
the dimensions of a grain: the acoustic timescale ∝c-1 and the shear time scale ∝v-1 646
K * =v2
c2. (17) 647
Page 30
Equation 17 is the square of the Mach number. Substituting the approximate wave speed 648
equation for a fluid c2 = p/ρ [Thompson, 1971], Equation 17 becomes 649
K * =ρv2
p, (18) 650
which is just the inertial number (Eq. 13). The transition to the inertial regime therefore 651
occurs at the same shear rate, regardless of whether the transition is quasi-static to 652
inertial, or acoustic to inertial. The acoustic regime therefore substitutes for a portion of 653
the quasi-static regime, but does not inhibit the transition to grain-inertial flow. 654
655
The apparent equivalence between Equations 17 and 18 emphasizes the fundamental 656
distinction between the quasi-static regime and the acoustic regime. The same elastic 657
time scale governs both the acoustic regime and the quasi-static regime. However, in the 658
quasi-static regime, the elastic stresses are too small to have a dynamic effect on the 659
particles, and c-1 controls the time scale for equilibration of static forces. In the acoustic 660
regime, transient elastic stresses are large enough to induce inter-particle slip, and c-1 661
controls the timescale over which perturbations in the packing configuration are 662
communicated throughout the medium. In the inertial regime, on the other hand, neither 663
stress equilibration nor perturbations to the particle packing can be achieved before the 664
configuration is renewed by shear. 665
666
5. Conclusion 667
We have experimentally measured the dilatational behavior of angular granular media 668
over a range of geophysically relevant shear rates. We have quantified the physical 669
Page 31
conditions for a new granular flow regime at shear rates transitional between quasi-static 670
and inertial granular flow, that we term the acoustic regime. In this regime, internally 671
generated vibrations induce auto-acoustic compaction of the actively dilating shear zone. 672
The steady-state thickness of the shear zone is described by a quasi-empirical model that 673
balances auto-acoustic compaction and shear dilatation. 674
675
Experiments using external acoustic vibration reveal the fundamental link between the 676
intermediate shear-rate compaction and acoustic compaction, showing that the same 677
magnitude of steady-state compaction is achieved for the same magnitude of acoustic 678
vibration, regardless of whether it is applied externally or generated internally by 679
shearing and grain collisions. The magnitude of internally generated acoustic vibration is 680
dependent on the characteristics of the grains, and thus the phenomenon of auto-acoustic 681
fludization occurs for angular grains, but not for quieter smooth grains. 682
683
The acoustic regime is activated when peak acoustic pressure from shear-induced 684
vibration exceeds the confining stress. At 10 kPa confining stress, this transition occurs 685
at a shear rate of only 1 mm/s in angular sand – four orders of magnitude below shear 686
rates typical of the transition to inertial, dispersive granular glow. Scaling the process up 687
to seismogenic conditions suggests that this mechanism may be an important velocity 688
weakening mechanism as long as confining stresses during earthquake rupture are sub-689
lithostatic. 690
691
Page 32
The velocity weakening acoustic rheology demonstrated here has significant implications 692
for coseismic stress reduction on earthquake faults, which generate high frequency 693
shaking both in the wake and in advance of a propagating rupture front, as well as for the 694
susceptibility of gouge-filled faults to triggering by high-frequency transient stresses. 695
696
Appendix A: Shear zone thickness 697
The shear zone in each experiment is restricted to a thin layer near the upper rotor, with 698
displacement and shear rate decreasing exponentially with distance from the rotor (Fig. 699
A1). The exponential displacement profile is constant regardless of the shear rate, that is, 700
the velocity profile changes only through a pre-factor proportional to the rotor velocity. 701
702
We image the active shear zone by cross-correlating video snapshots of the outer 703
boundary using a high-definition webcam. Snapshots are taken at rim displacement 704
intervals of 10 cm for three representative velocities: 0.1, 1, and 10 cm/s. We then cross-705
correlate successive images to estimate horizontal lag as a function of depth. This 706
involves taking a horizontal row of pixels from each pair of images and calculating the 707
cross correlation function between the two. The lag corresponding to the maximum in 708
the correlation function is taken as the horizontal displacement. We repeat this process 709
for each row of pixels to get displacement as a function of depth away from the rotor. 710
We then average the cross correlation function over 100 image pairs to produce the 711
images in Figure A1. 712
713
Page 33
The shear rate profile with depth is well fit by an exponential function with a decay 714
length scale of 0.63 mm, or approximately 2 grain diameters (Fig. A1). We fit an 715
exponential function to the peaks in the cross-correlation image for the shear rate of 0.1 716
cm/s, and then superpose this fit to the second two cross correlation images. No 717
adjustment in the fit parameters is required to fit the profile at 1 cm/s and 10 cm/s. This 718
is consistent with the results of Lu et al., [2007]. 719
720
Appendix B: Rheometer response to a sudden pressure drop. 721
The AR2000ex rheometer maintains normal pressure through a firmware feedback loop, 722
adjusting the height of the rotor (gap) until the measured force falls within the bounds set 723
by the controller software. The algorithm for adjusting the gap in response to a sudden 724
drop in normal stress is not documented in the rheometer software, and thus the 725
instrument response time after a sudden compaction event is unknown. We perform a 726
simple experiment in which we observe the rheometer response to a sudden compaction 727
event (drop in pressure). 728
729
The experiment proceeds as follows: 1) We place an air bladder (1 qt. Ziploc-style bag) 730
on the rheometer platform (Figure B1). 2) A corner of the bag is pinched to reduce the 731
internal volume and increase the pressure. 3) The rotor is lowered until it compresses the 732
bag and a normal force of 1 N is registered by the rheometer. 4) The constriction on the 733
bag is then suddenly released, resulting in a rapid drop in pressure. We then observe the 734
change in gap (rotor height) with time (Figure B2, inset). The experiment is repeated for 735
Page 34
pressure drops of ~0.5 and ~1 N, as well as for continuous pressure fluctuations induced 736
by intermittently squeezing and releasing the bag. 737
738
We find that the rheometer has a significantly delayed response to a sudden pressure 739
drop. The gap decreases gradually at first, before accelerating over ~10 seconds, up to a 740
maximum adjustment rate that is dependent on the deviation of the normal force from the 741
nominal value (25 µm/s/N) (Figure B2). This response explains the prolonged drop in 742
normal force in experiment SPS1 (Fig. 10), and means that the measured timescale for 743
compaction in Section 3.5 (Experiments SPS1 and APS1) must be treated as an upper 744
bound on the intrinsic compaction timescale. 745
746
Acknowledgements 747
This work was supported by a grant from Institutional Support at Los Alamos National 748
Lab via the Institute of Geophysics and Planetary Physics. 749
750
References 751
Aharonov, E., and D. Sparks (1999), Rigidity phase transition in granular packings, 752
Physical Review E, 60(6), 6890-6896. 753
Bagnold, R. A. (1954), Experiments on a Gravity-Free Dispersion of Large Solid Spheres 754
in a Newtonian Fluid under Shear, Proceedings of the Royal Society of London 755
Series a-Mathematical and Physical Sciences, 225(1160), 49-63. 756
Ben-Naim, E., J. B. Knight, E. R. Nowak, H. M. Jaeger, and S. R. Nagel (1998), Slow 757
relaxation in granular compaction, Physica D, 123(1-4), 380-385. 758
Page 35
Bocquet, L., W. Losert, D. Schalk, T. C. Lubensky, and J. P. Gollub (2001), Granular 759
shear flow dynamics and forces: Experiment and continuum theory, Physical 760
Review E, 65(1) 761
Caglioti, E., V. Loreto, H. J. Herrmann, and M. Nicodemi (1997), A ''tetris-like'' model 762
for the compaction of dry granular media, Physical Review Letters, 79(8), 1575-763
1578. 764
Campbell, C. S. (1990), Rapid Granular Flows, Annual Review of Fluid Mechanics, 22, 765
57-92. 766
Campbell, C. S. (2005), Stress-controlled elastic granular shear flows, Journal of Fluid 767
Mechanics, 539, 273-297. 768
Campbell, C. S. (2006), Granular material flows - An overview, Powder Technology, 769
162(3), 208-229. 770
Cates, M. E., J. P. Wittmer, J. P. Bouchaud, and P. Claudin (1998), Jamming, force 771
chains, and fragile matter, Physical Review Letters, 81(9), 1841-1844. 772
Clement, E. (1999), Rheology of granular media, Current Opinion in Colloid & Interface 773
Science, 4, 294-299. 774
Coghill, P. C., P. J., and P. Giang (2011), Ultrasonic velocity measurements in powders 775
and their relationship to strength in particles formed by agglomeration, Powder 776
Technology, 208(3), 694-701. 777
da Cruz, F., S. Emam, M. Prochnow, J. N. Roux, and F. Chevoir (2005), Rheophysics of 778
dense granular materials: Discrete simulation of plane shear flows, Physical 779
Review E, 72(2) 780
Page 36
Hickman, S., R. Sibson, and R. Bruhn (1995), Introduction to Special Section - 781
Mechanical Involvement of Fluids in Faulting, Journal of Geophysical Research-782
Solid Earth, 100(B7), 12831-12840. 783
Hutton, C. O. (1959), Mineralogy of beach sands between halfmoon and monterey bays, 784
California, California Div. Mines Spec. Rept., 59 785
Iverson, R. M. (1997), The physics of debris flows, Reviews of Geophysics, 35(3), 245-786
296. 787
Jaeger, H. M., S. R. Nagel, and R. P. Behringer (1996), Granular solids, liquids, and 788
gases, Reviews of Modern Physics, 68(4), 1259-1273. 789
Jia, X., C. Caroli, and B. Velicky (1999), Ultrasound propagation in externally stressed 790
granular media, Physical Review Letters, 82(9), 1863-1866. 791
Johnson, P. A., and X. Jia (2005), Nonlinear dynamics, granular media and dynamic 792
earthquake triggering, Nature, 437(7060), 871-874. 793
Johnson, P. A., H. Savage, M. Knuth, J. Gomberg, and C. Marone (2008), Effects of 794
acoustic waves on stick-slip in granular media and implications for earthquakes, 795
Nature, 451(7174), 57-U55. 796
Jop, P., Y. Forterre, and O. Pouliquen (2006), A constitutive law for dense granular 797
flows, Nature, 441, 727-730. 798
Knight, J. B., C. G. Fandrich, C. N. Lau, H. M. Jaeger, and S. R. Nagel (1995), Density 799
Relaxation in a Vibrated Granular Material, Physical Review E, 51(5), 3957-3963. 800
Liu, A., and S. Nagel (2001), Jamming and Rheology: Constrained dynamics on 801
microscopic and macroscopic scales, Taylor & Francis, London. 802
Page 37
Liu, A. J., and S. R. Nagel (1998), Nonlinear dynamics - Jamming is not just cool any 803
more, Nature, 396(6706), 21-22. 804
Liu, A. J., and S. R. Nagel (2010), The Jamming Transition and the Marginally Jammed 805
Solid, Annual Review of Condensed Matter Physics, Vol 1, 1, 347-369. 806
Lu, K., E. E. Brodsky, and H. P. Kavehpour (2007), Shear-weakening of the transitional 807
regime for granular flow, Journal of Fluid Mechanics, 587, 347-372. 808
Majmudar, T. S., and R. P. Behringer (2005), Contact force measurements and stress-809
induced anisotropy in granular materials, Nature, 435(7045), 1079-1082. 810
Makse, H. A., N. Gland, D. L. Johnson, and L. Schwartz (2004), Granular packings: 811
Nonlinear elasticity, sound propagation, and collective relaxation dynamics, 812
Physical Review E, 70(6) 813
Marone, C., C. B. Raleigh, and C. H. Scholz (1990), Frictional Behavior and Constitutive 814
Modeling of Simulated Fault Gouge, Journal of Geophysical Research-Solid 815
Earth and Planets, 95(B5), 7007-7025. 816
Marone, C. (1991), A Note on the Stress-Dilatancy Relation for Simulated Fault Gouge, 817
Pure and Applied Geophysics, 137(4), 409-419. 818
Mehta, A. (Ed.) (2007), Granular Physics, Cambridge Univ. Press, Cambridge. 819
Melosh, H. J. (1979), Acoustic Fluidization - New Geologic Process, Journal of 820
Geophysical Research, 84(Nb13), 7513-7520. 821
Melosh, H. J. (1996), Dynamical weakening of faults by acoustic fluidization, Nature, 822
379(6566), 601-606. 823
MiDi, G. (2004), On dense granular flows, Eur. Phys. J E, 14, 341-365. 824
Page 38
Nowak, E. R., J. B. Knight, M. L. Povinelli, H. M. Jaeger, and S. R. Nagel (1997), 825
Reversibility and irreversibility in the packing of vibrated granular material, 826
Powder Technology, 94(1), 79-83. 827
Paull, C. K., P. Mitts, W. Ussler, R. Keaten, and H. G. Greene (2005), Trail of sand in 828
upper Monterey Canyon: Offshore California, Geological Society of America 829
Bulletin, 117(9-10), 1134-1145. 830
Reynolds, O. (1885), On the dilatancy of media composed of rigid particles in contact, 831
Philos. Mag., 20(469) 832
Savage, S. B. (1984), The mechanics of rapid granular flows, Adv. Appl. Mech, 24, 289-833
366. 834
Sleep, N. H., and M. L. Blanpied (1992), Creep, Compaction and the Weak Rheology of 835
Major Faults, Nature, 359(6397), 687-692. 836
Stearns, S. D. (2003), Digital Signal Processing with Examples in MATLAB, Boca Raton, 837
Florida. 838
Thompson, P. A. (1971), Compressible-fluid dynamics, McGraw-Hill, New York. 839
Thompson, P. A., and G. S. Grest (1991), Granular Flow - Friction and the Dilatancy 840
Transition, Physical Review Letters, 67(13), 1751-1754. 841
Tordesillas, A., J. Y. Shi, and T. Tshaikiwsky (2011), Stress-dilatancy and force chain 842
evolution, International Journal for Numerical and Analytical Methods in 843
Geomechanics, 35(2), 264-292. 844
Walton, K. (1987), The Effective Elastic-Moduli of a Random Packing of Spheres, 845
Journal of the Mechanics and Physics of Solids, 35(2), 213-226. 846
847
Page 39
Figure Captions 848
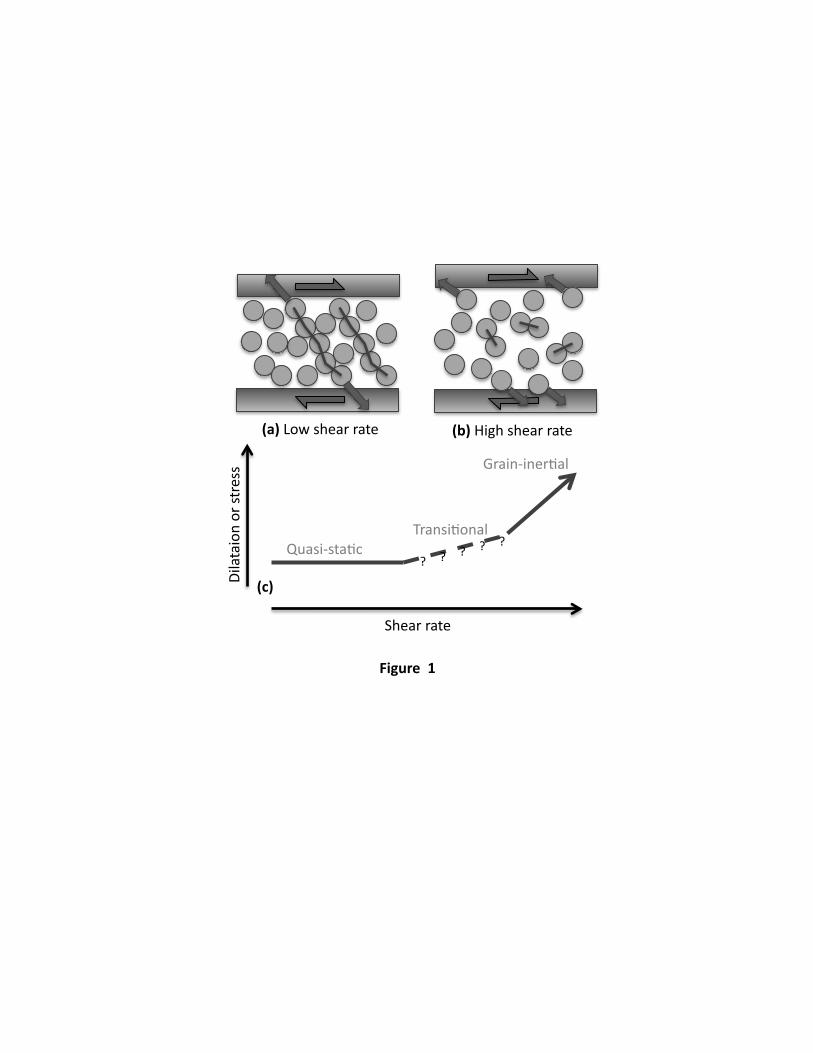
Figure 1. Cartoon depiction of end-member granular flow regimes. (a) In the low shear 849
rate quasi-static regime, boundary stresses are supported elastically through force chains. 850
Thin lines represent grain-grain contacts and arrows represent forces acting on the 851
boundaries. (b) In the high shear-rate grain-inertial regime, stresses are supported through 852
momentum transfer in collisions. (c) Cartoon of experimental behavior in end member 853
regimes. The y-axis represents stress under constant volume conditions or shear zone 854
thickness under constant stress conditions. In the quasi-static regime, dilatation and 855
stress are independent of shear rate, resulting in a friction-like rheology. In the grain 856
inertial regime, dilatation and stress are proportional to the momentum transfer rate, 857
resulting in a power-law viscous-like rheology. This study focuses on the intermediate 858
shear rate transitional regime, where stresses are supported elastically, but vibration 859
becomes important for force chain stability. 860
861
Figure 2. Experimental apparatus: TA Instruments AR2000ex torsional rheometer, with 862
parallel plate geometry. (a) Photograph of test chamber in mounting bracket. The 2 cm 863
quartz jacket is here filled with glass beads. (b) Schematic of the experimental geometry. 864
Shear rate ω and normal stress σ are controlled through the upper rotor. The normal 865
stress σ is held constant by adjusting the rotor height h. We also measure, but do not 866
report on, the torque τ (i.e. shear stress) required to shear at a given velocity. 867
868
Figure 3. Granular media used in velocity stepping experiments: a) smooth glass beads, 869
b) angular Santa Cruz beach sand 870
Page 40
871
Figure 4. Steady-state thickness vs. shear rate, for sheared angular sand and glass beads. 872
Individual curves represent multiple up-going and down-going velocity ramps (Table 1), 873
and thick error bars show means and standard deviations between runs. Thickness is 874
independent of shear rate at low shear rates, and strongly dependent on shear rate for 875
intermediate and high shear rates. Compaction is observed at intermediate shear rates for 876
angular sand, but not for smooth glass beads. Thickness is reported relative to starting 877
thickness, offset by 100 microns for the glass beads. 878
879
Figure 5. Steady state layer thickness as a function of shear rate for (a) angular sand and 880
(b) smooth glass beads. Layer thickness is given relative to the minimum layer thickness 881
under acoustic vibration. Thin lines are individual runs (Table 1), thick lines are averages 882
over all runs. In the absence of vibration, the layer thickness is largely independent of 883
shear rate at low shear rates, and strongly dependent at higher shear rates. In the presence 884
of acoustic vibration, the layer thickness is reduced, and is dependent on shear rate over 885
the entire range. For angular sand, a reduction in steady state thickness occurs at 886
intermediate velocities, but not for smooth glass beads. 887
888
Figure 6. Sample thickness and shear rate as a function of experimental time, for angular 889
sand, showing evolution of thickness during external vibration (Experiment VRS3, Table 890
1). Shear rate is ramped up and down (b), producing repeatable and reversible changes in 891
sample thickness (a). Boxes highlight individual slow-to-fast velocity ramps (c.f. Fig. 892
5a). External acoustic vibration is applied at ~4000 seconds, resulting in logarithmic 893
Page 41
irreversible compaction, and a qualitative change in the reversible thickness at low 894
velocity (labeled ‘LV dip’). Vibration ceases at ~10,000 seconds, after which the low 895
shear-rate compaction returns to the pre-vibration behavior (‘no LV dip’). 896
897
Figure 7. Acoustic vibration amplitude, recorded by an accelerometer attached to the 898
sample jacket. Transitions in steady-state thickness (see Figure 5) correspond to 899
transitions in the amplitude of shear-induced vibration. The blue curve is vibration 900
produced by shearing angular sand; the lower green curve is the vibration produced by 901
glass beads. The red curve shows the superposition of external acoustic vibration on 902
shear-induced vibration produced by angular sand. The accelerometer begins to clip at a 903
shear rate of ~7 rad/s (grey patch), so the rollover is not entirely physical. At 1 rad/s the 904
shear-induced vibration is equivalent to the external vibration amplitude (dashed red 905
line). 906
907
Figure 8. Relative power of the shear-induced acoustic vibration signal, as recorded by 908
the accelerometer. Power is the integral of the instrumental velocity spectrum between 0 909
and 35 Hz, normalized by the peak value. Power increases linearly with shear rate 910
(straight line for reference). The error bars show the standard deviation between 911
experimental runs. The majority of the variation at higher shear rates is due to fluctuation 912
in normal force due to the broad normal force tolerance (+/- 10 %) allowed by the 913
rheometer. 914
915
Page 42
Figure 9. The response of a steadily sheared granular medium to transient acoustic 916
pulses. The sample is sheared at 0.01 rad/s, and subjected to 60-second acoustic pulses 917
(marked by vertical dashed black lines). (a) shows sample thickness relative to the start 918
of the acoustic vibration, and (b) shows normal stress. There is a small normal stress dip 919
for the highest amplitude vibration (red curve), reflecting a lag in the rheometer normal 920
force control (Appendix B). Black lines show logarithmic fits to the data (Eq. 4). The 921
legend gives the strain amplitude of the acoustic vibration as measured by the 922
accelerometer. 923
924
Figure 10. (a) The response of a steadily sheared granular medium to a velocity step. 925
The sample is sheared at 0.1 rad/s, and subjected to 60-second intervals of higher shear 926
rate (bounded by vertical dashed black lines). The legend gives the shear rate in rad/s 927
(equivalent to cm/s at the rotor rim). The compaction and recovery are fit to Equations 4 928
and 5, respectively (black curves). (b) Normal stress drops as compaction begins, due to 929
the time lag in the rheometer response (Appendix B). 930
931
Figure 11. Compaction magnitude b (Eq. 4) is a consistent function of acoustic strain 932
amplitude for external (Table 2: Aps1) and internally generated (Table 2: Sps1) acoustic 933
vibration. Compaction magnitude increases linearly above a threshold strain amplitude 934
of about 10-5. Triangles show compaction for external vibration, squares correspond 935
internal, shear-generated vibration, for shear rates of 1, 2, 3.2, and 5 rad/s, from left to 936
right. Each point is an average of 5-10 runs (Table 2), and error bars show standard 937
deviations between runs. 938
Page 43
939
Figure 12. Compaction magnitude parameter b, fit through Eq. 10 to the steady-state 940
thickness vs. shear rate (Fig. 5). The red curve, showing compaction rate due to external 941
vibration, is flat at low shear rates, consistent with the constant external acoustic strain 942
amplitude. Shear-induced compaction (blue curve) increases linearly with shear-rate, 943
consistent with the linear increase in the power of the internally generated acoustic 944
vibration (Fig. 8). Compaction rate for the glass beads (green curve) is considerably 945
smaller. The black dashed line shows a linear relationship for reference. The rollover at 946
high shear-rates reflects the entry into the inertial granular flow regime, where sample 947
dilation is dominated by grain collisions. Compare to acoustic vibration amplitude as a 948
function of shear rate (Fig. 7). 949
950
Figure 13. Steady-state thickness of the shear zone as a function of shear rate (Eq. 10). 951
Observations (curves with error bars) are the same as in Figure 5: the upper curve is 952
angular sand without vibration, the lower curve is with external vibration. The green 953
curve is the contribution from external vibration through Equation 10 with a constant 954
compaction magnitude bacoustic; the blue curve is the contribution from shear-induced 955
vibration with compaction magnitude bshear a linear function of shear rate; the black curve 956
shows the linear sum of the two compaction components. The increase in thickness for 957
both curves at high shear rates is caused by inertial dilation and is not addressed by the 958
model. 959
960
Page 44
Figure A1. Displacement profiles for different velocities. The left panel shows a 961
snapshot of the angular sand, which is being sheared to the right. The following panels 962
show horizontal cross-correlation of snapshots taken at a constant displacement (10 cm) 963
but for different shear rates (0.1, 1, and rad/s from left to right). The darker colors reflect 964
higher cross correlation coefficients. Grain rotation and non-horizontal particle motion 965
prevent correlation beyond a few mm displacement. An exponential function (black 966
curve) is fit to the first cross-correlation image (0.1 cm/s) and superposed on the adjacent 967
panels. The shear-rate profile does not change except through a multiplicative pre-factor. 968
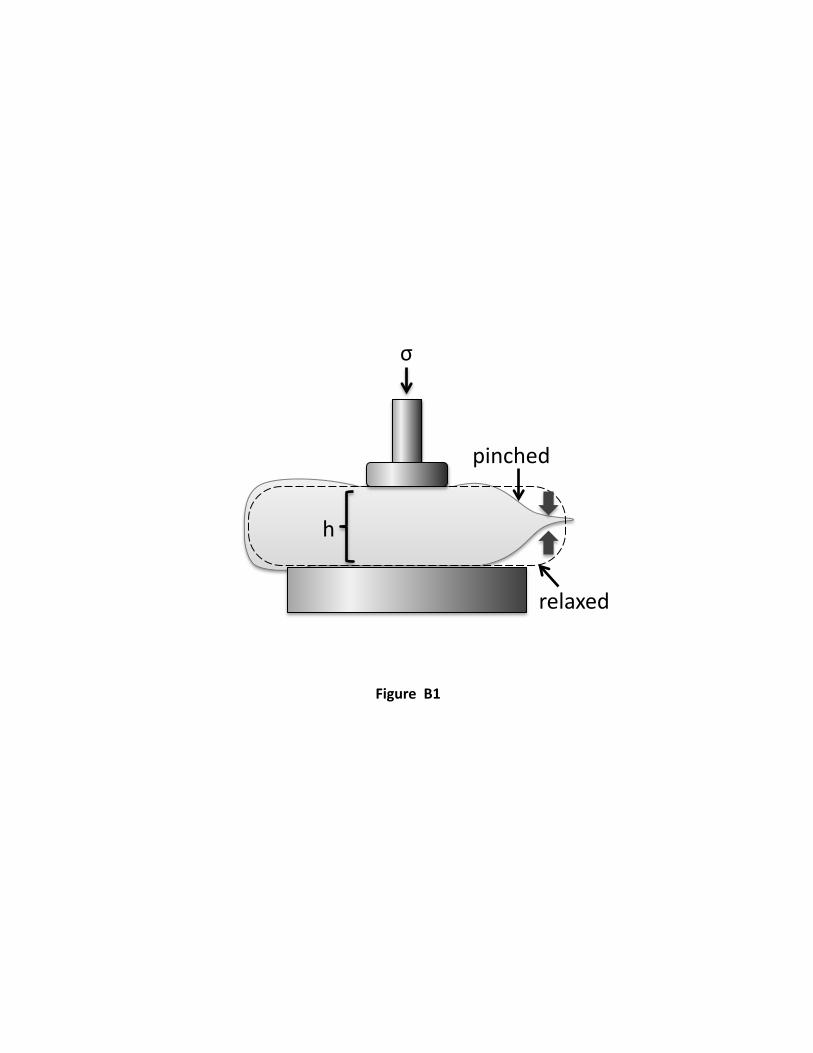
969 Figure B1. Cartoon of experimental setup. The rheometer rotor is lowered into contact 970
with an inflated plastic bag, which is pinched on the edge to increase the pressure. At the 971
start of the experiment, the bag is released, resulting in a sudden relaxation in pressure 972
(dashed outline). 973
974 Figure B2. Gap adjustment rate as a function of the reduction in normal force. Black 975
circles show the response to continuous fluctuations in the resisting force. The maximum 976
adjustment rate depends linearly on the deviation of normal force from the nominal value 977
(25 µm/s/N). The two colored paths show sudden force drop experiments, where the 978
normal force is reduced from 1 N to 0.5 N (green) or 0 N (red). For these sudden drops, 979
there is a delayed rheometer response, during which the gap adjustment rate accelerates 980
from zero (large circles at start of path) to the maximum rate over ~10 seconds. Inset: 981
paths for sudden force drop experiments as a function of time, showing the ~10 second 982
delay. The maximum rates are shown by straight lines for reference. Points A and B on 983
the inset corresponds to points A and B along the path in the main figure. 984
Page 45
985
Tables 986
Table 1. Velocity ramp experiments 987
Name Material Number w/o vibrationa
Number w/ vibrationa
correctionb
VRS1 Sand 4 (2,2) 8 (4,4) yes VRS2 Sand 2 (1,1) 8 (4,4) No VRS3* Sand 10 (5,5) 6 (3,3) No VRS4 Sand 0 8 (4,4) No VRG1 Glass beads 17 (9,8) 6 (3,3) No a (N,M) signifies N slow-to-fast and M fast-to-slow velocity ramps, respectively 988 b linear correction for run-in phase applied to runs without vibration 989 * shown in Figure 6 990
991
Table 2. Pulse experiments (sand) 992
Name Pulse type Starting shear rate
Pulse shear rate (rad/s)
Acoustic strain
b (µm)a Runs
SPS1 Shear 0.1 1.0 1.3 × 10⁻⁵ 1.9 ± 1.9 10 0.1 2.0 2.2 × 10⁻⁵ 5.6 ± 2.7 5 0.1 3.16 2.9 × 10⁻⁵ 10.5 ± 0.6 5 0.1 5.0 3.5 × 10⁻⁵ 14.2 ± 1.2 5 APS1 Acoustic 0.01 n/a 1.3 × 10⁻⁶ 0.9 ± 4.6 13 0.01 3.8 × 10⁻⁶ 2.7 ± 3.0 10 0.01 1.4 × 10⁻⁵ 0.1 ± 3.3 5 0.01 2.4 × 10⁻⁵ 8.6 ± 3.6 5 0.01 3.0 × 10⁻⁵ 9.1 ± 3.3 6 a Compaction magnitude (Eq. 4) 993
994
Table 3: Fit parameters for steady-state thickness model (Eq. 10) 995
bacoustic (µm)a bshear (µm/rad/s)a d (rad)b τ- (s)a 10 18 5.5 1 a fit to combined velocity ramp experiments VRS1-4 (Fig. 12) 996 b fit to acoustic pulse experiment SPS1997
Page 47
Figure 1
(a) Low shear rate (b) High shear rate
Dilataion or stress
Shear rate
Quasi-‐sta5c
Grain-‐iner5al
Transi5onal ? ? ? ? ?
(c)
Page 48
2 cm
2 cm
h
ω
σ
ε
Accelerometer
Vibra5on Transducer
(a) (b))
Figure 2
Page 49
(a) (b)
1 mm
Figure 3
Page 50
Figure 4
100
50
0
-‐50
-‐100
-‐150
Thickness (μm)
Shear rate (rad/s) 10-‐3 10-‐2 10-‐1 100 101 102
Angular sand Glass beads
Page 51
Figure 5
(b))
(a)) 160
120
80
40
0
-‐40
Thickness (μm)
Shear rate (cm/s) 10-‐3 10-‐2 10-‐1 100 101 102
Vibra5on No vibra5on
Thickness (μm)
Shear rate (cm/s) 10-‐3 10-‐2 10-‐1 100 101 102
Vibra5on No vibra5on
200
150
100
50
0
-‐50
(b))
Page 52
LV dip No LV dip
(a)
(b)
Thickness (m
m)
Experimental 5me (s) 0
12.6
12.5
2000 4000 6000 8000 10000 12000 14000 16000
12.7
12.8
0 2000 4000 6000 8000 10000 12000 14000 16000
102
100
10-‐2
10-‐4
Shear rate (rad/s)
(a))
(b))
Figure 6
Page 53
Figure 7
0
Acous5c strain am
plitu
de
Shear rate (rad/s) 10-‐3 10-‐2 10-‐1 100 101 102
Angular sand Angular sand + Vibra5on Glass beads
1
2
3
4
5
6 × 10-‐5
Page 54
Figure 8
0
Acous5c strain am
plitu
de
Shear rate (rad/s) 100
0.2
0.4
0.6
0.8
1
90 80 70 60 50 40 30 20 10 0
Page 55
(a)
(b)
1.3×10-‐6
3.8×10-‐6
1.4×10-‐5
2.4×10-‐5
3.0×10-‐5
Thickness (m
m)
-‐20
-‐30
-‐10
10
-‐60 -‐40 -‐20 0 20 40 60 80 120
0
100 Time (s)
Normal Stress (Pa)
3000
-‐60 -‐40 -‐20 0 20 40 60 80 120
2000
100
2000
0
-‐3000
-‐1000
-‐2000
Time (s)
Figure 8
Page 56
(a)
(b)
1 2 3.2 5
Thickness (m
m)
-‐20
-‐30
-‐10
10
-‐50 0 50
0
Time (s)
Normal Stress (Pa)
1
0.5
0
-‐1
-‐0.5
Figure 10
100 150 200 250 300 350
-‐50 0 50 Time (s)
100 150 200 250 300 350
-‐40
× 104
Page 57
6
Compac5on
magnitude
(μm)
Acous5c Strain Amplitude 4
8
14
3.5 3 2.5 2 1.5 1 0.5 0
10
12
16
-‐4
-‐2
4
0
2
× 10-‐5
Shear-‐induced (Internal) vibra5on External vibra5on
Figure 11
Page 58
Iner5al regime Internal vibra5on External vibra5on Glass beads
Compac5on
magnitude
(μm)
Shear rate (rad/s) 10-‐3 10-‐2 10-‐1 100 101 102
103
102
101
100
10-‐1
Figure 12
Page 59
-‐60
-‐80
-‐100
Thickness (μm)
Shear rate (rad/s) 10-‐3 10-‐2 10-‐1 100 101 102
-‐0
-‐20
-‐40
20
80
60
40
Figure 13
No vibra5on Acous5c vibra5on Fit (shear-‐induced) Fit (external acous5c) Fit (sum)
Page 60
0.1 cm/s 1 cm/s 10 cm/s
Displacement (cm) -‐0.5 0 0.5 -‐0.5 0 0.5 -‐0.5 0 0.5
Dep
th (cm)
0
0.1
0.2
0.3
0.4
0.5
0.6
0.7
0.8
0.9
0
0.1
0.2
0.3
0.4
0.5
0.6
0.7
0.8
0.9
(cm) -‐0.5 0 0.5
Figure A1
Page 61
h
σ
pinched
relaxed
Figure B1
Page 62
A
B
B A
5
0
Adjustm
ent rate (μm/s)
Normal force drop (N) 0
15
10
20
25
Figure B2
0.2 0.4 0.6 0.8 1
0
-‐20
-‐40
-‐60
-‐80
-‐100
Gap (μ
m)
Time (s) 0 5 10 15 20