The great buildings and monuments of the world inspire awe—the pyr- amids, the great cathedrals, modern museums, and skyscrapers. We marvel at the creativity of the architects and engineers who designed and built them from stones, concrete, and steel. On a different scale we are captivated by nature’s architecture in gemstones and minerals. We appreciate the flash of light, depth of color, and numerous forms found in quartz gemstones and minerals that nature itself makes from sand. On the atomic scale, scientists have come to understand the architecture of everything from gems and minerals to proteins. In the twentieth century, scientists learned how to control the archi- tecture of the atomic world in order to synthesize new materials to meet the evolving needs of technology. The architects of the atomic-scale world build structures with varying degrees of open space and lightness of structure. Not unlike the architects of present day buildings and bridges, the architects of the atomic-scale world are testing the strength and stability of the new structures that they have synthesized in the laboratory. This chapter looks at how the architects of the atomic-scale world take sand and make a wide variety of new materials that have become everyday products in our lives. Before looking at these new materials let us start by asking how scientists determine the architecture of sand? As discussed in Chapter 1, the concepts of symmetry were enumerated in the nineteenth century, and a mathematical framework was developed to relate the positions of the atoms in a crystal by the symmetry operations of the appropriate space group. However, there was no way to determine where the atoms were in the unit cell or to which space group a crystal belonged. Furthermore, there was no direct way to determine the dis- tance between the atoms in a crystal and the dimensions of the unit cell. None the less, by the end of the nineteenth century scientists began to speculate what the architecture of the atomic world might look like. One of these was William Barlow, who was an amateur geologist. He had inherited a sizable fortune and was able to devote his time to studying the symmetry and structure of crystals. W. J. Pope writes in Barlow’s obituary: 2 The Architecture of Sand
Transcript
OUP CORRECTED PROOF – FINAL, 12/28/11, SPi
� The great buildings and monuments of the world inspire awe—the pyr-amids, the great cathedrals, modern museums, and skyscrapers. We marvel at the creativity of the architects and engineers who designed and built them from stones, concrete, and steel. On a different scale we are captivated by nature’s architecture in gemstones and minerals. We appreciate the fl ash of light, depth of color, and numerous forms found in quartz gemstones and minerals that nature itself makes from sand. On the atomic scale, scientists have come to understand the architecture of everything from gems and minerals to proteins.
In the twentieth century, scientists learned how to control the archi-tecture of the atomic world in order to synthesize new materials to meet the evolving needs of technology. The architects of the atomic-scale world build structures with varying degrees of open space and lightness of structure. Not unlike the architects of present day buildings and bridges, the architects of the atomic-scale world are testing the strength and stability of the new structures that they have synthesized in the laboratory.
This chapter looks at how the architects of the atomic-scale world take sand and make a wide variety of new materials that have become everyday products in our lives. Before looking at these new materials let us start by asking how scientists determine the architecture of sand? As discussed in Chapter 1 , the concepts of symmetry were enumerated in the nineteenth century, and a mathematical framework was developed to relate the positions of the atoms in a crystal by the symmetry operations of the appropriate space group. However, there was no way to determine where the atoms were in the unit cell or to which space group a crystal belonged. Furthermore, there was no direct way to determine the dis-tance between the atoms in a crystal and the dimensions of the unit cell. None the less, by the end of the nineteenth century scientists began to speculate what the architecture of the atomic world might look like.
One of these was William Barlow, who was an amateur geologist. He had inherited a sizable fortune and was able to devote his time to studying the symmetry and structure of crystals. W. J. Pope writes in Barlow’s obituary:
2
The Architecture of Sand
OUP CORRECTED PROOF – FINAL, 12/28/11, SPi
Sand and Silicon22
“Barlow thus found himself in his early thirties with an independ-ence, with a genius for handling geometrical problems of a par-ticular kind, and with ample leisure to devote to the study of crystal structure, which had become the subject of his choice. He had not, however, received that rigid disciplinary training through which most students of physics and chemistry acquire a broad sense of contemporary knowledge of the physical universe, In some respects this was a hindrance but in others an advantage; it left a powerful intellect unhampered by authority and led a logical mind to pursue its inquiries into diffi cult and obscure paths which might intimidate the more conventionally trained.” ( http://pubs.rsc.org/en/content/pdf/article/1935/jr/jr9350001327)
One of his major contributions was the derivation by novel geomet-ric arguments of the 230 space groups. Then, he proposed the crystal structures of a number of materials. In 1883, Barlow showed that there are two ways to close-pack spheres to most effi ciently fi ll space and, in fact, a large number of metals have one of these two arrangements. In 1898 he proposed crystal structures for simple salts like NaCl and CsCl. The structures were based on the close-packing of spherical atoms with different sizes ( Barlow 1898 ). At the time his ideas were met with skep-ticism, but as we shall see he was correct.
It became increasingly important to develop a technique by which the crystal structure of a material could be determined in the labora-tory. The story of this achievement begins with the discovery of x-rays in 1895 by Wilhelm Röntgen, a physics professor at the University of Würzberg. Like many scientists at the time he was studying the proper-ties of electrons, then called cathode rays. To generate electrons, metal electrodes are placed at each end of a partially evacuated glass tube. When a large electric fi eld is discharged across the electrodes some of the remaining gas molecules in the tube are ionized. The resulting pos-itively charged ions are attracted to the negative electrode, the cathode, and when they hit the cathode, large numbers of electrons are pro-duced. These in turn are accelerated toward the positive electrode, the anode. To observe the cathode rays, the end of the tube is coated with a fl uorescent material. Many of the rapidly moving electrons pass by the anode and hit the end of the tube producing a glow. Röntgen had blocked the glow from the coating with cardboard. Quite unexpectedly, he observed a faint glow on a sheet of fl uorescent material that was lying a few feet away from the tube. The appearance of the glow was correlated with the electrical discharge in the tube. He proceeded to show that the origin of this new kind of radiation was the anode. The electrons hitting the anode had caused a new type of radiation to be emitted.
This new kind of ray passed right through the glass tube, whereas electrons were absorbed in the glass. The penetrating power of this new
OUP CORRECTED PROOF – FINAL, 12/28/11, SPi
The Architecture of Sand 23
radiation is illustrated by the famous picture of the hand of Röntgen’s wife with the clear outline of all of the bones in her hand and her wed-ding ring. Röntgen gave this new type of radiation the name x-rays to indicate that their nature was unknown. Wilhelm Röntgen was awarded the fi rst Nobel Prize in Physics in 1901 for the discovery of x-rays.
The seminal experiment to understand the nature of x-rays was per-formed at the University of Munich in 1912 by Max von Laue, Paul Friedrich, and Walter Knipping ( Friedrich et al . 1912 ). This experiment completely revolutionized our understanding of both the nature of x-rays and of the structure of crystalline materials. It was known at the beginning of the century that light and sound propagated as waves, but von Laue put forth the idea that Röntgen rays or x-rays also propagated like waves. Further, he speculated that the spacing between atoms is comparable to the wavelength of the x-rays. If the atoms in a crystal are arranged in periodic arrays, then the x-rays that scatter off the atoms interfere with each other. Just as light is diffracted from a diffraction grating, x-rays are diffracted by crystals. Von Laue asked Friedrich and Knipping to try to observe the diffraction of x-rays.
They did an experiment in which a beam of x-rays was directed toward a photographic plate. They placed a crystal (they chose to use copper sulfate and zinc sulfi de) between the x-ray source and the pho-tographic plate. When the plate was developed, it showed a symmetric pattern of spots arrayed around the spot created by the x-ray beam. The x-rays were diffracted by the crystal to form the symmetric pattern.
Von Laue derived a set of three equations (now known as the Laue equations) that both described the diffraction from a three-dimensional array or lattice of atoms and accounted for the positions of the spots on the fi lm. Von Laue, Friedrich, and Knipping had established that x-rays propagated as waves and that crystals were composed of ordered arrays of atoms with the spacing between the atoms being comparable to the wavelength of the x-rays. Max von Laue was awarded the Nobel Prize in Physics in 1914.
Word of the discovery of the diffraction of x-rays spread rapidly across Europe, and it was a twenty-two-year-old graduate student in physics at Cambridge University, William Lawrence Bragg, who was in the right place at the right time to take the next step. Max von Laue had shown that the atoms in copper sulfate and zinc sulfi de were arranged in periodic arrays, but what was the actual arrangement of the atoms in the unit cell, in other words, what was the crystal structure? Bragg deter-mined the crystal structure of zinc sulfi de and became the father of x-ray crystallography.
Lawrence Bragg had received copies of the papers of von Laue, Friedrick, and Knipping from his father, William Henry Bragg, who was a professor of physics at the University of Leeds. (Both father and son had the same fi rst name, William, so the son is referred to by his middle name—William Bragg, the father, and Lawrence Bragg, the son.) As a
OUP CORRECTED PROOF – FINAL, 12/28/11, SPi
Sand and Silicon24
student, Lawrence Bragg was taking courses on optics and learning how light waves were refl ected and refracted from crystals. At the same time, he was aware of the predictions for the structures for simple compounds that had been made by William Barlow ( Hunter 2004 ).
Lawrence Bragg had the insight to use ideas from optics and to make the analogy between the refl ection of light and the refl ection of x-rays from planes of atoms in a crystal. As described in Box 2.1 , this leads to an equation that relates the distance between the planes to the wave-length of the x-rays and the angle of diffraction. This is now known as Bragg’s Law, and it is the basis for all x-ray crystallography. Using Bragg’s Law and Barlow’s ideas about the most effi cient way to pack atoms in a crystal, Lawrence Bragg proposed a model for the crystal structure of zinc sulfi de that accounted for both the position and the relative intensity of all of the diffraction spots observed by Friedrich and Knipping ( Bragg 1913 and Bragg and Bragg 1913 ).
One of the most successful father and son collaborations in science grew out of this experiment ( Jenkin 2008 ). William Henry Bragg, the father of William Lawrence Bragg, was born on 2 July1862 in Cumberland England between the Solvay Firth and the Irish Sea. He went to Trinity College, Cambridge in 1881 and, as was common at that time, started his scientifi c career at one of the universities in the broad reaches of the British Empire. In 1886 he became professor of mathe-matics and experimental physics at the University of Adelaide in Australia, where his fi rst few years were devoted to teaching and to establishing a strong physics department. His son, William Lawrence Bragg, was born in Adelaide on 31 March 1890. After the discovery of x-rays in 1896, William set up an x-ray tube and took the fi rst medical x-ray in Australia of his son’s broken arm.
As with the Curies, William Bragg became interested in Becquerel rays. The Curies had concentrated on looking for other materials that exhibited this new type of radiation, and William Bragg began to study how these rays were absorbed by different materials. The last decade of the nineteenth century was an exciting time in science with the discov-ery of the electron by J. J. Thompson (1895), x-rays by Wilhelm Röntgen (1896), and alpha particles by Henri Becquerel (1896). As beams of electrons and x-rays pass through materials, they are absorbed, and the intensity of the beams decreases exponentially with increasing depth. William Bragg found that alpha particles behaved differently. They were mainly absorbed at a defi nite depth inside the material rather than decreasing steadily with increasing depth. (This result will be discussed further in Chapter 4 .) These results and experiments on the nature of x-rays led to William’s growing reputation in the scientifi c community and, in 1909, he was offered the position of Cavendish professor of physics at the University of Leeds in England.
At Leeds, William turned his attention to the properties of x-rays. Charles Barkla, a British physicist at the University of Edinburgh, had
OUP CORRECTED PROOF – FINAL, 12/28/11, SPi
The Architecture of Sand 25
studied the absorption of x-rays. He found that when a beam of x-rays is absorbed in a material that x-rays with a different, longer wavelength are re-emitted. The re-emitted x-rays depended on the chemical ele-ments in the material, and each element had a set of characteristic x-rays. The fact that each element, independent of its chemical environ-ment, had a unique signature in its pattern of characteristic x-rays gave chemists a new type of spectroscopy with which to analyze unknown materials. Charles Barkla received the Nobel Prize in Physics for this discovery in 1917.
William Bragg built the fi rst x-ray diffractometer to accurately deter-mine the wavelengths of the characteristic x-rays. Bragg’s Law relates the spacing between the planes in a crystal to the wavelength of the x-rays. If either quantity is known, then the other can be calculated from Bragg’s Law and the angle of diffraction. In a diffractometer a beam of character-istic x-rays emitted by an element is directed toward a crystal. The angle that the face (planes) of the crystal makes with the beam of x-rays is slowly increased, and the angle that the x-ray detector makes with the x-ray beam is increased at twice that rate. This is similar to the refl ection of light from a mirror. The angle at which the incoming beam hits the crystal is equal to the angle at which the outgoing beam leaves the crystal. A large increase in intensity of scattered x-rays is observed at the angle where Bragg’s Law is satisfi ed for the characteristic x-rays of the element used as the source of x-rays. If one uses the same crystal but different ele-ments as the source of x-rays, then one can accurately measure the differ-ences in the characteristic x-rays for each source. William Bragg used the diffractometer to determine the wavelengths of the characteristic x-rays of the elements iridium, nickel, platinum, and tungsten.
An interesting sidebar to William Bragg’s research on characteristic x-rays illuminates how physics priorities were set at the beginning of the twentieth century. Probably the most famous professor of physics in England at the time was Ernest Rutherford, who we will discuss in Chapter 4 . Rutherford had begun his career in New Zealand and had been a mentor and friend of William Bragg. Rutherford, who was then at the University of Manchester, had two students, C. G. Darwin and G. J. Mosley, who were also studying the characteristic x-rays of the elements. Bragg had in fact tutored them on the use of the diffractom-eter. Rutherford asked Bragg to delay publication of his results until Darwin and Mosley could get their own results ready for publication, and Bragg complied with his friend’s request. This type of gentleman’s agreement on priorities in doing research has greatly diminished in recent times owing in part to the competitive nature of scientifi c research and to the pressures of obtaining research funds. Bragg decided to leave that area of research to them and to collaborate with his son on the structure of materials ( Jenkin 2008 ).
Over the next couple of years they determined the crystal structures of 16 different materials. They began with the simple crystals, like
OUP CORRECTED PROOF – FINAL, 12/28/11, SPi
Sand and Silicon26
sodium chloride and potassium chloride and diamond, which is a form of the element carbon. (The structure of silicon, which is the same as that of diamond, is discussed in Box 2.1 .) They continued on to more complicated minerals, like quartz that was described in Chapter 1 .
This new tool to determine the architecture of the atomic world changed many prevailing ideas of the structure of materials. For exam-ple, chemists had been convinced that crystals of sodium chloride were made up of molecules of “NaCl.” They reasoned that molecules are held together by chemical bonds. Sodium has one bonding electron and chlorine needs an additional electron to fi ll its outer shell of electrons. By bonding together, both sodium and chlorine would have fi lled outer shells of electrons. However, the structure determined by x-ray diffrac-tion showed that each sodium atom was surrounded by six chlorine atoms that were equally spaced, and each chlorine was surrounded by six equally spaced sodium atoms. There were no molecules of “NaCl” in a crystal of sodium chloride. Actually knowing how the atoms are arranged in salt in turn led to the concept of ionic bonding that was developed by Linus Pauling and mentioned in Chapter 1 .
Unfortunately, the onset of the First World War in 1914 temporarily stopped the development of x-ray diffraction. Both Braggs contributed to the war effort. They used their knowledge of physics to develop sys-tems to detect submarines and gun emplacements. William Bragg worked for the British Board of Invention and Research. He developed a directional hydrophone to listen for submarines but, as discussed in Chapter 1 , the echo sonar developed by Paul Langevin became the pre-ferred method of submarine detection.
Lawrence Bragg was in the artillery and developed a sound ranging system to locate enemy gun emplacements. He set up a series of micro-phones spaced along the trenches and recorded the differences in the time of arrival of the report of an enemy cannon being fi red. From those differences, he could calculate the position of the German cannon. He could also listen for the reports of British shells exploding near to the German battery and tell the British artillery how to adjust their fi re to destroy it.
In 1915, while at the front in France, Lawrence received a letter that announced that he and his father had been awarded the 1915 Nobel Prize in Physics for their work on x-ray spectroscopy and x-ray diffrac-tion. Lawrence Bragg became and still is the youngest scientist to win the Nobel Prize. Because of the war, the prizes were not presented until 1920.
William Bragg moved to University College London in 1915 and, after the war, started the fi rst effort to determine the structures of organic molecules like anthracene and naphthalene. One of his students, Kathleen Lonsdale, determined the structure of benzene and went on to become the fi rst woman elected a Fellow of the Royal Society and the fi rst female tenured professor at University College London.
OUP CORRECTED PROOF – FINAL, 12/28/11, SPi
The Architecture of Sand 27
Lawrence Bragg moved to the University of Manchester after the war and continued research using the diffraction of x-rays to determine more and more complicated crystal structures ( Box 2.1 ). He also used x-rays to determine the size of atoms in a crystal and to study subtle changes in the structure of materials as a function of temperature. A well known model for a particular type (order–disorder) of transition is called the Bragg–Williams model.
In 1938 he became director of the Cavendish Laboratory at Cambridge University. The position was held by Ernest Rutherford until his death, and it was quite an honor for Lawrence Bragg to be appointed to the most prestigious position in physics in England. During his tenure he encour-aged the development of new areas of research such as biology. He sup-ported a young graduate student named Max Perutz who wanted to pursue what seemed at the time an impossible goal—to solve the crystal struc-ture of hemoglobin. This was long before computers, and the diffraction pattern of a large molecule like hemoglobin contains thousands of Bragg refl ections. Perutz had to measure the intensity of a large fraction of them. To determine where the atoms are in the unit cell of a crystal of hemo-globin, he had to make thousands and thousands of calculations using mechanical calculators. This was a tour de force and in the end through enormous perseverance Perutz determined the structure.
It was while Lawrence Bragg was the director of the Cavendish Laboratory that John Kendrew, Francis Crick, and James Watson joined the laboratory. Crick and Watson shared the Nobel Prize in Medicine with Maurice Wilkins in 1962 for the discovery of the structure of DNA, and Perutz and Kendrew shared the Nobel Prize in Chemistry in the same year for determining the structure of globular proteins. Sir William Lawrence Bragg determined the fi rst crystal structure, zinc blende, thereby founding the fi eld of x-ray crystallography, and near the end of his long and distinguished career, he directed the laboratory that deter-mined the structure of life itself.
BOX 2.1 X-ray Diffraction and the Structure of Crystals
When we go to the supermarket, everything has a bar code, a one-dimensional
sequence of bars, stamped on it for identifi cation. It is the way that the laser
scanner at the checkout counter recognizes what is being bought. In biology and
in law enforcement, DNA sequencing produces an analogous bar code, which
can be used as a means of identifi cation. Each bar represents a different DNA
fragment that can be identifi ed by its position on the strip. The pattern of bars for
each sample is unique.
The bar code of materials science is x-ray powder diffraction in which the
intensity of the x-rays diffracted from a sample composed of millions of randomly
oriented microcrystals (referred to as a powder) is recorded as a function of the
(cont.)
OUP CORRECTED PROOF – FINAL, 12/28/11, SPi
Sand and Silicon28
diffraction angle. This gives a one-dimensional sequence of Bragg refl ections.
When a new material is synthesized, an x-ray powder diffraction pattern is
obtained to provide a unique characterization of the material.
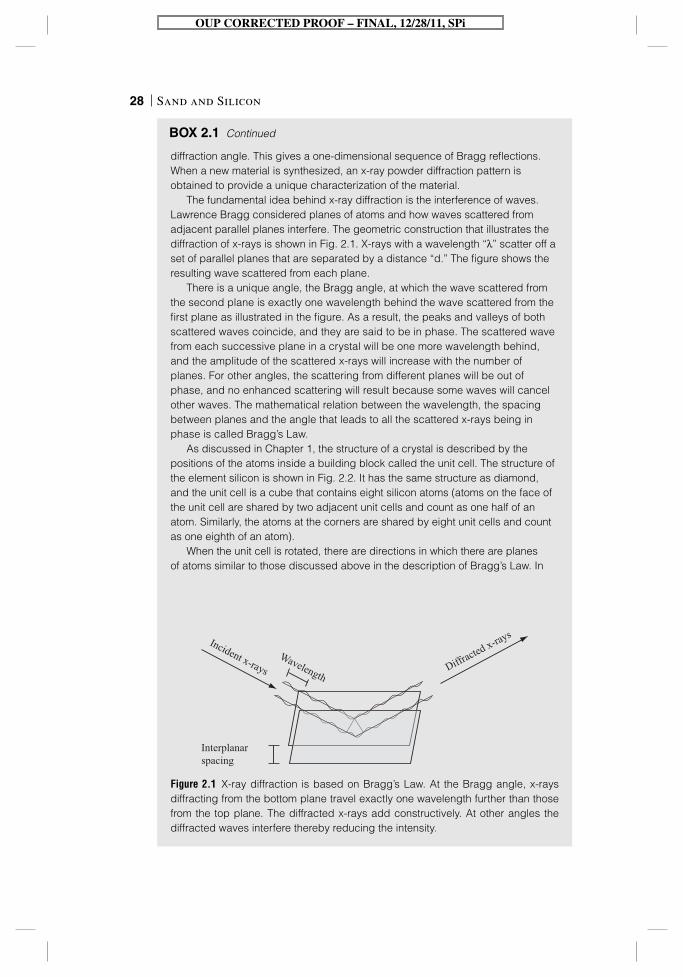
The fundamental idea behind x-ray diffraction is the interference of waves.
Lawrence Bragg considered planes of atoms and how waves scattered from
adjacent parallel planes interfere. The geometric construction that illustrates the
diffraction of x-rays is shown in Fig. 2.1 . X-rays with a wavelength “λ” scatter off a
set of parallel planes that are separated by a distance “d.” The fi gure shows the
resulting wave scattered from each plane.
There is a unique angle, the Bragg angle, at which the wave scattered from
the second plane is exactly one wavelength behind the wave scattered from the
fi rst plane as illustrated in the fi gure. As a result, the peaks and valleys of both
scattered waves coincide, and they are said to be in phase. The scattered wave
from each successive plane in a crystal will be one more wavelength behind,
and the amplitude of the scattered x-rays will increase with the number of
planes. For other angles, the scattering from different planes will be out of
phase, and no enhanced scattering will result because some waves will cancel
other waves. The mathematical relation between the wavelength, the spacing
between planes and the angle that leads to all the scattered x-rays being in
phase is called Bragg’s Law.
As discussed in Chapter 1 , the structure of a crystal is described by the
positions of the atoms inside a building block called the unit cell. The structure of
the element silicon is shown in Fig. 2.2 . It has the same structure as diamond,
and the unit cell is a cube that contains eight silicon atoms (atoms on the face of
the unit cell are shared by two adjacent unit cells and count as one half of an
atom. Similarly, the atoms at the corners are shared by eight unit cells and count
as one eighth of an atom).
When the unit cell is rotated, there are directions in which there are planes
of atoms similar to those discussed above in the description of Bragg’s Law. In
Interplanarspacing
Incident x-raysWavelength
Diffracted x-rays
Figure 2.1 X-ray diffraction is based on Bragg’s Law. At the Bragg angle, x-rays
diffracting from the bottom plane travel exactly one wavelength further than those
from the top plane. The diffracted x-rays add constructively. At other angles the
diffracted waves interfere thereby reducing the intensity.
BOX 2.1 Continued
OUP CORRECTED PROOF – FINAL, 12/28/11, SPi
The Architecture of Sand 29
Fig. 2.2 planes that are perpendicular to three different directions in the cube are
shown. These include the body diagonal, the face diagonal, and the cube edge.
To determine the crystal structure of a material, the intensity of the diffracted
x-rays is measured at the diffraction angles corresponding to as many planes as
possible. In a modern version of William Bragg’s diffractometer, a computer
controls stepping motors that orient both the crystal and the x-ray detector to
sequentially measure the intensity of the scattering from the different planes.
For less complicated crystals a collection of microcrystals with random
orientation (a polycrystalline or powder sample) can be used. With increasing
angle, a series of Bragg refl ections will be observed when different planes of
atoms in the structure satisfy Bragg’s Law for some of the microcrystals. This is
referred to as an x-ray powder diffraction pattern. The x-ray powder diffraction
patterns (bar codes) for the element silicon and for quartz (sand) are shown in
Fig. 2.3 .
From the measured diffraction angles, a set of interplanar spacings or “d”
spacings is calculated using Bragg’s Law. The crystallographer in turn deduces
the dimensions and the symmetry of the unit cell that uniquely accounts for all the
“d” spacings. The space group and the positions of the atoms in the unit cell are
determined by analyzing the relative intensities of the different Bragg refl ections.
For example, in Fig. 2.2 the spacing marked “d 4 ” corresponds to planes of
atoms that are separated by one fourth of the unit cell dimension, a/4, where “a”
is the dimension of the unit cell. Mathematically there are also planes that are
separated by a, and a/2. However, for planes that are separated by a/2 there are
(cont.)
d1 d2 d4
Figure 2.2 The structure of silicon (top) showing the tetrahedral bonds around each
of the silicon atoms inside the unit cell. The structure of silicon is projected perpen-
dicular to three directions in the unit cell (body diagonal, face diagonal, and cube
edge) to illustrate the spacing between the different planes of atoms that are shown
at the bottom.
OUP CORRECTED PROOF – FINAL, 12/28/11, SPi
Sand and Silicon30
planes of atoms that are halfway in between those planes. X-rays scattered from
these planes are exactly one half a wavelength behind the atoms in the planes
that are separated by a/2. Their peaks and valleys are exactly opposite and
cancel the scattering from the planes of atoms that are separated by a/2. As a
result, the intensity of a Bragg refl ection corresponding to a spacing of a/2 is
zero. A similar analysis shows that the intensity of a Bragg refl ection
corresponding to planes separated by a distance “a” is also zero.
To determine the crystal structure of diamond, the Braggs systematically
analyzed all possible Bragg refl ections for a cubic unit cell to see which ones had
a measurable intensity and which ones had zero intensity. This is a mathematical
puzzle and a unique solution is found by trial and error. Today, sophisticated
computer programs sort through possible solutions to the puzzle and fi nd the
best agreement between the observed Bragg refl ections and those calculated for
different models. The Braggs concluded that the structure of diamond had a
face-centered cubic Bravais lattice.
The position of an atom is defi ned in terms of three coordinates x, y, and z that
give the position in terms of the fraction of the unit cell dimension along the three
axis of the unit cell. For a face-centered cubic Bravais lattice, if there is an atom
00
10,000
20,000
30,000
40,000
10 20 30 40 50
Diffraction angle
Inte
nsity
0
20,000
40,000
60,000
80,000
0 10 20 30 40 50
Diffraction angle
Inte
nsity
Figure 2.3 X-ray powder diffraction patterns (bar codes) for silicon (top) and
α-quartz (bottom). The 1st, 2nd, and 4th Bragg refl ections for silicon correspond to
diffraction from the planes shown in Fig. 2.2 . The unit cell is derived from the angles
of the Bragg refl ections using Bragg’s Law, and the positions of the atoms inside
the unit cell are derived from the intensities of the Bragg refl ections. (Courtesy of
Peter Stephens, State University of New York at Stonybrook. Measurements done
at the National Synchrotron Light Source at Brookhaven National Laboratory that is
supported by the US Department of Energy.)
BOX 2.1 Continued
OUP CORRECTED PROOF – FINAL, 12/28/11, SPi
The Architecture of Sand 31
at (x, y, z), then symmetry requires that there will also be atoms at (½+x, ½+y, 0),
(½+x, 0, ½+z), and (0, ½+y, ½+z). After much trial and error the Braggs found that
the structure of diamond had an atom at (0, 0, 0) and those generated by the
face-centered lattice (½, ½, 0), (½, 0 ½), and (0, ½, ½). There was also an atom at
(¼, ¼, ¼) and the face-centered cubic positions (¾, ¾, ¼), (¾, ¼, ¾), and (¼, ¾,
¾) (see Fig. 2.2 for silicon). This model for the crystal structure of diamond
accounted for all of their observations. The model predicted those Bragg refl ec-
tions that have measurable intensities and those that have zero intensity.
In the structure of diamond or silicon all of the atoms are at positions
corresponding to simple fractions of the unit cell dimensions, and these are
called special positions. This was also true for many of the other structures that
the Braggs determined in their early work like zinc blende (ZnS), NaCl, and KCl.
However, the structure of quartz is more complicated as is evident from the
powder pattern in Fig. 2.2 . The structure of quartz (Fig. 1.7) has atoms that do not
occupy positions that are all simple fractions of the unit cell dimensions. The
atoms no longer lie exactly on simple planes so the scattering from individual
atoms in a unit cell may either add or subtract from the overall scattering from a
given plane. To solve the structure of quartz, Lawrence Bragg and R. E. Gibbs
had to calculate how the intensity of each observed Bragg refl ection varied for
different values for (x,y,z) for both the silicon and the oxygen atoms. After many
attempts they found a set of values that were consistent with all of the
measurements. This is the structure described in Chapter 1 .
As crystallographers tried to solve the structures of increasingly more
complicated materials, it was obvious that this type of trial and error search for a
structure that uniquely accounted for the diffraction measurements was becoming
more and more diffi cult. Again, with his knowledge of optics, Lawrence Bragg
realized that Fourier analysis could be used to determine crystal structures
(an illustration of Fourier analysis is at: http://www.ysbl.york.ac.uk/~cowtan/fourier/
ftheory.html) . A mathematical operation called a Fourier transform is used to
convert the set of amplitudes for all the Bragg refl ections into a three-dimensional
map of the electron density in the unit cell. As x-rays scatter from the electrons in
an atom, the map shows directly the positions of the atoms in the structure where
there is a large concentration of electrons.
The problem is that the intensity is measured in an x-ray diffraction
experiment, and the intensity is the square of the amplitude. A wave is
characterized by an amplitude and a phase that measures how far the wave has
advanced at any given instant from an arbitrary point. Both the amplitude and the
phase are needed to calculate the Fourier transform. The history of the fi eld of
x-ray crystallography since the 1920s centers on trying to fi nd ways to determine
the phase of the scattering from each Bragg refl ection.
In the fi rst application of Fourier analysis, the structure of the mineral diopside
CaMg(SiO 3 )
2 was solved by Lawrence Bragg and Bertrum Warren in 1926. They
calculated a one-dimensional Fourier projection along one of the principle
directions of the unit cell. This required making 35,000 calculations by hand!
Various mechanical aids and other types of projection functions were
developed in the 1930s and 1940s to facilitate the determination of the structures
of complex materials with many independent atoms and ever increasing unit cell
dimensions. In retrospect, a remarkable number of complex crystal structures
(cont.)
OUP CORRECTED PROOF – FINAL, 12/28/11, SPi
Sand and Silicon32
To illustrate the importance of x-ray crystallography to twentieth century science, let’s look at a group of materials derived from sand ( Fig. 2.4 ) to see how scientists modify the architecture of sand to pro-duce new materials. The materials in Fig. 2.4 have obvious visual dif-ferences, but what is less obvious is that they have an enormous range of densities. The densities differ by a factor of 100 from 5 gm/cm 3 for the quartz in the fl int arrowhead to 0.03 gm/cm 3 for the aerogel.
It is hard to appreciate from a black and white illustration what a density approximately 100 times lower than that of quartz means. The density of aerogel is only approximately 30 times that of air! Pick up a piece of this translucent blue material and it appears to have almost no
BOX 2.1 Continued
were solved by crystallographers in the 1930s, 1940s, and 1950s based to a
large extent on their intuition and knowledge of structural chemistry.
One example that I have always admired is the determination of the structure
of the alpha phase of plutonium metal during the Manhattan Project in the Second
World War ( Zachariasen and Ellinger 1963 ). In order to understand the chemistry
of these new manmade elements, the crystal structures of the transuranium
elements and their chemical compounds had to be determined. As plutonium
was made literally atom by atom in a nuclear reactor, only small polycrystalline
samples were available in the beginning, and W. H. Zachariasen solved the
structure from a powder diffraction pattern. Because of the complexity of the
structure, the intensities of many of the Bragg refl ections that occur at low angles
were not observable. Normally one relies on the Bragg refl ections that occur at
low angles to determine the unit cell. Zachariasen was able to determine the
monoclinic unit cell of alpha plutonium and in turn its unusual structure. In a
monoclinic crystal all three unit cell dimensions are different and one of the
angles between the axes is not 90°. My fi rst scientifi c paper in 1961 on the very
much simpler structure of americium metal, the next element after plutonium in
the periodic table, was in collaboration with Zachariasen, and it was always a
humbling experience to watch him solve crystal structures by trial and error.
Needless to say, it was the development of the computer that opened the door
to solving the structures of really complex materials like proteins. Not only did this
enable the calculation of electron density once the phases had been determined,
but it allowed crystallographers to optimize the positional parameters of all of the
atoms in the unit cell. The crystallographer proposes a model for the structure of
a material and then calculates the amplitudes of the Bragg refl ections expected
for that model. The calculated amplitudes are then compared with the measured
amplitudes. Using high speed computers, the crystallographer minimizes the
differences between the observed and calculated amplitudes to obtain the most
accurate model of the structure.
2012 is the hundredth anniversary of the discovery of x-ray diffraction. It has
revealed the architecture of the atomic world from simple compounds to complex
biological materials, and it has proved to be one of the most important scientifi c
discoveries of the twentieth century.
OUP CORRECTED PROOF – FINAL, 12/28/11, SPi
Figure 2.4 Materials made from sand (silica): (top) (a) fl int arrowhead and
(b) quartz optical fi ber (reprinted with permission of Alcatel-Lucent USA Inc.);
(middle) (c) scolecite (courtesy of the President and Fellows of Harvard College)
and (d) opal (courtesy of the Smithsonian Museum); (bottom) (e) silica gel and
(f) aerogel. The networks of corner-sharing tetrahedrons on going from fl int to
aerogel are progressively more open with a corresponding decrease in density by a
factor of a hundred.
OUP CORRECTED PROOF – FINAL, 12/28/11, SPi
Sand and Silicon34
weight at all. In Fig. 2.4 , the aerogel is sitting on a bed of sand, and one can see the sand through the semitransparent aerogel.
The architecture of sand, as revealed by x-ray diffraction, is con-structed from one building block, the tetrahedron ( Fig. 2.5 ). The chemi-cal properties of silicon and oxygen result in an architecture in which there is a network of tetrahedrons. Each tetrahedron is composed of a silicon atom at the center and oxygen atoms at the four corners. The tetrahedrons are linked together by sharing corners to form extended networks that vary depending on the material.
The tetrahedrons occur because of the directional chemical bonds that are the glue that hold atoms together. The model of directional chemical bonds was developed in the 1920s by Gilbert Newton Lewis and Linus Pauling in the early days of quantum mechanics, as described in the last chapter. The electrons in an atom occupy orbitals that defi ne the probability of fi nding an electron in terms of its distance from the nucleus and in terms of the symmetry of the orbital ( Pauling 1960 ). The lobes of the orbitals in silicon point toward the corners of a tetrahedron. In sand, the electrons in the four lobes form bonds with four adjacent oxygen atoms ( Fig. 2.5 ). Each oxygen in turn is shared by two adjacent tetrahedrons leading to a three-dimensional network of corner-sharing tetrahedrons.
The materials in Fig. 2.4 differ not only in the density of the network of tetrahedrons but also in the degree of order or regularity in the net-work. The crystal structure of quartz was discussed in the last chapter ( Fig. 1.7 ). Quartz crystals have an ordered array of tetrahedrons, but the quartz fi ber in Fig. 2.4 has a random network of tetrahedrons. Flint and zeolites like scolecite are crystalline (or composed of microcrystallites) and have ordered networks. Opal has a unique partially ordered struc-ture, and silica gels and aerogels are disordered and have random networks.
Figure 2.5 The electron orbitals in the silicon atom point toward the corners of a
tetrahedron, and the silicon atom forms bonds with four oxygen atoms. As a result,
the architecture of sand can be viewed as a three-dimensional network of corner-
sharing tetrahedrons.
OUP CORRECTED PROOF – FINAL, 12/28/11, SPi
The Architecture of Sand 35
The most common materials with a random network of tetrahedrons are the many forms of glass. They are made by heating together silica and two or more metal oxides. The nature of a glass depends on the mixture, but glass is usually hard and brittle. When it is heated, it sof-tens and can be blown, rolled, or shaped into any desired form. The glass industry uses about 10 million tons of sand yearly to make glass containers, windows, fi berglass, and a whole host of everyday products. There are many books on the history and uses of glass, and we defer to them for more extensive discussions ( Macfarlane and Martin 2002 ). Instead, our discussion of sand concentrates on comparing the structure of crystals with the structure of disordered materials like glass. When silicon dioxide is melted and then the liquid is cooled rapidly, it forms a glass rather than one of the crystalline forms of quartz. The structure is still composed of corner-sharing silicon–oxygen tetrahedrons, but they form a random network. In a glass only average distances between the atoms and the average angles between different chemical bonds can be determined using x-ray diffraction.
The difference between an ordered network of corner-sharing tetrahe-drons and a disordered network is illustrated in Fig. 2.6 . The drawing on the left is a projection of a layer of the structure of the mineral tridymite that is one of the phases of silica (sand). The tetrahedrons form rings com-posed of six tetrahedrons that are arranged in an ordered hexagonal array.
On the right of Fig. 2.6 is a hypothetical model of a disordered two-dimensional array of tetrahedrons that is based on one of the fi rst
Figure 2.6 Comparison of an ordered network of tetrahedrons in a crystal of the
mineral tridymite and a hypothetical, two-dimensional, disordered network in a
glass (the latter is adapted from Zachariasen 1932 ). In tridymite there are ordered
rings composed of six tetrahedrons whereas in the model for a glass there are dis-
ordered rings of 4, 5, 6, 7 tetrahedrons.
OUP CORRECTED PROOF – FINAL, 12/28/11, SPi
Sand and Silicon36
attempts to describe the structure of a glass by W. H. Zachariasen ( Zachariasen 1932 ). In crystalline quartz there are ordered arrays of rings formed by six tetrahedrons. In a random network there will be a mixture of rings that have 4, 5, 6, or 7 tetrahedrons that are all inter-connected. In a real glass there is a three-dimensional random array of rings, but the concept is more easily illustrated with the two- dimensional model shown in Fig. 2.6 .
Let’s follow the changes in the architecture of the tetrahedral net-works going from the most dense material—fl int—to the least dense—aerogel. Flint was one of the earliest materials used by man to make tools. Pieces of fl int aren’t like large single crystals of quartz with regu-lar faces ( Fig. 1.1 ). Instead they have irregular shapes. On a microscopic scale fl int is composed of millions and millions of microcrystals. X-ray diffraction studies reveal that fl int is composed predominantly of micro-crystals of quartz. So on the microscopic scale, the structure and the composition of the crystallites is identical to the large crystals of quartz discussed in Chapter 1 . Recent studies have found that fl int usually con-tains a small percentage of crystallites of another form of silica called Moganite ( Heaney and Post 1992 ) in addition to quartz.
Flint is found in sedimentary rock formations. Eons ago dissolved carbonates like CaCO
3 reacted with SiO
2 to form CaSiO
3 and CO
2 . The
CaSiO 3 dissolved in water to form silicic acid, [SiO
x (OH)
4-2x ]
n . (This
reaction is important in the growth of marine organisms like diatoms, as discussed later in the chapter. It is also an important chemical reaction in the carbon dioxide cycle that controls the concentration of CO
2 in the
ocean.) Over time the silicic acid that is trapped in pockets in rocks became more concentrated as the water evaporated and microcrystals of quartz grew out of the supersaturated solution. The microcrystals were pressed together on geologic time scales to form fl int by the weight of the sedimentary layers that deposited on top of the rock formations.
Flint can be shaped into arrowheads and other primitive weapons by a process called knapping. Repeatedly hitting a piece of fl int with a stone causes chips to fl ake off. This allowed early man to shape tools like the fl int arrowhead in Fig. 2.4 . Later it was found that sparks result when fl int is struck against a piece of metal. Small pieces of metal fl y off and in the process they are heated by abrasion producing sparks. This method is used to start campfi res; to ignite the gunpowder in a fl intlock rifl e; or to provide the sparks in cigarette lighters and gas bar-beques. So, even from prehistoric times materials derived from sand were essential to human progress ( Mason 1978 ).
Many important industrial materials are composed of ensembles of microcrystallites. Mixtures of oxides that have been heated so that the microcrystals adhere to each other are called ceramics. Unlike fl int, where the microcrystallites are just pressed together, the heating or sin-tering of the microcrystallites in ceramics leads to crystallites that are bonded together. Early man learned how to make slurries of clay and
OUP CORRECTED PROOF – FINAL, 12/28/11, SPi
The Architecture of Sand 37
then shape and heat them to make pottery. Through the centuries arti-sans learned how to improve the quality and strength of these materials by controlling the size of the microcrystals and how they were sintered. With the development of x-ray diffraction, twentieth century ceramic engineers correlated the microstructure of the ceramic with its proper-ties to tune the properties according to the application.
Flint and ceramics are composed of microcrystals, in contrast to a glass that is disordered and superfi cially resembles a frozen liquid. Twentieth century science has led to more complex materials that com-bine the attributes of microcrystals and glass. These are called glass ceramics, and they are composed of microcrystals embedded in a glass matrix. Some compositions of glass ceramics have very small coeffi -cients of thermal expansion. This means that they can experience rapid changes in temperature without cracking. Because of their insensitivity to thermal shocks, these materials are used to make stovetops like CERAN ® by Schott Corporation and cookware such as CorningWare ® , CORELLE ® ( Fig. 2.7 ), and VISIONS ® by World Kitchens, LLC.
The beauty of glass ceramics is that they can be shaped while in the glassy state and then processed to make the composite of microcrystals and glass. To make a glass ceramic, sand and other oxides are heated together to form a glass. The glass is fi rst heated to soften it and then shaped or molded into the desired product. Finally, the glass is heated to a temperature where microcrystals start to grow. The fi nal product is composed predomi-nantly of microcrystals, which have the same structure as phases of silica like b-quartz or cristobalite, embedded in a matrix of the remaining glass.
Figure 2.7 Glass ceramics have low thermal expansion and are used in heat resist-
ant dinnerware such as CORELLE ® . They are a composite of silica microcrystals
embedded in a glass matrix.
OUP CORRECTED PROOF – FINAL, 12/28/11, SPi
Sand and Silicon38
The trick of course is to get the crystallites to grow in the glass so that crystallites of similar size are more or less uniformly distributed in the glass matrix. In order to grow crystallites, small regions or nuclei have to separate out of the surrounding glass. These nucleation sites then proceed to grow to form microcrystals.
In 1956 Stanley Stookey at the Corning Glass Works discovered that the addition of small amounts of titanium oxide to the glass provided the necessary nucleation sites, and this gave birth to the wide variety of heat resistant surfaces and dinnerware that have become another exam-ple of everyday products that started with small grains of sand and other oxides ( Stookey 1956 ).
Glass, fl int, and ceramics are materials where the microstructure is changed during growth, but the overall density is similar. Let’s go back to crystals like quartz and ask: how can the density be changed by modi-fying the network of tetrahedrons at the atomic scale? The structure of quartz contains tunnels running through the structure as illustrated in Fig. 1.7. There are also tunnels running through other phases of silica. In the mineral tridymite ( Fig. 2.6 ) the tunnels are formed by rings of six corner-sharing tetrahedrons with alternate tetrahedrons pointing up and down. The rings are interconnected to form sheets of six-membered rings.
The minerals quartz, crystobalite, and tridymite have the same com-position as silicon dioxide. All three have crystal structures with tunnels composed of six-membered helices (quartz) or rings (crystobalite and tridymite). The difference between the structures of the minerals crysto-balite and tridymite is in the way in which the layers are stacked. In both cases the resulting structures have tunnels running through them because the six-membered rings line up on top of each other ( Heaney 1994 ).
The tunnels in quartz, cristobalite, and tridymite are 0.1 nanometers (nm) in diameter, and only very small ions like lithium can fi t inside the tunnels. Nature and man make materials with much larger tunnels and correspondingly lower densities. These include zeolites where the tun-nels are approximately 1 nm in diameter; silica gels with pore sizes between 2 and 50 nm and aerogels with pores greater than 50 nm (Everett 1972 and Brinker 1996 ). It is this enormous range in pore sizes that accounts for the large range in densities exhibited by the materials in Fig. 2.4 . Let us not forget that we are discussing the structure of materials in the nano-world. To keep the scale of the size of the pores in perspective, the diameter of a human hair is of the order of 100,000 nm.
Zeolite is the name given to a group of naturally occurring minerals and synthetic crystals made from mixtures of silicon and aluminum oxide. They have large tunnels built into a network of tetrahedrons and, as a result, much larger molecules are incorporated inside the tunnels. The Swedish chemist Axel Cronstedt, who fi rst reported zeolites in 1756, was amazed to observe that water bubbled out of them when they were heated. Consequently, he gave them the name zeolites, which means boiling stones.
OUP CORRECTED PROOF – FINAL, 12/28/11, SPi
The Architecture of Sand 39
Zeolites have rigid frameworks of corner-sharing tetrahedrons that have varying ratios of silicon and aluminum ions at their centers depend-ing on the composition. Because aluminum has one less positive charge in its nucleus than silicon, extra positively charged ions occupy the tun-nels in the structure to provide charge neutrality. By varying the ratio of silicon to aluminum, the number of ions in the tunnels can be tuned. In addition, the size of the tunnels is controlled by the size of the ions that are incorporated into the zeolite during growth. A wide range of ion sizes can be achieved using both inorganic and organic ions.
Faujasite is an example of a zeolite. The tunnels in faujasite and in tri-dymite are compared in Fig. 2.8 . Faujasite has a large unit cell that contains 192 silicon atoms and 384 oxygen atoms. In order to simplify the illustra-tion and to emphasize the central point that the tunnels are much larger than those in tridymite, only the lines representing the silicon–oxygen–silicon bonds are shown. The silicon atoms are where the lines meet—the vertices. (The oxygen atoms are not shown.) The much smaller six-membered rings in tridymite are shown at the bottom. (The oxygen tetrahedron network in tridymite is shown in Fig. 2.6 . The projection in Fig. 2.6 is rotated 90° with respect to the pro jection in Fig. 2.8. )
Figure 2.8 Comparison of the large tunnels in the structure of the zeolite, Faujasite,
(top) and the small tunnels in Tridymite (bottom). To simplify the fi gure, the verti-
ces are the positions of the silicon atoms, and the lines are the silicon–oxygen–sil-
icon bonds (the oxygen atoms are not shown). The tunnels are formed by networks
of 12 and 6 corner-sharing tetrahedrons in Faujasite and Tridymite respectively.
Chemists tailor the size of the tunnels in zeolites to make catalysts and fi lters.
OUP CORRECTED PROOF – FINAL, 12/28/11, SPi
Sand and Silicon40
There are several dozen naturally occurring zeolites and hun-dreds of different synthetic zeolites. Thanks to the development of x-ray crystallography, there is now an atlas of zeolite structures doc-umenting the wide range of pore structures that the architects of this atomic world of silicate chemistry have constructed (Baerlocher et al . 2001).
In the last fi fty years zeolites, which started as laboratory curiosi-ties in the eighteenth century, have become a multibillion dollar industry ( Newsam 1986 and Higgins 1994 ). The whole fi eld of zeo-lite chemistry is yet another example of how the development of science in the twentieth century is refl ected in products made from sand. Let’s look at a few examples of the different applications of zeolites.
Beginning in the 1930s, R. M. Barrer in London and J. Sameshima in Japan, among others, realized the potential of these materials for ion exchange and for the selective adsorption of gases and liquids. In chem-istry it is important to be able to purify a material or to separate one material from another. Ion exchange is a process in which one kind of ion is preferentially adsorbed by a porous medium. In the 1950s Robert Milton at the Union Carbide Corporation made a synthetic zeolite called zeolite-A that had a much higher capacity for ion exchange than materi-als like charcoal or silica gel that are commonly used as adsorbents ( Milton 1953 ).
Not only is zeolite-A a good adsorbent, but it is selective in the ions that are easily adsorbed. For example, zeolite-A adsorbs 40 times more oxygen than nitrogen at the boiling temperature of liquid nitro-gen. The smaller oxygen molecule more easily enters the tunnels than does a nitrogen molecule. This difference is used to separate oxygen from air.
The drying of alcohols is another example of the selective adsorption of molecules. Water is preferentially adsorbed by zeo-lite-3A and alcohol is not. By passing ethyl alcohol over zeolite-3A, the water content can be lowered to 0.04 parts per million. An application of the adsorptive powers of both synthetic and natural zeolites that is closer to home is in kitty litter. The zeolite acts as a desiccant and adsorbs the water. It also adsorbs the ammonia thereby reducing the odor.
Synthetic zeolites are important supports for catalysts in the petro-chemical industry. A catalyst increases the speed of a chemical reaction without being consumed in the process. Platinum is one of the most common catalysts and is used in catalytic converters in cars. However, platinum is expensive and one wants to use as little as possible. One way to do this is to incorporate the platinum in the tunnels of zeolites. To make a zeolite catalyst, platinum is exchanged for the sodium ions that are incor-porated into the tunnels in the structure to achieve charge neutrality.
OUP CORRECTED PROOF – FINAL, 12/28/11, SPi
The Architecture of Sand 41
Catalysts are used to facilitate the chemical reactions that convert the heavier components of crude oil into lighter more volatile com-pounds that are used in gasoline (a process called cracking). The effectiveness of the catalyst is enhanced by making zeolites with tun-nels whose sizes are matched to the molecules that are involved in the chemical reaction and, in favorable cases, controlling the orientation of the molecule with respect to the platinum inside the tunnels to fur-ther enhance the reaction. In 1962 Mobil introduced a catalyst that used a synthetic zeolite-Y, which is related to the naturally occurring mineral faujasite ( Fig. 2.8 ). It is 1000 times better than earlier cata-lysts, and within a few years it became the industry standard for crack-ing crude oil.
Remarkably zeolites, which have much larger ratios of silicon to aluminum than zeolite-Y, act as catalysts to convert methanol to high octane gasoline. In 1997 Mobil introduced a process to make gasoline from the methane in natural gas using a high silica content zeolite, ZSM-5. The methane is converted to methanol, and the methanol is then passed over ZSM-5 at high temperatures to produce gasoline.
The exquisite control over the synthesis of zeolites can lead on the one hand to catalysts that reduce the molecular weight of the compo-nents in crude oil used to produce gasoline, and on the other hand to catalysts that can increase the molecular weight by taking a small mol-ecule like methanol and making it into gasoline.
The next example of a material that has even larger pore sizes—2 nm to 50 nm—is silica gel. This material is inside those ubiquitous little sacs found in pill bottles and other packing containers to act as drying agents ( Fig. 2.4 ). Silica gel is used as a desiccant because it has an enormous surface area. A typical silica gel has a surface area that is approximately 3 million times that of a crystal of quartz.
Zeolites are crystalline materials and the sizes of the tunnels in each zeolite are uniform. However, there are limits to how large a cage or tunnel can be constructed while maintaining an ordered arrange-ment of cages. Silica gel can be thought of as a random network of nanoparticles that are bonded together. Each nanoparticle is composed of a random network of corner-sharing tetrahedrons. This is what leads to the enormous increase in the effective surface area of the material, because the surface area is the sum of the surface areas of all the nanoparticles.
Chemically silica gel is a porous glassy form of silicon oxide. It is synthesized by heating sand and sodium hydroxide to form sodium sili-cate. The sodium silicate is then dissolved in acid, and the resulting solution polymerizes to form a gel of hydrated silicon oxide. Silica gel is then obtained by heating the gel to remove the water. The process for the production of silica gel was patented in 1918 by Walter Patrick. Its initial application was in the manufacture of gas masks during the First
OUP CORRECTED PROOF – FINAL, 12/28/11, SPi
Sand and Silicon42
World War ( Patrick 1918 ). The poison gas was preferentially adsorbed by the silica gel as the air passed over it.
In order to further increase the porosity of materials made from sand, one has to be able to prevent the gel from shrinking during drying. The shrinking is caused by the surface tension of the liquid between the nanoparticles. The surface tension pulls the particles together. The sur-face tension problem can be avoided if the material is dried under what are known as supercritical conditions.
At normal temperatures and pressures, a material can exist either as a liquid or as a vapor, but with increasing temperature and pressure the difference in density between the liquid and the vapor decreases. Above a temperature and pressure called the critical point, there is no differ-ence between the liquid and the vapor and therefore no boundary and no surface tension. Drying a porous material in supercritical carbon diox-ide produces materials called aerogels with effective pore sizes of greater than 50 nm (see Fig. 2.4 ).
Another method to make aerogels under ambient conditions was developed by Brinker and co-workers ( Deshpande et al . 1993 ). The sur-face is coated with, for example, trimethylsilane that retains its shape during drying.
Aerogels have some of the lowest densities of any solid and there-fore, the biggest pores. These novel materials fi nd applications as extremely effi cient insulators and have been used as insulation on the Mars Rover. The insulating properties are vividly illustrated in Fig. 2.9 where the heat from a torch does not melt crayons resting on the aerogel.
Another example of the use of aerogels is the Stardust mission that fl ew a rocket through the tail of the Comet “Wild 2.” An aerogel was used to retrieve samples of the dust in the tail of the comet and return them to Earth. The rocket was traveling at an enormous speed, and the challenge was to gently slow down the dust in the tail of the comet and bring it to rest in the aerogel without melting or vaporizing the dust particles. The extremely low density of the aerogel provided the equiv-alent of a delicate butterfl y net in that the dust particles slowly lost their kinetic energy as they passed into the aerogel and gently came to rest ( Baker 2006 and Burnett 2006 ). The effectiveness of this butterfl y net was demonstrated by the discovery of trace amounts of the amino acid glycine in the comet dust. The presence of the glycine meant that comets undoubtedly delivered pre-biotic molecules to earthlike planets from space ( http://stardust.jpl.nasa.gov/news/news115.html) .
In the twentieth century, materials scientists learned how to control the architecture of silicon–oxygen tetrahedrons in a wide range of porous sand-based materials, but nature has its own fascinating ways of controlling the architecture of silicon–oxygen tetrahedrons. One of the most intriguing is found in opals. Chemically, opals have a composition of SiO
2 plus varying amounts of water (1–10%). Opals have deep
OUP CORRECTED PROOF – FINAL, 12/28/11, SPi
The Architecture of Sand 43
varying colors and show spectacular fl ashes of color when they are rotated under a light.
The origin of this beautiful display of color was a mystery that was solved in the 1960s by J. V. Sanders and his colleagues in Australia ( Sanders 1964 ). In the slow process of growth over the course of thou-sands of years, spheres of amorphous silicon dioxide are formed that are almost uniform in size. These spheres are individually composed of random networks of corner-sharing silicon–oxygen tetrahedrons. The spheres assemble into a three-dimensional close-packed array. The microscopic structure of an opal is shown in the electron microscope picture in Fig. 2.10 .
It is believed that opals form in pockets in rocks. Sand and silica dis-solves in water and the resulting solution fi lls the pockets. Over time the water evaporates, and the concentration of silica increases until the spheres separate out of the solution. If the rate of evaporation is slow enough, then the famous “fi re” opals are formed, and there are large regions in the opal that have well ordered arrays of similar sized amor-phous spheres.
The origin of the fl ashes of color in precious opals is Bragg diffrac-tion ( Box 2.1 ) from the ordered arrays of amorphous spheres of SiO
2 .
Figure 2.9 Aerogels have very low densities with pore sizes that are greater than
50 nm. They are extremely good insulators and prevent the torch from melting the
crayons. (Courtesy of the Jet Propulsion Laboratory http://stardust.jpl.nasa.gov/
photo/aerogel.html. )
OUP CORRECTED PROOF – FINAL, 12/28/11, SPi
Sand and Silicon44
Diffraction occurs when the wavelength of the light and the spacing between the layers of silica spheres are similar. Visible light has a range of wavelengths that varies from 380 nm (violet) to 760 nm (red), and this is comparable to the spacing of the close-packed array of amor-phous spheres. Nature has conspired to grow precious opals with sphere sizes that diffract in the range of visible light so as to show colors that range from red to green.
We have been looking at the architecture of natural minerals and man-made materials originating from sand. However, the largest use of sand is in biomineralization where silica is incorporated into both uni-cellular algae like diatoms and protozoa-like radiolarians. Diatoms, radiolarians, and two of the three classes of sponges have skeletons composed of silica instead of the more common calcium carbonate skeletons found in animals. Industry uses tens of thousands of tons of sand per year whereas nature uses gigatons of sand in biomineralization ( Perry 2003 ).
Diatoms are important components of the phytoplankton that are at the bottom of the food chain in oceans and rivers. They are microscopic organisms and thousands of different species have been found. Their
Figure 2.10 Electron micrograph showing that opals are composed of ordered
arrays of amorphous spheres of silica. Bragg diffraction of light from the lattice of
amorphous silica spheres leads to the fl ashes of light that are observed when an
opal is rotated. (Photo courtesy of Hans-Ude Nissen and reproduced with the per-
mission of the Mineralogical Society of America.)
OUP CORRECTED PROOF – FINAL, 12/28/11, SPi
The Architecture of Sand 45
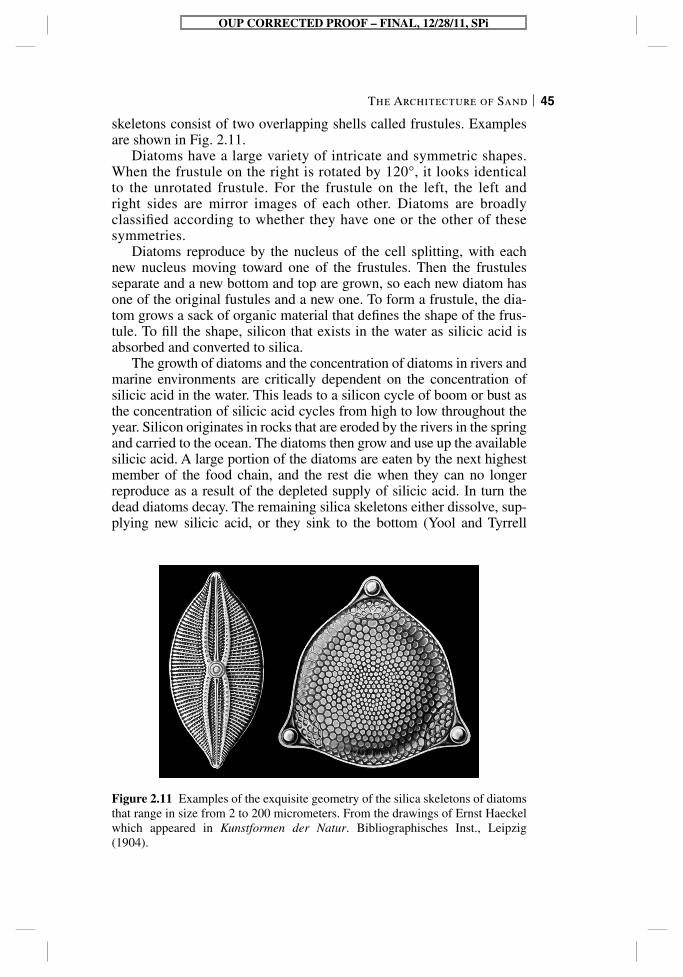
skeletons consist of two overlapping shells called frustules. Examples are shown in Fig. 2.11 .
Diatoms have a large variety of intricate and symmetric shapes. When the frustule on the right is rotated by 120°, it looks identical to the unrotated frustule. For the frustule on the left, the left and right sides are mirror images of each other. Diatoms are broadly classifi ed according to whether they have one or the other of these symmetries.
Diatoms reproduce by the nucleus of the cell splitting, with each new nucleus moving toward one of the frustules. Then the frustules separate and a new bottom and top are grown, so each new diatom has one of the original fustules and a new one. To form a frustule, the dia-tom grows a sack of organic material that defi nes the shape of the frus-tule. To fi ll the shape, silicon that exists in the water as silicic acid is absorbed and converted to silica.
The growth of diatoms and the concentration of diatoms in rivers and marine environments are critically dependent on the concentration of silicic acid in the water. This leads to a silicon cycle of boom or bust as the concentration of silicic acid cycles from high to low throughout the year. Silicon originates in rocks that are eroded by the rivers in the spring and carried to the ocean. The diatoms then grow and use up the available silicic acid. A large portion of the diatoms are eaten by the next highest member of the food chain, and the rest die when they can no longer reproduce as a result of the depleted supply of silicic acid. In turn the dead diatoms decay. The remaining silica skeletons either dissolve, sup-plying new silicic acid, or they sink to the bottom ( Yool and Tyrrell
Figure 2.11 Examples of the exquisite geometry of the silica skeletons of diatoms
that range in size from 2 to 200 micrometers. From the drawings of Ernst Haeckel
which appeared in Kunstformen der Natur . Bibliographisches Inst., Leipzig
(1904).
OUP CORRECTED PROOF – FINAL, 12/28/11, SPi
Sand and Silicon46
2003 ). The production of silicic acid is intimately related to the seques-tration of carbon dioxide. Carbonates dissolved in water react with sand producing silicic acid and CO
2 that is subducted into the Earth’s mantle
and released millions of years later in volcanoes. Over time the skeletons have collected on the bottom of rivers and
oceans to form what we call diatom aceous earth. It is used as a fi lter material and as an adsorbent. It is often spread around to clean up after chemical spills, and it is used in some types of kitty litter.
Another use of diatomaceous earth brings us back in an unusual way to science in the twentieth century. The most important recognition of outstanding science is the Nobel Prize, which was fi rst awarded at the beginning of the twentieth century in 1901. The prize was endowed by Alfred Nobel who made his fortune from his invention of dynamite. In the mid 1800s the explosive nitroglycerine had been invented, but it was very unstable. Nobel had the idea to absorb the nitroglycerine in dia-tomaceous earth and make it into sticks of what we now call dynamite ( Nobel 1868 ). So the Nobel Prize can trace its origin to the incorpora-tion of silica—sand—in the skeletal remains of diatoms into dynamite.
Our brief tour of the structures of the different materials in Fig. 2.4 shows how the architecture of corner-sharing silicon–oxygen tetrahe-drons varies from rings to helices to ordered or random networks with ever increasing pore sizes. Nature, on the other hand, makes materials like opals with their own unique type of order and incorporates silica in the skeletons of aquatic microorganisms. The ability of scientists to control the architecture of sand is in part based on being able to deter-mine the structures of these materials using x-ray diffraction.
The challenge for materials scientists in the twenty-fi rst century is to understand how nature manages to grow a wide variety of intricate structures out of silica. That knowledge could enable new man-made structures to be fabricated to meet new technological demands.