43
2011 S i R dh 2011 Spring Roadshow Paris, London, New York May 2011
2011 S i R d h2011 Spring RoadshowParis, London, New York
May 2011
Disclaimer
This presentation may contain forward-looking objectives andstatements about VINCI’s financial situation operating results businessstatements about VINCI s financial situation, operating results, businessactivities and growth strategy. These objectives and statements arebased on assumptions that are dependent upon significant risk andbased on assumptions that are dependent upon significant risk anduncertainty factors that may prove to be inexact. The information is validonly at the time of writing and VINCI does not assume any obligation toonly at the time of writing and VINCI does not assume any obligation toupdate or revise the objectives on the basis of new information or futureor other events, subject to applicable regulations. Additional information, j pp gon the factors that could have an impact on VINCI’s financial results arecontained in the documents filed by the Group with the Frenchy psecurities regulator (AMF) and available on the Group’s website atwww.vinci.com or on request from its head office.q
2

VINCI Key Messages
Good start to the year1st quarter 2011 revenue up sharply due to organic and external growthq p p y g gOrder book set to pass €30 billionNet debt under control
S d fi i l tSound financial management
Balanced development strategy
3

1st Quarter 2011 Revenue: +25.4%
+25.4%+1,557 m€
+25.4%+1,557 m€
+25.4%+1,557 m€
6 128
7,685
FX
Organicgrowth
+€ 664 million
6,128External growth
+€ 839 million
Other+€ 54 million
1Q10 1Q11
11/10 change Organic growth External growth Exchange rates and misc. Change
Concessions +5.6% +0.7% +0.1% +6.4%Contracting +11.2% +18.5% +1.0% +30.7%
4
Contracting 11.2% 18.5% 1.0% 30.7%
Total Group +9.5% +15.0% +0.9% +25.4%
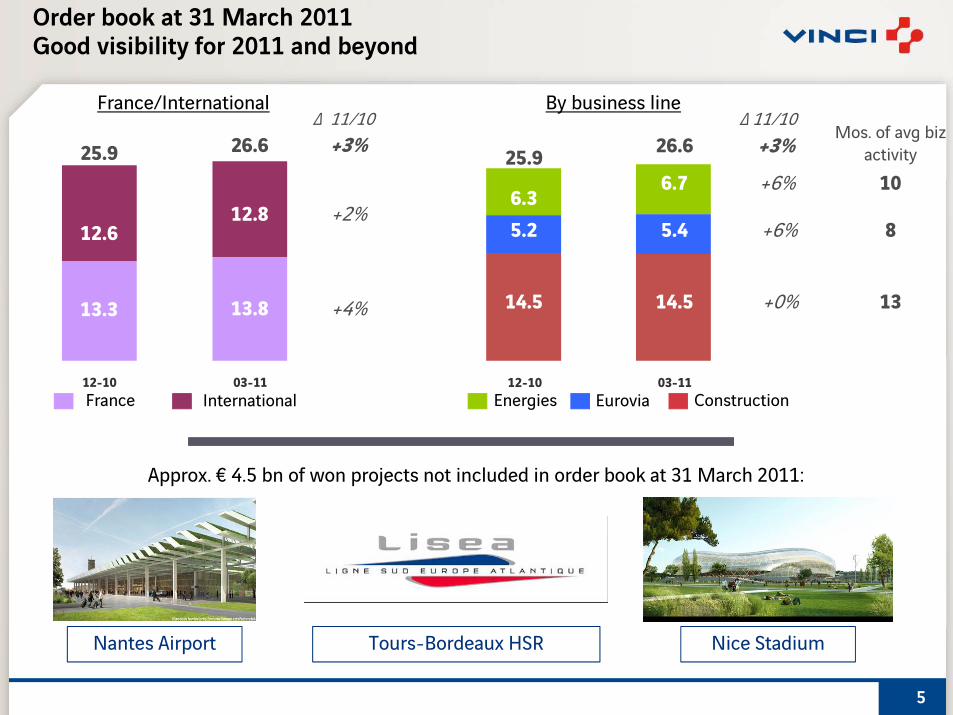
Order book at 31 March 2011Good visibility for 2011 and beyond
France/International By business line
25.9 26.6Δ 11/10
+3%Δ 11/10
Mos. of avg biz activity
6%6 7 1025.9 26.6 +3%
+2%12.6
12.8+6%
+6%6.35.2
6.7
5.4
10
8
+4%13.3 13.8 +0%14.5 14.5 13
12-10 03-11France International
12-10 03-11Energies Eurovia Construction
Approx. € 4.5 bn of won projects not included in order book at 31 March 2011:
5
Nice StadiumTours-Bordeaux HSRNantes Airport

2011 management and financial policy
Finalise key project financial closingsFinalise key project financial closings South Europe Atlantic HSR Moscow–St. Petersburg motorway
Refinance ASF maturities on bond market about €600 million
Return cash to shareholders Buyback shares to eliminate dilution from instruments giving access to Buyback shares to eliminate dilution from instruments giving access to
capital (Group savings schemes, stock options, performance shares) Maintain dividend payout ratio at 50%
Renew maturing corporate back-up credit lines
6

VINCI Strategy: Grow Revenue, Expand Margins, Create Value by
Pursuing international growth, especially outside Europe
Strengthening synergies among the Group’s business lines
Enhancing high technical value know-how
Developing recurring revenue streams in contractingDeveloping recurring revenue streams in contracting
To get there VINCI is targeting balanced development in its g g g pconcessions and contracting activities
ContractingConcessions
Energies
g
Tier 2 French Regional Airports
C P k Specialised Civil Engineering
Oil & Gas
Car Parks
Brownfield Toll Roads in Emerging Markets
7
Markets

VINCI: Key Operational Priorities
Focus onMargins & Cash
Balanced Business Development
CoherentFinancial Management
ObjectivesO t f th tOutperform the sector
Pursue targeted growth opportunitiesCreate shareholder value over the long-term
8
Create shareholder value over the long-term

Appendixes: 1st Quarter 2011 Revenue

1st quarter consolidated revenue
(in € millions) 1Q10restated
1Q11actual
Δ 11/10 actual comparable
Concessions 1 078 1 147 +6 4% +5 6%Concessions 1,078 1,147 +6.4% +5.6%VINCI Autoroutes 866 918 +6.1% +6.1%
Other concessions 212 229 +7.8% +3.8%
Contracting 5,022 6,564 +30.7% +11.2%Energies 1,093 1,985 +81.7% +5.5%
Eurovia 1,179 1,433 +21.5% +18.0%, ,
Construction 2,750 3,146 +14.4% +11.9%
VINCI Immobilier 107 94 -11.9% -11.9%
Eliminations and restatements (79) (120)Eliminations and restatements (79) (120)
Total Revenue (excluding IFRIC 12) 6,128 7,685 +25.4% +9.5%
Restated: after application of IAS 31 Interests in Joint Ventures
10
Restated: after application of IAS 31, Interests in Joint Ventures

1st quarter consolidated revenue - France
(in € millions) 1Q10restated
1Q11actual
Δ 11/10 actual comparable
Concessions 1 010 1 072 +6 1% +6 1%Concessions 1,010 1,072 +6.1% +6.1%VINCI Autoroutes 863 915 +6.1% +6.1%
Other concessions 147 157 +6.2% +6.2%
Contracting 2,964 3,897 +31.5% +12.9%Energies 733 1,267 +72.9% +5.4%
Eurovia 787 974 +23.8% +22.7%
Construction 1,444 1,656 +14.7% +13.8%
VINCI Immobilier 107 94 -11.9% -11.9%
Eliminations and restatements (65) (106)Eliminations and restatements (65) (106)
Total Revenue (excluding IFRIC 12) 4,016 4,958 +23.4% +10.0%
Restated: after application of IAS 31 Interests in Joint Ventures
11
Restated: after application of IAS 31, Interests in Joint Ventures

1st quarter consolidated revenue – outside France
(in € millions) 1Q10restated
1Q11actual
Δ 11/10 actual comparable
Concessions 68 75 +10 5% 1 4%Concessions 68 75 +10.5% -1.4%VINCI Autoroutes 3 3 -6.3% -8.2%
Other concessions 65 72 +11.3% -1.1%
Contracting 2,058 2,666 +29.6% +8.7%Energies 359 717 +99.6% +5.7%
Eurovia 393 459 +16.9% +9.3%
Construction 1,306 1,490 +14.1% +10.0%
VINCI Immobilier - -
Eliminations and restatements (14) (14)Eliminations and restatements (14) (14)
Total Revenue (excluding IFRIC 12) 2,112 2,728 +29.2% +8.4%
Restated: after application of IAS 31 Interests in Joint Ventures
12
Restated: after application of IAS 31, Interests in Joint Ventures

Appendixes: Concessions

VINCI Autoroutes1Q11 toll receipts: +6.2%
Change in traffic on a stable network: +3.3% New sections (A86 Duplex & Arcour): +0.4% +6.2%T ll i ff t d i ll 2 5%Toll price effects and miscellaneous: +2.5%
T ffi th t bl t k
105
110 Light vehicles: +3.2% in 1Q11
Traffic growth on a stable network(number of km travelled over 12 rolling months)
Base 100: Q4 2007
100
105Total traffic:
+3.3% in 1Q11
95 Heavy vehicles: +3.8% in 1Q11
85
90
14
Q4 06 Q1 07 Q2 07 Q3 07 Q4 07 Q1 08 Q2 08 Q3 08 Q4 08 Q1 09 Q2 09 Q3 09 Q4 09 Q1 10 Q2 10 Q3 10 Q4 10 Q1 11

VINCI Autoroutes: resilience and visibility
Europe’s largest toll motorway network4 385 k d i4,385 km under concessionof which 4,310 km in service
ASF Escota Cofiroute* Arcour A86 Duplex
Network under 2 714 459 1 100 101 10concession (km) 2,714 459 1,100 101 10
% held by VINCI 100% 99% 83% 100% 83%
N f k i i 2 639 459 1 100 101 10No. of km in service 2,639 459 1,100 101 10
End of concession 2033 2027 2031 2070 2086
No of km travelled No. of km travelled in 2010 (millions) 28,607 6,676 10,981 255 n/a
■ Cofiroute intercitynetwork
■ ASF■ ESCOTA
■ Other networks
* Intercity networknetwork
■ A19 - Arcour■ ESCOTA networks
15

VINCI Autoroutes: contractual framework of toll increases
ASF Escota Cofiroute* Arcour
End of concession 2033 2027 2031 2070
Minimum annual toll increase until the end of the concession: 70% * CPIMinimum annual toll increase until the end of the concession: 70% * CPI
Current master plan 2007-2011 2007-2011 2011-2014 N/A
- 2011 85% x CPI + 1.175% 85% x CPI + 1.2% 85% x CPI +0.78% 1.01x(80% x CPI + 20% x TP09 0 9%)20% x TP09 + 0.9%)
- 2012 70% x CPI + 0.795% 70% x CPI +0.14% 85% x CPI + 0.62% 80% x CPI + 20% x TP09 + 0.9%
- 2013 to 2014 70% x CPI + 0.625% 70% x CPI 85% x CPI + 0.48% Same as 2012
- 2015 to 2017 70% x CPI + 0.625% 70% x CPI 70% x CPI Same as 2012
- After 2017 70% x CPI 70% x CPI 70% x CPI (a)( )
Increases applied on 1 February 2011**
- Light vehicles 2.5% 2.5% 2.1% 4.1%
H hi l ( t 4) 3 9% 4 3% 4 0% 4 1%- Heavy vehicles (cat. 4) 3.9% 4.3% 4.0% 4.1%
* Intercity network (excl. A86 Duplex)** CPI = Base CPI (consumer price index excluding (a) 2019 to 2029 = 80% x CPI + 20% x ΔTP09 + 0.5%( p g
tobacco products) at end October Y-1 (1.52% at 31 October 2010)
( )After 2029 = 80% x CPI + 20% x ΔTP 09
16

Duplex A86
Total investment: € 2.2 billionConcession end: 31 December 2086Start date
1st section Rueil-A13 (VL1): 1 July 20092nd section A13-Vélizy: 9 January 2011y J y
Concession holder retains tariff adjustment flexibility
Adjustment in relation to hour and day of the Adjustment in relation to hour and day of the week (232 hourly possibilities)Average tariff capped by TRT (theoretical reference
ll)toll)Inflation-indexed tariff (TRT) adjustments:
2011: CPI + 3.7%2012 - 2015: CPI + 3.5%2016 - 2020: CPI + 3.2%
17

VINCI Park: 2010 key figures
Key figures (€ millions) 2009 2010 Δ 10/09
RevenueFrance
576413
596416
+3,5%+0 8%
1,391,000 spaces managed in 12 countries*, of which:
- France- International
413163
416180
+0.8%+10.5%
Operating profitas a % of revenue
9817.0%
11118.6%
+13.6%
383,000 under concession or freehold (+2% vsDec. ‘09) and 1,008,000 under service contracts (+15% vs Dec. ‘09)929 200 t id F ( 18% D ‘09)Cash flow from operations
(EBITDA)as a % of revenue
198
34.3%
178
29.8%
-10.1%
Net financial debt (819) (787) +32
929,200 outside France (+18% vs Dec. ‘09)
Net financial debt (819) (787) +32
Parking spaces by contract type* (000)
Revenue by geographical area*
1,3915% 6%
5%
FreeholdConcessionS i t t
FranceGermanyUnited Kingdom
1,220 1,252
360359
1,391
36715 1516 6%
9%Service contract g
SpainRest of EuropeUSA
360
846 878 1,008 63%6%
Canada
2008 20102009
18
* Incl. LAZ Parking in the United States (VINCI share: 50%)

Other concessions & PPPs in portfolio (1/2)
Country Type Name Description End of concession
VINCI share
Traffic risk
Consoli-dation1
Other PPPs & concessions in FranceFrance Stadium Stade de France 80,000 seats 2025 67% yes FC
Tunnel Prado Carénage Road tunnel in Marseilles 2025 33% yes EMEnergy Lucitea Public lighting in Rouen 2027 100% no FCLight rail RhônExpress 15km light rail line in Lyons 2038 35% yes EMLight rail RhônExpress 15km light rail line in Lyons 2038 35% yes EMStadium MMArena in Le Mans 25,000 seats 2043 100% yes FCRail GSM-Rail Ground-train communication
system over 14,000 km of track2025 30% no EM
B ildi Ni t l fi C t l l 2040 100% FCBuilding Nice car rental firms Car rental complex 2040 100% no FCTunnel Prado Sud Road tunnel in Marseilles 2054 58.5% yes EM
VINCI AirportsCambodia Airport Phnom Penh, Siem Reap 3 airports under concession 2040 70% yes FCp , p
& Sihanoukvillep y
France Airport Chambéry-Savoie Public service contract 2011 99% yes FCAirport Clermont Ferrand-Auvergne Public service contract 2014 99% yes FCAi t Q i C ill P bli i t t 2015 99% FCAirport Quimper-Cornouaille Public service contract 2015 99% yes FCAirport Grenoble-Isère Public service contract 2023 99% yes FCAirport Rennes Dinard-Ille et Vilaine Public service contract 2025 49% yes MEAirport Grand Ouest - Nantes Concession 2065 85% yes FC
19
Airport Grand Ouest Nantes Concession 2065 85% yes FC
1 FC: full consolidation; EM: equity method Under construction

Other concessions & PPPs in portfolio (2/2)
Country Type Name Description End of concession
VINCI share
Traffic risk
Consoli-dation1
Other concessions outside of France
United Kingdom
Bridge Severn Crossings 2 bridges 2016 35% yes EM
Portugal Bridge Bridges over the Tagus 2 bridges in Lisbon 2030 37% yes EM
Canada Bridge Confederation Bridge Link to Prince Edward Island 2032 19% yes EMGermany Motorway A4 Horselberg 45 km (A-Modell) 2037 50% yes FC
Greece Bridge Rion–Antirion 2.9 km link between l d d l
2039 57.4% yes FCmainland and Peloponnese
United Kingdom
Road Newport Southern Distributor Road
10 km 2042 50% no EM
Netherlands Tunnel Coentunnel Amsterdam* 2 tunnels (2x4 lanes) 2037 28% no EMNetherlands Tunnel Coentunnel, Amsterdam 2 tunnels (2x4 lanes) 2037 28% no EM
Greece Motorway Maliakos–Kleidi 230 km 2038 14% yes EM
Greece Motorway Athens–Patras–Corinth 365 km 2038 30% yes EM
Germany Motorway A5 Malsch Offenburg 60 km (A Modell) 2039 50% yes EMGermany Motorway A5 Malsch–Offenburg 60 km (A-Modell) 2039 50% yes EM
Slovakia Road R1 expressway* 52 km 2041 50% no FCBelgium Tunnel Locorail, Antwerp* Rail tunnel under the Escaut 2049 37% no EM
20
Under construction1 FC: full consolidation; EM: equity method
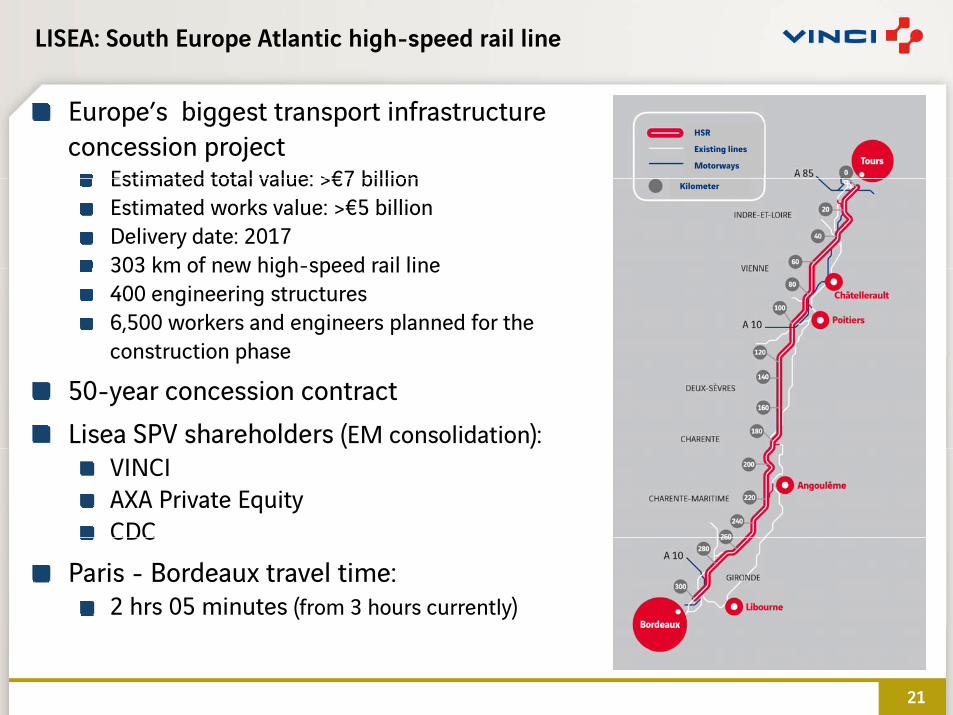
LISEA: South Europe Atlantic high-speed rail line
Europe’s biggest transport infrastructure concession project
Estimated total value: >€7 billion
HSR
Existing lines
Motorways
Estimated total value: >€7 billionEstimated works value: >€5 billionDelivery date: 2017303 km of new high-speed rail line
Kilometer
303 km of new high speed rail line400 engineering structures6,500 workers and engineers planned for the construction phaseconstruction phase
50-year concession contractLisea SPV shareholders (EM consolidation):( )
VINCIAXA Private EquityCDCCDC
Paris - Bordeaux travel time:2 hrs 05 minutes (from 3 hours currently)
21

Appendixes: Contracting

Contracting: diversified and resilient business lines
Energies:Significant organic and external growth potentialStrong operating margin resilience/potential for improvementStrong operating margin resilience/potential for improvementStrengthening of recurring business: PPPs, facilities management, services
Eurovia: good adjustment to new market conditions
VINCI Construction:Remarkable performances of specialist business lines (organic growth, strong value added)strong value added)Successful penetration of international markets in oil & gas with EntreposeContractingGood spread of resilient local entity networksGood spread of resilient local entity networks
Cegelec in Qatar R1 in Slovakia Soletanche in Hong Kong
23

Energies – profile
Market leader in France and a major player in Europe in services i t d ith d i f ti t h l i
Description
associated with energy and information technologiesDesign, engineering, implementation, operation and maintenance of equipment:
Power transmission and distribution infrastructure, public lighting, CCTVIndustry: electrical engineering, monitoring and control, multi-technical maintenancetechnical maintenanceService sector: power supply networks, HVAC, fire detection and protection, multi-technical management and maintenanceTelecommunications: infrastructure for fixed and mobile networks, company communicationscompany communications
Facilities management of office buildings in France and Germany2010 revenue: €7.1 billionEstablished in about 40 countriesClients (est.): 75% private / 25% publicWorkforce: 58 778 at Dec 31 2010Workforce: 58,778 at Dec. 31, 2010
242424

Eurovia – profile
300 divisions and subsidiaries:
Description
Construction, repair and maintenance of transport infrastructure(roads, rail tracks, airports, etc.)Urban development, light rail, signallingp g g g
Strategy of vertical integration towards materials production and recycling
P d ti f 80 illi t f d t i 2010Production of 80 million tonnes of road aggregate in 2010Over 30 years of reserves (> 3 billion tonnes)
70% of revenue generated through recurring repair and maintenance contracts (est.)
2010 revenue: €7.9 billion
Cli t ( t ) 2/3 bli 1/3 i tClients (est.): 2/3 public; 1/3 private
Strong R&D policy (new products and processes)
Workforce: 39 754 at Dec 31 2010Workforce: 39,754 at Dec. 31, 2010
252525

Construction – profile
Wide variety of expertise in building and civil engineering:
Description
Strong local presence in mainland and overseas France (network of 500 profit centres), rest of Europe (United Kingdom, Belgium, Central Europe) and longstanding operations in AfricaLeadership position in specialised business activities in France and elsewhere: Soletanche Freyssinet (structures, special foundations, ground improvement, nuclear engineering), DEME (dredging), E t C t ti ( il & i f t t )Entrepose Contracting (oil & gas infrastructure)Management of large complex projects: VINCI Construction GrandsProjets
2010 revenue: €13.1 billion
Clients (est.): 60% private / 40% public
Workforce: 64 338 at Dec 31 2010Workforce: 64,338 at Dec. 31, 2010
262626

VINCI Immobilier: 2010 highlights
Revenue: +8.0%, including: Residential (€ 475 million): +12.7%Commercial (€ 114 million): 9 0%Commercial (€ 114 million): -9.0%
Residential RE:24% increase in units sold: 4,194 signed closings in 2010
(Inventory of potential units: about 9,400 lots at 31 December 2010 (+13% versus 2009)
Commercial RE: La Cité du Cinéma (€134 million)2 projects in Lyons (€ 37 million)
Key figures (m€) 2009 2010 Δ 10/09
Revenue 558 603 8.0%
EBIT 51 76 50 8%EBIT 51 76 50.8%
% of revenue 9.1% 12.6%
Net profit 34 48 40.2%
27
Net cash position 12 56 +44Carré d’Artois in Versailles

Appendixes: 2010 Financial Statements

Income statement
(in € millions) 2009published
2009restated
2010 actual Δ 10/09
Revenue 31,928 30,741 33,376 8.6%
Operating profit from ordinary activities 3,192 3,100 3,434 10.8%
% of revenue 10 0% 10 1% 10 3%% of revenue 10.0% 10.1% 10.3%
Operating profit 3,145 3,110 3,429 10.2%
Financial income/(expense) (702) (680) (681) -
Income tax expense (745) (727) (847) -
Net profit attributable to non-controlling interests (102) (107) (125) -interests
Net profit attributable to owners of the parent 1,596 1,596 1,776 11.3%
% of revenue 5.0% 5.2% 5.3%
Diluted earnings per share* (in €) 3.21 3.21 3.30 +2.9%
29
* After taking account of dilutive instruments

Cash flow statement (1/2)
(in € millions) 2009restated
2010actual Concessions Contracting
Cash flow from operations (EBITDA) 4,771 5,052 3,197 1,766
Income taxes paid (644) (950) (669) (243)
Net interest paid (762) (693) (687) (15)
Change in WCR and other 571 (24) (1) (33)
Operating cash flow 3,936 3,385 1,840 1,476
Growth investments in concessions & PPP (1,660) (1,466) (893) (573)contracts (1,660) (1,466) (893) (573)
Free cash flow 2,276 1,919 946 903
30
Restated: after application of IAS 31, Interests in Joint Ventures

Cash flow statement (2/2)
(in € millions) 2009 restated
2010 actual
Free cash flow 2,276 1,919
Net financial investments (incl. net financial debt) (96) (2,425)*
Other financial cash flows (31) (68)Other financial cash flows (31) (68)
Cash flow before movements in share capital 2,148 (575)
Capital increases & other operations 621 1,658*p p
Dividends paid (876) (965)
Share buybacks - (107)
Movements in share capital (255) 586
Net cash flow for the period 1,893 11
( )Other and impact of changes in consolidation scope (22) 59
Change in net financial debt 1,871 70
Restated: after application of IAS 31 Interests in Joint Ventures
31
* Including payment for Cegelec in VINCI shares: €1,385 millionRestated: after application of IAS 31, Interests in Joint Ventures

Consolidated balance sheet
EQUITY & LIABILITIES31 Dec. ‘09(in € billions)
10,467
31 Dec. ‘10
13,02513 0 2 5
Change
Equity
Non-current provisions and other long-term liabilities
1,443
19,017
1,729
18,669
10.51.4
13.0
1.7
+2.5
+0.3
Borrowings (A)
WCR and current provisions 5,936 6,45319.0
5 9
18.7
6 5
(0.3)
0 5
ASSETS
Non-current assets – Concessions26 2
5.9
26 3
6.5
0 1
+0.5
5,887
Non-current assets – Contracting and other
Net cash managed (B) 5,609
26.2 26.3
8 0
+0.1
3 2
Net financial debt (A-B)
4.75.9
8.05.6
(13 1) (13 1)
+3.2(0.3)
stable
32
Net financial debt (A B) (13.1) (13.1) stable

Change of net debt in 2010
Unchanged over 12 months(in € billions)
Dividends(1.0)
(13 1)
Free cash flow
(13 1)
Capital increase &
(13.1) +1.9 (13.1)
M&Aother*
+1.5
M&A(2.4)*
Net debt at 31 Dec. 2009
Net debtat 31 Dec. 2010
33
* Including acquisition of Cegelec shares (1.4 bn€) paid for with VINCI shares

Financing sources well-diversifiedPrudent, optimised rate structure
Net debt by:
Financing source Fixed rate/Variable rateDivisions
32%12%
34%3%6%
18%
27%
29%56%
10%55%18%
3%
Bonds( )
Variable rateASFCNA (Caisse Nationale des Autoroutes)BanksOther (EIB, EBRD,…)
Inflation cappedFixed rate
CofirouteArcourVINCI ConcessionsHolding cos & other
34

Net financial debt by entity
(in € millions) 2009restated
Debt/cash flow*
2010 actual
Debt/cash flow* Δ 10/09
( ) ( )Concessions (15,688) 5.1 x (15,599) 4.9 x 89VINCI Autoroutes (14,029) 5.0 x (13,965) 4.8 x 64
VINCI Park (819) 4 1 x (787) 4.4 x 32VINCI Park (819) 4.1 x (787) 4.4 x 32
Other concessions (351) 4.3 x (408) 4.2 x (57)
Concessions holding cos. (489) - (439) - 51
Contracting 3,618 ns 2,955 ns (662)Holding cos. & misc. (1,059) - (415) - 643
( ) ( )Net financial debt (13,130) 2.8x (13,060) 2.6x 70
D b h ld i ll b i i hi h f 90% f hDebt held essentially by concession companies, which account for 90% of the Group’s capital employedAverage maturity of gross debt: 6.6 years (2009: 7.1 years)
35
g y g y ( y )
* Net financial debt/cash flow from operations before cost of financing and tax (EBITDA)

Maturity of gross financial debt
Average maturity of gross financial debt at 31 December 2010: 6.6 yearsof which concessions: 7.5 years
2,500
3,000
2,000
1,000
1,500
500
CofirouteASF ASF Holding
02 011 2 012 2 013 2 014 2 015 2 016 2 017 2 018 2 019 2 020 2 021 2 022 2 023 2 024 2 025 2 026 2 027 > 2028
36
Other concessions Holding cos. and miscellaneousArcour

Financial indicators
(in € millions) 31 Dec. ‘09restated 31 Dec. ‘10restated
Capital employed 25,005 27,766
of which:25 066 25 121
Concessions25,066 25,121
Contracting (30) 2,580
ROCE Return on capital employed 9 0% 9 3%ROCE – Return on capital employed 9.0% 9.3%
Equity attributable to owners of the parent 9,811 12,304
ROE – Return on equity 18.9% 18.1%
Net financial debt/cash flow from operations before cost of financing and tax 2.8 x 2.6 xbefore cost of financing and tax
of which concessions 5.1 x 4.9x
37
Restated: after application of IAS 31, Interests in Joint Ventures
Appendixes: VINCI Overview

VINCI: World Leader in Concessions and Contracting
ContractingConcessions
French Toll Roads Construction
Road & Rail Works
French Toll RoadsParking Facilities
Large Public EquipmentElectrical ContractingTransportation Infrastructure
VINCI designs finances builds and manages:VINCI designs, finances, builds and manages: Public and private buildings and facilities
Transportation infrastructure Urban development projects Energy infrastructure Telecom networks
39
Telecom networks

Revenue 2010 (in € millions)
33,376
CONCESSIONS5 097
CONTRACTING28 1505,097 28,150
VINCIAUTOROUTES
4 259
VINCICONCESSIONS
838
ENERGY BUSINESS LINE
7 102
EUROVIA
7 930
VINCICONSTRUCTION
13 118
VINCIIMMOBILIER
6034,259 838 7,102 7,930 13,118603
Workforce
40
8,493 7,571 313 58,778 39,754 64,338

Long-term Market Drivers
Important needs of infrastructure and public equipment in emerging
Urbanisation MobilityEnergy Environment
Important needs of infrastructure and public equipment in emerging markets
B tt t f th ‘U P ’ i i l d t ll ltBetter acceptance of the ‘User-Payer’ principle and toll culture
Development of PPP
G l i f bli i i iGeneral ageing of public equipment in mature countries
Increasing regulation for better environmental efficiency and energy optimization
VINCI’s concession-construction business model ll d d l k d
41
well adapted to long-term market trends

Investor relations contacts
Christopher [email protected]
Tel: +33 1 47 16 45 07
Marie-Amélia [email protected]
Tel: +33 1 47 16 45 39
42

Page Index
Backlog 5 French Toll Roads:A86 17
SEA 21
Balance Sheet 32
Cashflow 30 – 31
A86 17Network Desc. 15Tariff Structures 16Traffic Trends 14
Strategy 7
VINCI Autoroutes:see French Toll Roads
Contracting 23Construction 26Energy 24
Immobilier 27
Key Messages 3, 8
see French Toll Roads
VINCI Overview 39 – 41Energy 24Eurovia 25
Debt:By Entity 34 35
Key Messages 3, 8
Other Conc. 19 - 20VINCI Park 18
By Entity 34-35Maturity Profile 36YoY Change 33
P & L 29
Revenue:By Activity 10
Financial Indicators 37
Financial Mgmt 6
France 11Outside France 12YoY Change 4
43


