28
2014 GCC 100 DAY JOURNEY REPORT University of Wollongong

2014 GCC
100 DAY JOURNEY REPORT University of Wollongong

Welcome to YOUR GCC REPORT 1
By completing the GCC 100 Day Journey, your employees have reached an important milestone on their path to better health. This report has been produced specifically for you by the Foundation for Chronic Disease Prevention in the Workplace™ (FCDP) and is designed to give an independent evaluation of the GCC’s impact on your participating employees so far.
Your report is an independent audit of how the GCC has affected your employees' overall health, physical activity levels and nutrition. It also addresses how the GCC can improve your employees’ propensity for long-term improvement by making them aware of their health, lifestyle and behaviours.
Research shows that, in turn, healthier employees enhance overall business performance through increased productivity, reduced stress and better employee/employer relationships. The results in this report demonstrate the compelling business benefits to support your investment in GCC.
Although there are future elements of GCC 2014 to be enjoyed, I would like to offer my congratulations on your organisation's success in the programme so far.
Dr. David Batman Director of Research, Foundation For Chronic Disease Prevention In The Workplace™ [email protected]
© Foundation for Chronic Disease Prevention

Welcome to YOUR GCC REPORT 2
3OVERALL PERFORMANCE SUMMARY
l Employee Demographics l Daily Step Averages l Step Averages By Week
l Most Active Areas l Most Active Teams
9IMPACT ON EMPLOYEE HEALTH
l Increase in Physical Activity Levels l Changes in Health Scores l Long-term Behavioural Change l Improvements in Nutrition l Weight Management
l Changes in BMI l Heart Health l Risk Factors l Changes in Lifestyle
20IMPACT ON BUSINESS HEALTH
l Reducing Stress l Workplace Energy and Sleep l Increased Productivity
l Employer/Employee Relationship l Overall Employee Experience
26CONCLUSION AND APPENDIX SOURCES
l Conclusion l Appendix Sources
© Foundation for Chronic Disease Prevention

3
OVERALL PERFORMANCE SUMMARY
This section of your report presents data derived from all of your participating employees’ overall step input and performance throughout the 100 Day Journey.
© Foundation for Chronic Disease Prevention

Employee DEMOGRAPHICS 4
The GCC is designed to appeal and be accessible to every employee, regardless of their age, gender, fitness level, state of health, profession or geographic location. As such, it is designed to suit a broad spectrum of industries and the organisations within them. From mining to manufacturing, agriculture to accounting, the GCC's unique behavioural science approach universally fits the circumstances of all employees, employers and industries.
Employee Age Breakdown Number of employees: 847
Number of teams: 121
Gender split*:
67% female
33% male
*Gender split doesn't include employees who haven't specified their gender or selected 'other'
© Foundation for Chronic Disease Prevention

Daily STEP AVERAGES 5
Daily Step Average:
13,163
Average Distance per Day:
8.42 km
Total Combined Steps:
965,297,282
This equates to your employees walking around the world
15 times over their 100-day journey.
Average Energy Burned per Day:
2,211 kj
Total Energy Burned:
162,169,943 kj
This is equivalent to your employees collectively burning off:
or
or
162,170 slices of pizza
155,187 pieces of cake
288,559 pints of beer
© Foundation for Chronic Disease Prevention

Step Averages BY WEEK 6
The chart below demonstrates how your employees' daily step average has changed throughout the 100 Day Journey:
Step Average
Weeks
Mini Challenge 1 - Perfect 10 Your employees were challenged to achieve over 10,000 steps every day from Thursday June 12 to Monday June 16 inclusive.
Mini Challenge 2 - You Against You Your employees were challenged to achieve a new personal best on either Saturday July 12 or Sunday July 13.
Mini Challenge 3 - You Against the World Your employees were challenged to beat the global step average of 12,915 for three days straight from Friday August 1 to Sunday August 3.
Mini Challenge 4 - 100,000 Club Your employees were challenged to achieve 100,000 steps in 7 days from Thursday August 21 to Wednesday August 27.
© Foundation for Chronic Disease Prevention

Most Active AREAS 7
RANK TOP AREAS PARTICIPANTS STEP AVERAGE
1 UOWE 28 18,135
2 Faculty of Engineering & Information 70 16,074
3 Facilities Management Division 35 15,398
4 Vice Chancellor's Unit 35 14,693
5 URAC 7 14,531
6 Shoalhaven Campus 28 14,398
7 Business Improvement & Assurance 14 14,234
8 Governance and Legal Division 7 14,211
9 Financial Services Division 7 14,001
10 Academic Quality & Standards 14 13,605
© Foundation for Chronic Disease Prevention
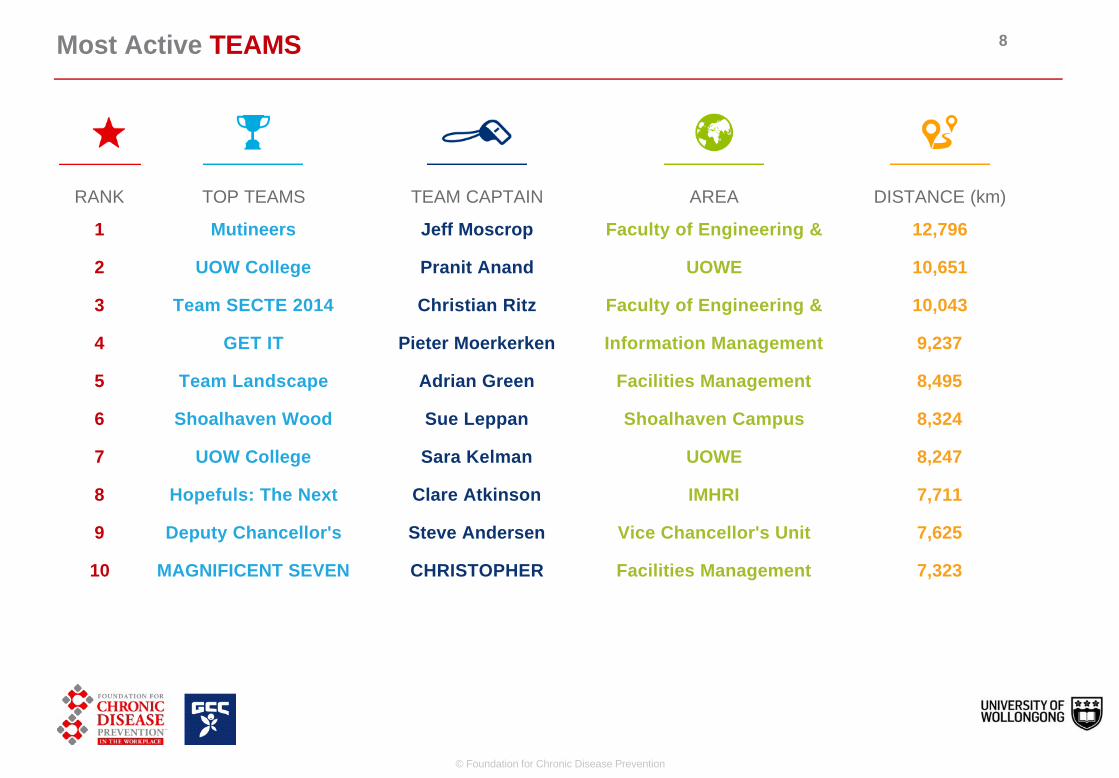
Most Active TEAMS 8
RANK TOP TEAMS TEAM CAPTAIN AREA DISTANCE (km)
1 Mutineers Jeff Moscrop Faculty of Engineering & 12,796
2 UOW College Pranit Anand UOWE 10,651
3 Team SECTE 2014 Christian Ritz Faculty of Engineering & 10,043
4 GET IT Pieter Moerkerken Information Management 9,237
5 Team Landscape Adrian Green Facilities Management 8,495
6 Shoalhaven Wood Sue Leppan Shoalhaven Campus 8,324
7 UOW College Sara Kelman UOWE 8,247
8 Hopefuls: The Next Clare Atkinson IMHRI 7,711
9 Deputy Chancellor's Steve Andersen Vice Chancellor's Unit 7,625
10 MAGNIFICENT SEVEN CHRISTOPHER Facilities Management 7,323
© Foundation for Chronic Disease Prevention

9
POSITIVE IMPACT ON EMPLOYEE HEALTH
This section of your report presents data derived from your employees’ pre-, mid- and post-GCC survey responses. The following table illustrates the overall response rate to these surveys.
Survey Responses % Participating Employees
Completed Pre-event Survey 649 77%
Completed Mid-event Survey 286 34%
Completed both Pre- and Post-event Surveys 194 23%
All results shown in this section of the report are based on data derived from those who completed both the pre- and post-event surveys, unless stated otherwise in the footnotes.
By way of comparison, we have also provided a "Global Benchmark" which is taken from the 59,927 global GCC participants who completed both the pre- and post-event surveys. This global benchmark denotes the "pre-GCC" event score only and works as a comparison to other companies in GCC.
© Foundation for Chronic Disease Prevention

Increase in PHYSICAL ACTIVITY LEVELS 10
Working towards an active lifestyle benchmark of 10,000 steps1 (or cycling/swimming equivalent) per day, your employees have effectively increased their overall (accumulated) daily physical activity levels and positively impacted their health and wellbeing through improved fitness and cardiovascular health2.
The following chart demonstrates the change in employees' daily physical activity levels before and after the GCC*:
Pre-GCC Post-GCC
75% of employees now exceed the 10,000 step recommended daily activity level (vs 25% pre-GCC).
82% said the GCC has had a positive impact on their relationship with exercise**.
*Based on active participants who completed the pre-event survey. **Based on participants who completed the mid-event survey.
© Foundation for Chronic Disease Prevention
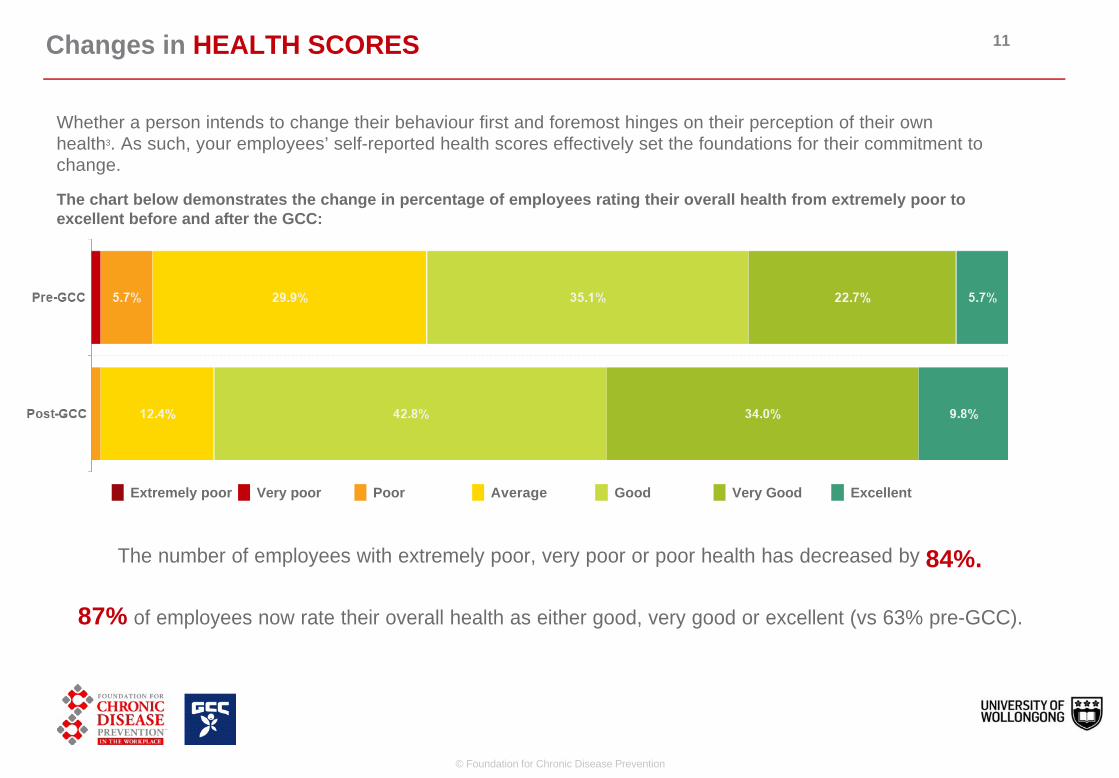
Changes in HEALTH SCORES 11
Whether a person intends to change their behaviour first and foremost hinges on their perception of their own health3. As such, your employees’ self-reported health scores effectively set the foundations for their commitment to change.
The chart below demonstrates the change in percentage of employees rating their overall health from extremely poor to excellent before and after the GCC:
Extremely poor Very poor Poor Average Good Very Good Excellent
The number of employees with extremely poor, very poor or poor health has decreased by 84%.
87% of employees now rate their overall health as either good, very good or excellent (vs 63% pre-GCC).
© Foundation for Chronic Disease Prevention

Long-term BEHAVIOURAL CHANGE 12
Awareness
The first step in building behavioural change is awareness. The results below demonstrate how the GCC positively impacts employees' awareness of their physical activity levels.
Extremelyaware
Not at all aware
91% of employees reported they were more conscious of opportunities in their day to add more steps*.
Motivation
Intention or motivation to change is one of the most important predictors of behavioural change4. The GCC gives employees the motivation and the tools they need to take personal accountability for their health. The top three reasons which motivated employees to join GCC were**:
1. I wanted to get healthier 2. I wanted to be part of a team 3. I was encouraged to join
68% of employees reported that the GCC had helped them take more personal accountability for their own health*.
79% of employees think exercise is enjoyable having participated in GCC
*Based on mid-event survey responses only. **Based on pre-event survey responses only.
© Foundation for Chronic Disease Prevention

Long-term BEHAVIOURAL CHANGE 13
Habit Formation
Over the course of the GCC, employees form new, healthier habits which ensure that health benefits are maintained well after the conclusion of GCC.
73% of employees reported that their increased activity levels had become a habit*.
67% of employees reported having a better understanding of what it takes to lead a healthier lifestyle*.
65% are now undertaking 30 minutes of planned physical activity (such as going to the gym or for a run) four or more times per week (vs 42% prior to GCC).
Advocacy
Employees who have successfully embedded new habits often go on to spread the word to others. This sort of advocacy plays an important part in helping move other people along the behavioural change path. Although this comes late in the behavioural change cycle, your employees have already reported that their new learned behaviours have had a positive impact on others.
92% of employees would recommend participating in the GCC to friends, family and other colleagues.**
46% of employees reported getting family and friends out walking more*.
*Based on mid-event survey responses only. **Based on post-event survey responses only.
© Foundation for Chronic Disease Prevention

Improvements to NUTRITION 14
As individuals become more conscious about integrating physical activity into their lifestyles and start to experience the positive results, they typically also start to become more conscious of other lifestyle factors that impact their health and wellbeing. One prominent lifestyle factor is diet.
The following chart demonstrates the changes pre- and post-GCC in your employees' reported awareness levels about what they eat:
Very aware
Not aware
38% of employees are more aware about what they eat.
Nutritional Assessment Outcomes*
Results from your employees' nutrition survey:
80% of employees eat a healthy breakfast daily.
75% of employees think their portions are too big.
53% of employees say that they often eat while working, watching TV, checking emails, surfing the Internet or reading.
32% of employees feel confused about the different diet and nutrition advice that is available to them.
54% of employees often experience an energy slump at some point in the day.
*Based on 249 employees who completed the nutritional assessment.
© Foundation for Chronic Disease Prevention

Weight MANAGEMENT 15
Increasing physical activity levels directly increases energy burn, leading to weight loss. Over days, weeks and months, sustained increases in physical activity deliver sustained weight loss. It is also well recognised that weight loss directly reduces risk of type II diabetes, hypertension and heart disease.
40% of employees reported losing weight during the Challenge.
Those who lost weight reported an average weight loss of 3.6 kg.
© Foundation for Chronic Disease Prevention
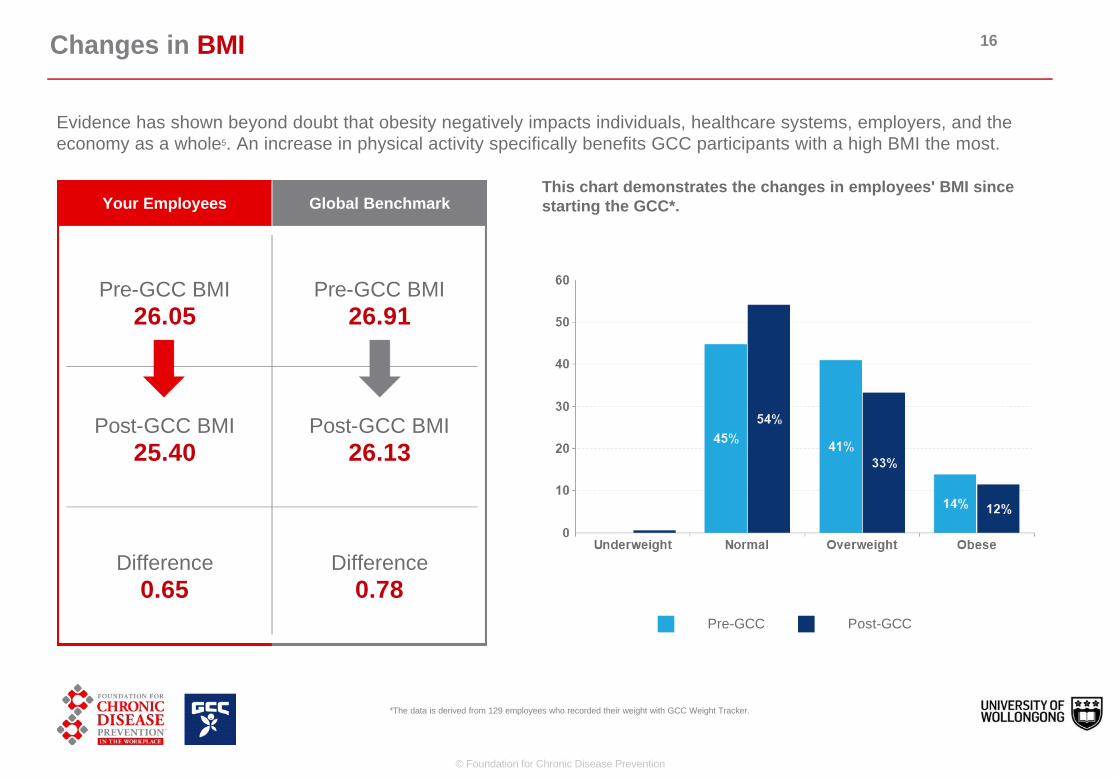
Changes in BMI 16
Evidence has shown beyond doubt that obesity negatively impacts individuals, healthcare systems, employers, and the economy as a whole5. An increase in physical activity specifically benefits GCC participants with a high BMI the most.
Your Employees Global Benchmark
Pre-GCC BMI 26.05
Pre-GCC BMI 26.91
Post-GCC BMI 25.40
Post-GCC BMI 26.13
Difference 0.65
Difference 0.78
This chart demonstrates the changes in employees' BMI since starting the GCC*.
Pre-GCC Post-GCC
*The data is derived from 129 employees who recorded their weight with GCC Weight Tracker.
© Foundation for Chronic Disease Prevention

Heart HEALTH 17
GCC’s Heart Age has been developed to give your employees a scientific picture of their heart health relative to their real age. It highlights their cardiovascular risks and provides guidance and support on what they can do to reduce them. Empowering employees with this awareness and knowledge about their current health status will help to lay the foundations for greater improvements to their heart health in the long-term.
43% of employees calculated their GCC Heart Age.
Pre-GCC Heart Age
Post-GCC Heart Age
42 7 months
41 12 months
Real age: 40
Percentage of employees who know their biometric information*:
GCC Global Benchmark
Employees Pre-GCC
Employees Post-GCC
*The data is derived from employees who calculated their GCC heart age.
© Foundation for Chronic Disease Prevention

Risk FACTORS 18
Scientific evidence shows a clear link between a person's lifestyle risk factors and their subsequent development of ill health later in life. The resulting health problems can impact your employees’ individual performance at work as well as overall business performance. Early action to address such risk factors is therefore key in order to reduce the likelihood of your employees experiencing ill health in the future. It should be recognised that risk factors other than those which have been measured and highlighted can influence a person’s health.
This chart shows the distribution of employees into risk categories Post-GCC*:
Obese
Overweight
Normal
Yes
No
High: 140 mmHg and above
Raised: Between 120 - 139 mmHg
Optimal: Below 120 mmHg
High: 160 mg/dL and above (4.14 mmol/L)
Raised: Between 100 and 159 mg/dL (4.13 mmol/L)
Optimal: Below 100mg/dL (2.59 mmol/L)
High: 200 mg/dL and above
Optimal: Below 200 mg/dL (5.17 mmol/L)
No Risk Intermediate Risk High Risk
*The data is derived from employees who completed their GCC Heart Age and provided information for blood pressure, LDL & total cholesterol and smoking. The data for BMI is derived from employees who recorded their weight with GCC Weight Tracker
© Foundation for Chronic Disease Prevention

Changes in LIFESTYLE 19
The day-to-day choices your employees make around physical activity, nutrition and sleep can impact their overall health and performance. By using the GCC Lifestyle Score, employees can assess how their lifestyle choices rate against proven scientific medical recommendations and are given an indication of the small changes they can make to take better care of their health.
37% of employees found out their GCC lifestyle score.
LIFESTYLE SCORE
Post-GCC Score 596/1000
Global Benchmark: 584
Pre-GCC Score 475/1000
Global Benchmark: 437
PRE-GCC SCORE* POST-GCC SCORE*
Significantly Below Recommendations Below Recommendations Above Recommendations
*The data is derived from employees who calculated their GCC Lifestyle score. © Foundation for Chronic Disease Prevention

20
POSITIVE IMPACT ON BUSINESS HEALTH
This section of your report presents data derived from your employees’ pre-, mid- and post-GCC survey responses. The following table illustrates the overall response rate to these surveys.
Survey Responses % Participating Employees
Pre-event Survey 649 77%
Mid-event Survey 286 34%
Pre- and Post-event Combined Surveys 194 23%
All results shown in this section of the report are based on data derived from those who completed both the pre- and post-event surveys, unless stated otherwise in the footnotes.
By way of comparison, we have also provided a "Global Benchmark" which is taken from the 59,927 global GCC participants who completed both the pre- and post-event surveys. This global benchmark denotes the "pre-GCC" event score only and works as a comparison to other companies in GCC.
© Foundation for Chronic Disease Prevention
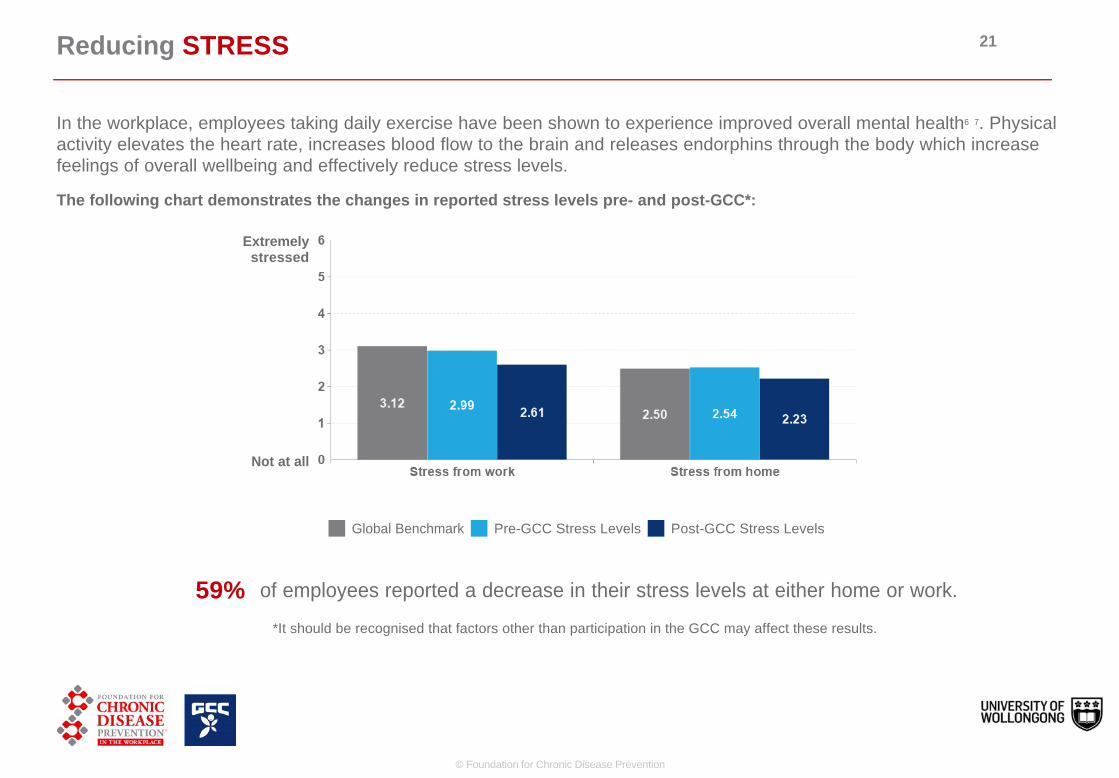
Reducing STRESS 21
In the workplace, employees taking daily exercise have been shown to experience improved overall mental health6 7. Physical activity elevates the heart rate, increases blood flow to the brain and releases endorphins through the body which increase feelings of overall wellbeing and effectively reduce stress levels.
The following chart demonstrates the changes in reported stress levels pre- and post-GCC*:
Extremely stressed
Not at all
Global Benchmark Pre-GCC Stress Levels Post-GCC Stress Levels
59% of employees reported a decrease in their stress levels at either home or work.
*It should be recognised that factors other than participation in the GCC may affect these results.
© Foundation for Chronic Disease Prevention
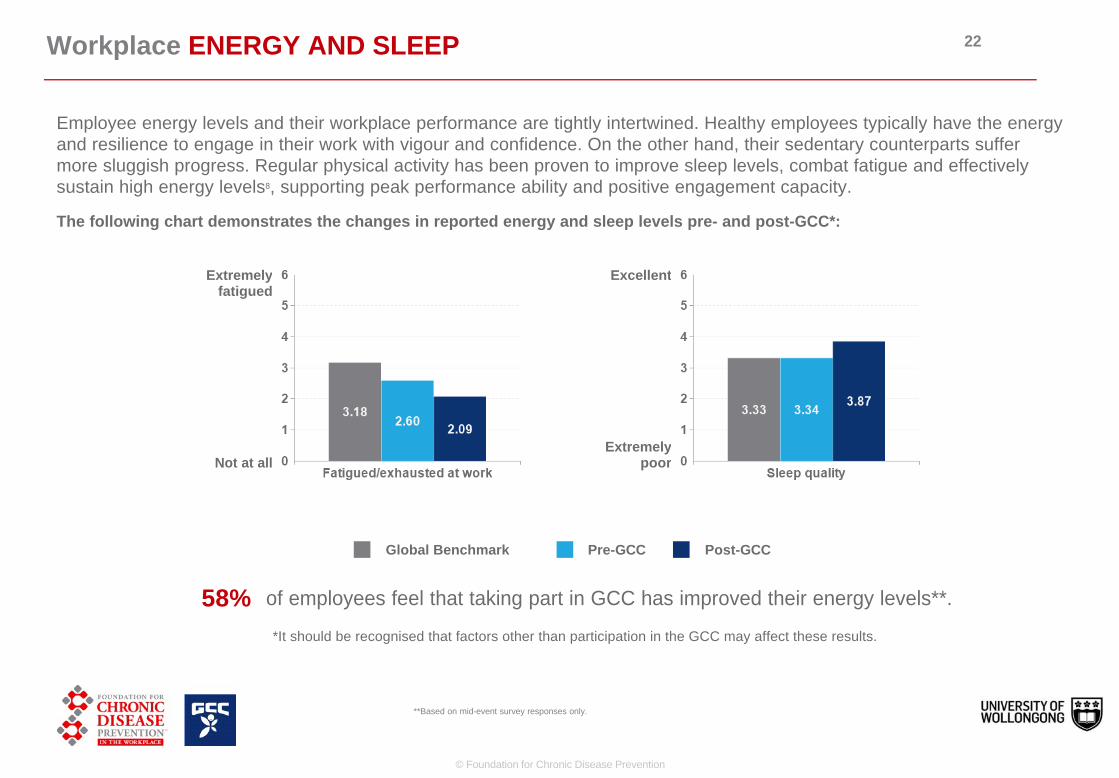
Workplace ENERGY AND SLEEP 22
Employee energy levels and their workplace performance are tightly intertwined. Healthy employees typically have the energy and resilience to engage in their work with vigour and confidence. On the other hand, their sedentary counterparts suffer more sluggish progress. Regular physical activity has been proven to improve sleep levels, combat fatigue and effectively sustain high energy levels8, supporting peak performance ability and positive engagement capacity.
The following chart demonstrates the changes in reported energy and sleep levels pre- and post-GCC*:
Extremely fatigued
Not at all
Excellent
Extremely poor
Global Benchmark Pre-GCC Post-GCC
58% of employees feel that taking part in GCC has improved their energy levels**.
*It should be recognised that factors other than participation in the GCC may affect these results.
**Based on mid-event survey responses only.
© Foundation for Chronic Disease Prevention

Increased PRODUCTIVITY 23
Daily physical activity directly – and positively – impacts employee and workplace productivity, both from employees drawing on improved sleep, concentration levels and stamina to get more work done during working hours (i.e. decreased presenteeism) and also from a reduction in absenteeism owing to physical or emotional illness9.
39%
of employees reported an increase in their
productivity score having participated in the GCC.
The chart below shows the changes in reported productivity levels before and after GCC:
Extremely productive
Not at all productive
© Foundation for Chronic Disease Prevention

Employer/Employee RELATIONSHIP 24
Employees respond positively to organisations that are prepared to invest in their health and wellbeing. A positive work environment and a culture genuinely directed towards employee health have been shown to improve not only employee wellbeing but also – critically – their job satisfaction, commitment, engagement and loyalty to their employer.
65%
of your employees are now more aware of your
organisation's commitment to health and wellbeing.*
*Based on mid-event survey responses only.
© Foundation for Chronic Disease Prevention

Employee EXPERIENCE 25
Providing employees with a positive experience when they are investing time and effort in their own health is essential. It encourages them to remain motivated and, in turn, continue with a commitment to their health for the long-term.
78%
of employees rate their overall GCC experience as either good or excellent.*
85%
of your employees would participate in the GCC
again.
* 16% rated their GCC experience as average, 3% below average and 3% poor.
© Foundation for Chronic Disease Prevention

In CONCLUSION 26
I have no doubt that successful businesses of the future will require an even more healthy and resilient workforce than ever before. It is therefore vital that employees have the awareness, motivation and education they need to develop sustainable healthy behaviours. I hope that your report has given useful insight into how the GCC can successfully provide this support.
By investing in the health of employees, your organisation can continue to reap the rewards of a more productive and resilient workforce. Importantly, the improvements you’ve witnessed will subsequently contribute to improved overall business performance.
Until 31 March 2015 your employees can continue to access the physical activity and nutritional support that has helped them on their journey so far. With GCC Sprint and GCC Sleep also still to come, there is the opportunity for your employees to further build on the exciting developments they have already made.
Congratulations again on being one of the increasingly enlightened organisations which are supporting the health of their employees in an innovative and engaging way.
Dr. David Batman Director of Research, Foundation For Chronic Disease Prevention In The Workplace™ [email protected]
© Foundation for Chronic Disease Prevention

Appendix SOURCES 27
1. Tudor-Locke C, Bassett DR Jr (2004). How many steps/day are enough? Preliminary pedometer indices for public health. Sports Med, 34:1-8
2. US Department of Health and Human Services (1996). Physical activity and health: a report of the Surgeon General. US Department of Health and Human Services, Centers for Disease Control and Prevention, National Center for Chronic Disease Prevention and Health Promotion, Atlanta, Ga.
3. Weinstein ND (1988). The precaution adoption process. Health Psychol, 7:355-386.
4. David M. Cutler, Edward L. Glaeser, Allison B. Rosen. (2007) Is the US Population Behaving Healthier? NBER Working Paper No. 13013 Issued in April 2007
5. Lehnert, T.; Sonntag, D.; Konnopka, A.; Riedel-Heller, S.; Konig, H.H. (2013) Economic costs of overweight and obesity. Best Practice & Research Clinical Endrocrinology. 27(2):105-115
6. Ozminkowski RJ, Goetzel RZ, Smith MW, Cantor RI, Shaughnessy A, Harrison M (2000) The impact of the Citibank, NA, health management program on changes in employee health risks over time. J Occup Environ Med.;42(5):502-511.
7. Batman, D, Cartwright, S (2011) Multi-Business Study into the Effect of Low Impact Physical Activity on Employee Health and Wellbeing 2011; Foundation For Chronic Disease Prevention in the Workplace.
8. Puetz, T. (2006). Regular Exercise Plays A Consistent And Significant Role In Reducing Fatigue, Psychological Bulletin, November 2006, University of Georgia
9. Ulrica von Thiele Schwarz, Henna Hasson (2011). Employee Self-rated Productivity and Objective Organizational Production Levels. Journal of Occupational and Environmental Medicine; 53 (8): 838
© Foundation for Chronic Disease Prevention


