42
2015 Reader Survey Reader Survey 2015
| Date post: | 28-Dec-2015 |
| Category: |
Documents |
| Upload: | kathlyn-shepherd |
| View: | 215 times |
| Download: | 0 times |
2015 Reader Survey
Reader Survey
2015
2015 Reader Survey
Purpose
The findings cited in this report are based on a survey sponsored by the Livestock Advertising Network on behalf of ten of its publications:
Alabama Cattleman The Louisiana Cattleman The Carolina Cattle Connection Cattle Business in Mississippi The Florida Cattleman Ohio Cattleman Georgia Cattleman Tennessee Cattle Business Cow Country News The Virginia Cattleman
The purpose of this research project was to provide the editors and advertisers with a current, credible profile of its audience.
This summary highlights the methodology and results of the Kentucky Cattlemen’s Association segment—Cow Country News.
2015 Reader Survey
Method
¨ The survey sample of 400 represented 7,546 domestic, named Kentucky Cattlemen’s Association members who receive Cow Country News at the time of sample selection.
¨ The mail survey fielded from May 14 to June 25, 2015.
¨ The survey was closed with 229 usable responses (57% response rate).
¨ Margin of error based on 229 usable responses is ±6.4 percentage points at the 95% confidence level.
2015 Reader Survey
About Readex Research
¨ Nationally recognized independent research company located in Stillwater, Minnesota.
¨ Roots are in survey research for the magazine publishing industry, but specialization in conducting high-quality survey research (by mail and/or the Internet) has served diverse clients from many other markets.
¨ Since its founding in 1947, Readex has completed thousands of surveys for hundreds of different clients.
¨ The response was tabulated and this report was prepared by Readex in accordance with accepted research standards and practices.
2015 Reader Survey
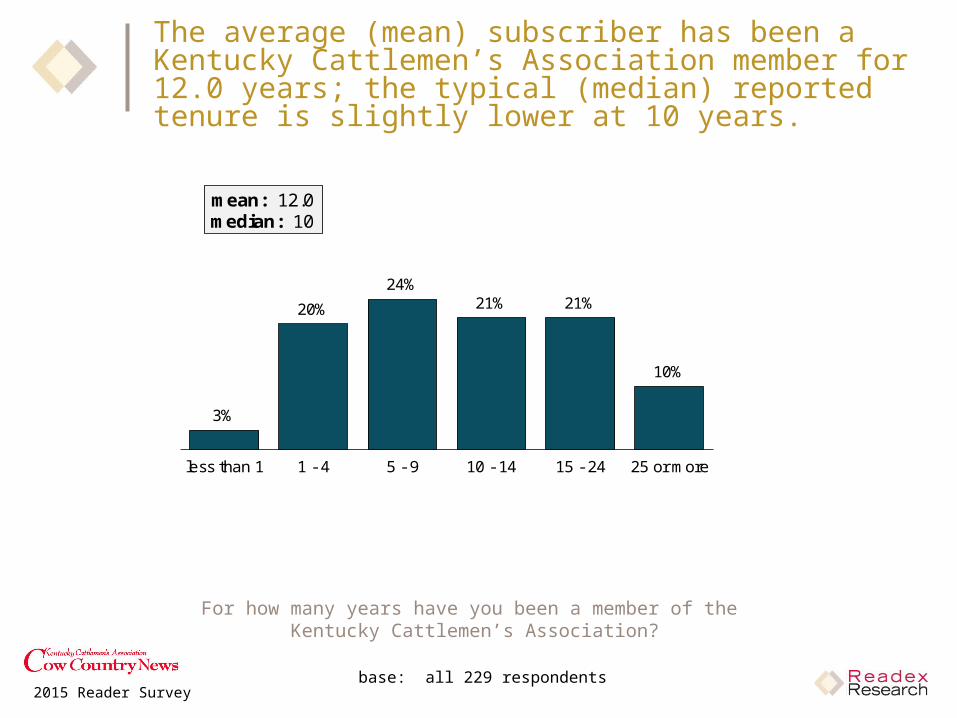
The average (mean) subscriber has been a Kentucky Cattlemen’s Association member for 12.0 years; the typical (median) reported tenure is slightly lower at 10 years.
3%
20%
24%21% 21%
10%
less than 1 1 - 4 5 - 9 10 - 14 15 - 24 25 or more
mean: 12.0median: 10
base: all 229 respondents
For how many years have you been a member of the Kentucky Cattlemen’s Association?
2015 Reader Survey
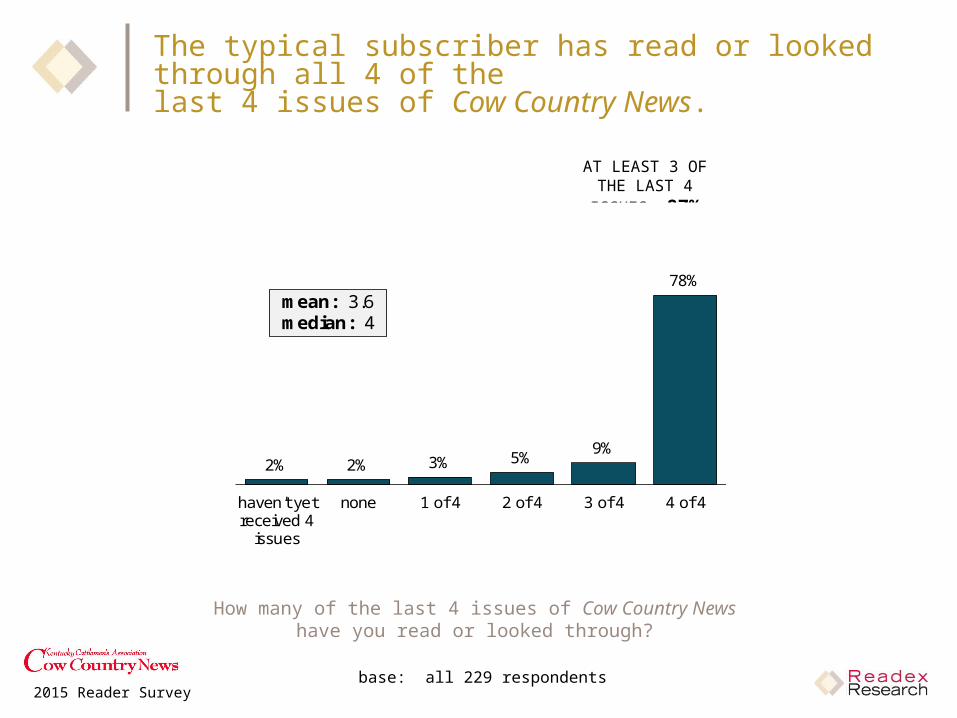
The typical subscriber has read or looked through all 4 of the last 4 issues of Cow Country News.
base: all 229 respondents
How many of the last 4 issues of Cow Country Newshave you read or looked through?
2% 2% 3% 5%9%
78%
haven't yetreceived 4
issues
none 1 of 4 2 of 4 3 of 4 4 of 4
mean: 3.6median: 4
AT LEAST 3 OF THE LAST 4 ISSUES:
87%
2015 Reader Survey
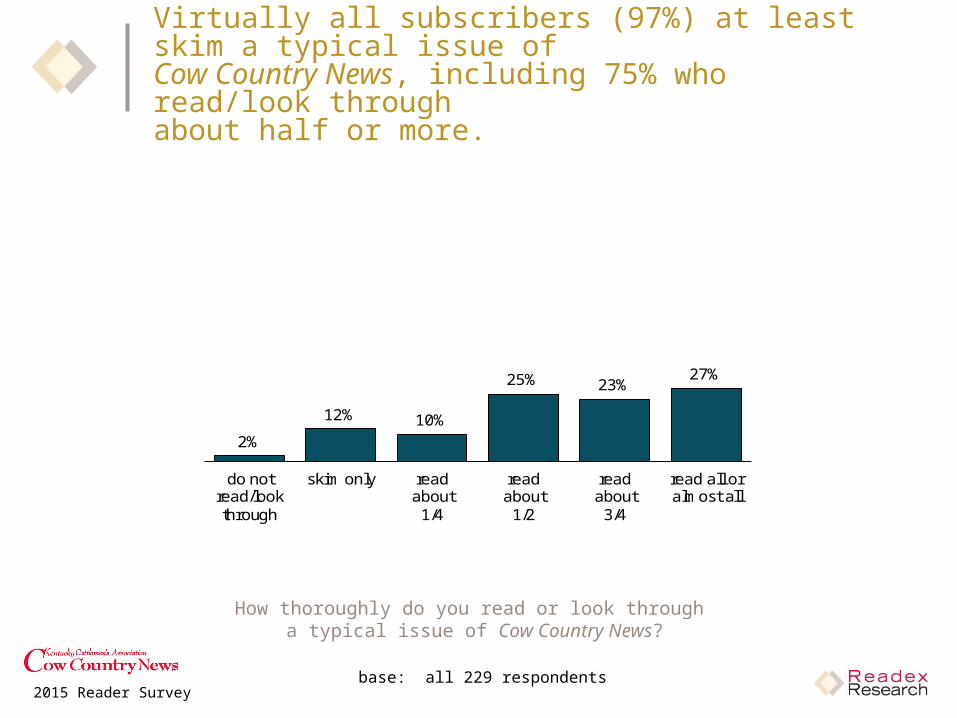
Virtually all subscribers (97%) at least skim a typical issue of Cow Country News, including 75% who read/look through about half or more.
base: all 229 respondents
How thoroughly do you read or look through a typical issue of Cow Country News?
2%
12% 10%
25% 23%27%
do notread/lookthrough
skim only readabout
1/4
readabout
1/2
readabout
3/4
read all oralmost all
AT LEAST SKIM: 97%
READ ABOUT 1/2 OR MORE: 75%
2015 Reader Survey
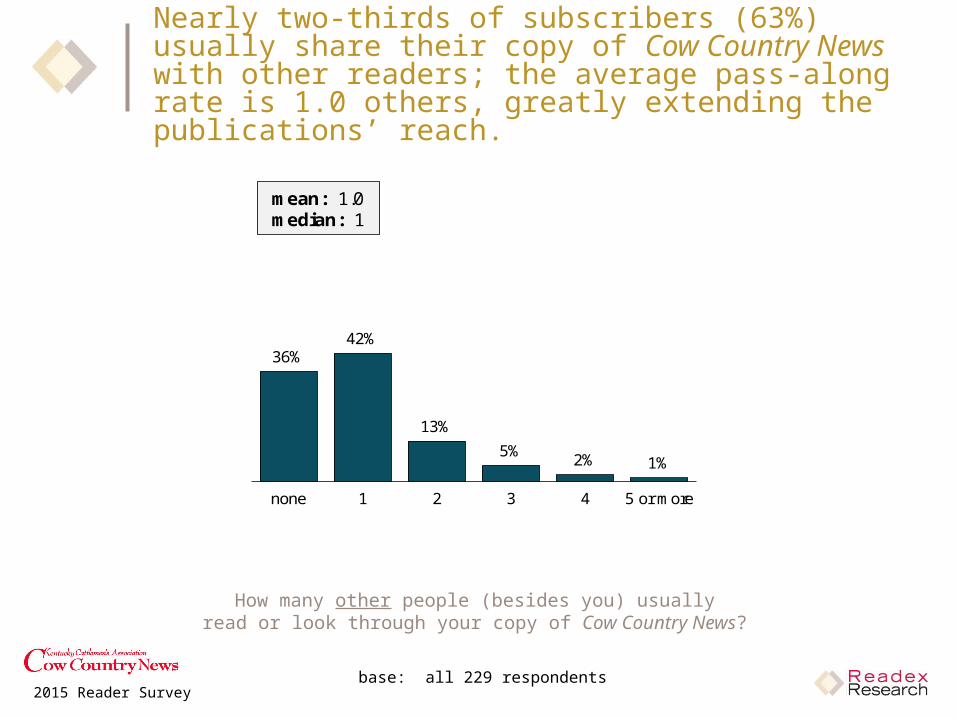
Nearly two-thirds of subscribers (63%) usually share their copy of Cow Country News with other readers; the average pass-along rate is 1.0 others, greatly extending the publications’ reach.
How many other people (besides you) usuallyread or look through your copy of Cow Country News?
base: all 229 respondents
36%42%
13%
5%2% 1%
none 1 2 3 4 5 or more
mean: 1.0median: 1
PASS-ALONG TO OTHERS: 63%
2015 Reader Survey
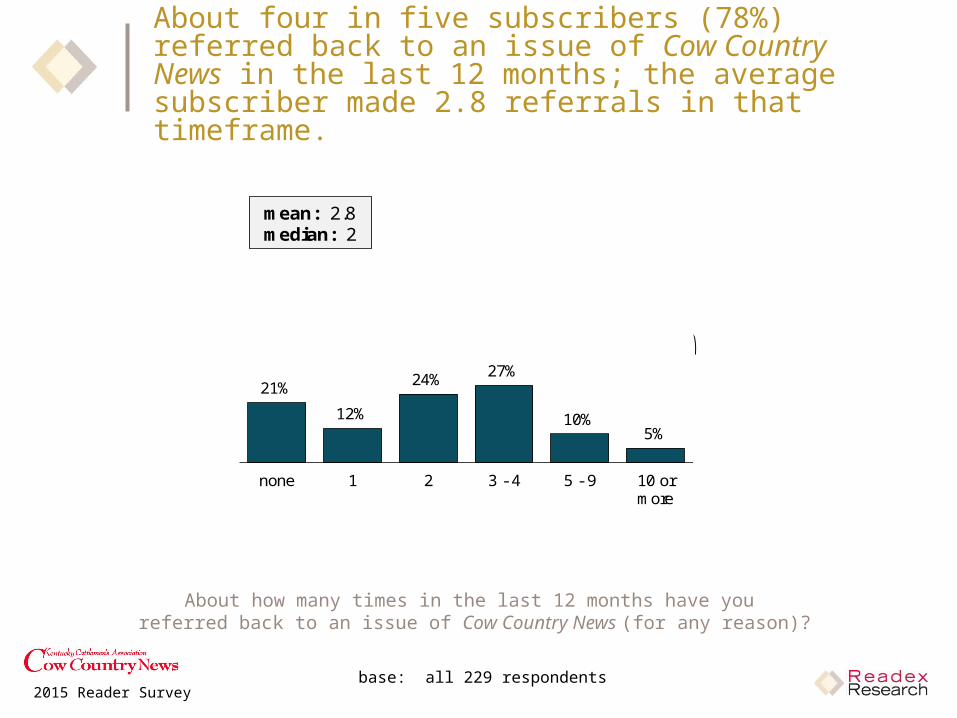
About four in five subscribers (78%) referred back to an issue of Cow Country News in the last 12 months; the average subscriber made 2.8 referrals in that timeframe.
About how many times in the last 12 months have you referred back to an issue of Cow Country News (for any reason)?
base: all 229 respondents
21%
12%
24% 27%
10%5%
none 1 2 3 - 4 5 - 9 10 ormore
mean: 2.8median: 2
REFERRED BACK TO ISSUES: 78%
2015 Reader Survey
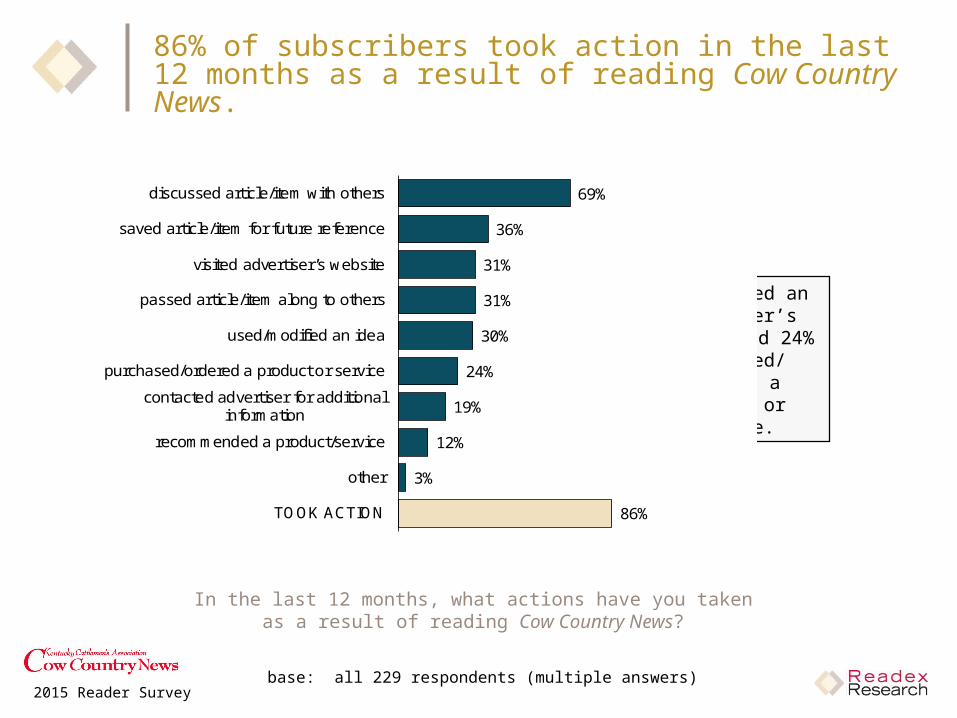
86% of subscribers took action in the last 12 months as a result of reading Cow Country News.
In the last 12 months, what actions have you taken as a result of reading Cow Country News?
base: all 229 respondents (multiple answers)
69%
36%
31%
31%
30%
24%
19%
12%
3%
86%
discussed article/item with others
saved article/item for future reference
visited advertiser’s website
passed article/item along to others
used/modified an idea
purchased/ordered a product or service
contacted advertiser for additionalinformation
recommended a product/service
other
TOOK ACTION
31% visited an advertiser’s website and 24% purchased/ordered a product or
service.

2015 Reader Survey
A majority of subscribers (58%) think advertising in Cow Country News makes a company/product/service more credible.
Does advertising in Cow Country News make a company/product/service more credible, less credible, or does it have no effect on its credibility?
base: all 229 respondents
more credible58%
less credible0%
no effect on credibility
38%
2015 Reader Survey
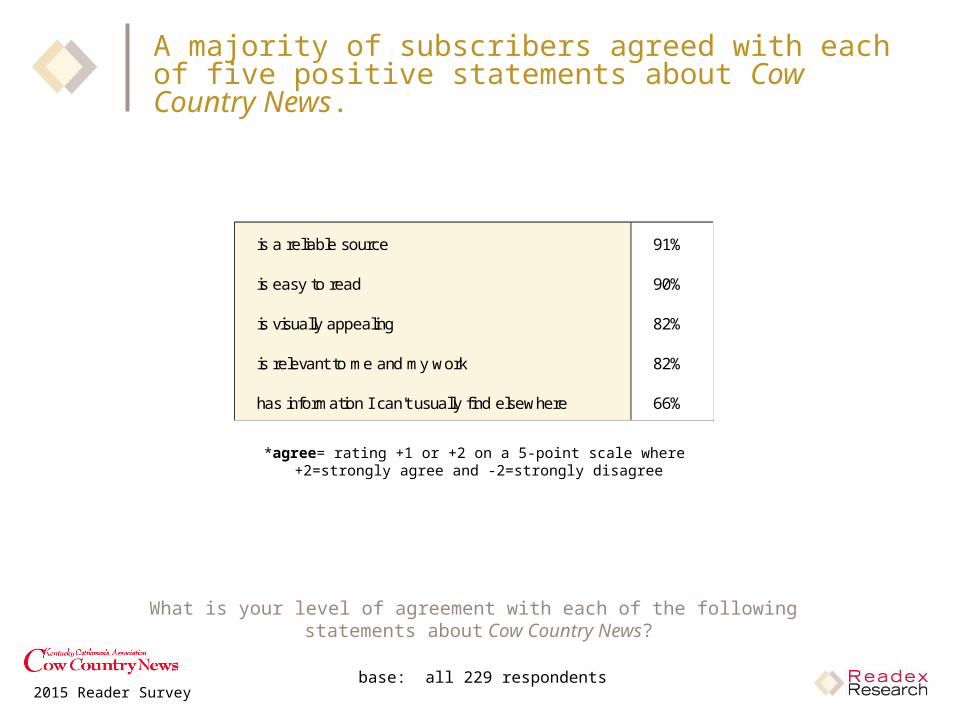
A majority of subscribers agreed with each of five positive statements about Cow Country News.
What is your level of agreement with each of the following statements about Cow Country News?
base: all 229 respondents
is a reliable source 91%
is easy to read 90%
is visually appealing 82%
is relevant to me and my work 82%
has information I can't usually find elsewhere 66%
*agree= rating +1 or +2 on a 5-point scale where +2=strongly agree and -2=strongly disagree
AGREE* SUMMARY
2015 Reader Survey
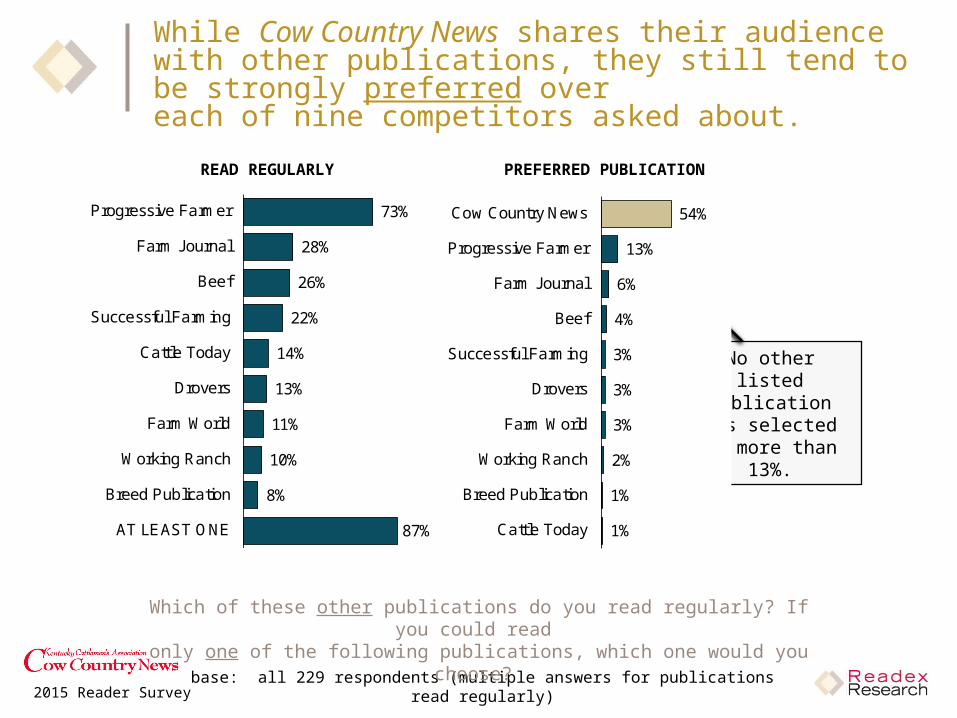
While Cow Country News shares their audience with other publications, they still tend to be strongly preferred over each of nine competitors asked about.
base: all 229 respondents (multiple answers for publications read regularly)
Which of these other publications do you read regularly? If you could read only one of the following publications, which one would you choose?
54%
13%
6%
4%
3%
3%
3%
2%
1%
1%
Cow Country News
Progressive Farmer
Farm Journal
Beef
Successful Farming
Drovers
Farm World
Working Ranch
Breed Publication
Cattle Today
READ REGULARLY PREFERRED PUBLICATION
No other listed publication was
selected by more than 13%.
73%
28%
26%
22%
14%
13%
11%
10%
8%
87%
Progressive Farmer
Farm Journal
Beef
Successful Farming
Cattle Today
Drovers
Farm World
Working Ranch
Breed Publication
AT LEAST ONE
2015 Reader Survey
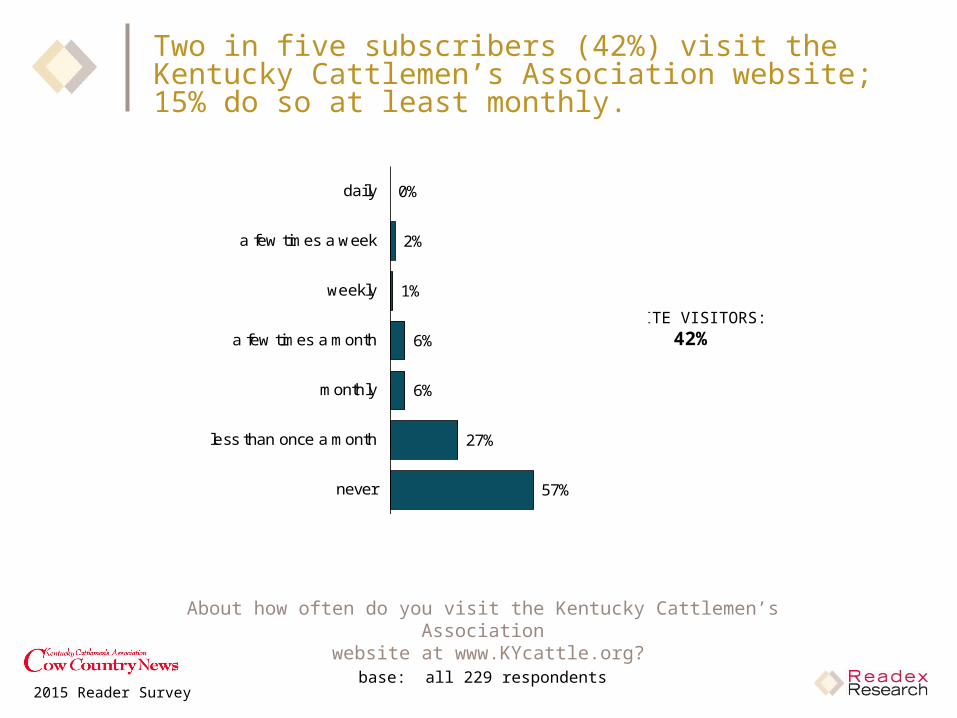
Two in five subscribers (42%) visit the Kentucky Cattlemen’s Association website; 15% do so at least monthly.
About how often do you visit the Kentucky Cattlemen’s Association website at www.KYcattle.org?
base: all 229 respondents
0%
2%
1%
6%
6%
27%
57%
daily
a few times a week
weekly
a few times a month
monthly
less than once a month
never
WEBSITE VISITORS: 42%
2015 Reader Survey
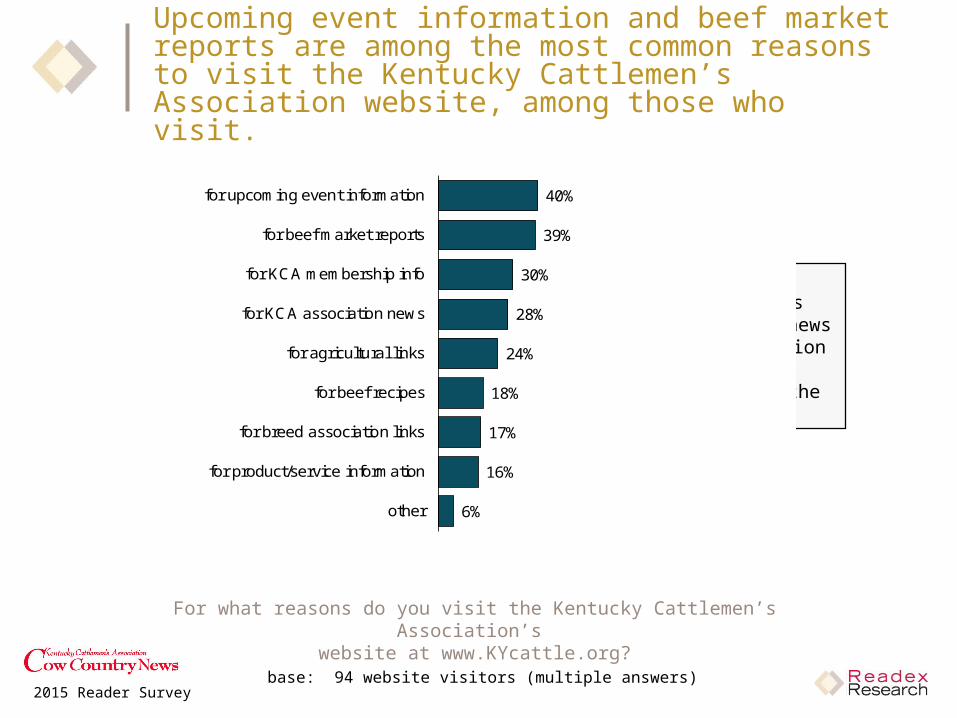
Upcoming event information and beef market reports are among the most common reasons to visit the Kentucky Cattlemen’s Association website, among those who visit.
40%
39%
30%
28%
24%
18%
17%
16%
6%
for upcoming event information
for beef market reports
for KCA membership info
for KCA association news
for agricultural links
for beef recipes
for breed association links
for product/service information
other
For what reasons do you visit the Kentucky Cattlemen’s Association’s website at www.KYcattle.org?
base: 94 website visitors (multiple answers)
Kentucky Cattlemen’s Association news and information also draws traffic to the website.

2015 Reader Survey
About one in six subscribers (16%) receive news via email from the Kentucky Cattlemen’s Association; 9% follow the Association on Facebook.
Do you receive news via email from the Kentucky Cattlemen’s Association?Do you follow the Kentucky Cattlemen’s Association on Facebook?
base: all 229 respondents
16%
9%
receive news via email
follow on Facebook
2015 Reader Survey
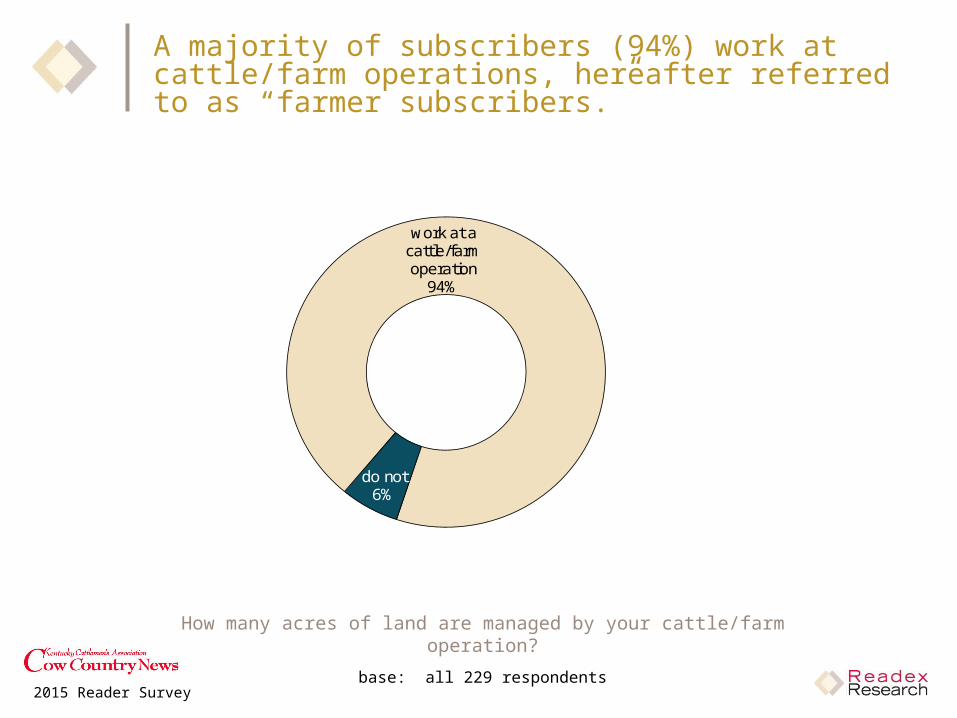
A majority of subscribers (94%) work at cattle/farm operations, hereafter referred to as “farmer subscribers.”
How many acres of land are managed by your cattle/farm operation?
base: all 229 respondents
do not6%
work at a cattle/farm operation
94%
2015 Reader Survey
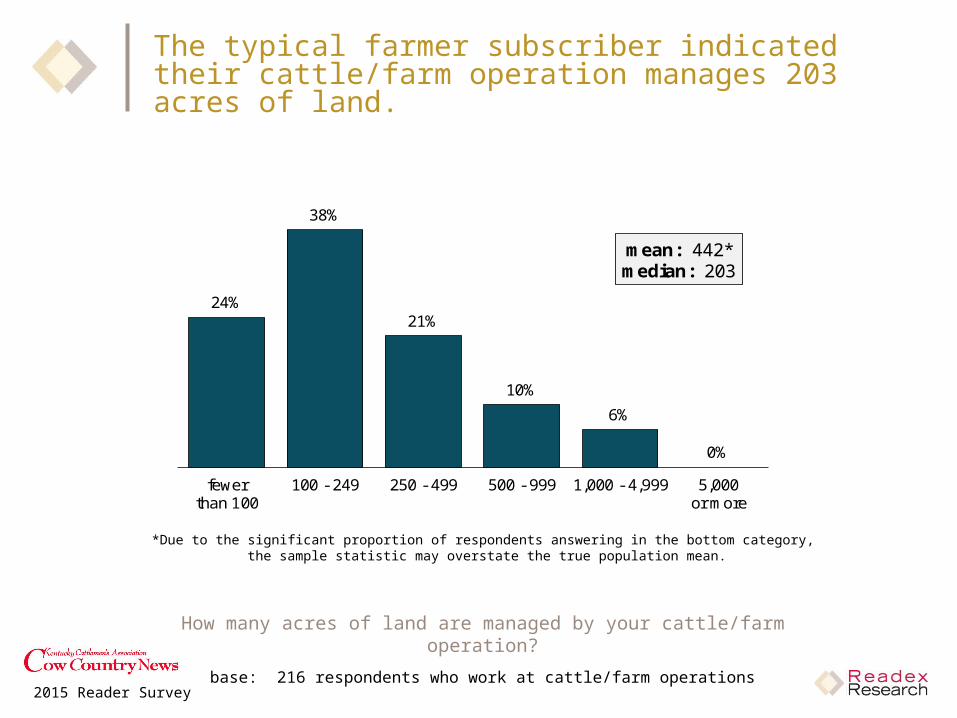
The typical farmer subscriber indicated their cattle/farm operation manages 203 acres of land.
24%
38%
21%
10%
6%
0%
fewerthan 100
100 - 249 250 - 499 500 - 999 1,000 - 4,999 5,000or more
mean: 442*median: 203
How many acres of land are managed by your cattle/farm operation?
base: 216 respondents who work at cattle/farm operations
*Due to the significant proportion of respondents answering in the bottom category, the sample statistic may overstate the true population mean.
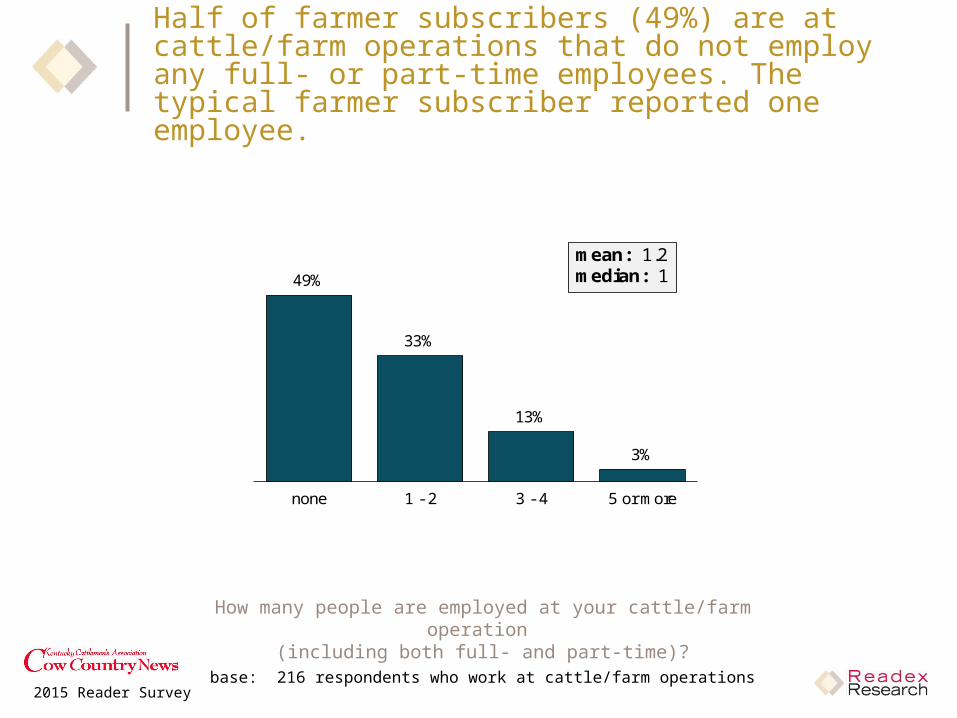
2015 Reader Survey
Half of farmer subscribers (49%) are at cattle/farm operations that do not employ any full- or part-time employees. The typical farmer subscriber reported one employee.
How many people are employed at your cattle/farm operation (including both full- and part-time)?
base: 216 respondents who work at cattle/farm operations
49%
33%
13%
3%
none 1 - 2 3 - 4 5 or more
mean: 1.2median: 1

2015 Reader Survey
Virtually all farmer subscribers (98%) reported their cattle/farm operations own or manage cattle, most commonly cows/calves.
What types of cattle are owned or managed at your cattle/farm operation?
base: 216 respondents who work at cattle/farm operations (multiple answers)
84%
27%
17%
14%
2%
2%
98%
cow/calf
commercial
purebred
stocker
dairy
other
OWN OR MANAGECATTLE
2015 Reader Survey
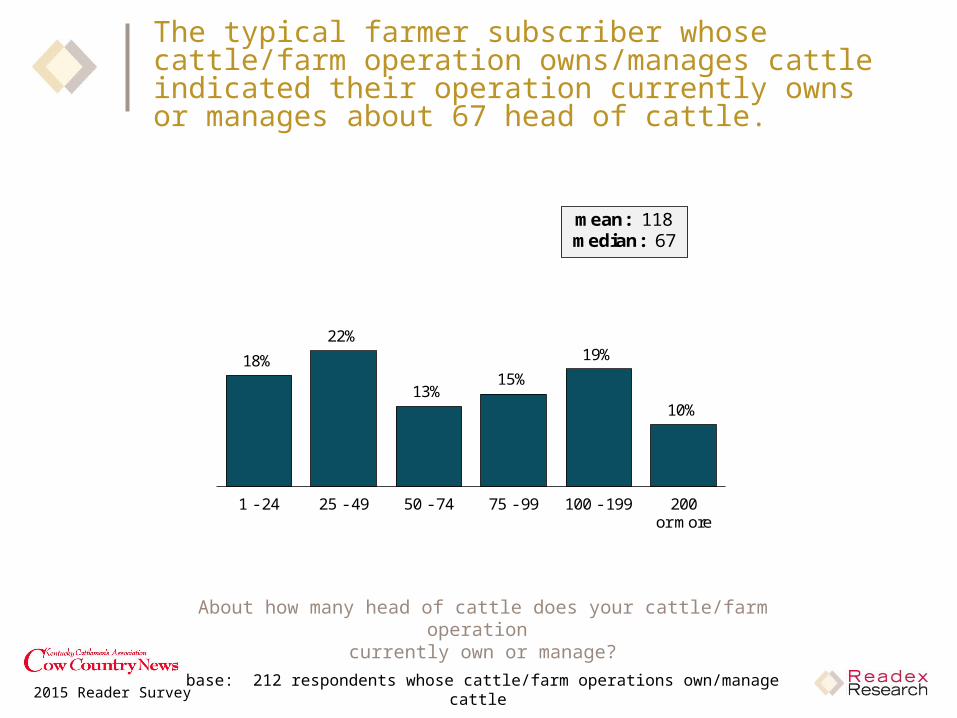
The typical farmer subscriber whose cattle/farm operation owns/manages cattle indicated their operation currently owns or manages about 67 head of cattle.
18%
22%
13%15%
19%
10%
1 - 24 25 - 49 50 - 74 75 - 99 100 - 199 200or more
mean: 118median: 67
About how many head of cattle does your cattle/farm operation currently own or manage?
base: 212 respondents whose cattle/farm operations own/manage cattle
2015 Reader Survey
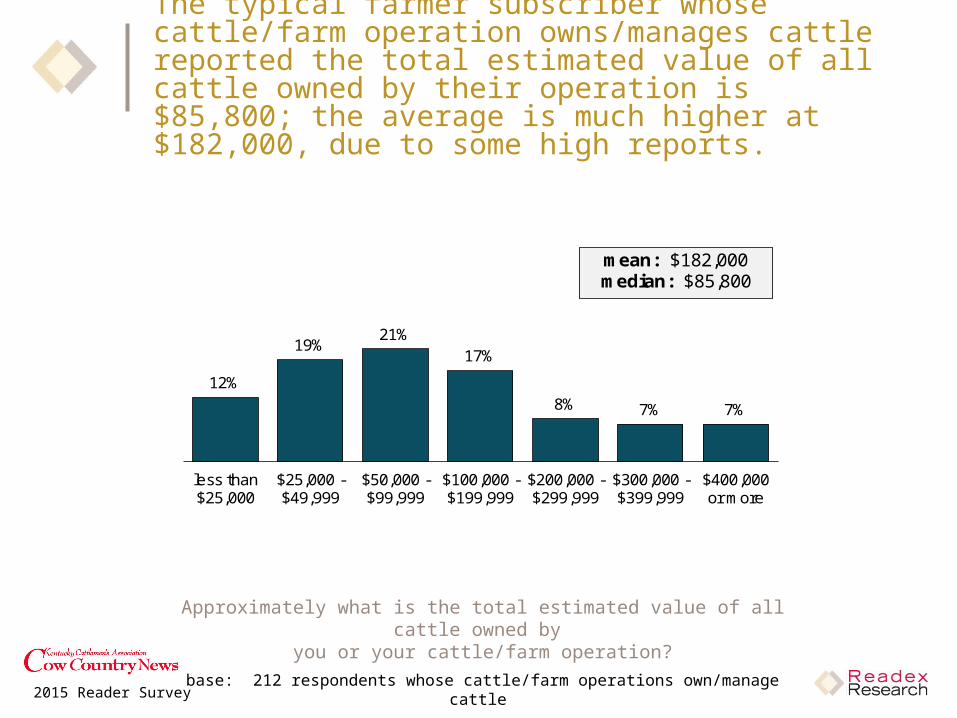
The typical farmer subscriber whose cattle/farm operation owns/manages cattle reported the total estimated value of all cattle owned by their operation is $85,800; the average is much higher at $182,000, due to some high reports.
Approximately what is the total estimated value of all cattle owned by you or your cattle/farm operation?
base: 212 respondents whose cattle/farm operations own/manage cattle
12%
19%21%
17%
8% 7% 7%
less than$25,000
$25,000 -$49,999
$50,000 -$99,999
$100,000 -$199,999
$200,000 -$299,999
$300,000 -$399,999
$400,000or more
mean: $182,000median: $85,800
2015 Reader Survey
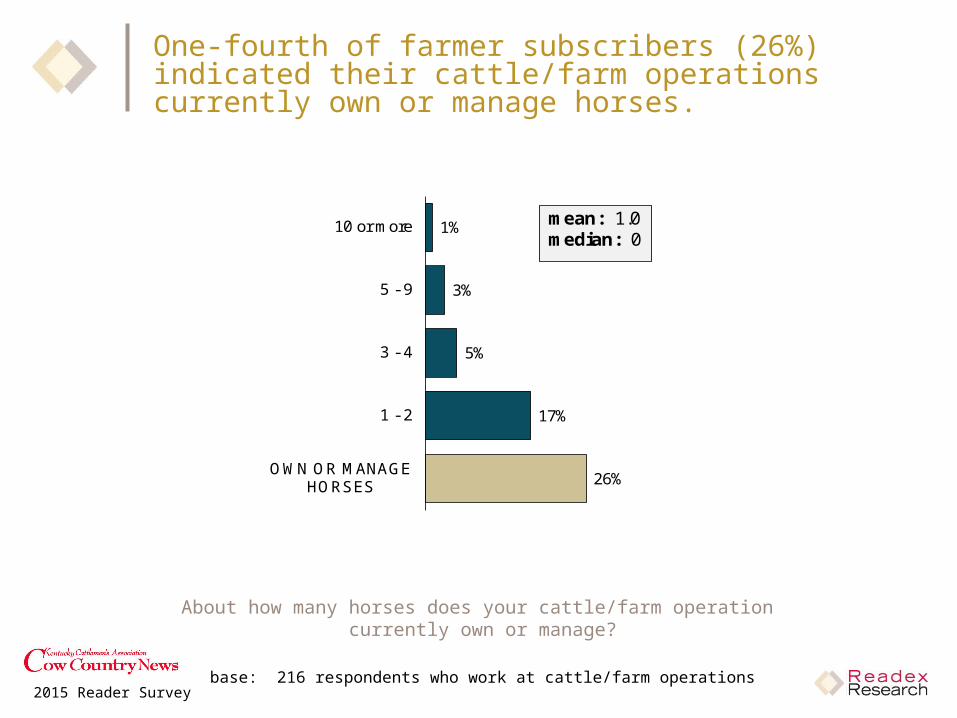
One-fourth of farmer subscribers (26%) indicated their cattle/farm operations currently own or manage horses.
1%
3%
5%
17%
26%
10 or more
5 - 9
3 - 4
1 - 2
OWN OR MANAGEHORSES
mean: 1.0median: 0
About how many horses does your cattle/farm operation currently own or manage?
base: 216 respondents who work at cattle/farm operations
2015 Reader Survey
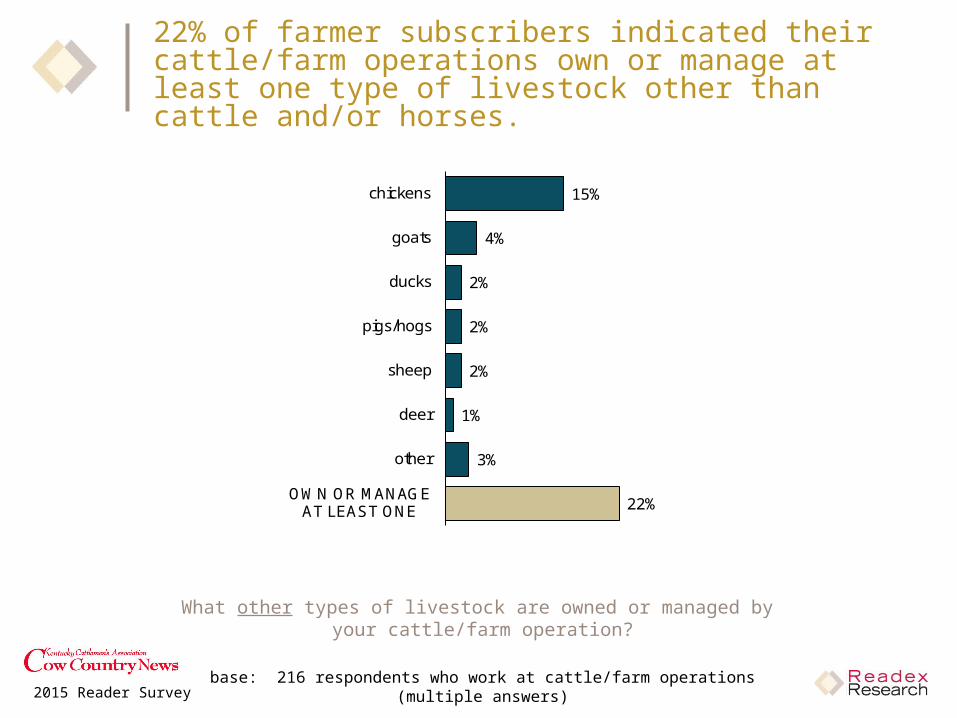
22% of farmer subscribers indicated their cattle/farm operations own or manage at least one type of livestock other than cattle and/or horses.
What other types of livestock are owned or managed by your cattle/farm operation?
base: 216 respondents who work at cattle/farm operations (multiple answers)
15%
4%
2%
2%
2%
1%
3%
22%
chickens
goats
ducks
pigs/hogs
sheep
deer
other
OWN OR MANAGEAT LEAST ONE

2015 Reader Survey
Two in five farmer subscribers (41%) indicated their cattle/farm operations currently insure at least some of their livestock.
Are any of your cattle/farm operation’s livestock currently insured?
base: 216 respondents who work at cattle/farm operations
yes41% no
51%
no answer8%
2015 Reader Survey
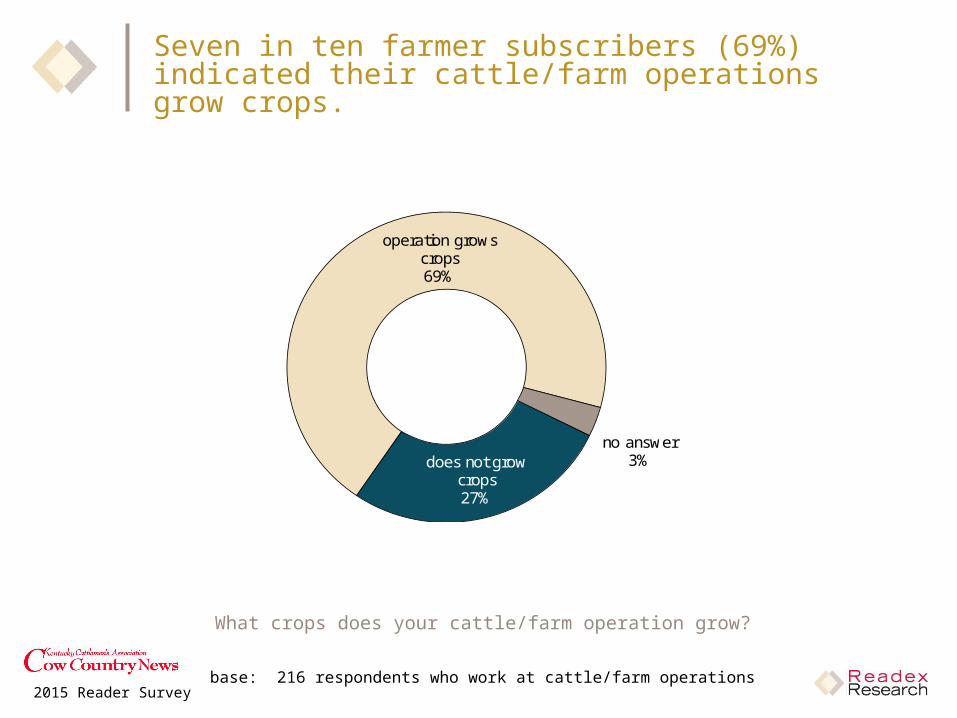
Seven in ten farmer subscribers (69%) indicated their cattle/farm operations grow crops.
What crops does your cattle/farm operation grow?
base: 216 respondents who work at cattle/farm operations
does not grow crops27%
operation grows crops69%
no answer3%
2015 Reader Survey
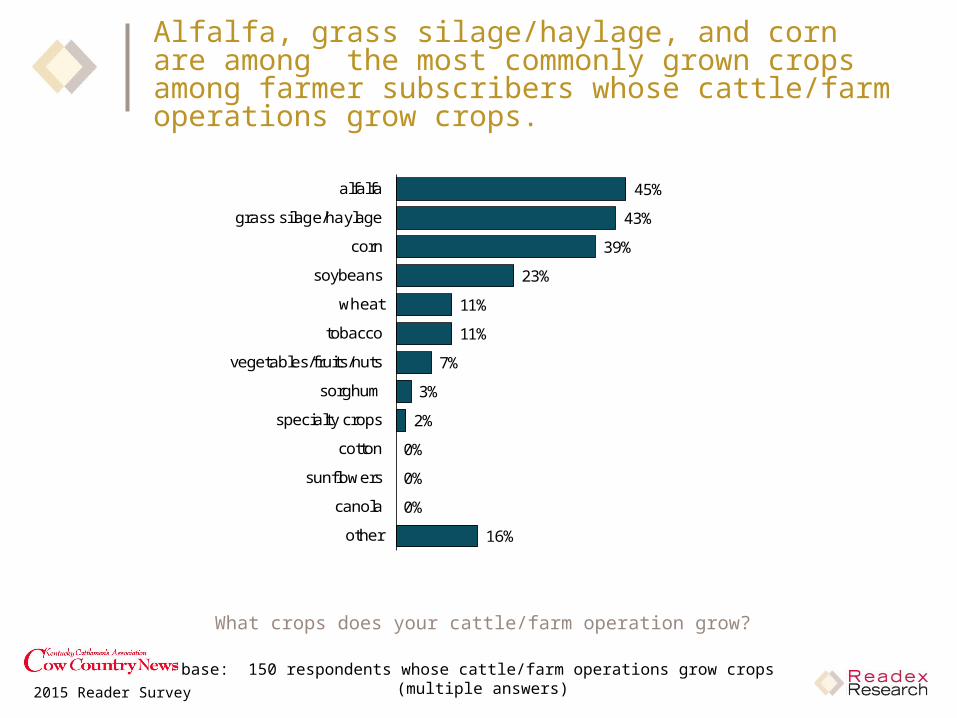
Alfalfa, grass silage/haylage, and corn are among the most commonly grown crops among farmer subscribers whose cattle/farm operations grow crops.
45%
43%
39%
23%
11%
11%
7%
3%
2%
0%
0%
0%
16%
alfalfa
grass silage/haylage
corn
soybeans
wheat
tobacco
vegetables/fruits/nuts
sorghum
specialty crops
cotton
sunflowers
canola
other
What crops does your cattle/farm operation grow?
base: 150 respondents whose cattle/farm operations grow crops (multiple answers)

2015 Reader Survey
A majority of farmer subscribers (73%) indicated their cattle/farm operations mainly harvest (versus purchase) the roughage they use.
73%
9%
14%
1%
harvest
purchase
both equally
neither
Does your cattle/farm operation mainly harvest or purchase the roughage it uses?
base: 216 respondents who work at cattle/farm operations
2015 Reader Survey
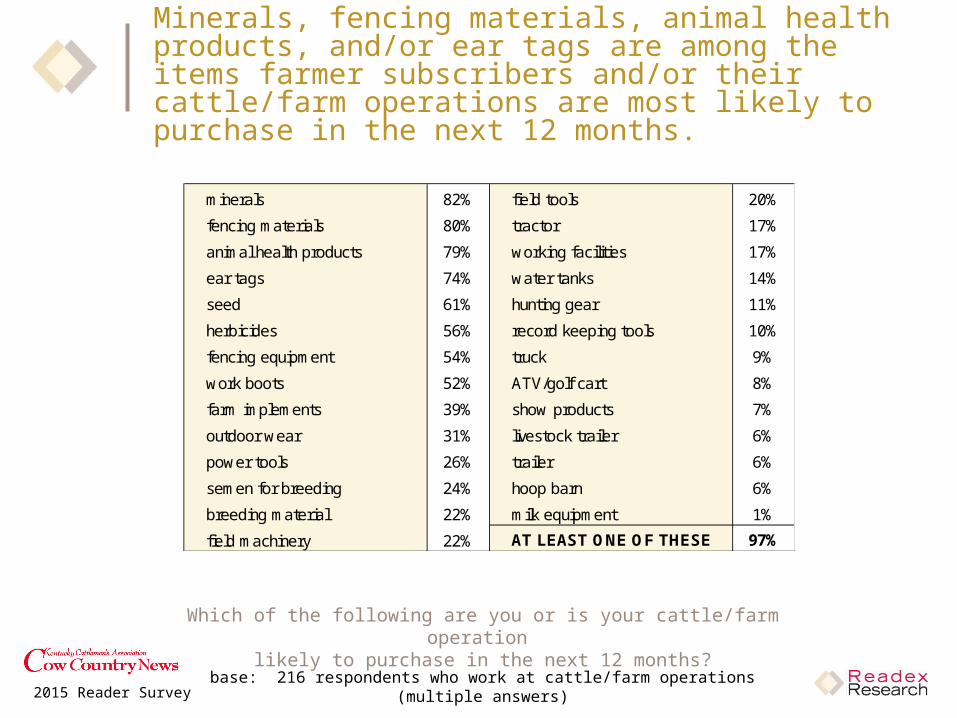
Minerals, fencing materials, animal health products, and/or ear tags are among the items farmer subscribers and/or their cattle/farm operations are most likely to purchase in the next 12 months.
minerals 82% field tools 20%
fencing materials 80% tractor 17%
animal health products 79% working facilities 17%
ear tags 74% water tanks 14%
seed 61% hunting gear 11%
herbicides 56% record keeping tools 10%
fencing equipment 54% truck 9%
work boots 52% ATV/golf cart 8%
farm implements 39% show products 7%
outdoor wear 31% livestock trailer 6%
power tools 26% trailer 6%
semen for breeding 24% hoop barn 6%
breeding material 22% milk equipment 1%
field machinery 22% AT LEAST ONE OF THESE 97%
Which of the following are you or is your cattle/farm operation likely to purchase in the next 12 months?
base: 216 respondents who work at cattle/farm operations (multiple answers)
2015 Reader Survey
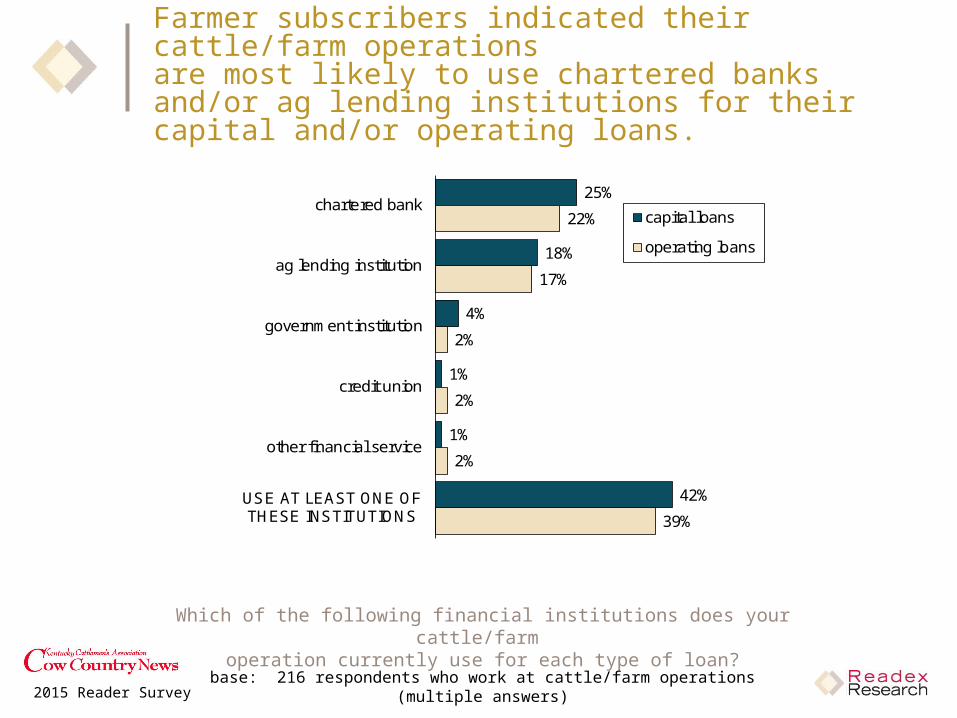
Farmer subscribers indicated their cattle/farm operations are most likely to use chartered banks and/or ag lending institutions for their capital and/or operating loans.
25%
18%
4%
1%
1%
42%
22%
17%
2%
2%
2%
39%
chartered bank
ag lending institution
government institution
credit union
other financial service
USE AT LEAST ONE OFTHESE INSTITUTIONS
capital loans
operating loans
Which of the following financial institutions does your cattle/farm operation currently use for each type of loan?
base: 216 respondents who work at cattle/farm operations (multiple answers)
2015 Reader Survey
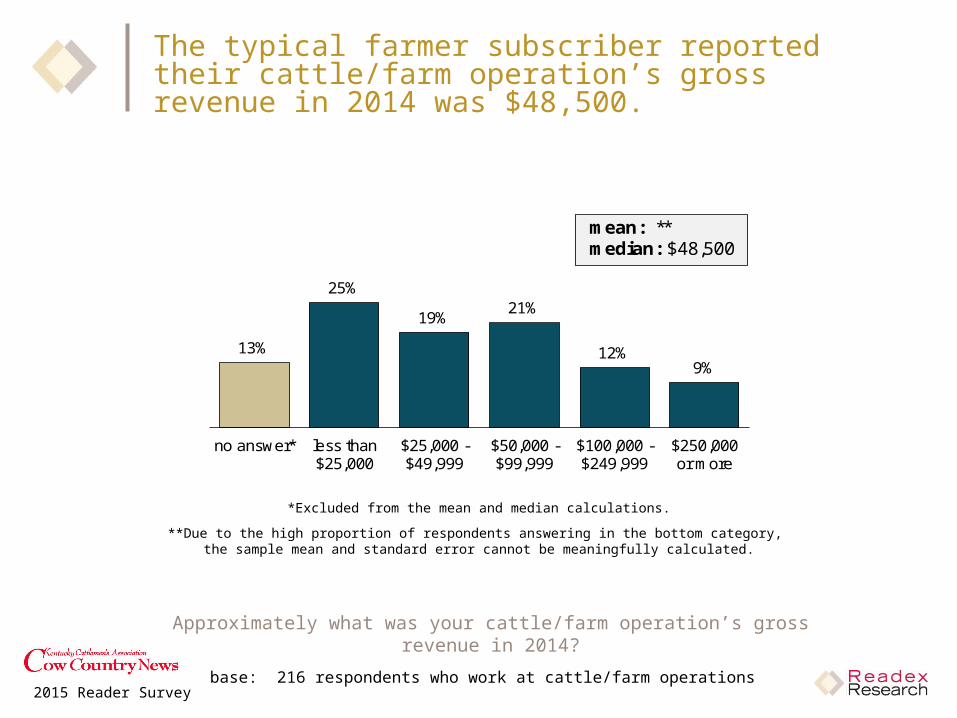
The typical farmer subscriber reported their cattle/farm operation’s gross revenue in 2014 was $48,500.
Approximately what was your cattle/farm operation’s gross revenue in 2014?
base: 216 respondents who work at cattle/farm operations
13%
25%
19%21%
12%9%
no answer* less than$25,000
$25,000 -$49,999
$50,000 -$99,999
$100,000 -$249,999
$250,000or more
mean: **median: $48,500
*Excluded from the mean and median calculations.
**Due to the high proportion of respondents answering in the bottom category, the sample mean and standard error cannot be meaningfully calculated.

2015 Reader Survey
Five in six farmer subscribers (84%) are owners of their cattle/farm operations. Another 13% are partners.
84%
13%
2%
0%
owner
partner
manager
employee
What best describes your job function at your cattle/farm operation?
base: 216 respondents who work at cattle/farm operations
2015 Reader Survey
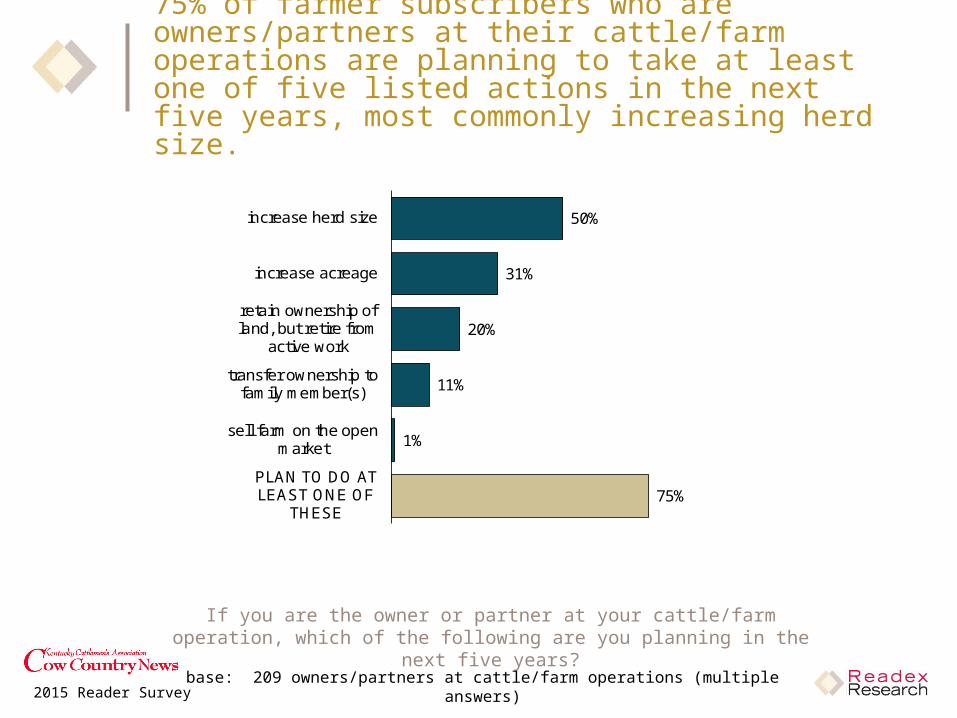
75% of farmer subscribers who are owners/partners at their cattle/farm operations are planning to take at least one of five listed actions in the next five years, most commonly increasing herd size.
If you are the owner or partner at your cattle/farm operation, which of the following are you planning in the next five years?
base: 209 owners/partners at cattle/farm operations (multiple answers)
50%
31%
20%
11%
1%
75%
increase herd size
increase acreage
retain ownership ofland, but retire from
active work
transfer ownership tofamily member(s)
sell farm on the openmarket
PLAN TO DO ATLEAST ONE OF
THESE
2015 Reader Survey
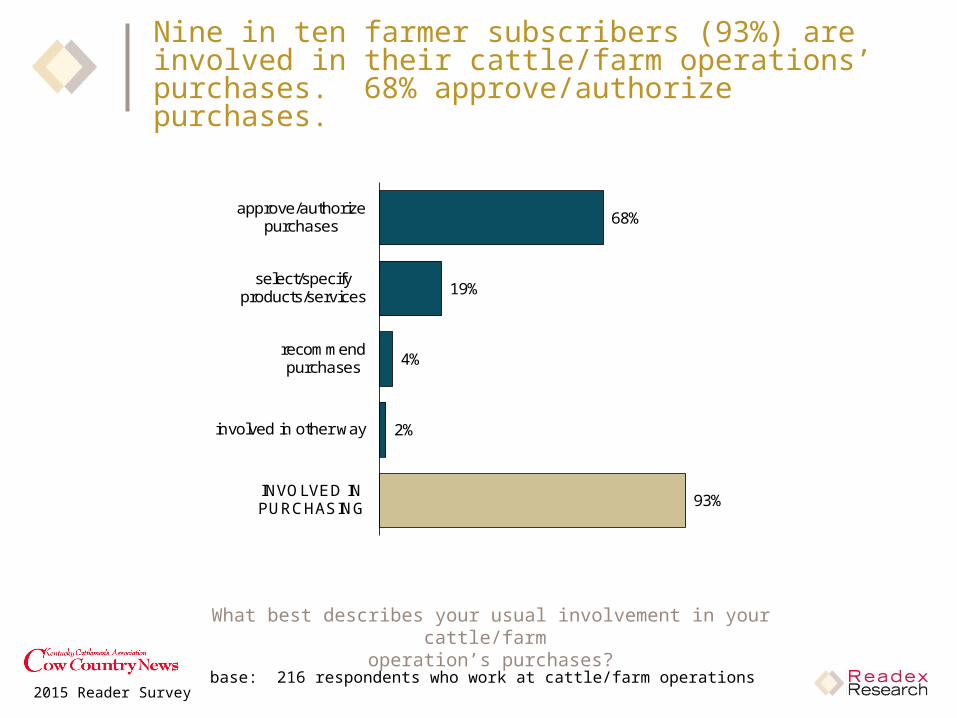
Nine in ten farmer subscribers (93%) are involved in their cattle/farm operations’ purchases. 68% approve/authorize purchases.
What best describes your usual involvement in your cattle/farm operation’s purchases?
base: 216 respondents who work at cattle/farm operations
68%
19%
4%
2%
93%
approve/authorizepurchases
select/specifyproducts/services
recommendpurchases
involved in other way
INVOLVED INPURCHASING
2015 Reader Survey
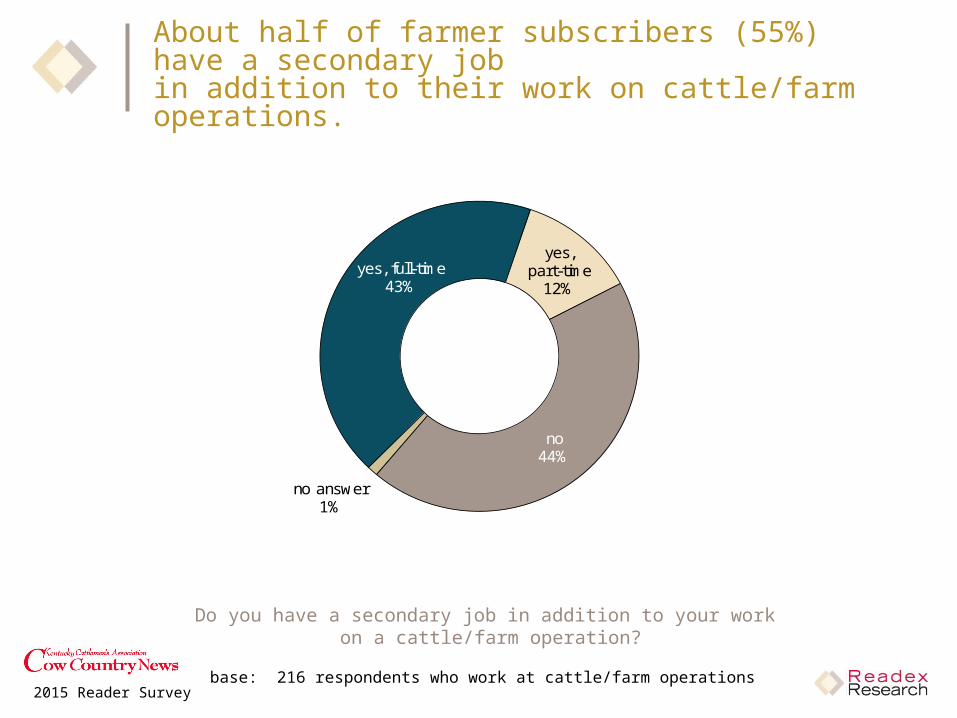
About half of farmer subscribers (55%) have a secondary job in addition to their work on cattle/farm operations.
yes, full-time43%
yes, part-time
12%
no44%
no answer1%
Do you have a secondary job in addition to your work on a cattle/farm operation?
base: 216 respondents who work at cattle/farm operations
2015 Reader Survey
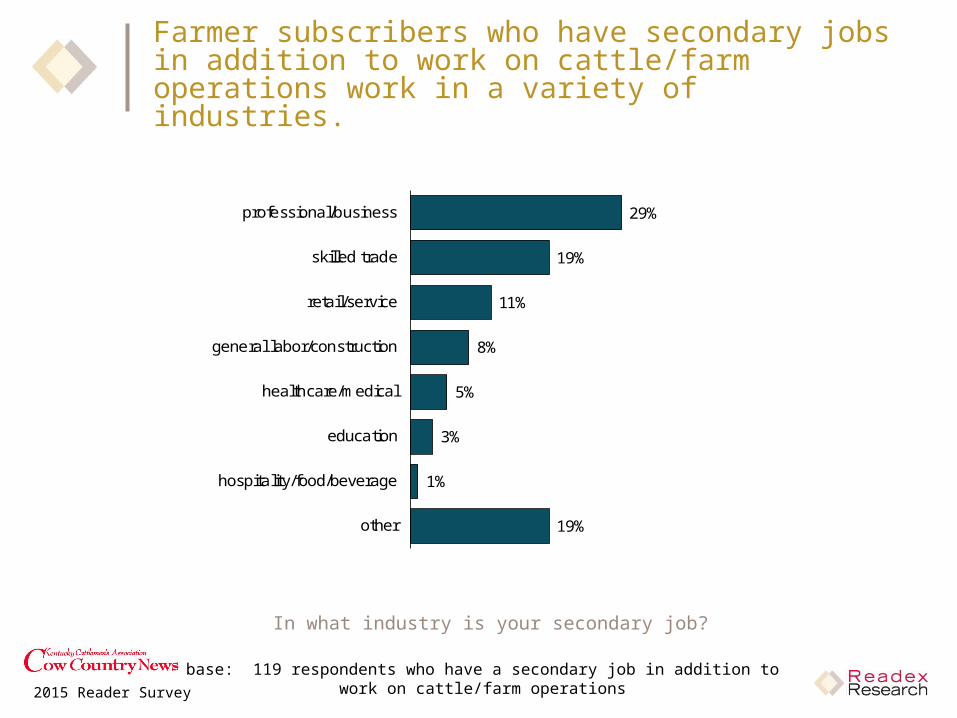
Farmer subscribers who have secondary jobs in addition to work on cattle/farm operations work in a variety of industries.
29%
19%
11%
8%
5%
3%
1%
19%
professional/business
skilled trade
retail/service
general labor/construction
healthcare/medical
education
hospitality/food/beverage
other
In what industry is your secondary job?
base: 119 respondents who have a secondary job in addition towork on cattle/farm operations
2015 Reader Survey
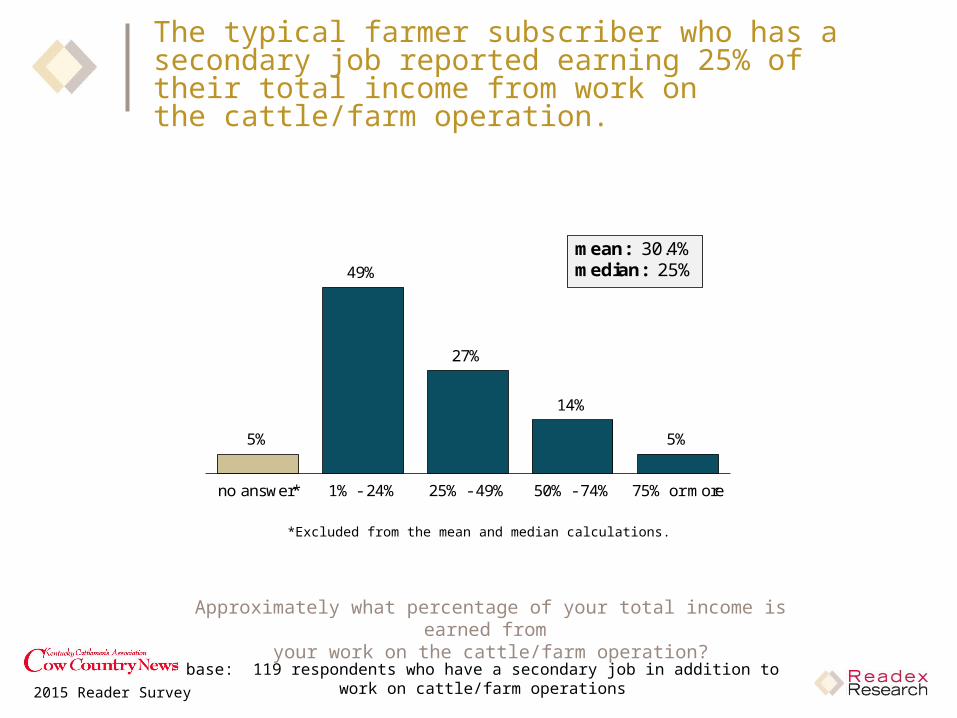
The typical farmer subscriber who has a secondary job reported earning 25% of their total income from work on the cattle/farm operation.
Approximately what percentage of your total income is earned from your work on the cattle/farm operation?
base: 119 respondents who have a secondary job in addition towork on cattle/farm operations
5%
49%
27%
14%
5%
no answer* 1% - 24% 25% - 49% 50% - 74% 75% or more
mean: 30.4%median: 25%
*Excluded from the mean and median calculations.
2015 Reader Survey
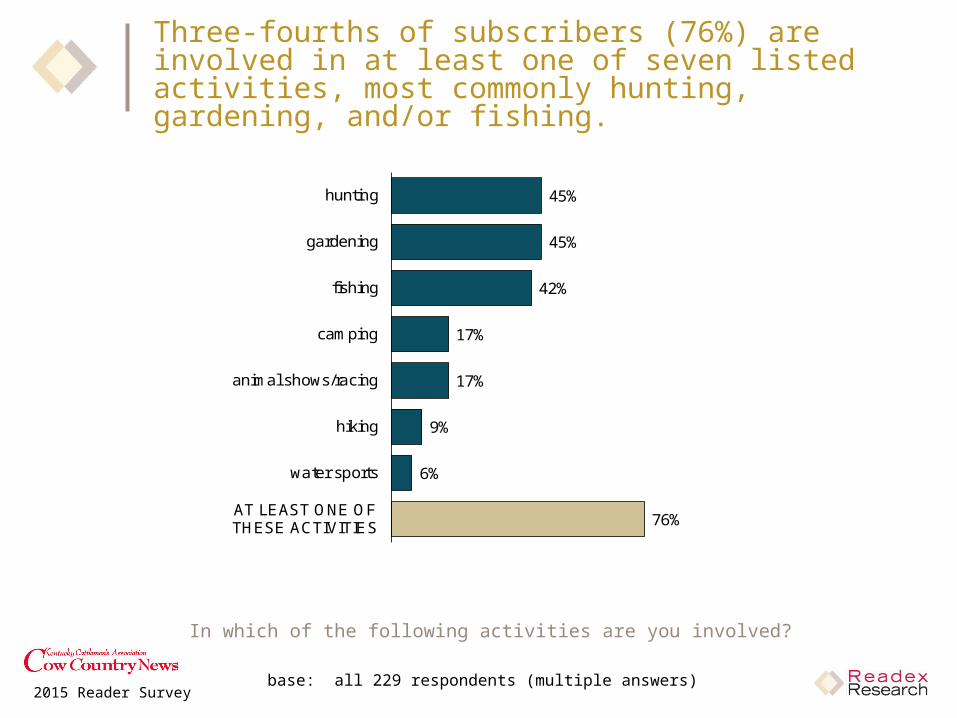
Three-fourths of subscribers (76%) are involved in at least one of seven listed activities, most commonly hunting, gardening, and/or fishing.
In which of the following activities are you involved?
base: all 229 respondents (multiple answers)
45%
45%
42%
17%
17%
9%
6%
76%
hunting
gardening
fishing
camping
animal shows/racing
hiking
water sports
AT LEAST ONE OFTHESE ACTIVITIES

2015 Reader Survey
About half of subscribers (48%) access/use social media, most commonly Facebook and/or YouTube.
What social media websites do you access/use?
base: all 229 respondents (multiple answers)
37%
22%
9%
7%
7%
6%
6%
48%
YouTube
other
ACCESS/USESOCIAL MEDIA

2015 Reader Survey
The typical subscriber is a 62-year-old male.
male90% female
7%
no answer3%
41%
25%
18%
7%
5%
3%
65 or over
55 - 64
45 - 54
35 - 44
25 - 34
under 25
mean: *median: 62
What is your age? Are you male or female?
base: all 229 respondents
AGE GENDER
*Due to the high proportion of respondents answering in the top category, the sample mean and standard error cannot be meaningfully calculated.
2015 Reader Survey
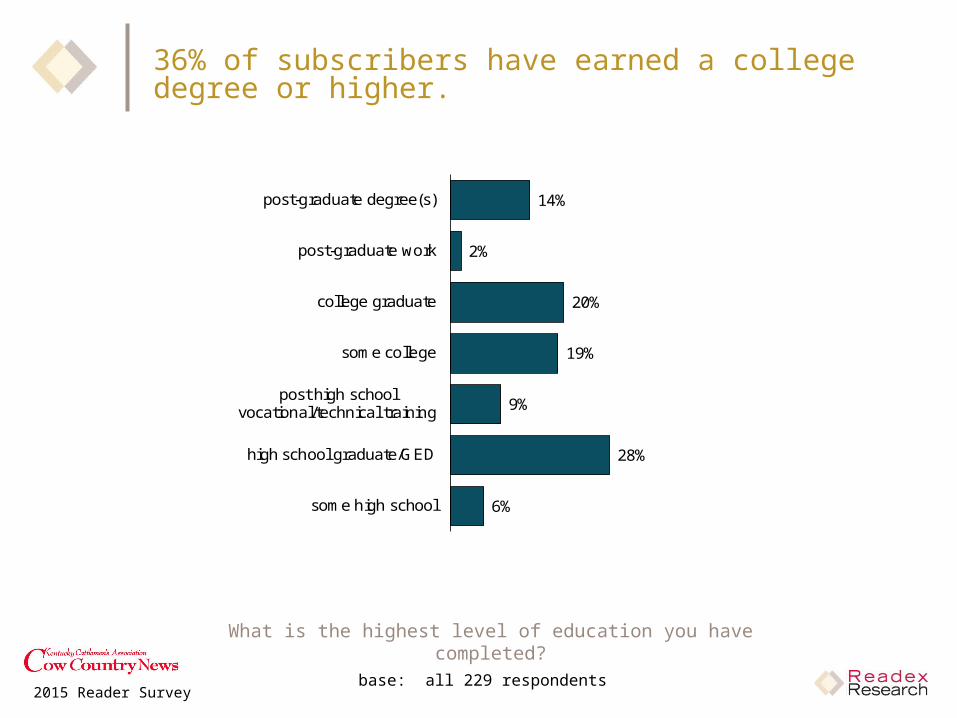
36% of subscribers have earned a college degree or higher.
14%
2%
20%
19%
9%
28%
6%
post-graduate degree(s)
post-graduate work
college graduate
some college
post high schoolvocational/technical training
high school graduate/GED
some high school
What is the highest level of education you have completed?
base: all 229 respondents
2015 Reader Survey
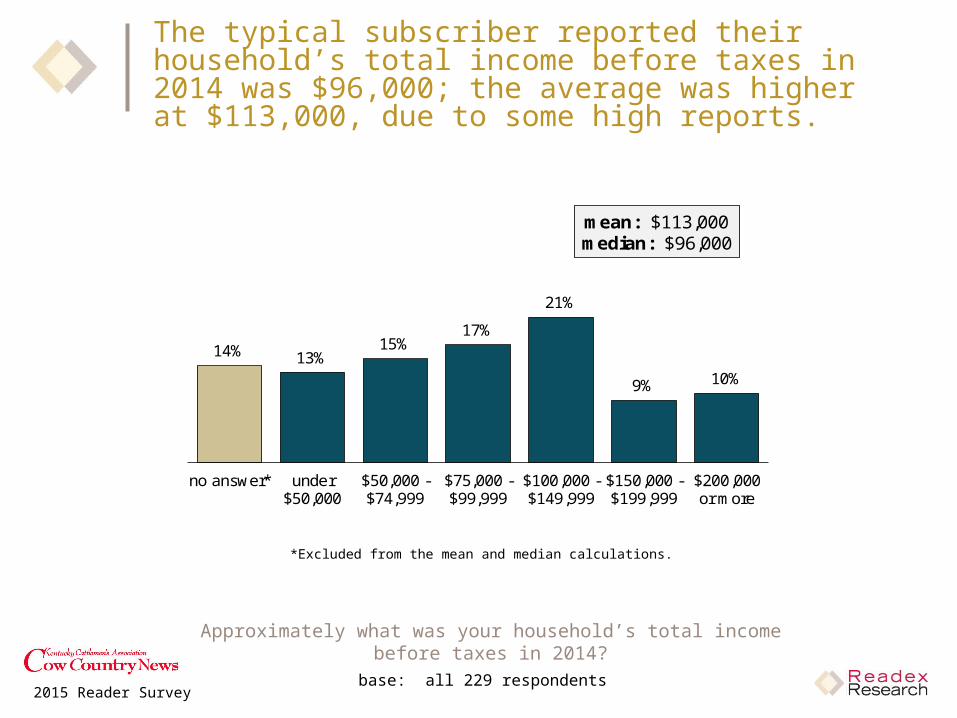
The typical subscriber reported their household’s total income before taxes in 2014 was $96,000; the average was higher at $113,000, due to some high reports.
14% 13%15%
17%
21%
9% 10%
no answer* under$50,000
$50,000 -$74,999
$75,000 -$99,999
$100,000 -$149,999
$150,000 -$199,999
$200,000or more
mean: $113,000median: $96,000
*Excluded from the mean and median calculations.
Approximately what was your household’s total income before taxes in 2014?
base: all 229 respondents


