ENHANCEMENT OF THERMOELECTRIC PROPERTIES FOR DOPED SKUTTERUDITES BASED ON CoSb3 THROUGH BALL MILLING PARAMETRIC OPTIMIZATION MD OVIK RAIHAN FACULTY OF ENGINEERING UNIVERSITY OF MALAYA KUALA LUMPUR 2018 University of Malaya
Transcript
ENHANCEMENT OF THERMOELECTRIC PROPERTIES FOR DOPED SKUTTERUDITES BASED ON CoSb3
THROUGH BALL MILLING PARAMETRIC OPTIMIZATION
MD OVIK RAIHAN
FACULTY OF ENGINEERING
UNIVERSITY OF MALAYA
KUALA LUMPUR
2018
Univers
ity of
Mala
ya
ENHANCEMENT OF THERMOELECTRIC
PROPERTIES FOR DOPED SKUTTERUDITES BASED
ON CoSb3 THROUGH BALL MILLING PARAMETRIC
OPTIMIZATION
MD OVIK RAIHAN
THESIS SUBMITTED IN FULFILMENT OF THE
REQUIREMENTS FOR THE DEGREE OF MASTER OF ENGINEERING SCIENCE
FACULTY OF ENGINEERING
UNIVERSITY OF MALAYA KUALA LUMPUR
2018 Univers
ity of
Mala
ya
ii
UNIVERSITY OF MALAYA
ORIGINAL LITERARY WORK DECLARATION
Name of Candidate: MD Ovik Raihan
Matric No: KGA140040
Name of Degree: Master of Engineering Science
Title of Project Paper/Research Report/Dissertation/Thesis (“this
Work”): Enhancement of Thermoelectric Properties for Doped Skutterudites Based on
CoSb3 through Ball Milling Parametric Optimization
Field of Study: Engineering Materials
I do solemnly and sincerely declare that:
(1) I am the sole author/writer of this Work; (2) This Work is original; (3) Any use of any work in which copyright exists was done by way of fair dealing
and for permitted purposes and any excerpt or extract from, or reference to or reproduction of any copyright work has been disclosed expressly and
sufficiently and the title of the Work and its authorship have been acknowledged in this Work;
(4) I do not have any actual knowledge nor do I ought reasonably to know that the
making of this work constitutes an infringement of any copyright work; (5) I hereby assign all and every rights in the copyright to this Work to the
University of Malaya (“UM”), who henceforth shall be owner of the copyright in this Work and that any reproduction or use in any form or by any means whatsoever is prohibited without the written consent of UM having been first
had and obtained; (6) I am fully aware that if in the course of making this Work I have infringed any
copyright whether intentionally or otherwise, I may be subject to legal action or any other action as may be determined by UM.
Candidate’s Signature Date:
Subscribed and solemnly declared before,
Witness’s Signature Date:
Name:
Designation:
Univers
ity of
Mala
ya
ii
UNIVERSITI MALAYA
PERAKUAN KEASLIAN PENULISAN
Nama: MD Ovik Raihan
No. Matrik: KGA140040
Nama Ijazah: Ijazah Sarjana Kejuruteraan Sains
Tajuk Kertas Projek/Laporan Penyelidikan/Disertasi/Tesis (“Hasil Kerja ini”):
Enhancement of Thermoelectric Properties for Doped Skutterudites Based on
CoSb3 through Ball Milling Parametric Optimization
Bidang Penyelidikan: Engineering Materials
Saya dengan sesungguhnya dan sebenarnya mengaku bahawa:
(1) Saya adalah satu-satunya pengarang/penulis Hasil Kerja ini;
(2) Hasil Kerja ini adalah asli; (3) Apa-apa penggunaan mana-mana hasil kerja yang mengandungi hakcipta telah
dilakukan secara urusan yang wajar dan bagi maksud yang dibenarkan dan apa-
apa petikan, ekstrak, rujukan atau pengeluaran semula daripada atau kepada mana-mana hasil kerja yang mengandungi hakcipta telah dinyatakan dengan
sejelasnya dan secukupnya dan satu pengiktirafan tajuk hasil kerja tersebut dan pengarang/penulisnya telah dilakukan di dalam Hasil Kerja ini;
(4) Saya tidak mempunyai apa-apa pengetahuan sebenar atau patut
semunasabahnya tahu bahawa penghasilan Hasil Kerja ini melanggar suatu hakcipta hasil kerja yang lain;
(5) Saya dengan ini menyerahkan kesemua dan tiap-tiap hak yang terkandung di dalam hakcipta Hasil Kerja ini kepada Universiti Malaya (“UM”) yang seterusnya mula dari sekarang adalah tuan punya kepada hakcipta di dalam
Hasil Kerja ini dan apa-apa pengeluaran semula atau penggunaan dalam apa jua bentuk atau dengan apa juga cara sekalipun adalah dilarang tanpa terlebih
dahulu mendapat kebenaran bertulis dari UM; (6) Saya sedar sepenuhnya sekiranya dalam masa penghasilan Hasil Kerja ini saya
telah melanggar suatu hakcipta hasil kerja yang lain sama ada dengan niat atau
sebaliknya, saya boleh dikenakan tindakan undang-undang atau apa-apa tindakan lain sebagaimana yang diputuskan oleh UM.
Tandatangan Calon Tarikh:
Diperbuat dan sesungguhnya diakui di hadapan,
Tandatangan Saksi Tarikh:
Nama:
Jawatan:
Univers
ity of
Mala
ya
iii
ENHANCEMENT OF THERMOELECTRIC PROPERTIES FOR DOPED
SKUTTERUDITES BASED ON CoSb3 THROUGH BALL MILLING
PARAMETRIC OPTIMIZATION
ABSTRACT
In search for green energy harvesting materials, thermoelectric technology has been
identified as a promising technology to generate electricity from waste heat through the
presence of a temperature gradient. Skutterudite a viable candidate for high performance
thermoelectric material given its advantages of modifying its structure such as doping,
filling, substitution in its cage structure to achieve high performance; making its one of
the sophisticated member of the thermoelectric application. In this work a new
composition of Bi doped and Fe substituted Co3Sb12 system was successfully synthesized
by two step process namely ball milling and spark plasma sintering. The ball milling
process produce nanostructures. Which are expected to give superior TE properties
through reduction in thermal conductivity. Three different ball milling time were
investigated: 10h, 15h, 20 h and their correlation to the thermoelectric properties studied
in this thesis. Introduction of the Co and Bi with heat treatment resulted in a successful
formation of Bi-0.6FeCo3Sb12 skutterudite. Which is expected to give better thermoelectric
performance through substitution of Co with Fe and the Bi doping. The phase structure
and morphology of the bulk samples were examined by X-ray diffraction (XRD) and
scanning electron microscopy integrated energy-dispersive X-ray spectroscopy analysis
(SEM-EDS), respectively. . Rietveld analysis of its XRD spectra indicated that the Bi
doping on the Co4Sb12 based skutterudite succeeded in partially filling the voids of the
skutterudite, whilst the Fe doping partially substituted the Co sites in the lattice. The
thermoelectric properties of the Bi filled and Fe substituted bulk samples were measured
in a temperature range of 373 K to 673 K. Evidently all of the Bi doped and Fe substituted
samples showed a dominant phase of CoSb3 skutterudite. Comparative study among the
Univers
ity of
Mala
ya
iv
Bi filled, Fe substituted samples were done. The ball milling times was correlated to the
resulting microstructure, and ultimately, its thermoelectric performance. It was found that
the moderate ball milling times (at 15 hours) resulted in the best electrical conductivity
of 122K Ω-1m-1 at 373 K, given the homogenous distribution of particles. A Maximum
ZT value was observed 0.17 for 10 h ball milled sample at 673 K, whilst almost the same
value was achieved for the 15 h ball milled sample , i.e ZT =0.169 at 673 K. This work
provides a pathway for improvement of the electrical conductivity and decreasing the
thermal conductivity, and is thus a useful strategy for future design of skutterudite
materials for thermoelectrics. The analysis of the effect of the ball milling conditions on
the thermoelectric performance of this formulations also gives insight to the optimal
conditions which may yield a good microstructure, and hence good thermoelectric
performance. It has been shown that moderate milling times will provide a well
distributed sample which is conducive for good electrical conductivity and low thermal
conductivity. This work also demonstrated that milling time is able to affect the final
composition of the skutterudite in terms of the amount of Bi filling, despite using the
Table 4.1: Lattice parameter of the Bi0.6FeCo3Sb12 skutterudite for different milling
duration. Their actual compositions after sps and Fe occupancy. ................................... 70
Table 4.2 Particle size via Particle size analyzer. ........................................................... 75
Table 4.3: Comparison among the 10 h, 15 h and 20 h ball milled and SPS samples with
binary, Fe doped ternary and Bi added Co4Sb12 skutterudite at 600 K. ........................ 88
Univers
ity of
Mala
ya
xvii
LIST OF SYMBOLS AND ABBREVIATIONS
TE : Thermoelectric
Z : Thermoelectric figure of merit
ZT : Dimensionless thermoelectric figure of merit
α : Seebeck coefficient
σ : Electrical conductivity
T : Temperature
k : Thermal conductivity
PF : Power Factor
ΔV : Voltage difference
ΔT : Temperature difference
Ke : Electrons transporting heat
Kl : Phonons transporting heat
L : Lorenz number
КB : Boltzman constant
e : Electron charge
PGEC : Phonon glass electron crystal
ρ : Electrical resistivity
CV : Specific heat
Vs : Speed of sound
ne : Carrier concentration
μ : mobility
h : Plank’s constant
SPS : Spark plasma sintering
TEG : Thermoelectric generator
Univers
ity of
Mala
ya
xviii
MA : Mechanical alloying
XRD : X-ray diffraction
SEM : Scanning electron microscopy
FESEM : Field emission scanning electron microscopy
EDS : Energy-dispersive X-ray spectroscopy
PCA : Process control agent
HP : Hot press
HIP : Hot isostatic pressing
FRC : Fiber reinforced ceramic
MMC : Metal matrix composite
FGM : Functionally graded materials
Univers
ity of
Mala
ya
19
CHAPTER 1: INTRODUCTION
1.1 Introduction
The world is suffering from one a problem in electricity supply with regards to
increasing energy demands worldwide. Furthermore, environmental issues arising from
fossil fuel burning from conventional energy combustion. These conventional heat
engines are running approximately 30 – 40% efficiency and the rest of the energy is lost
by waste heat (T. Wang, Zhang, Peng, & Shu, 2011). Burning of fossil fuels to meet the
energy demand plays a major role to the emission of greenhouse gases, effecting directly
to the planet’s environment and causing climate changes, pollutions and eventually
leading to global warming (Dmitriev & Zvyagin, 2010; Kalkan, Young, & Celiktas, 2012)
These issues relating to environment and energy are amongst this century’s biggest
challenges.
To aid this huge problem for mankind, renewable energy seemingly the hope for this
crisis. Amongst the renewable energy solutions harnessing solar, geothermal, wave, wind,
thermoelectric, radio-isotope, hydro are some of the most popular and vastly used
methods of renewable energy. Heat recovery form wasted heat into electricity employs
thermoelectric devices are the leading technology. Themoelectric devices or materials are
directly related to the phenomenon of the ability of such devices to directly convert
thermal energy to electrical energy and vice versa. TE devices wide boundary of working
range and the potential of nanostructure modification for better performance making it
one of the ideal and potential devices for development of a scalable, effective, solid state
renewable energy devices. TE devices’ working temperature range can be as low as
milliwatt range to megawatt applications (Keskar et al., 2012; Kishi et al., 1999). Making
TE devices are prospective candidate for energy harvesting from industrial to domestic
sector including transportation sector (Hmood, Kadhim, & Hassan, 2013; Tomeš et al.,
2010)
Univers
ity of
Mala
ya
20
A schematic diagram in Figure 1.1 shows how waste heat can be recovered as
electricity to mitigate energy consumption as well as reducing carbon footprints,
greenhouse gases emission, pollution etc. Based on a 20% thermoelectric generator
(TEG) efficiency it can be possible to reduce 40 million tons of CO2 emission to the
environment annually (Kawamoto, 2009). Using the principles and properties of TEGs
its application ranges from electricity generation from waste heat to refrigeration, from
car exhaust to space missions.
Figure 1.1: Schematic diagram of energy loss in everyday uses and potential of
thermoelectricity to mitigate the huge loss. (Prometeon)
Considering the potential of thermoelectric devices intensive research is ongoing to
develop thermoelectric materials for better efficiency, synthesis methods and to obtain
low cost high performance materials for full scale industry production. To achieve these
goals scientist and researchers developed some novel thermoelectric materials. For
examples skutterudites, chalcogenides, silicides, clathrates, half-heuslers a few cases of
Univers
ity of
Mala
ya
21
popular and widely investigated thermoelectric materials. Each of the materials are
unique and has their own structural, thermoelectric, mechanical properties and different
synthesis methods. For example filled skutterudite as thermoelectric material has low
production cost, high mechanical strength, high oxidation resistance, thermal stability is
good compare to the other thermoelectric materials, chemical stability and in mid
temperature range of 300 - 800 K skutterudite materials show relatively high figure of
merit (Truong, Kleinke, & Gascoin, 2014). One of the factors for significant improvement
of thermoelectric materials is the introduction of nanostructures into thermoelectric
materials to improve their performance, such as nanowires, quantum dots and
superlattices. This was proposed in 1992 by Dresselhaus et al using Bi2Te3 in a quantum
well structure which showed the potential of relatively higher value to quantum well
structure over the bulk value. It also showed this kind of structure can certainly increase
the overall figure of merit value of certain materials (Hicks & Dresselhaus, 1993)
The effect of nanotechnology has impressive effect on TE power generation. By using
of nanotechnology it is evident that the improvement in the performance due to material
synthesis is generating good results on the development of the TE devices. Which is so
vast now a days that, it is now compared with the performance of the conventional
materials. The performance of a TE material is determined by a dimensionless figure of
merit (ZT), which is defined as
k
TSZT
2
(1.1)
Here, S is the he Seebeck coefficient, σ is electrical conductivity, k is thermal
conductivity and T is the absolute temperature. An efficient device mostly relies on the
materials with high electrical conductivity (σ), high Seebeck coefficient (S) and low
thermal conductivity (κ) for a steady solid-state thermoelectric energy conversion. With
Univers
ity of
Mala
ya
22
the help of structural engineering it is already proven that the quantum and classical size
effects has the ground for the tailoring of the electron and phonon transport properties in
nanostructure. There were many techniques introduces such as quantum dots, quantum
wells, superlattices to alteration of the density state of the electrons, band gaps, energy
levels. It opens possibilities to the development of new thermoelectric materials. Besides
the phonon scattering and interface reflections is being used to reduce thermal
conductivity of the thermoelectric materials resulting improvement of this TE sector.
1.2 Thermoelectric devices and its applications
Thermoelectric devices are typically composed of pairs of heavily doped p-type and
n-type semiconductors that are connected thermally in parallel and electrically in series.
The devices contain no mechanically moving parts and thus are noise-free and very stable
for long term operation. Since it has no moving parts and it will be low maintenance.
Thermoelectric devices can be used for power generation and as a cooler.
Figure 1.2: Simple schematic design to show how thermoelectric devices can be used for power generation (left) and cooling (right) (Nolas, Morelli, & Tritt, 1999).
Univers
ity of
Mala
ya
23
It has been estimated that the majority of the world’s power is generated by systems
that typically operate at efficiencies of about 40% or less. Therefore there is an enormous
need for thermoelectric systems that can ‘salvage’ the energy currently lost as heat to the
environment (Rodgers, 2008). Uses of TE devices for the heat recovery is a popular way
to recover the waste heat. The way to improve the sustainability of our electricity base is
through the scavenging of waste heat with thermoelectric generators. Home heating,
automotive exhaust, and industrial processes all generate waste heat that could be
converted to electricity by using thermoelectrics. As thermoelectric generators are solid-
state devices with no moving parts, they are silent, reliable and scalable, making them
ideal for small, distributed power generation (Snyder & Toberer, 2008). The TE device
can also be used for cooling application. As refrigerators, they are friendly to the
environment due to the absence of CFC or any other refrigerant gas. Because of these
advantages, the thermoelectric devices have found a large range of applications. The
application of TE technology can be found in many areas in present days such as military,
aerospace, instrument, biology, medicine and industrial or commercial products. The TE
devices can be used as coolers, power generators, or thermal energy sensors. Small
capacity TE coolers are being used extensively. But, due to the low efficiency, the
application of the large capacity coolers and power generators are very limited. Recently
a number of researches have been conducted by the researchers to apply this technology
to recover waste from different systems. The increasing energy costs and environment
protection regulations are compelled us to think about application of TE device. Univers
ity of
Mala
ya
24
Figure 1.3: The energy loss in the form of energy loss in United States in 2017 (Lab, 2017).
In US alone approximately 66% of energy is lost in the form of wasted heat from 191
million vehicles. Which leads to the annual 36 TWh emission to the environment annually
(Alam & Ramakrishna, 2013). Figure 1.3 shows the estimated energy consumption in the
year of 2017 and the rejected energy. Considering the huge gap between the consumption
and rejection amount of energy the world wide scenario needs aid to this major problem
and thermoelectric devices can be the ideal candidate for potential solution.
1.3 Problem Statements
From the literature review above, we can see that skutterudite are an ideal and potential
PGEC material has both the attraction for discovering new formulations and its properties.
Also as a basic thermoelectric material researchers are working to enhance the
thermoelectric properties and overall ZT. Numerous formulation and synthesis
parameters along with multiple methods available, makes synthesis of skutterudites one
of the complex TE materials, to optimize in a certain process parameter. Also these
Univers
ity of
Mala
ya
25
separate process parameters has not been optimized due to different characteristics of the
elements in the periodic table.
However, we can also see from the literature review that not many work has been
done on identify optimal process parameter in producing high performance TE. Ball
milling is one of the effective and popular synthesis process for TE materials. Due to its
advantages of shortening milling time, storing energy into particle, temperature, grains
sizes etc. For this study the synthesis of Bi0.6FeCo3Sb12 through ball milling and spark
plasma sintering will be conducted. As this formulations ball milling parameters yet not
optimized, in this work we it be optimized and proposed. Investigation will be carried on
the process parameters and its effect of the microstructure on this formulation. Along with
optimization of the ball milling process parameters, study will be conducted to enhance
the thermoelectric properties such as electrical conductivity and overall ZT.
1.4 Objectives
The aim of this research is to synthesize and characterize novel skutterudite based -
TE material for recovering waste heat at an intermediate temperature range. The specific
objectives of this research are enlisted below;
Synthesis of Bi0.6FeCo3Sb12 skutterudites for high efficiency thermoelectric
properties.
Optimize the effect of ball milling parameters on the thermoelectric properties of
Bi0.6FeCo3Sb12.
Investigate the effects of the particle size and filling level of Bi after optimization
on thermoelectric properties of Bi0.6FeCo3Sb12.
Univers
ity of
Mala
ya
26
CHAPTER 2: LITERATURE REVIEW
Thermoelectric materials with their properties lead to extraordinary potentials in the
energy sector. Because there are many types of TE materials present and from material
synthesis to device production the process parameters varies vastly. Formulations of these
materials holds prospect and potential to achieve higher ZT along with development of
certain thermoelectric parameters. There are several methods and synthesis methods
available. Some of them are highlighted in the table no 1.1. Thus, extensive research is
needed to find better process parameters, synthesis technique, formulations to achieve
more efficient, high performance TE materials. For example, the study of “BixFeCoSb3”
(x=0.6 has been used for this study) formulation has not been explored. Addition of Bi
filler in the FeCoSb3 skutterudite projects a probable outcome on high electrical
conductivity due to its heavy atomic weight and electronic properties. Moreover
optimization of the process parameter for this formulation will be proposed. Therefore
due to the research gap on this formulation, it can be studied for process parameter
optimization, microstructure, and increase of thermoelectric properties i.e electrical
properties compared to Cosb3 or FeCoSb3. Synthesis of Bi0.6FeCoSb12 and its overall TE
performance along with microstructure will be studied for this research. In the literature
review below the process parameters and thermoelectric properties has been discussed
extensively.
Univers
ity of
Mala
ya
27
Table 2.1: Skutterudite compounds with their different synthesis process with their respective ZT.
Compound ZT Article name Process References
Sm0.32 Fe1.47
Co2.53 Sb12
0.63 Crystal Structures and
Thermoelectric Properties of Sm-Filled
Skutterudite Compounds SmyFexCo4-xSb12
Melting-sps (Taoxiang,
Xinfeng, Wenjie,
Yonggao, & Qingjie, 2007)
Tl0.20 (Co0.8 Rh0.2)4Sb12
0.58 Effects of Tl-filling into the voids and Rh
substitution for Co on the thermoelectric properties of CoSb3
Heating-quenching-
annealing-hp
(Harnwunggmoung,
Kurosaki, Ohishi, Muta, &
Yamanaka, 2011)
Ba0.18 Ce0.05 Co4Sb12.02.
1.26 Enhanced thermoelectric performance of dual-element-filled
skutterudites BaxCeyCo4Sb12
Melting-quenching-annealing-
sps
(Bai et al., 2009)
Gd0.12Co4Sb12 0.52 Gadolinium filledCoSb3 : Highpressuresynthesis and
thermoelectricproperties
CP-2 stage HPS-SPS
(Jianqing Yang et al., 2013)
YbxInyCezCo4S
b12
1.43 High thermoelectric
performance of In,Yb,Cemultiple filled CoSb3 based skutterudite
compounds
Melting-
annealing-SPS
(Ballikaya,
Uzar, Yildirim, Salvador, &
Uher, 2012)
LaxFeCo3Sb12 0.32
Preparation and thermoelectric properties
of LaxFeCo3Sb12 skutterudites by
mechanical alloying and hot pressing
BM-HP (Bao, Yang, Peng, et al.,
2006)
InzCo4Sb12−yTe
y
0.55 Thermoelectric
properties of InzCo4Sb12−yTey
skutterudites
Encapsulated
quartz tube inductionmel
ting. RF 40kW, 40kHz for 1
h
(Jung et al.,
2007)
Univers
ity of
Mala
ya
28
Compound ZT Article name Process References
Fe3CoSb12
based skutterudite
CoSb3 = 0.19 LaFe3CoSb12 = 0.43
CeFe3CoSb12 = 0.62
La0.5Ce0.5Fe3
CoSb12 = 0.82
Thermoelectric properties of rare earths filled CoSb3 based
nanostructure skutterudite
Hydro/solvo thermal method and
HP
(Lu et al., 2010)
SmxCo4Sb12 Sm0.1Co4Sb12
ZT=0.55
Thermoelectric
properties of SmxCo4Sb12 prepared by
high pressure and high temperature
Agate
morter-spd machine
(Jiang et al.,
2010)
UyFexCo4-xSb12 ZT = 0.55
for U0.2FeCo3Sb
12
Thermoelectric
properties of uranium filled
skutterudites Uy(FexCo4-
x)Sb12
Arc melting-
annealing- SPS
(Arita et al.,
2005)
InxNdyCo4Sb12 0.11 Thermoelectricpropertie
sindouble-filledskutterudites
InxNdyCo4Sb12
Inductive
melting method
(Tang,
Zhang, Chen, Xu, & Wang,
2012) p-La0.7Ba0.01Ga0.1
Ti0.1Fe3Co1Sb12
n-Yb0.3Ca0.1Al0.1
Ga0.1In0.1Co3.75
Fe0.25Sb12
P type 0.75
N-type 1
Stability of Skutterudite Thermoelectric
Materials
Annealing-water
quenching – SPS
(Nie et al., 2014)
LaxFe4Sb12 0.41 Preparation and thermoelectric properties of La filled skutterudites
by mechanical alloying and
hot pressing
BM-HP (Bao, Yang, Zhu, et al., 2006)
FexCo4−xSb12 0.3 Thermoelectric
properties of Fe-doped CoSb3 prepared by
mechanical alloying and vacuum hot pressing
Attrition mill
and HP
(Ur, Kwon,
& Kim, 2007a)
YbxFeyCo4-
ySb12
0.6 Thermoelectric
properties of P-type Yb-filled skutterudite
YbxFeyCo4-ySb12
Heat
treatment-water
quenching-BM-HP
(Zhou,
Morelli, Zhou, Wang,
& Uher, 2011)
Univers
ity of
Mala
ya
29
2.1 Thermoelectric figure of merit
Thermoelectric figure of merit (ZT) is a measurement of the TE properties of materials
which reflects the TE efficiency. It is used to determine the efficiency of the TE materials.
The dimensionless figure of merit is proportional to the Seebeck coefficient squared, the
temperature, and the electrical conductivity and inversely proportional to the thermal
conductivity as shown in eq. no 1.1 Typical ranges in ZT are from zero, for poor TE
materials, to 1.5 or more for high performance TE materials. Some examples of thin film
TEs have been reported with ZT values reaching 2.5 or above (Venkatasubramanian,
Siivola, Colpitts, & O'quinn, 2001), but these for the most part rely on thin film effects
for their high efficiency thus limiting their general applicability to large-scale power
generation problems. ZT depends on several material characteristics and does not have
any theoretical upper limit, any ZT value above 1.5 for a bulk material is seen as a very
encouraging result. There are some well-known systematic behaviors and trade-offs that
affect the TE figures of merit of various materials. One important factor, although it does
not appear directly in the ZT formula, is carrier concentration; one can readily see why
TE research is concentrated in semiconductors instead of metal or insulators.
Univers
ity of
Mala
ya
30
Figure 2.1: Dimensionless figure of merit, ZT as a function of temperature for (a) n-type and (b) p-type TE materials (Snyder & Toberer, 2008).
Although TE properties were first put to use with metal systems forming the basis of
thermocouple operation, the high associated thermal conductivities make for poor TE
materials. The various terms in the figure of merit, as plotted against carrier concentration,
and therefore on an Insulator-Semiconductor-Metal axis, can be seen in Figure 2.1 (a) and
This relations shows the affects and relationship on the dimensionless figure of merit
(ZT) of the TE material. As mentioned in thermal conductivity part that the total thermal
conductivity is depends on two part. The carrier carries the electrons. A high quality TE
material must have a high electrical conductivity, low thermal conductivity and high
thermopower. So to reduce thermal conductivity and improve electrical conductivity
carrier concentration of TE material plays a vital role. The electrical conductivity formula
is
𝜎 = 𝑛𝑒µ (2.7)
The electrical conductivity (σ) is related to the carrier concentration n through the
carrier mobility µ.
Univers
ity of
Mala
ya
37
For metals or degenerate semiconductors (parabolic band, energy-independent
scattering approximation), the Seebeck coefficient is given by
𝛼 =8л2 𝐾𝐵
2
3𝑒ℎ2 𝑚 × 𝑇(л
3𝑛)2/3 (2.8)
where m is mass of the carrier, e is charge of an electron, h and KB represents planks’s
constant and KB=Boltzmann constant respectively and T represent temperature. The
effective mass of the charge carrier provides another conflict as large effective mass
leads to low electrical conductivity, while low effective mass decreases Seebeck
coefficient. High density-of-states effective mass is normally related to heavy carriers,
which will move with slower velocities, resulting in smaller mobility and thus lower
electrical conductivity. Basically high ZT is a trade-off between effective mass and
mobility and can be found within a wide range of effective masses and mobilities.
2.4 Skutterudite
2.4.1 Crystal structure of skutterudite
There are various types of material in thermoelectric genre. But one of the most
interesting, promising and yet to vastly discover is the Skutterudites. It has the basic
qualities for good thermoelectric materials with high ZT like large unit cell, heavy
constituent atom masses, low electronegativity differences between the constituent atoms
and large carrier mobility (W. Liu, Yan, Chen, & Ren, 2012). In addition there are two
“voids” per unit cell in the crystal structure of the skutterudite system. Univers
ity of
Mala
ya
38
Figure 2.7: Schematic of skutterudite structure with void.
This specific group of materials has cubic structure (cubic Im3 (Th5) structure) and can
be filled the void with “guest” atom (G. Chen et al., 2011). Introducing the guest atom in
the void it is possible to tune up the thermal conductivity (Nolas, Slack, Morelli, Tritt, &
Ehrlich, 1996). There are 9 binary semiconducting compounds in this group which can
be represents with the formula unit AB3 where A = Co, Rh and Ir are metal atoms. On the
other hand B = P, As and Sb are the pnicogen atom. There are eight formula units per
cubic cell and two of them are empty as shown in Figure 2.7. Skutterudites form covalent
structures with low coordination numbers for the constituent atoms and so can incorporate
atoms in the voids (G. Chen et al., 2011). When incorporated with “filler” atoms the
skutterudite is called “filled skutterudites” and can be expressed as the general formula
of MyA4B12 (Schnelle et al., 2008). Here M represents the filler atom. Filler atom can be
alkali, rare-earth, alkaline-earth, actinide metal or thallium. There are different degree of
filling y is possible and y can be realized upto y=1 (Schnelle et al., 2008). When filled
with a filler atom in the void of skutterudites; the atom starts to “rattle” and scatters the
phonons, thus reducing the phonon propagation (G. Chen et al., 2011). How large is the
void it can be measured by a formula. The radius r(B) of the B atom is taken to be one
half of the average B-B separation. The void radius is taken as the distance d from the
Univers
ity of
Mala
ya
39
center of the void to any of the twelve surrounding B atoms minus r(B) (G. Chen et al.,
2011).
𝑟(𝑣𝑖𝑜𝑑) = 𝑑 − 𝑟(𝐵) (2.9)
Skutterudite systems have attracted a great attention from TE community due to their
high Seebeck coefficient, excellent electrical transport properties and special lattice
structure as shown in Figure 2.1. However, thermal conductivity of skutterudites is
relatively high (>10 W/mK) which is contributed to the low ZT. Nanostructured
skutterudites have shown a potential application at the temperature range of 500 - 900 K
(Schnelle et al., 2008), (Wei, Zhang, & Zhang, 2014), (Zhao, Geng, & Teng, 2012), (K.
Yang et al., 2009), (K. Liu, Dong, & Jiuxing, 2006), (Long Zhang & Sakamoto, 2013)
Figure 2.8: Simulation of the unfilled CoSb3 skutterudite’s two model structures (a & b) Co atoms and Sb atoms are shown by red and blue sphere, respectively and the
blue ones are for showing the void cages (Sootsman, Chung, & Kanatzidis, 2009).
Figure 2.8 showing the simulated atom placement and void for CoSb3 skutterudite.
The blue spheres in the pictures can be filled or replaced by the other atoms. Which if
successfully done can be lead to the potential PGEC behavior based filled skutterudite
with high TE performance.
Univers
ity of
Mala
ya
40
2.4.2 Recent development of skutterudites
Nanostructured skutterudites can be designed in such a way that disconnects the
bonding between the electrical and thermal conductivity in order to increase the electrical
conductivity without or less effect on the thermal conductivity (Rubi, Gowthaman, &
Renganathan). This is one of the major breakthroughs for the PGEC material like
behavior. Ball milling (BM) is one of the popular ways to reducing the grain size for
nanostructuring. L.Zhang et al. (L Zhang et al., 2010), (L Zhang et al., 2009), G Rogl et
al. (Rogl, Grytsiv, Bauer, Rogl, & Zehetbauer, 2010) produced their EyFe4Sb12 and
EyFe3CoSb12 (where E= Ca, DD and Ba) skutterudites’s powder samples with the grain
size bellow 100-200 nm which was prepared by melting in quartz tubes, and following
by annealing, ball milling and hot pressing. These methods improves the figure of merit
ZT for their samples in different temperature range. There are actually several methods
and researchers are trying to improve the TE properties applying several methods in order
to enhance the figure of merit.
Arc melting, BM-SPS, SPS, Hot pressing are some of the popular synthesis methods
for skutterudite. The synthesis through these methods has advantages over the
conventional long time annealing/sintering methods. All of the stated methods have the
advantage of rapid heating thus reducing the time and energy consumption. Arc melting
uses arc current to melt the powders placed in the arc furnace in stoichiometric ratio. BM-
SPS method is one of the most popular methods due to its advantages of mechanical
alloying through ball milling and ability to reduce powders from micro to nano size. Then
spark plasma sintering uses rapid heating using DC current in the furnace applying
pressure at the same time. Hot pressing can also apply the pressure and heat at the same
time. However hot pressing does not use DC current to sinter, thus it is not as rapid as
SPS. Rapid heating helps to minimize the grain growth of the materials during the
sintering process. These processes also comes with the facility to synthesize materials in
Univers
ity of
Mala
ya
41
vacuum or noble gas environment. The implication and combination of these methods
gives enhanced results in thermoelectric performances.
For example (L. Zhang et al., 2009) sample’s prepared by BM was able to display a
ZT of 0.52 at 740K. Which was reported 20% increment than the previous approach. It
was stated that the reduced grain size helped to induce nano sized oxide composites
resulting to lower the lattice thermal conductivity which helps to improve the ZT. Other
nanostructured approaches also showing significant improvement of ZT for high
temperature applications. (GaSb)0.2-Yb0.26Co4Sb12, MCoSb3 (M=In,Ce) nanocomposite
is showing a ZT value of ~1.45 at 850 K (X. Wang et al., 2008) and ZT ~ 1.43 at 800 K
To make solid samples for sintering, as milled powders needs to be compacted and
solidified into a particular shape. This will provide a high pressure method to consolidate
the material into the desired crystal configuration. For this purpose a cold press was used.
The milled powders were compacted under room temperature using hardened SS steel die
at 375 MPa pressure for 5 min. The pellet size is 10 mm in diameter and thickness of 2
mm (approx.)
Figure 3.3: (a) Manual Cold press and (b) Hardened SS steel die.
3.4.2 Sintering using tube furnace
MILA-5000 from ULVAC was used to sinter the samples. In this case, the high heat
during the sintering is expected to consolidate the powder into the desired crystal
structure. It has infrared heating technique with precision temperature regulation. The
compacted samples were placed on a quartz tube holder and put inside the quartz tube
furnace. Then the samples were sintered under 5 Pa vacuum in 6200 C for 2 h. The heating
rate was used as 40 C per minute increment from room temperature to the set point.
Univers
ity of
Mala
ya
58
3.4.3 Spark Plasma Sintering
Spark Plasma sintering (SPS) was used to make more dense samples for this study.
SPS is a state of the art sintering technique. In the spark plasma sintering high pressure
and heat was applied to the BM powder samples at the same time. Ultimately,this is the
most desired process to consolidate the powder into a bulk crystal structure using high
pressure and high temperature. This process was able to form dense samples with less
grain growth. 36MPa pressure was used and the samples were sintered at 6200C for 10
min. The heating rate was fixed at 1000 C/min. Sample size was standard 10 mm diameter
with 2 mm thickness. The sintering process was done under argon atmosphere. A sintering
atmosphere of ~4 Pa vacuum was used in order to evacuate ambient air from the mold.
After SPS the samples were mechanically cut using a cutting machine into bar shaped
sizes for TE measurements. The fabricated samples shows high density compared to
vacuum sintered samples. Density measurement was conducted using Archimedes
method.
3.5 Characterizations
3.5.1 X-Ray Diffraction
X-Ray diffraction technique was used to determine the phase formation after ball
milling and sintering. It is widely used in phase identification of a crystalline material.
Besides, the lattice parameter information can also be determined by Jana 2006 software.
The x-ray generator used a copper source to produce X-rays with a characteristic
wavelength of 1.54060º A. The voltage and current we used for X-ray generation are 45
kV and 40 mA, respectively. An XRD scan 2Ɵ degree was performed in between 5 to
120 degree. Reitveld refinement and phase determination was performed with
commercial software (HighScorePlus version 3.0c, PANalytical B.V., Almelo, The
Netherlands).
Univers
ity of
Mala
ya
59
3.5.2 SEM analysis
The morphologies of powders and the fracture of bulk samples were observed by
scanning electron microscopy. Powder samples were spread on the conductive tape which
was placed on a sample holder head. Loose powder on the tape was removed by air
blower. After that the head was inserted into sample holder maintaining approximately
2mm gap between sample surface and the upper surface of the sample holder. Afterwards
the sample holder was placed in machine for imaging and EDS and turn on the electron
mode. Then adjusting focus, brightness and contrast, images were taken at various
magnifications. Imaging was done on 20kV and Image mode.
After taking SEM image, elemental analysis was done. Then, again adjustment of
focus, brightness and contrast were done. Several points in the selected area were
nominated for quantitative elemental analysis. Some element mapping area also selected
for quantitative elemental analysis. The system automatically runs the quantitative
analysis at every selected points and mapping area according to the selection sequence.
3.5.3 Thermoelectric properties analysis
To analyze the thermoelectric properties, Seebeck coefficient, thermal conductivity
and electrical conductivity was measured. ZEM 1 was used to measure the Seebeck and
the electrical conductivity. Laser flash was used for the thermal conductivity analys is.
Electrical conductivity is not measured directly by the ZEM 1, actually the
measurement of the electrical resistivity of the thermolelectric materials as a function of
temperature was performed using the ZEM 1 instrument. Electrical resistivity is
reciprocal of electrical conductivity.
Univers
ity of
Mala
ya
60
The Seebeck coefficient is known as the thermopower (S) of a material. It states that
the amount of potential induced by thermoelectric voltage regarding to the temperature
gradient across the sample. Seebeck measurement also carried by the ZEM 1 instrument.
Thermal conductivity was measured by using laser flash method. The laser flash
method can determine the thermal conductivity of a sample from its thermal diffusivity,
density and specific heat. The density of the samples was measured by the Archimedes
method.
Univers
ity of
Mala
ya
61
CHAPTER 4: RESULTS AND DISCUSSION
The goal of this chapter is to present the characterization results of the skutterudite
materials and prior to achieve the final results what are the procedures and process
parameters were used to achieve the final goal. Followed by the Jana 2006 software
results to show the occupancy of the void of the resultant skutterudites. In this study
SPSed samples of Bi0.6FeCo3Sb12 has the TE characterization due to the successful
fabrication of skutterudite phases. The characterization samples would be discussed
individually in terms of their microstructural and thermoelectric properties along with the
other formulations, process parameter, ball milling time optimizations and Jana 2006
software results.
4.1 Ball milling optimization to prepare binary skutterudite
Milling time optimization is a trial and error based experiment. To get the optimum
results a series of trial and error based ball milling process was conducted to achieve
skutterudite phase and homogenous particle distribution. Because each material has
different properties and depend on those properties the BM time changes. Figure 4.1
shows the XRD pattern of comparison among the BM hours for the formation of binary
FeSb3 skutterudite. Longer ball milling hours was studied to achieve FeSb3 skutterudite
phase through mechanical alloying. It is evident that the longer BM hours was not suitable
for the binary skutterudite formation using BM. Longer BM was unable to form the
desired FeSb3 phases. Instead only the Sb peak and of secondary FeSb2 phase were present
as the impurity phase. FeSb3 skutterudite phase formation was not present even after
running 55h BM. A series of trials to figure out the optimum BM time for unfilled
skutterudite was studied and the results was not successful.
Univers
ity of
Mala
ya
62
Figure 4.1: Comparison among the BM hours to study different BM duration to form binary FeSb3 skutterudite
4.2 Process control agent subtraction
After many unsuccessful attempts of synthesize the binary skutterudite through BM,
process control agent (PCA) was introduced for the formation of the skutterudite phase.
PCA have been added to powders in order to retain the equilibrium state between welding
and fracturing processes. Due to the fact well known that during ball milling process of
processing powders- the repetitive cold welding, fracturing and re-welding process has
high possibility to get imbalanced. The scope of process control agent was studied to see
the effect on the skutterudite phase formation with the BM time. Ethanol 0.1 wt% was
used as process control agent. At first it was studied only with the FeSb3 as shown in
figure 4.2. But there was no evidence of the phase formation for the binary FeSb3
skutterudite. Which later influenced to introduce fillers in the skutterudite structure.
Univers
ity of
Mala
ya
63
Figure 4.2: 35h BM Fe4Sb12 powder with 0.1 wt% ethanol as process control agent.
Bismuth as filler was introduced. The Moller ratio of ethanol was kept same as process
control agent. In Figure 4.3 we can observe the XRD pattern which indicates even after
the introduction of the filler in the formulation no significant changes occurred. Only
reduction of FeSb2 peaks was observed.
Figure 4.3: 35 h BM Bi0.6Fe4Sb12 powder XRD with 0.1 wt% ethanol.
Univers
ity of
Mala
ya
64
The results were unsatisfactory compared to the sample without the process control
agent. XRD pattern in the figure 4.4 shows the peak shift to the right in comparison with
the powder sample prepared by BM without ethanol (orange color). Antimony peak is
reduced and the increase of FeSb2 peaks is visible. This right shift actually indicates that
the bismuth are being mechanically alloyed which might help to create skutterudite phase
formation after heat treatment.
Figure 4.4: Comparison between Bi0.6Fe4Sb12 formulation with and without ethanol
as a process control agent.
The process control agent actually slows down the mechanical alloying inside the BM
jar, which actually an obstacle in the formation of the skutterudite phase. Therefore
discarding of the process control agent during the BM process is suggested.
4.3 Effect of the reduced ball milling time with filler and dopant
After a series of trials, different fillers were also studied along with Bi. Lanthanum
(La) was used as filler in the as a formulation of La. In this study, the ball to powder ratio
was also studied and 15:1 ball to powder ratio was chosen as the ideal one due to the fact
that it helped to increase the skutterudite phase. In figure 4.5 shows the comparison
among BM time with La as filler and also the effect between 10:1 and 15:1 ball to powder
ratio. We were able to produce some skutterudite peaks by BM after removing process
Univers
ity of
Mala
ya
65
control agent and introducing fillers in the skutterudite formulation. As shown in the
figure 4.5 it has shown more skutterudite peaks for 35 h BM time and with the 15:1 ball
to powder ratio.
Figure 4.5: Comparison among BM La1.5Fe4Sb12 samples with different preparations
of ball to powder ratio and BM hours.
Effect of copper (Cu) and Bismuth (Bi) as a filler in the formation of skutterudite phase
was also studied after the introduction of La. Cobalt (Co) was also introduced to substitute
Fe in the skutterudite cage. Whilst the introduction of Copper (Cu) and Bismuth (Bi) as
fillers with the Co substitution on Fe site has shown different results which helped to
further reducing the BM timing and Co substitution level. XRD pattern in figure 4.6 is
showing Cu as filler with Co substitution on the Fe site with 10 h BM time.
Univers
ity of
Mala
ya
66
Figure 4.6: 10 h BM Cu0.6Fe3CoSb12 powder sample’s XRD.
Although the XRD pattern shows the successful formation of some skutterudite phase,
still the Sb peak is much higher for the 10 h BM time. No phase shift was observed which
indicates Cu as filler might not be the potential one as filler as its mass is small to take
place in the skutterudite cage structure. Which is supposed to eventually lead to deform
the lattice parameter. Furthermore, no phase shift in the XRD spectra is a clear indication
that Cu is not acting as a filler atom. Also the skutterudite phase formation was
significantly less in this duration of BM. Besides the substitution level of Co also appears
to be not enough. As a result the BM duration was increased with substation level of Co
on the Fe site was increased. XRD results of the comparison between the Co substitution,
BM time increased and heavier filler is shown in the figure 4.7. The Sb peak intensity is
decreased and the formation of the skutterudite phase was increased and after La1.5Fe4Sb12
formulation for 35h BM time the Bi0.6FeCo3Sb12 formulation exhibits potential
skutterudite phase formation with less BM time.
Univers
ity of
Mala
ya
67
Figure 4.7: Comparison between the BM time and Co substitution. 20 h BMed XRD
pattern has more skutterudite phase than the 10 h BM powders. For 20 h the formulation was used Bi0.6FeCo3Sb12 where in 10 h Co0.6Fe3Co1Sb12 was used.
From figure 4.7 it was observed that the increase of Co helps to form more skutterudite
phase. Skutterudite formulation of Bi0.6FeCo3Sb12 for 20 h and 25 h BM time with Bi as
a filler was studied to see the BM time optimization. The filling fraction level of Bi was
kept 0.6. From the figure 4.8 the XRD pattern reveals 20 h BM time producing more
skutterudite phases than the 25 h BM time. Therefore 20 h BM time was chosen for the
sintering using MILA-5000 furnace.
Figure 4.8: Comparison between the 20 and 25 h BM time of Bi0.6FeCo3Sb12
skutterudite.
Univers
ity of
Mala
ya
68
4.4 Sintering effect on the filled skutterudite system
Observing all the BM times’ 20 h powder sample of the formulation Bi0.6Fe1Co3Sb12
was chosen for sintering. Slow heating rate (40C per minute) was introduced to give the
sample more time for the reaction. MILA-5000 furnace was used for sintering. Figure 4.9
showing the comparison with the BM results of 20 h and 25 h samples with sintered
sample. Using the binary phase diagram 6200C temperature was selected for sintering.
Figure 4.9: Comparison among 25 h (green line at the bottom) and 20 h (blue line in
the middle) BM samples with sintered sample after 20 h (black line at the top) BM.
After the sintering for 2h at 6200C the desired single phase skutterudite was obtained.
From the XRD pattern in figure 4.9 it is evident that 20 h BM sample contained more
skutterudite phase than the 25h sample. Thus it was chosen for sintering. It was sintered
under vacuum atmosphere to prevent oxidization and impurities. Although there was a
report of formation of the binary skutterudite phase by mechanical alloying (Junyou Yang
et al., 2004). However, without the heat treatment of the sample it is very difficult to form
the quaternary skutterudite phase let alone the single phase. After studying all the milling
times presented, it was evident that shorter ball milling time is ideal to produce single
phase skutterudite. Along with the substitution and filler in the skutterudite. Furthermore,
the ball milling time optimization was studied. For this study 10 h, 15 h and 20 h ball
Univers
ity of
Mala
ya
69
milling duration was chosen. The vacuum sintered samples showed less density (less than
90 %) which were determined by Archimedes method. Less dense samples are not ideal
for TE property measurement so spark plasma sintering (SPS) was chosen to produce the
denser samples due to the fact it is widely used for making dense samples.
4.5 Spark plasma sintering for denser skutterudite and Jana 2006 analysis with
reitveld refinement
It is shown that the preparation of single phase skutterudite SPS was useful to produce
dense samples for good thermoelectric properties. SPS process helps less grain growth
during the heat treatment due to its fast heating rate. The result after SPS was more dense
samples. The samples are more than 93% dense (highest density was 97% for 15 h BMed
sample) with SPS compared with the vacuum sintered ones with around 85% density.
Furthermore, single phase skutterudite samples were successfully prepared. The XRD
spectra of the bulk Bi0.6FeCo3Sb12 skutterudite for different milling time is shown in
Figure. 4.10. A bulk skutterudite was formed for 10 h 15 h and 20 h spark plasma sintered
samples. It has been found that the predominant phase of the skutterudite CoSb3 (space
group Im-3) were present for all the samples. A small peak of Bi is present in both of the
10 h and 15 h ball milled samples.
Univers
ity of
Mala
ya
70
Figure 4.10: X-Ray diffraction pattern of the as SPS Bi0.6FeCo3Sb12 for 10 h, 15 and 20 h ball milling duration.
Rietveld refinement analysis was carried out using Jana 2006 software to identify the
crystal structure at room temperature. This method used for structural analysis of nearly
all classes of XRD technique. The software refines various parameters including peaks’
width and shape, lattice parameters, preferred orientation to derive a calculative
diffraction pattern. The lattice parameter generated from the software is listed in Table
4.1.
Table 4.1: Lattice parameter of the Bi0.6FeCo3Sb12 skutterudite for different milling duration. Their actual compositions after sps and Fe occupancy.
Ball Milling
Duration
Nominal
composition
Compositions calculated
by Jana 2006
Fe Occ. Lattice parameter (Å)
10 h Bi0.6FeCo3Sb12 Bi0.28Fe0.96Co3.02Sb12.02 28.2% 9.0499 (2)
15 h Bi0.6FeCo3Sb12 Bi0.46Fe0.99Co2.99Sb12 27.1% 9.0489 (2)
20 h Bi0.6FeCo3Sb12 Bi0.44Fe0.94Co3.14Sb12 27.1% 9.0499 (1)
The crystal lattice of Bi0.6FeCo3Sb12 has been expanded for all the three ball milled
samples compared with the unfilled Co4Sb12 samples with the lattice parameter of 9.035
Å. This indicates that the Bi addition has filled the void of the Co4Sb12. In Figure 4.11 it
Univers
ity of
Mala
ya
71
has been showed the crystal structure, distribution of the atoms in the lattice and their
occupancy retrieved by Jana 2006.
Figure 4.11: Crystal structure of the 10 h, 15 h and 20 h MA-SPS samples retrieved from Jana 2006.
It can be seen that the Bi dopant was successful in partially filling the voids of the
skutterudite, which served as a thermal ‘rattler’ and hence reduced the overall thermal
conductivity of the bulk skutterudite.
On the other hand, Fe dopant was able to partially substitute the Co sites in the
skutterudite lattice, and hence the electrical conductivity was increased. This is attributed
to the increased delocalization of the valence electrons of Fe compared to Co, due to the
large atomic radius of Fe compared to Co, which are 156 pm and 1.25 Å , respectively.
And also due to the valence state (Co and Fe: +2, and+3) and electron affinity (Fe = 15.7
kJ/mol and Co = 63.7 kJ/mol). These result agreed by a report carried out by Said et al
(Said et al., 2017).
Univers
ity of
Mala
ya
72
It can be also deduced from the Rietveld Analysis of all three formulations for different
milling times, the actual composition of the skutterudite indicates that the Fe substitution
is approximately constant, indicating that regardless of the milling time, a consistent
substitution of Fe has occurred. On the other hand, for the 10 h milling time, the actual
composition indicates that there is a lower filling ratio of Bi compared to the 15 h and 20
h milling times. This can be explained by the larger particle size of the 10 h milled
samples, when then tend to be rejected by the skutterudite lattice during the SPS process.
This is also supported by the observation of the formation of Bi secondary phase which
are more prevalent in the 10 h sample. Details of the microstructure will be elaborated in
the following section.
4.6 Field Emission Scanning Electron Microscopy (FESEM) and Scanning
Electron Microscopy (SEM) with particle size analysis
The microstructure images of the powder samples were captured by FESEM and
SPSed samples were captured by SEM. At first Bi0.6FeCo3Sb12 sample’s 10 h, 15 h and
20 h milling time samples were BM and then the powder pattern was studied with XRD
and microstructure was observed with FESEM. Samples sintered with SPS was also
studied with SEM and EDS for microstructure analysis and chemical mapping. Figure
4.12 showing the powder images which indicates the particle sizes after 10 h, 15 h and
20 h after ball milling. In the figure 4.12 10 h (a) and 20 h (c) samples shows they have
different particle sizes which is observable with plain eyes. From very tiny particle size
to bigger particle size distribution is observed for these two samples. Among the three
samples 4.12 15 h (b) BM samples has the most even particle size distribution comparing
to the 10 h and 20 h as milled powder samples. Which leads to the hypothesis, that
although 20 h samples was chosen at the first for the vacuum sintering from the XRD
pattern. But 15 h sample might be the potential one to optimize the factor of BM time.
After these ball milling SPS was conducted for these powder samples. Followed by XRD,
Univers
ity of
Mala
ya
73
SEM and TE property analysis. For the 10 h sample the in the figure 4.17 (a), SEM image
showing conglomerated particles which was later found as Fe in the figure 4.17 (d) when
chemical mapping was done. In the images (a) and (d) of figure 4.17 the conglomerated
Fe is visible. 15 h BM and SPSed sample is showing a balanced distribution in the
mapping which is shown in the figure 4.18. Bi (b), Co (c), Fe (d) and Sb (e) distribution
in the figure 4.18 shows well distributed chemicals all over the sample. But the figure
4.19 image and mapping showing uneven distribution of chemicals and large pores are
visible on the 20 h SPS sample. Comparing these microstructured images 15 h sample is
the potential among these three SPSed samples for BM time optimization. The particle
sizes of the SPSed samples were studied by particle size analyzer (Analysette 22 Nano
Tec Plus by FRITSCH). Figure 4.12 which depict (a) ball milled particles at 10 h, (b) ball
milled particles at 15 h, (c), and ball milled particles at 20 h, which are respectively
magnified images at 20000 x magnification. Comparing the FESEM images it is
observable that 15 h ball milling time has a more homogenous distribution compared to
the 10 h and 20 h samples. By visual inspection, the particles for 10 h appear to be the
largest, with the particles for 15 h being the smallest. In comparison, the particles for 20
h comprise of small particles (comparable in dimension to 15 h), but at the same time also
demonstrate agglomeration into much larger particles in some clusters. More
investigation was conducted on the particle sizes of these three BMed samples. Lower
magnification for the microstructure was also observed to narrow down the possibility of
the best particle size distribution followed by particle size analyzer. Figure 4.13 shows
the 10000 x magnification of the 10 h, 15 h and 20 h BMed samples and through this we
confirm that the 20 h sample shows a higher degree of agglomeration compared to the 10
h and 15 h sample.
Univers
ity of
Mala
ya
74
Figure 4.12: 10 h (a), 15 h (b) and 20 h (c) as-milled powder samples’ FESEM images with 20000 x magnification.
Hence, we expect subsequent standard deviation of particle size of 20 h to be the
largest amongst the sample, which should be reflected in the particle size analysis in Table
4.2. Besides FESEM images indicated that the 15 h mechanically alloyed sample
provided the best grain size reduction, as supported by particle size analyzer results Univers
ity of
Mala
ya
75
displayed in the Table 4.2 bellow.
Figure 4.13: As milled powders’ FESEM images with 10000 x magnification. (a), (b) and (c) represents 10 h, 15 h and 20 h ball milling samples respectively.
Table 4.2 Particle size via Particle size analyzer.
Ball milling duration Particle size (µm)
10 h 16.2
15 h 9.7
20 h 11.2
The particle size in the table 4.2 provides information regarding average and standard
deviation of particle size. Based on the raw data from the particle analyzer as shown
below, the 20 h sample has the highest standard deviation as predicted above. We observe
Univers
ity of
Mala
ya
76
the reduction of grain size from 10 h to 15 h then again increase in grain size. This
phenomenon is due to the heat and energy generates for the longer ball milling hours.
Figure 4.14: Particle size analyzer result for 10 h as milled Bi0.6FeCo3Sb12 powder.
Univers
ity of
Mala
ya
77
Figure 4.15: Particle size analyzer result for 15 h as milled Bi0.6FeCo3Sb12 powder.
Figure 4.16: Particle size analyzer result for 20 h as milled Bi0.6FeCo3Sb12 powder.
Univers
ity of
Mala
ya
78
However, the distribution of particle size described so far does not correlate directly
to the XRD pattern, as broadening of the XRD peak due to particle size is generally
observed for particles in the range of 200nm, and is especially pronounced for particles
<50nm. Therefore, it can leads to the conclusion of the following observations of the
broader XRD patterns for the ball milled powder in Figure 4.16:
(1) The XRD patterns in Figure 4.16 show a more amorphous character compared to
the XRD peaks of the SPSed samples shown in Figure 4.13, as they are not sintered, and
are therefore broader.
(2) Broadening of the XRD peaks is caused by crystal lattice distortion (micro-strain)
due to dislocations, which may be true for the ball milled samples which have been
subjected to high mechanical stress.
Univers
ity of
Mala
ya
79
Figure 4.17: SEM images of Bi0.6FeCo3Sb12 skutterudite after 10 h BM and SPS, (a) micrograph of an SPS-compacted sample, an elemental mapping of (b), (c), (d) and (e)
show Bi, Co, Fe and Sb by EDS.
Fe
Univers
ity of
Mala
ya
80
Figure 4.18: SEM images of Bi0.6FeCo3Sb12 skutterudite after 15 h BM and SPS, (a) micrograph of an SPS-compacted sample, an elemental mapping of (b), (c), (d) and (e)
show Bi, Co, Fe and Sb by EDS.
Univers
ity of
Mala
ya
81
Figure 4.19: SEM images of Bi0.6FeCo3Sb12 skutterudite after 20 h BM and SPS, (a)
micrograph of an SPS-compacted sample, an elemental mapping of (b), (c), (d) and (e) show Bi, Co, Fe and Sb by EDS.
Pores
Univers
ity of
Mala
ya
82
4.7 TE Property Investigation
At first as-milled BixFeCo3Sb12 skutterudite (x=0.6) powder with different ball milling
condition was sintered using SPS at 6200C for 10 min under 50MPa. Due to melting of
Bi in that condition the sintering condition was changed to 36 MPa for 10 min. In both
case single phase skutterudite was able to form but the melting of Bi is less for the later
one.
4.7.1 Seebeck coefficient
Figure 4.20 depicts the temperature dependences of Seebeck coefficient for
Bi0.6FeCo3Sb12 skutterudites for different milling conditions from 373 K to 673 K.
Figure 4.20: Temperature dependence of the Seebeck coefficient of Bi0.6FeCo3Sb12 skutterudite for 10 h, 15 h and 20 h ball milling time.
All the samples have positive Seebeck coefficient indicating p-type conduction of
these samples. According to the formula of thermoelectric figure of merit Seebeck
coefficient is directly related to electrical conductivity and thermal conductivity. Seebeck
coefficient tends to decrease when electrical conductivity increases, usually due to the
Univers
ity of
Mala
ya
83
increase in carrier concentration upon doping. This behavior is observed in the figure 4.21
with comparison of the electrical conductivity in respect of the temperature. The seebeck
coefficient increases gradually with temperature increment for every samples. Bismuth
itself is an electron acceptor and therefore has the effect of producing a positive Seebeck
coefficient for the Bi doped FeCo3Sb12 sample. In the 20 h BM sample, there are no Bi
impurities, which result in a thermoelectric material which relies on holes as the dominant
charge conductor. However, in the 10 h and 15 h samples, XRD suggest that Bi impurities
exist. Bi itself has a negative Seebeck coefficient (-72 µV/K), which when they coexist
in the bulk skutterudite result in a reduced Seebeck coefficients for the 10 h and 15 h
sample.
4.7.2 Electrical conductivity
The electrical conductivity of Bi0.6FeCo3Sb12 measured by ZEM-1 is shown in Figure
4.21, for all three samples with varying ball milling time.
Figure 4.21: Temperature dependence of the electrical conductivities of
Bi0.6FeCo3Sb12 skutterudite for 10 h, 15 h and 20 h ball milling time.
Univers
ity of
Mala
ya
84
The highest electrical conductivity was demonstrated by the 15 h milling sample, this
is most probably due to the highly homogenous nature and small grain size of the resulting
skutterudite. The 20 h milled samples showed the lowest electrical conductivity, due to
the highly inhomogeneous nature of the sample, and its highly porous texture. The
electrical conductivity of the samples are very high. The highest electrical conductivity
was observed at 373 K of 122x103 Ω-1m-1 for 15 h MA-ed sample. The 15 h milled
powders has given electrical conductivity of 122x103 Ω-1m-1 in comparison to the 400 Ω-
1m-1 Fe doped CoSb3 skutterudite reported by Ur et al (Ur, Kwon, & Kim, 2007b).
Tentatively, Bi doping shows improvement of the electrical conductivity over the original
ternary skutterudite, FeCoSb3. This is probably due to the fact that the Bi atom acts as an
acceptor and improves the charge conduction due to holes. All the three samples given
high density bulks. 10 h, 15 h and 20 h hour ball milled samples have 98%, 97% and 93%
densities respectively. Even at the lowest value of electrical conduction property- all the
3 samples exhibits higher electrical conductivity compared to Bi added skutterudite
reported by Mallik et al. ~ 34000 Ω-1m-1 (Mallik et al., 2013). In this case, we expect that
the dominant contribution to the electrical conductivity comes from the substitution of Fe
into the CoSb3 lattice. Since the occupancy of Fe in the resulting skutterudite is fairly
constant, as indicated in Table 2, the electrical conductivity as a function of Fe is also
constant, which implies that the variation in electrical conductivity for the three samples
studied is largely due to the grain size in the bulk material. Therefore, the 15 h milled
sample which has the smallest grain size has produced the sample with highest electrical
conductivity.
Univers
ity of
Mala
ya
85
4.7.3 Thermal conductivity
The reason of Fe substitution to binary CoSb3 is to reduce thermal conductivity, get
single phase skutterudite, and prevent phase decomposition and Sb evaporation (Ur et al.,
2007b). Fe substitution reduced thermal conductivity and Bi addition is to improve ZT.
From the Figure 4.22 showing the total thermal conductivity of the samples it has shown
that 20 h samples has the lowest thermal conductivity and 10 h has the highest.
Figure 4.22: Temperature dependence of the total thermal conductivity of
Bi0.6FeCo3Sb12 skutterudite for 10 h, 15 h and 20 h ball milling time.
From the SEM image in Figure 8(a) it can be observed that this 20 h sample is porous.
The low thermal conductivity of the 20 h has the lowest thermal conductivity due to the
porous nature of the sample.
In comparison, the 10 h has the highest thermal conductivity due to the agglomerated
Fe which causes heat to dissipate easier in these domains. Comparison of the thermal
conductivity with the binary CoSb3, it is confirmed that the Bi addition and Fe substitution
lowered the thermal conductivity. The total thermal conductivity is the sum of both lattice
Univers
ity of
Mala
ya
86
and charge carriers contribution of heat. Because both phonons and electrons are carriers
of heat in the solid samples. Total thermal conductivity can be represented by this formula
𝐾𝑇𝑜𝑡𝑎𝑙 = 𝐾𝑒 + 𝐾𝐿 (4.1)
By Wiedemann-Franz law carrier contribution can be calculated
𝐾𝑒 = 𝐿0𝜎𝑇 (4.2)
Where σ is the electrical conductivity and L0 is the Lorenz number = 2.45 x 10⁻⁸ V2K-
2. KL was calculated by subtracting Ke from the total thermal conductivity. The plots for
total thermal conductivity, electron thermal conductivity and lattice thermal conductivity
are shown in Figure 4.22, Figure 4.23 (a) and (b) respectively. In the 15 h sample the
lattice thermal conductivity does not vary largely. For all the samples electronic
contribution Ke displayed at Figure 4.23 (a) increases with the increment of the
temperature. In Figure 4.23 (b) the lattice contribution KL into the total thermal
conductivity very close in magnitude to the total thermal conductivity graph. Thus, the
main contributing factor to the overall thermal conductivity is the lattice thermal
conductivity. In this case, Bi addition plays the primary role, as a filler in the skutterudite
void, which serves to attenuate the thermal conductivity. This can be supported by the
comparison between the 10 h sample and 15 h sample, which contains 28% and 46% Bi,
respectively, as obtained by Rietveld analysis. Univers
ity of
Mala
ya
87
Figure 4.23: (a) Temperature dependence of electronic thermal conductivity and (b) Lattice thermal conductivity of 10 h, 15 h and 20 h ball milled Bi0.6FeCo3Sb12
skutterudite samples.
The 15 h sample possesses the lower thermal conductivity due to the higher proportion
of Bi filler. The role of the Bi filler to reduce thermal conductivity of the skutterudite
samples in comparison with the binary CoSb3, has also been proven by Ur et al (Ur et
al., 2007b), who demonstrated that Fe substitution CoSb3 has distinctively lowered
thermal conductivity compared to binary CoSb3, and Mallik et al (Mallik et al., 2013)
have shown that the addition of Bi has resulted to reduce the thermal conductivity
compared to binary CoSb3.
Univers
ity of
Mala
ya
88
4.7.4 Figure of Merit ZT
ZT is calculated in terms of electrical resistivity, Seebeck and thermal conductivity.
The results of 10 h, 15 h and 20 h ball milled samples are shown in Figure 4.24.
Figure 4.24: Temperature dependence of the dimensionless Figure of merit ZT for
10 h 15 h and 20 h ball milled Bi0.6FeCo3Sb12 skutterudite samples.
Also a comparison table (Table No. 4.3) of individual results of thermoelectric
properties of binary and ternary skutterudite is presented for comparative analysis.
Table 4.3: Comparison among the 10 h, 15 h and 20 h ball milled and SPS samples with binary, Fe doped ternary and Bi added Co4Sb12 skutterudite at 600 K.
Thermoelectric properties 10 h 15 h 20 h FeCo4Sb4
(Ur et al.,
2007b)
BixCo4Sb12
(x=0.5)
(Mallik et
al., 2013)
CoSb3
(Ur et al.,
2007b)
Electrical Conductivi ty (S.m-1) ~97000
~100001
~64000 ~40000 ~27500
~18200
Seebeck Coefficient (µV/K) ~97
~102
~121
~105 ~190 ~200
Thermal conductivity
(W/mK)
~4.87 ~3.95 ~3.73 ~4.9
~1.65
~5
ZT(Max) 0.18 0.17 0.11 0.12
0.51 0.08
Univers
ity of
Mala
ya
89
From the above analysis, we first consider the individual contributions of the electrical
conductivity, Seebeck coefficient and thermal conductivity in comparison to related
binary and ternary skutterudite formulations gathered from the Table 1.1 and in
comparison with Mallik et al. (Mallik et al., 2013) . It can be seen that the maximum
electrical conductivity of the quaternary formulation Bi0.6FeCoSb12 (at 673 K) is 2.74
times higher than the Bi0.5Co4Sb12 (at 750 K) formulation reported by Malik et al (Mallik
et al., 2013) which has the maximum electrical conductivity in terms of magnitude
comparing with the other reported formulations by Mallik and co-authors. For the
Seebeck coefficient, quaternary mixture is slightly lower than or almost similar to the
values of the different filling level of Bi reported by Malik et al (Mallik et al., 2013),
whilst the thermal conductivity of the quaternary mixture is comparable to BixCo4Sb12
formulations. In addition, the 20 h sample demonstrated some porosity which further
reduced the thermal conductivity, thus illustrating a further pathway of MA processing
which may improve the ZT through introduction of porosity. However, since ZT= S2T/σK
it can be seen that the S2 term dominates the ZT, the overall quaternary formulation ends
up being lower ZT due to the fact Seebeck is low. But in comparison with the ternary
FeCo3Sb12 (Ur et al., 2007b) and BixCo4Sb12 formulations (except x = 0.5) (Mallik et al.,
2013) the ZT of Bi0.6FeCo3Sb12 is 0.18 at 673 K for 10 h and 0.17 at 673 K for 15 h ball
milling time. These are higher than the compared ternary skutterudite systems. This work
is still, useful in identifying the electronic contributions of the Bi dopant to the Fe, Co Sb
mixture to improve the electrical conductivity, and also the identification of the optimal
MA alloying parameters that will produce a homogenous microstructure needed for good
TE performance. In particular, we can see that the milling time has an impact on the
particle size, and hence the extent of Bi filling into the skutterudite lattice during the SPS
process, as demonstrated by a lower proportion of Bi filling for low milling times (10 h).
Thus, the milling time does not only affect the physical dimensions of the skutterudite
Univers
ity of
Mala
ya
90
morphology, but is also able to influence the actual composition of the resulting
skutterudite. The 10 h sample shows the highest ZT = 0.18 amongst these three samples,
whilst the 15 h sample (ZT=0.17) comes with a magnitude of ZT which is close to 10 h
sample, implying that the agglomeration that resulted in the 20 h sample (ZT=0.11) is
detrimental to thermoelectric performance.
Univers
ity of
Mala
ya
91
CHAPTER 5: CONCLUSION
5.1 Conclusion
The study of Bi filling with FeCo3Sb12 is a new composition in the search of high ZT
thermoelectric materials. To date, no one has reported this composition with Bi filling.
The study of a new formulation, Bi0.6FeCo3Sb12 was proposed to achieve simultaneous
filling of Bi in the Co4Sb12 skutterudite, with substitution of Fe in Co sites. This strategy
succeeded in simultaneously increasing the electrical conductivity and decreasing the
thermal conductivity, and is thus a useful strategy for future design of skutterudite
materials for thermoelectrics. Our analysis of the effect of the ball milling conditions on
the thermoelectric performance of this formulations also gives insight to the optimal
conditions which may yield a good microstructure, and hence good thermoelectric
performance. It has been shown that moderate milling times will provide a well
distributed sample which is conducive for good electrical conductivity and low thermal
conductivity. We have also demonstrated that milling time is able to affect the final
composition of the skutterudite in terms of the amount of Bi filling, despite using the
same nominal composition for all three samples. For this work we have successfully
achieved our objectives. To be specific Synthesis of Bi0.6FeCo3Sb12 skutterudites for high
efficiency thermoelectric properties has been successfully achieved. The effect of ball
milling parameter was studied and for Bi0.6FeCo3Sb12 quaternary single phase
skuttterudite formulation. For ball milling study, 15 h ball milling time was optimized
and proposed. The particle size on thermoelectric properties of Bi0.6FeCo3Sb12 was
studied. Benefits of homogenous particle distribution has shown and also the effect of
conglomerated particles has been discussed. Lastly, filling level of Bi on the FeCo3Sb12
skutterudite for different milling duration has been studied. This work is useful in
providing a direct correlation between BM process parameters and the resulting
Univers
ity of
Mala
ya
92
microstructure and thermoelectric characteristics, thus providing a design pathway to
improve thermoelectric parameters of skutterudites as a function of BM parameters.
5.2 Future Work
Future work for this formulation is to further study to improve the thermoelectric
properties for this formulation. On the other hand more comparison with the filling level
of Bi need to be studied. Here, following points are suggested for future work.
Study filling level for the formulation BixFeCo3Sb12 (x = 0.2, 0.4, 0.8) to further
compare and optimize the filling level of Bi.
Investigate with another filler with this BixYbFeCo3Sb12 formulation.
Supposedly Indium (Y= In) to increase the overall ZT and study the effect of
another filler on the microstructure and overall thermoelectric performance.
Univers
ity of
Mala
ya
93
REFERENCES
Alam, H., & Ramakrishna, S. (2013). A review on the enhancement of figure of merit from bulk to nano-thermoelectric materials. Nano Energy, 2(2), 190-212.
Arita, Y., Ogawa, T., Kobayashi, H., Iwasaki, K., Matsui, T., & Nagasaki, T. (2005). Thermoelectric properties of uranium filled skutterudites Uy (FexCo4− x) Sb12. Journal of nuclear materials, 344(1-3), 79-83.
Bai, S., Pei, Y., Chen, L., Zhang, W., Zhao, X., & Yang, J. (2009). Enhanced
thermoelectric performance of dual-element-filled skutterudites BaxCeyCo4Sb12. Acta Materialia, 57(11), 3135-3139.
Ballikaya, S., Uzar, N., Yildirim, S., Salvador, J. R., & Uher, C. (2012). High
thermoelectric performance of In, Yb, Ce multiple filled CoSb3 based skutterudite compounds. Journal of solid state chemistry, 193, 31-35.
Bao, S., Yang, J., Peng, J., Zhu, W., Fan, X. a., & Song, X. (2006). Preparation and
thermoelectric properties of LaxFeCo3Sb12 skutterudites by mechanical alloying and hot pressing. Journal of Alloys and Compounds, 421(1-2), 105-108.
Bao, S., Yang, J., Zhu, W., Fan, X. a., Duan, X., & Peng, J. (2006). Preparation and thermoelectric properties of La filled skutterudites by mechanical alloying and hot
pressing. Materials Letters, 60(16), 2029-2032.
Benjamin, J., & Volin, T. (1974). The mechanism of mechanical alloying. Metallurgical transactions, 5(8), 1929-1934.
Benjamin, J. S. (1970). Dispersion strengthened superalloys by mechanical alloying.
Metallurgical transactions, 1(10), 2943-2951.
Bux, S. K., Fleurial, J.-P., & Kaner, R. B. (2010). Nanostructured materials for thermoelectric applications. Chemical Communications, 46(44), 8311-8324.
Chen, D., Ni, S., & Chen, Z. (2007). Synthesis of Fe3O4 nanoparticles by wet milling
iron powder in a planetary ball mill. China Particuology, 5(5), 357-358. doi: http://dx.doi.org/10.1016/j.cpart.2007.05.005
Chen, G., Kraemer, D., Muto, A., McEnaney, K., Feng, H.-P., Liu, W.-S., . . . Ren, Z. (2011). Thermoelectric energy conversion using nanostructured materials. Paper
presented at the SPIE Defense, Security, and Sensing.
Dmitriev, A. V., & Zvyagin, I. P. (2010). Current trends in the physics of thermoelectric materials. Physics-Uspekhi, 53(8), 789-803.
Dughaish, Z. (2002). Lead telluride as a thermoelectric material for thermoelectric power
El-Eskandarany, M. S., Aoki, K., Itoh, H., & Suzuki, K. (1991). Effect of ball-to-powder weight ratio on the amorphization reaction of Al 50 Ta 50 by ball milling. Journal
Froes, F. (1990). The structural applications of mechanical alloying. JOM Journal of the Minerals, Metals and Materials Society, 42(12), 24-25.
Gilman, P., & Benjamin, J. (1983). Mechanical alloying. Annual Review of Materials Science, 13(1), 279-300.
Harnwunggmoung, A., Kurosaki, K., Ohishi, Y., Muta, H., & Yamanaka, S. (2011). Effects of Tl-filling into the voids and Rh substitution for Co on the thermoelectric properties of CoSb3. Journal of Alloys and Compounds, 509(3), 1084-1089.
Harringa, J., Cook, B., & Beaudry, B. (1992). Effects of vial shape on the rate of
mechanical alloying in Si80Ge20. Journal of materials science, 27(3), 801-804.
Hicks, L., & Dresselhaus, M. S. (1993). Effect of quantum-well structures on the thermoelectric figure of merit. Physical Review B, 47(19), 12727.
Hmood, A., Kadhim, A., & Hassan, H. A. (2013). Fabrication and characterization of
Pb1− xYbxTe-based alloy thin-film thermoelectric generators grown by thermal evaporation technique. Materials Science in Semiconductor Processing, 16(3),
612-618.
Hochbaum, A. I., Chen, R., Delgado, R. D., Liang, W., Garnett, E. C., Najarian, M., . . . Yang, P. (2008). Enhanced thermoelectric performance of rough silicon nanowires. Nature, 451(7175), 163-167.
Jiang, Y., Jia, X., Su, T., Dong, N., Yu, F., Tian, Y., . . . Ma, H. (2010). Thermoelectric
properties of SmxCo4Sb12 prepared by high pressure and high temperature. Journal of Alloys and Compounds, 493(1-2), 535-538.
Jie, Q., Wang, H., Liu, W., Wang, H., Chen, G., & Ren, Z. (2013). Fast phase formation
of double-filled p-type skutterudites by ball-milling and hot-pressing. Physical Chemistry Chemical Physics, 15(18), 6809-6816.
(2007). Thermoelectric properties of In z Co 4 Sb 12-y Te y skutterudites. Paper presented at the Thermoelectrics, 2007. ICT 2007. 26th International Conference on.
Kalkan, N., Young, E., & Celiktas, A. (2012). Solar thermal air conditioning technology
reducing the footprint of solar thermal air conditioning. Renewable and Sustainable Energy Reviews, 16(8), 6352-6383.
Kawamoto, H. (2009). R&D trends in high efficiency thermoelectric conversion materials
for waste heat recovery: NISTEP Science & Technology Foresight Center.
Keskar, G., Iyyamperumal, E., Hitchcock, D. A., He, J., Rao, A. M., & Pfefferle, L. D. (2012). Significant improvement of thermoelectric performance in nanostructured
bismuth networks. Nano Energy, 1(5), 706-713.
Kishi, M., Nemoto, H., Hamao, T., Yamamoto, M., Sudou, S., Mandai, M., & Yamamoto, S. (1999). Micro thermoelectric modules and their application to wristwatches as
Univers
ity of
Mala
ya
95
an energy source. Paper presented at the Thermoelectrics, 1999. Eighteenth International Conference on.
Kiyoshi, I. (1970). Servocontrol system for discharge sintering: Google Patents.
Koch, C. (1993). The synthesis and structure of nanocrystalline materials produced by
mechanical attrition: a review. Nanostructured materials, 2(2), 109-129.
Spark Plasma Sintering
Lab, L. L. N. (2017). Estimated U.S Energy Consumption in 2017 : 97.7 Quads.
thermoelectric materials. NPG Asia Materials, 2(4), 152-158.
Liu, K., Dong, X., & Jiuxing, Z. (2006). The effects of La on thermoelectric properties of La x Co 4 Sb 12 prepared by MA–SPS. Materials chemistry and physics, 96(2),
371-375.
Liu, W., Yan, X., Chen, G., & Ren, Z. (2012). Recent advances in thermoelectric nanocomposites. Nano Energy, 1(1), 42-56.
Lu, P.-X., Wu, F., Han, H.-L., Wang, Q., Shen, Z.-G., & Hu, X. (2010). Thermoelectric properties of rare earths filled CoSb3 based nanostructure skutterudite. Journal of
Alloys and Compounds, 505(1), 255-258.
Mallik, R., Anbalagan, R., Raut, K., Bali, A., Royanian, E., Bauer, E., . . . Rogl, P. (2013). Thermoelectric properties of Bi-added Co4Sb12 skutterudites. Journal of
Physics: Condensed Matter, 25(10), 105701.
Munir, Z., Anselmi-Tamburini, U., & Ohyanagi, M. (2006). The effect of electric field and pressure on the synthesis and consolidation of materials: a review of the spark
plasma sintering method. Journal of materials science, 41(3), 763-777.
Nie, G., Ochi, T., Suzuki, S., Kikuchi, M., Ito, S., & Guo, J. (2014). Stability of skutterudite thermoelectric materials. Journal of Electronic Materials, 43(6), 1752-1756.
Nolas, G., Morelli, D., & Tritt, T. M. (1999). Skutterudites: A phonon-glass-electron
crystal approach to advanced thermoelectric energy conversion applications. Annual Review of Materials Science, 29(1), 89-116.
Univers
ity of
Mala
ya
96
Nolas, G., Slack, G., Morelli, D., Tritt, T., & Ehrlich, A. (1996). The effect of rare‐earth filling on the lattice thermal conductivity of skutterudites. Journal of Applied
Physics, 79(8), 4002-4008.
Prometeon. Waste Heat to Electricity. In P. C. E. Technologies (Ed.).
Rubi, C. S., Gowthaman, S., & Renganathan, N. Role of nanostructured materials in recent developments of thermoelectric nanocomposites.
Ryu, S., Kim, S., Kim, Y. D., & Moon, I. H. (2003). Amorphization of Immiscible W-Cu-Pb System by Mechanical Alloying at Low Temperature. Paper presented at the Journal of Metastable and Nanocrystalline Materials.
Said, S. M., Bashir, M. B. A., Sabri, M. F. M., Miyazaki, Y., Shnawah, D. A. A., Hakeem,
A. S., . . . Elsheikh, M. H. (2017). Enhancement of Thermoelectric Behavior of La0. 5Co4Sb12− xTex Skutterudite Materials. Metallurgical and Materials
Transactions A, 48(6), 3073-3081.
Schnelle, W., Leithe-Jasper, A., Rosner, H., Cardoso-Gil, R., Gumeniuk, R., Trots, D., . . . Grin, Y. (2008). Magnetic, thermal, and electronic properties of iron-antimony filled skutterudites M Fe 4 Sb 12 (M= Na, K, Ca, Sr, Ba, La, Yb). Physical Review
B, 77(9), 094421.
Shi, X., Yang, J., Salvador, J. R., Chi, M., Cho, J. Y., Wang, H., . . . Chen, L. (2011). Multiple-filled skutterudites: high thermoelectric figure of merit through
separately optimizing electrical and thermal transports. Journal of the American Chemical Society, 133(20), 7837-7846.
Snyder, G. J., & Toberer, E. S. (2008). Complex thermoelectric materials. Nature
materials, 7(2), 105-114.
Sootsman, J. R., Chung, D. Y., & Kanatzidis, M. G. (2009). New and old concepts in thermoelectric materials. Angewandte Chemie International Edition, 48(46), 8616-8639.
Stordeur, M., & Rowe, D. (1995). CRC Handbook of Thermoelectrics. CRC Press, Boca Raton, FL, 251.
Suryanarayana, C. (2001). Mechanical alloying and milling. Progress in materials science, 46(1), 1-184.
Univers
ity of
Mala
ya
97
Takacs, L., & Pardavi‐Horvath, M. (1994). Nanocomposite formation in the Fe3O4‐Zn system by reaction milling. Journal of Applied Physics, 75(10), 5864-5866.
Tang, G., Zhang, D., Chen, G., Xu, F., & Wang, Z. (2012). Thermoelectric properties in
double-filled skutterudites InxNdyCo4Sb12. Solid State Communications, 152(24), 2193-2196.
Structures and Thermoelectric Properties of Sm-Filled Skutterudite Compounds Smy Fex Co4-x Sb12. Journal of Rare Earths, 25(6), 739-743.
Tomeš, P., Trottmann, M., Suter, C., Aguirre, M. H., Steinfeld, A., Haueter, P., &
Weidenkaff, A. (2010). Thermoelectric oxide modules (TOMs) for the direct conversion of simulated solar radiation into electrical energy. Materials, 3(4), 2801-2814.
Truong, D. N., Kleinke, H., & Gascoin, F. (2014). Thermoelectric properties of higher
Ur, S.-C., Kwon, J.-C., & Kim, I.-H. (2007a). Thermoelectric properties of Fe-doped
CoSb3 prepared by mechanical alloying and vacuum hot pressing. Journal of Alloys and Compounds, 442(1-2), 358-361.
Ur, S.-C., Kwon, J.-C., & Kim, I.-H. (2007b). Thermoelectric properties of Fe-doped
CoSb 3 prepared by mechanical alloying and vacuum hot pressing. Journal of Alloys and Compounds, 442(1), 358-361.
Venkatasubramanian, R., Siivola, E., Colpitts, T., & O'quinn, B. (2001). Thin-film thermoelectric devices with high room-temperature figures of merit. Nature,
413(6856), 597-602.
Vineis, C. J., Shakouri, A., Majumdar, A., & Kanatzidis, M. G. (2010). Nanostructured thermoelectrics: big efficiency gains from small features. Advanced Materials,
22(36), 3970-3980.
Wang, T., Zhang, Y., Peng, Z., & Shu, G. (2011). A review of researches on thermal exhaust heat recovery with Rankine cycle. Renewable and Sustainable Energy
Reviews, 15(6), 2862-2871.
Wang, X., Lee, H., Lan, Y., Zhu, G., Joshi, G., Wang, D., . . . Klatsky, J. (2008). Enhanced thermoelectric figure of merit in nanostructured n-type silicon germanium bulk alloy. Applied Physics Letters, 93(19), 193121.
Wei, J., Zhang, F., & Zhang, J. (2014). Effects of Cu doping on electronic structure and
electrical transport properties of ZnO oxide. Chinsese Journal of Quantum
Electronics (量子电子学报), 31(3), 372-378.
Yamada, K., & Koch, C. C. (1993). The influence of mill energy and temperature on the structure of the TiNi intermetallic after mechanical attrition. Journal of materials research, 8(06), 1317-1326.
Univers
ity of
Mala
ya
98
Yan, X. (2010). Thermoelectric Property Studies of Nanostructured Bulk Half-Heuslers and Bismuth Tellurides. Boston College. Graduate School of Arts and Sciences.
Yang, J., Chen, Y., Peng, J., Song, X., Zhu, W., Su, J., & Chen, R. (2004). Synthesis of CoSb3 skutterudite by mechanical alloying. Journal of Alloys and Compounds,
Yang, J., Xu, B., Zhang, L., Liu, Y., Yu, D., Liu, Z., . . . Tian, Y. (2013). Gadolinium filled CoSb3: High pressure synthesis and thermoelectric properties. Materials
Letters, 98, 171-173.
Yang, K., Cheng, H., Hng, H., Ma, J., Mi, J., Zhao, X., . . . Zhang, Y. (2009). Synthesis and thermoelectric properties of double-filled skutterudites Ce y Yb 0.5− y Fe 1.5
Co 2.5 Sb 12. Journal of Alloys and Compounds, 467(1), 528-532.
Zakeri, M., Allahkarami, M., Kavei, G., Khanmohammadian, A., & Rahimipour, M. (2009). Synthesis of nanocrystalline Bi 2 Te 3 via mechanical alloying. journal of materials processing technology, 209(1), 96-101.
Zhang, L., Grytsiv, A., Kerber, M., Rogl, P., Bauer, E., & Zehetbauer, M. (2010). Thermoelectric performance of mischmetal skutterudites Mm y Fe 4− x Co x Sb 12 at elevated temperatures. Journal of Alloys and Compounds, 490(1), 19-25.
Zhang, L., Grytsiv, A., Kerber, M., Rogl, P., Bauer, E., Zehetbauer, M., . . . Nauer, G.
(2009). MmFe 4 Sb 12-and CoSb 3-based nano-skutterudites prepared by ball milling: Kinetics of formation and transport properties. Journal of Alloys and
Compounds, 481(1), 106-115.
Zhang, L., Grytsiv, A., Kerber, M., Rogl, P., Bauer, E., Zehetbauer, M. J., . . . Nauer, G. E. (2009). MmFe4Sb12- and CoSb3-based nano-skutterudites prepared by ball milling: Kinetics of formation and transport properties. Journal of Alloys and
Raihan, O., Said, S. M., Sabri, M. F. M., Rozali, S., Long, B. D., Kimura, K., ... & Bashir, M. B. A. (2018). Parametric analysis of ball milling condition on thermoelectric performance of Bi0. 6FeCo3Sb12 skutterudite. Materials Research Express, 5(10), 105008.


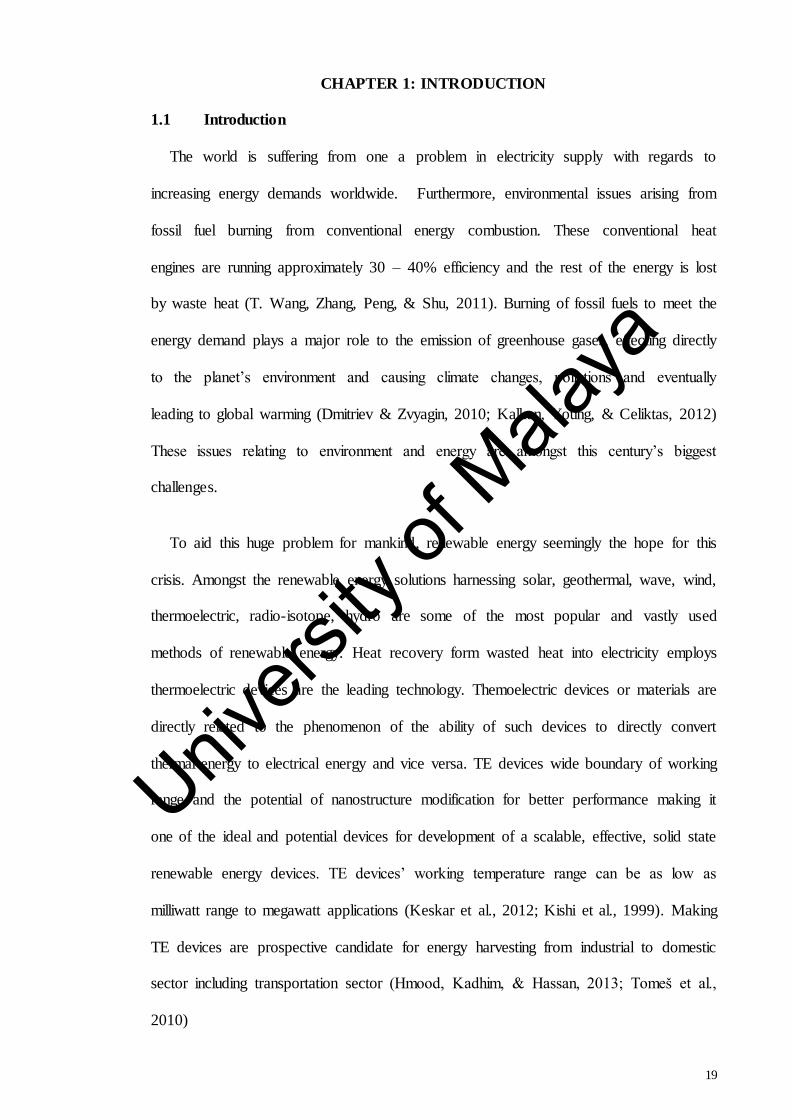
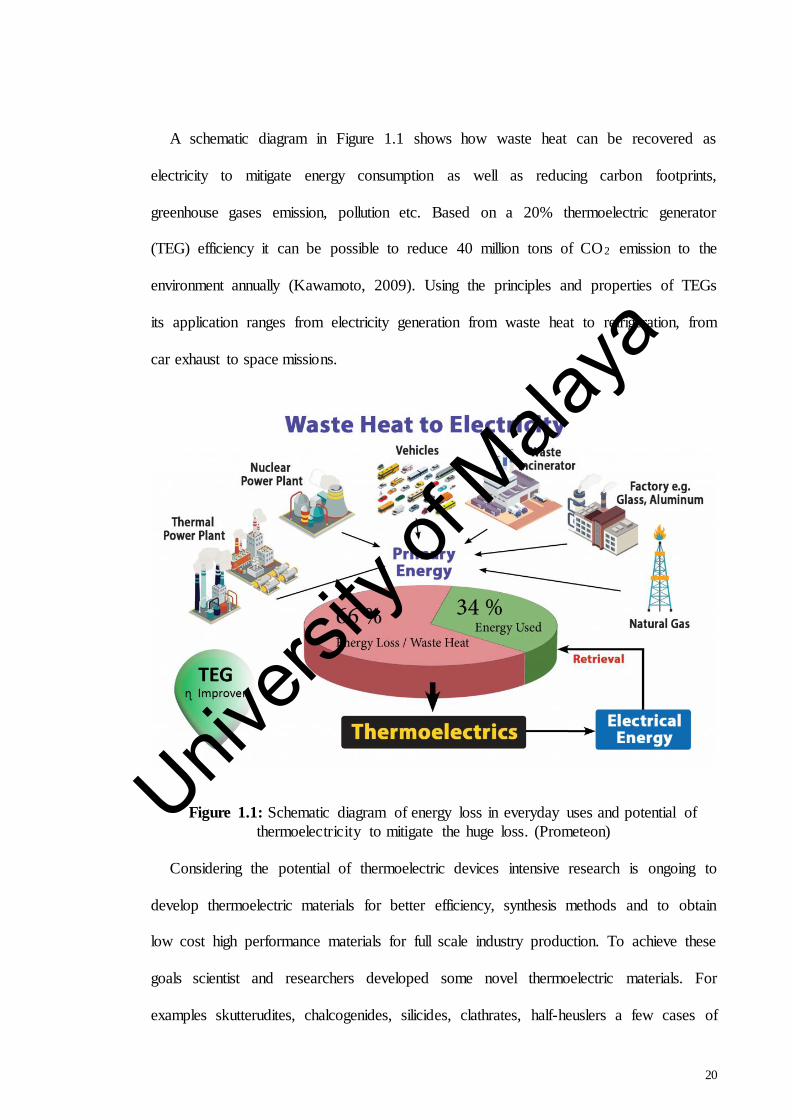


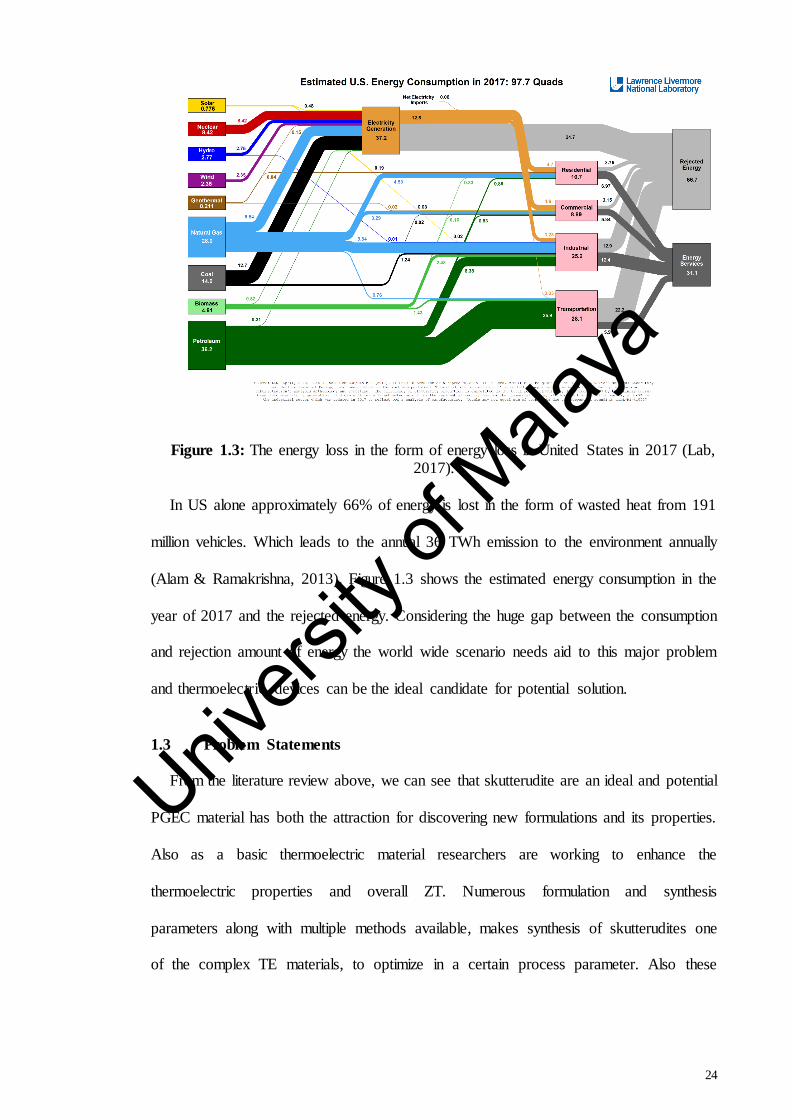


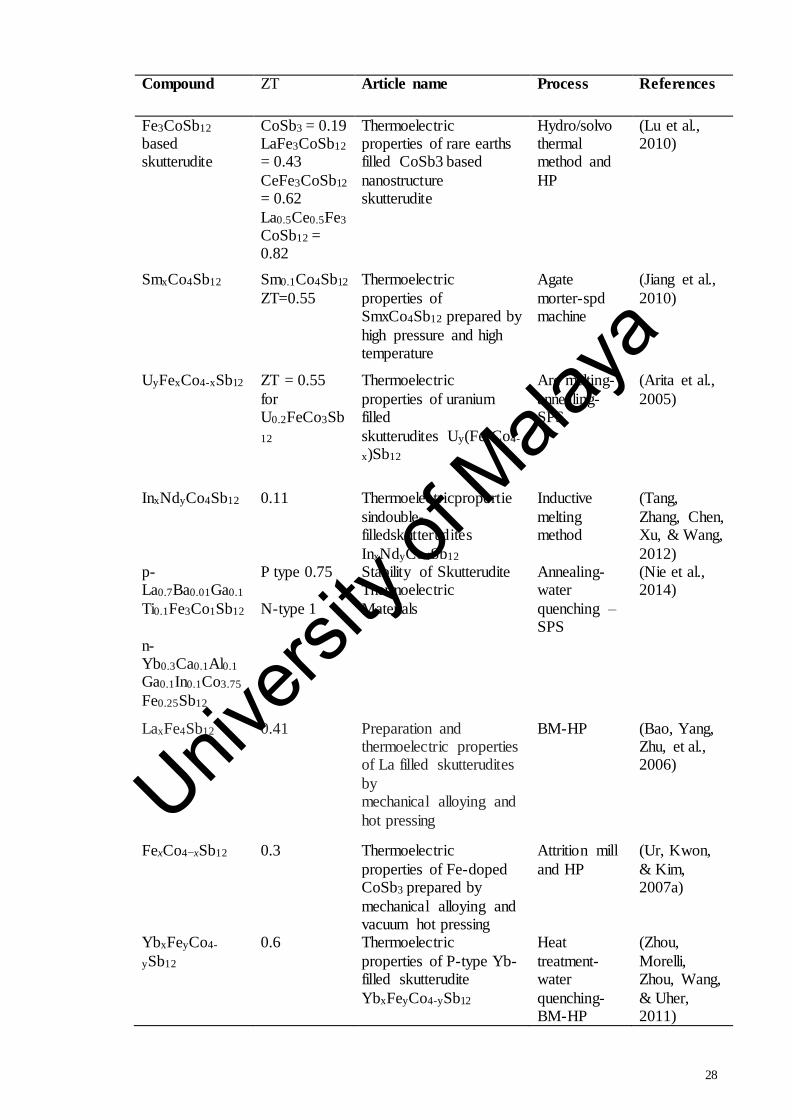


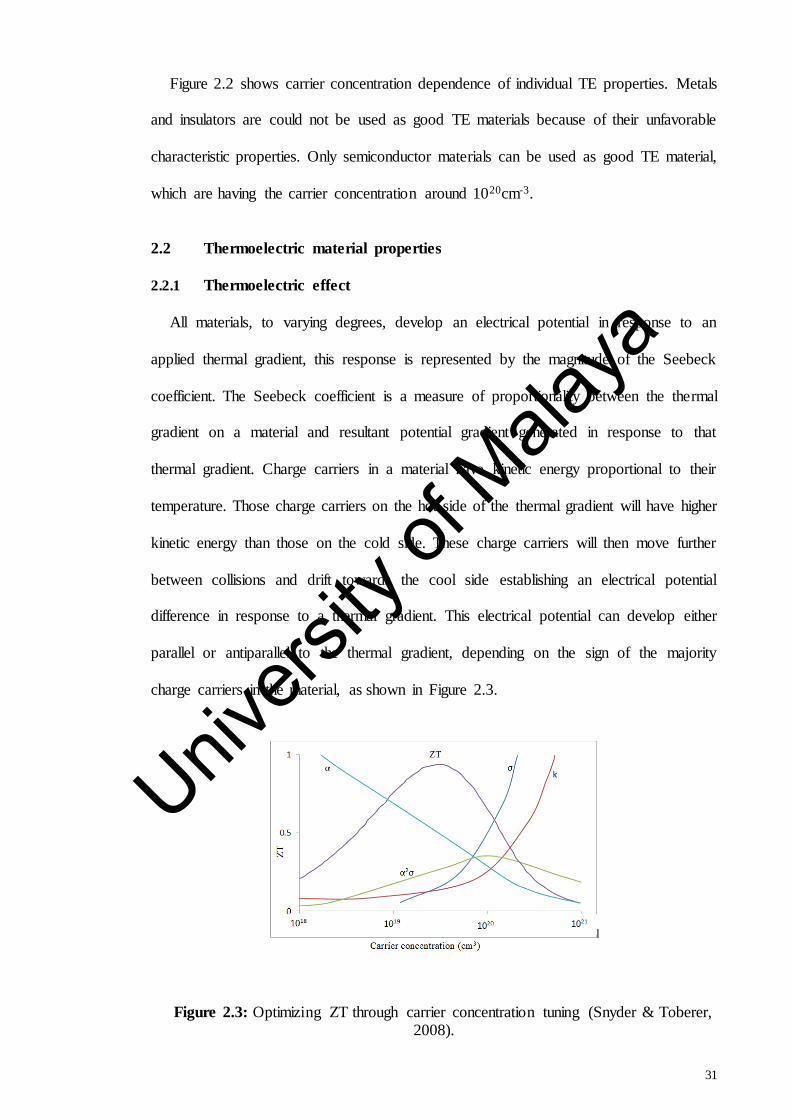


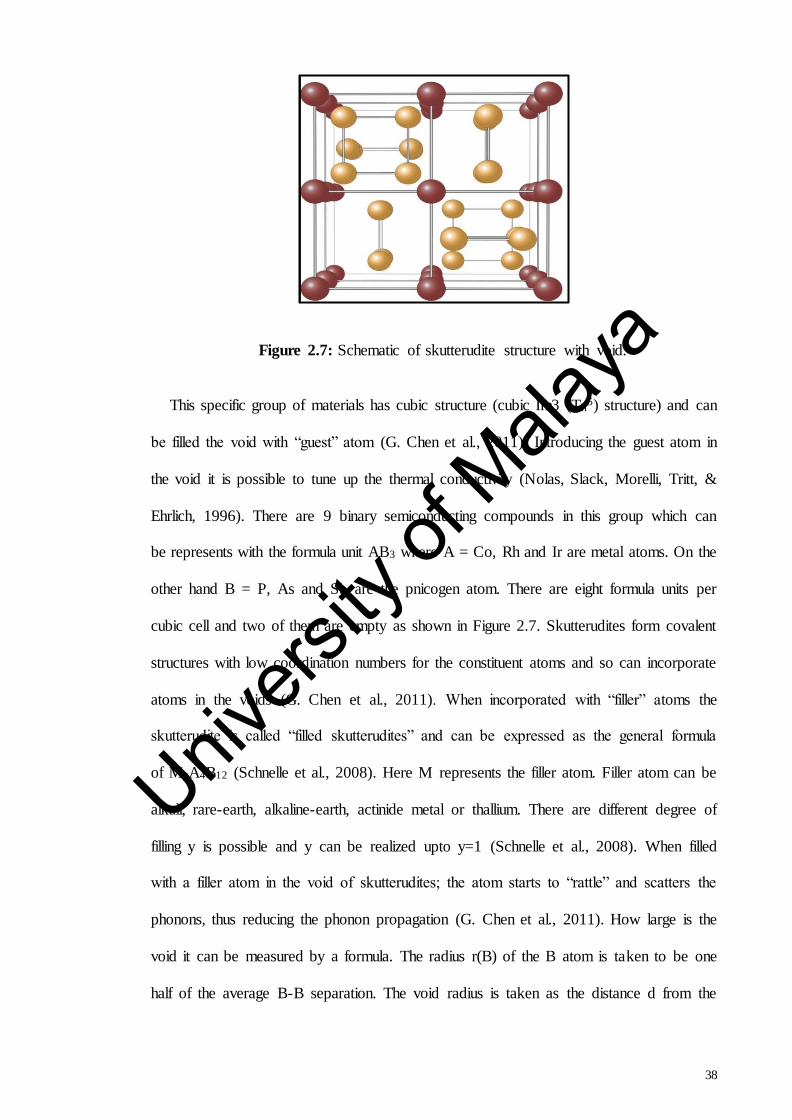
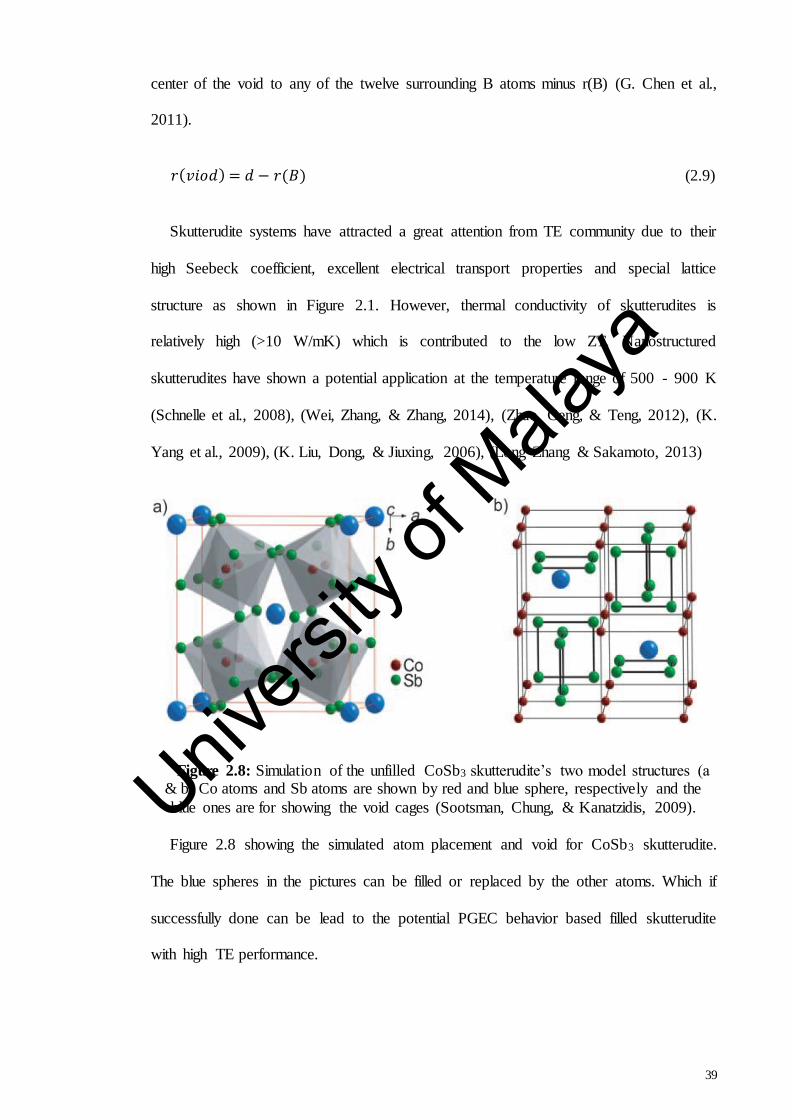


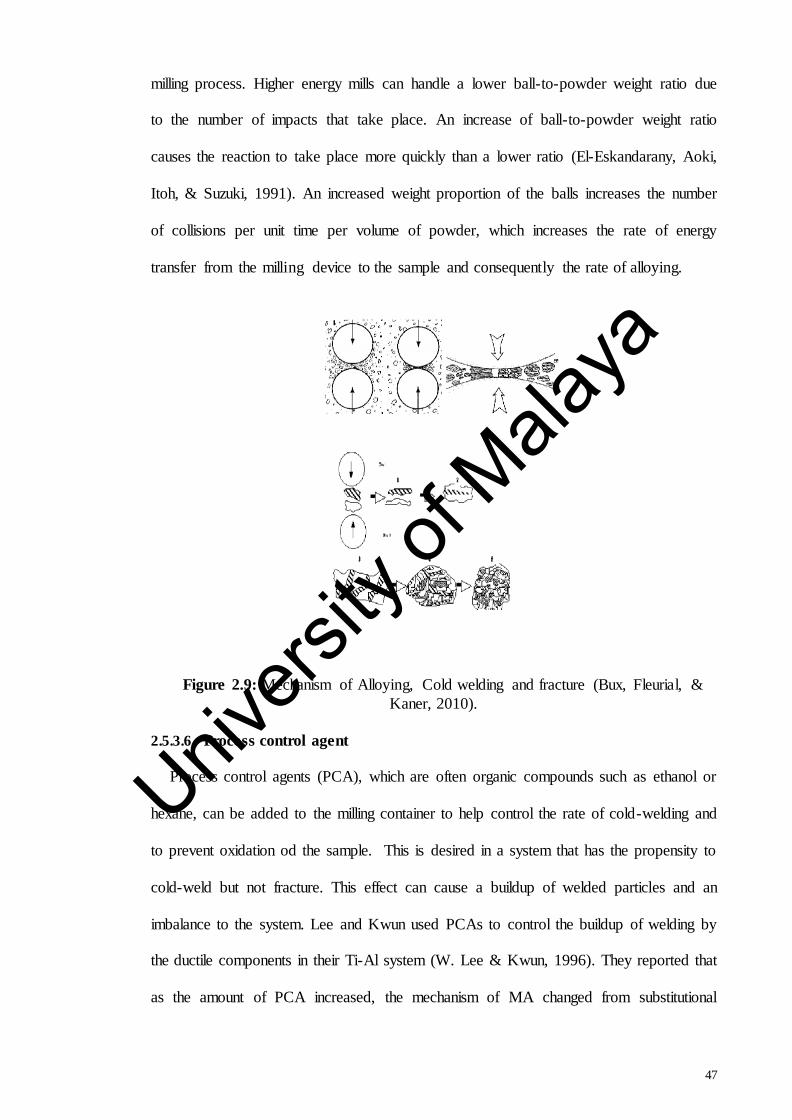


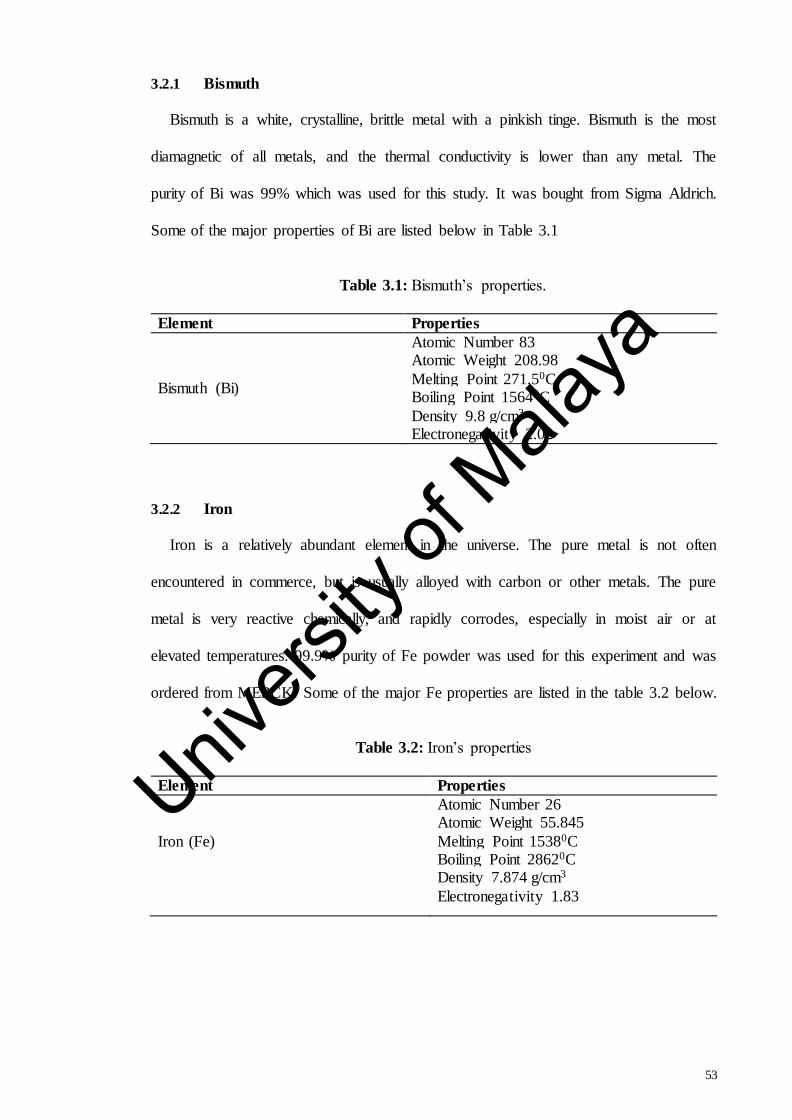
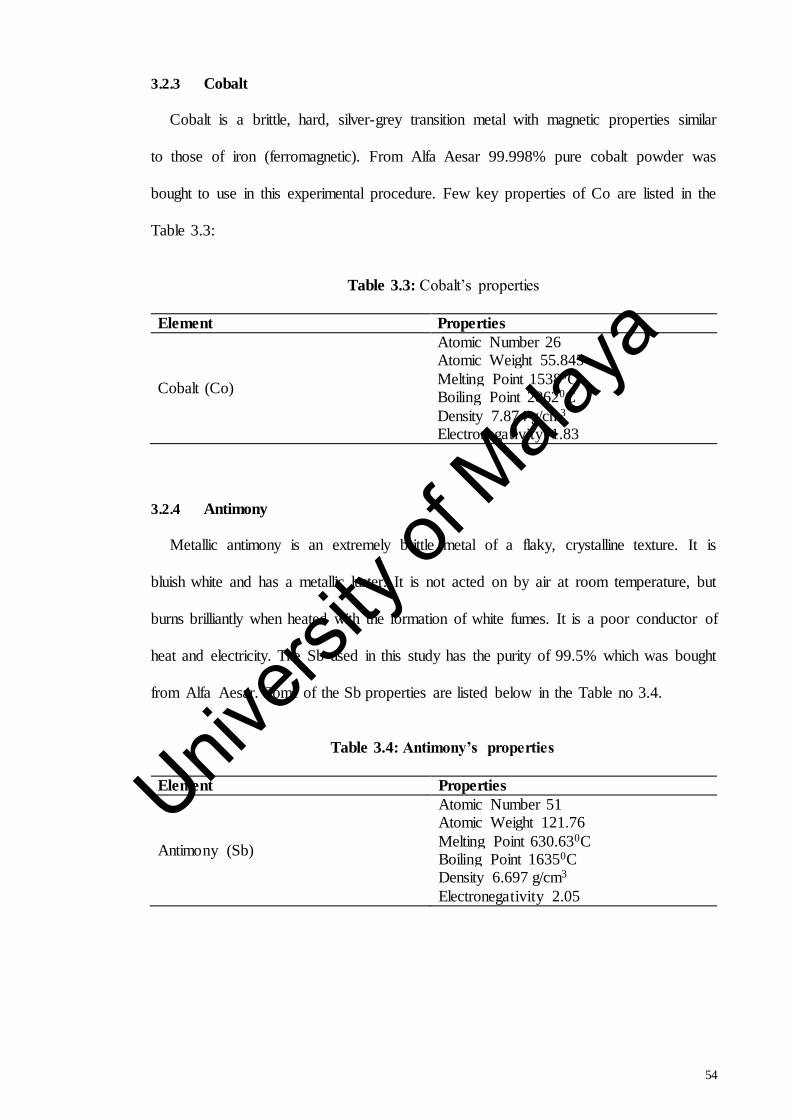
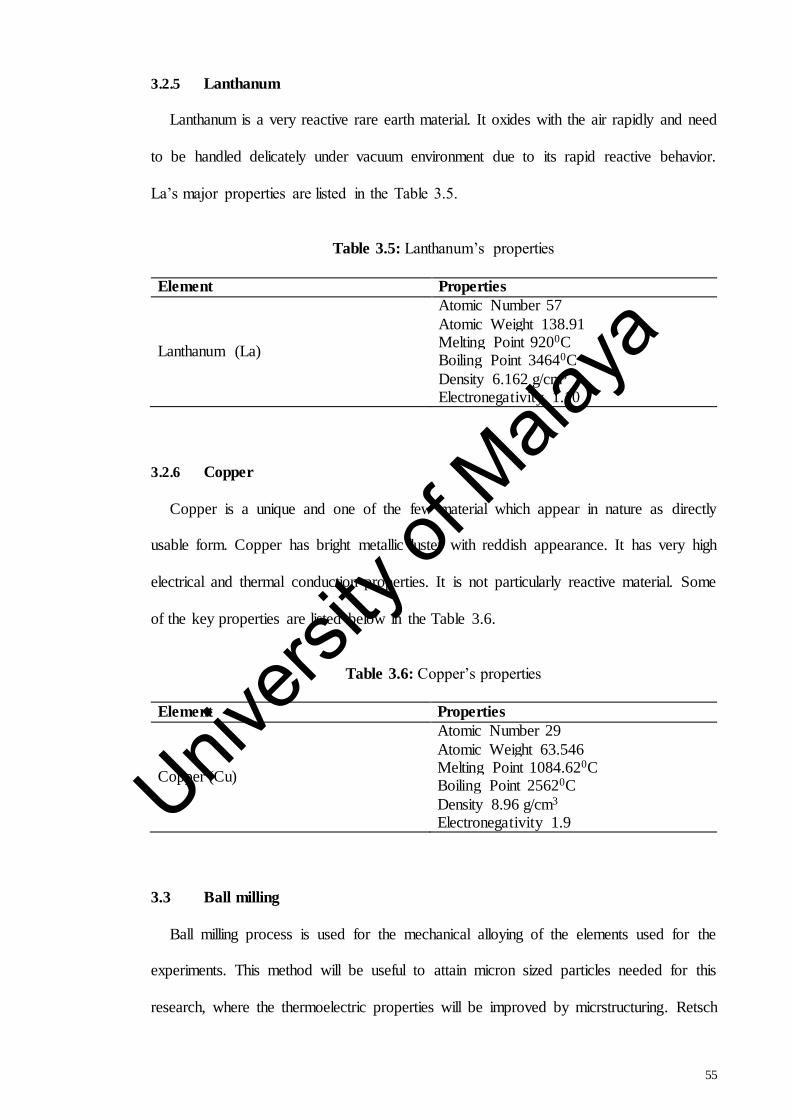


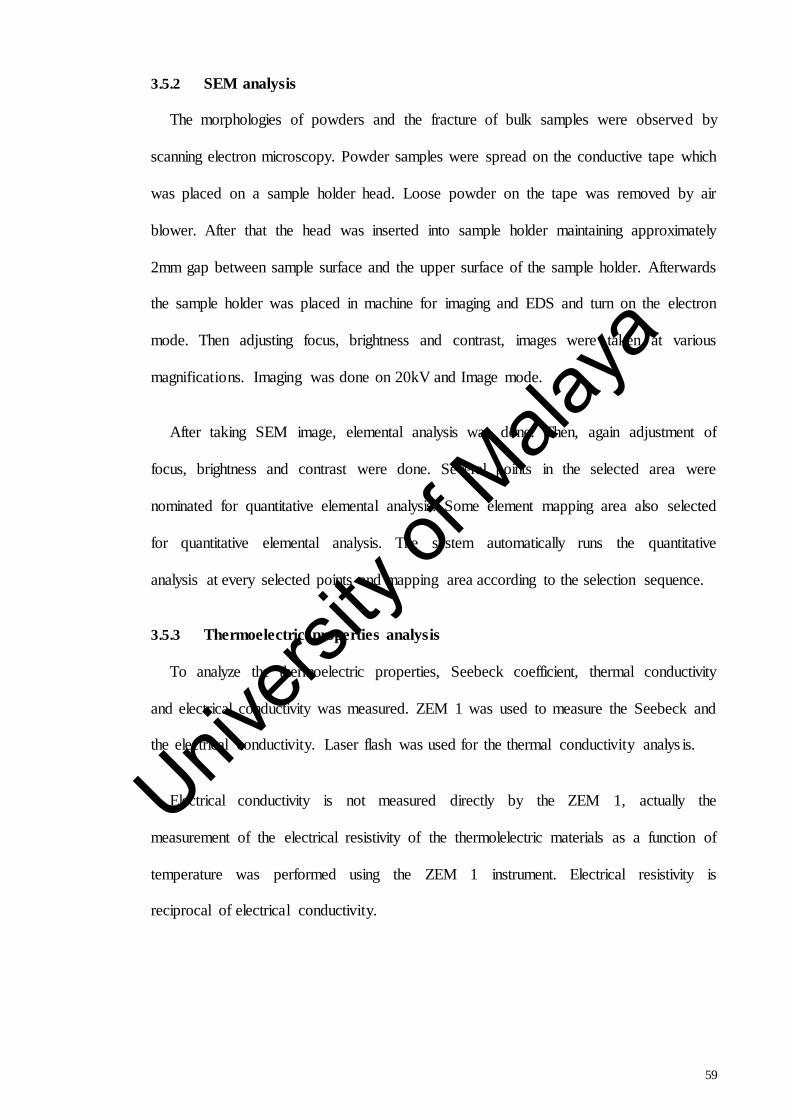


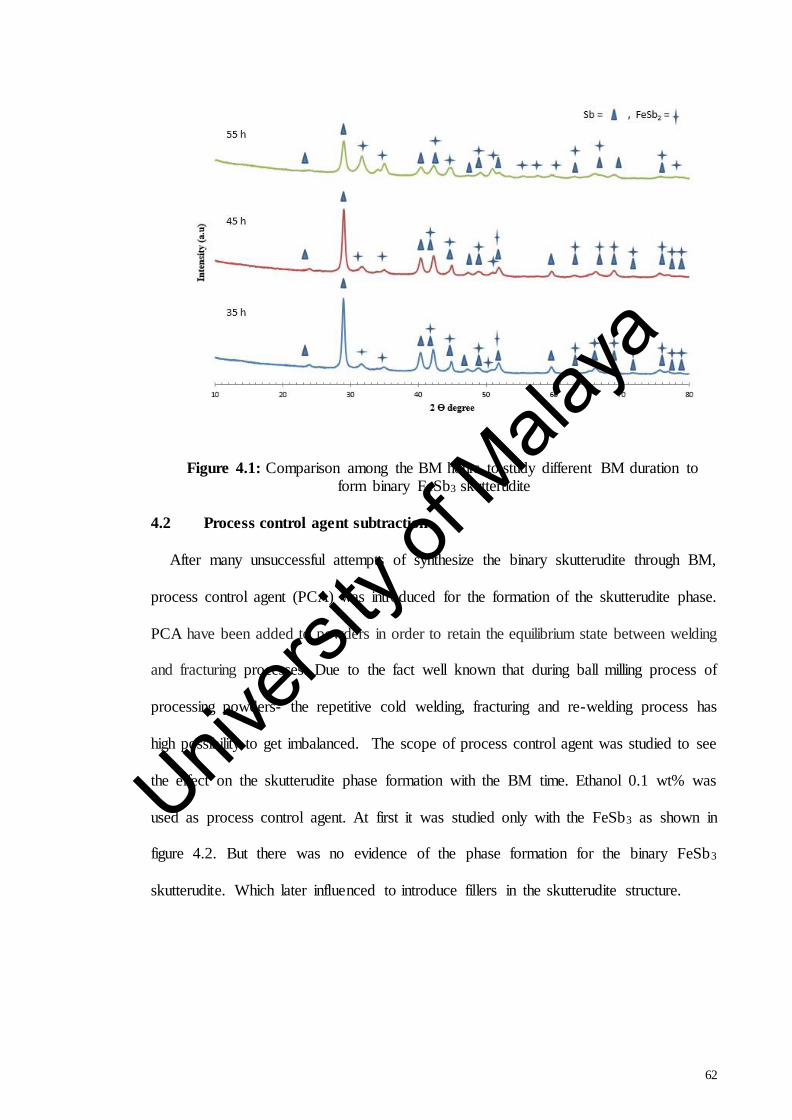


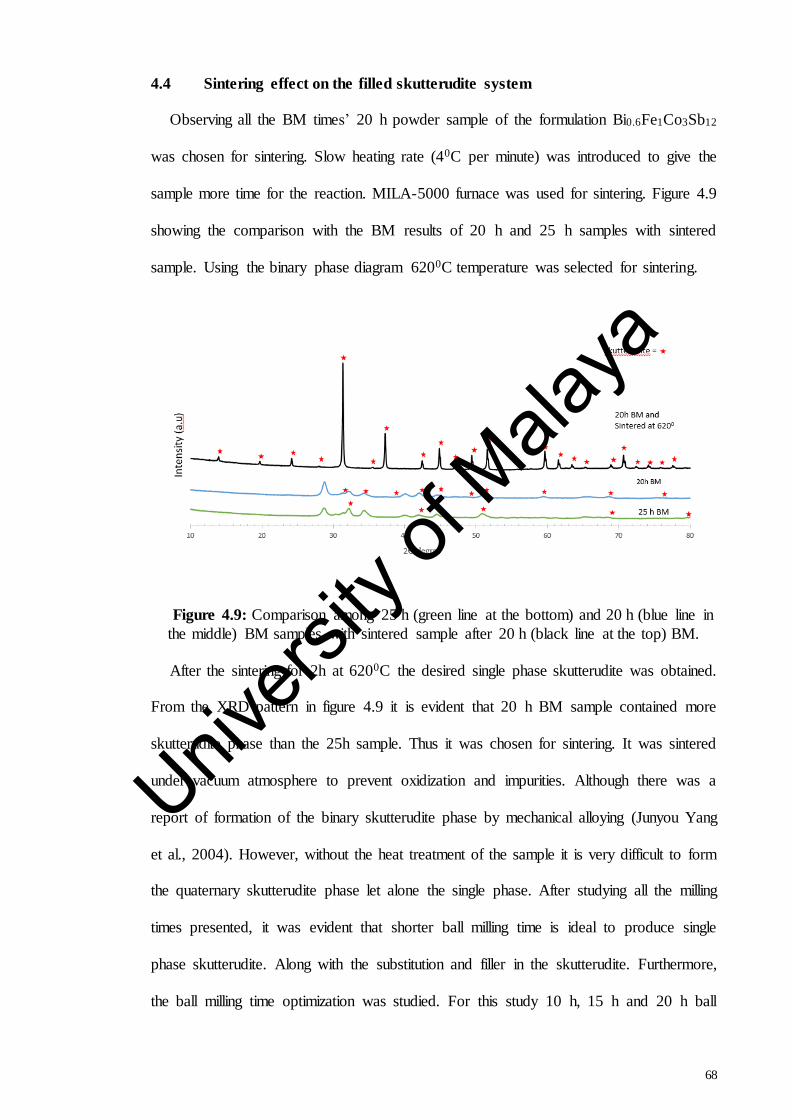

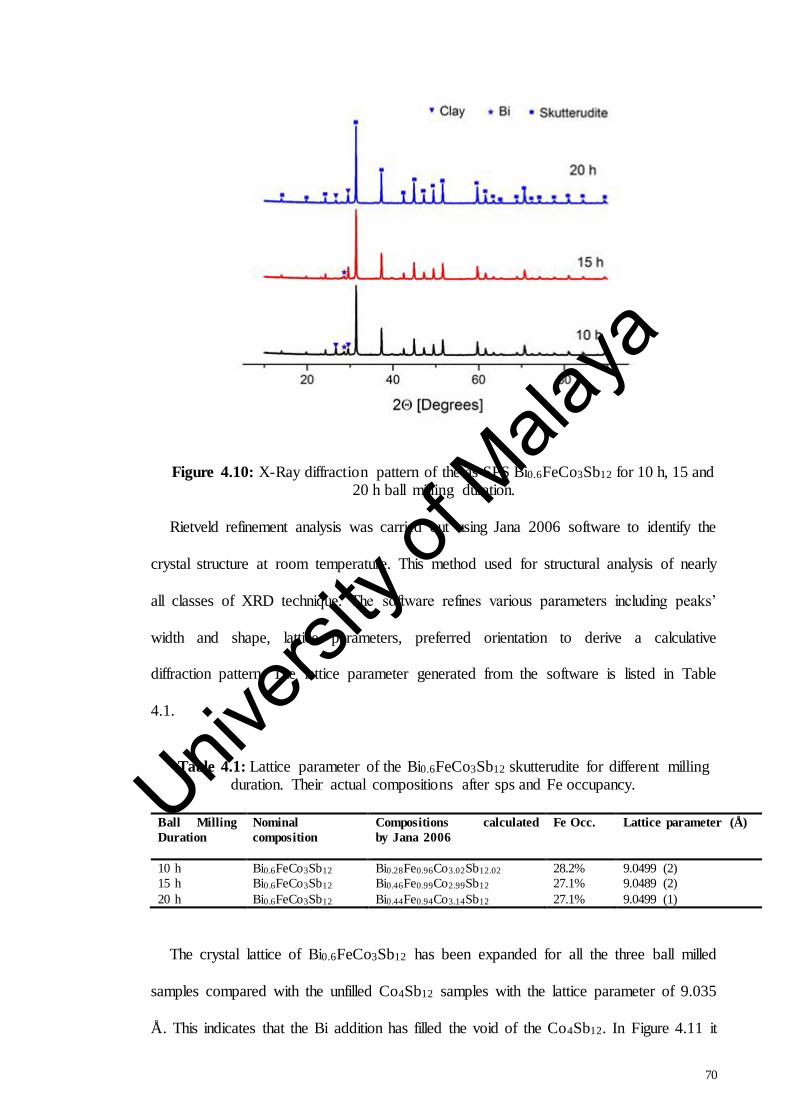
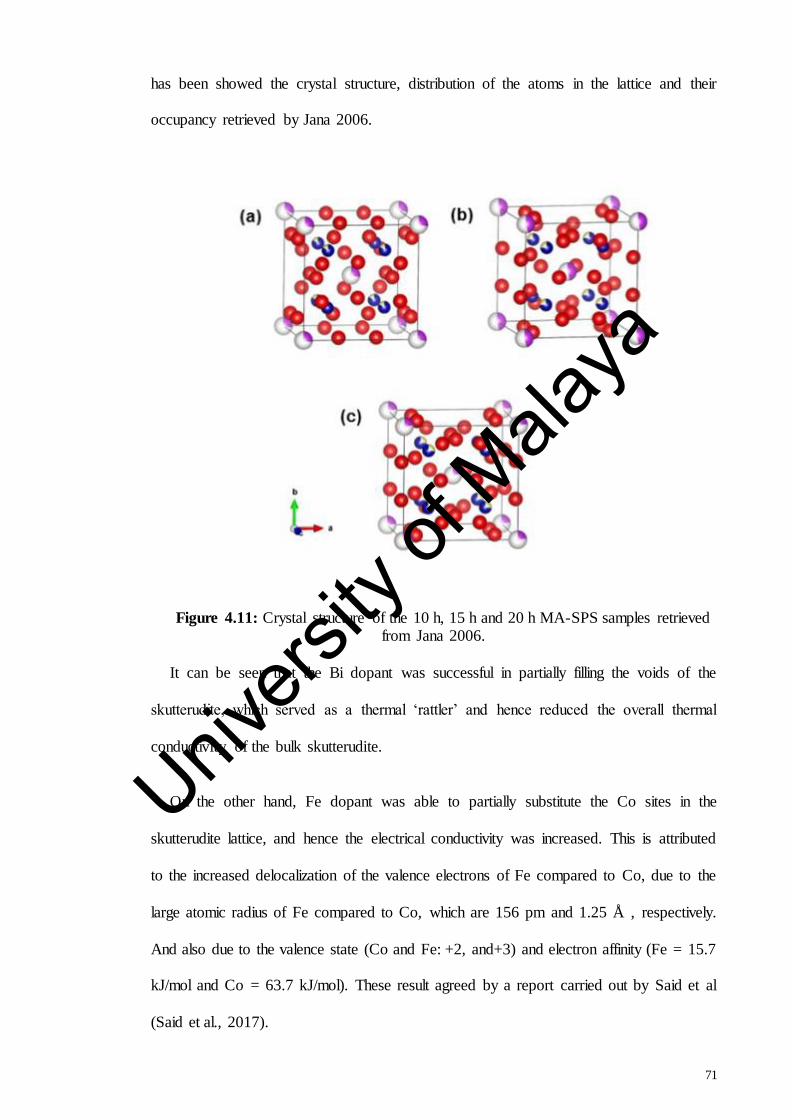


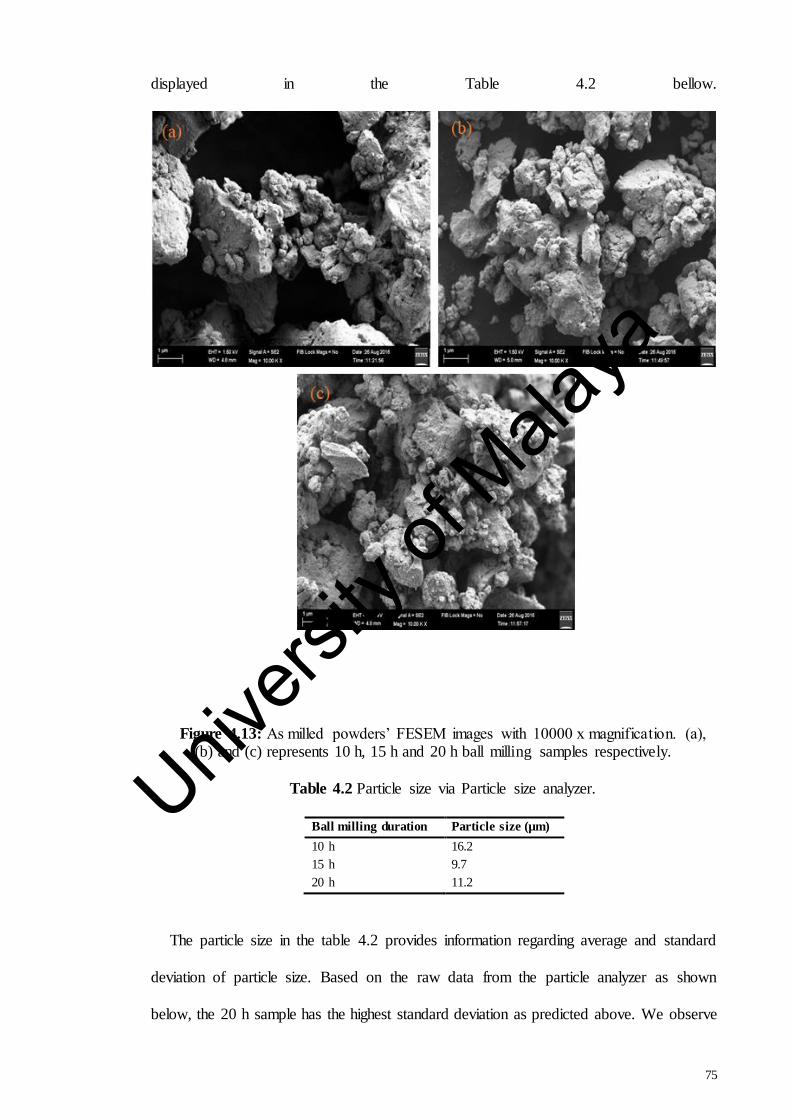

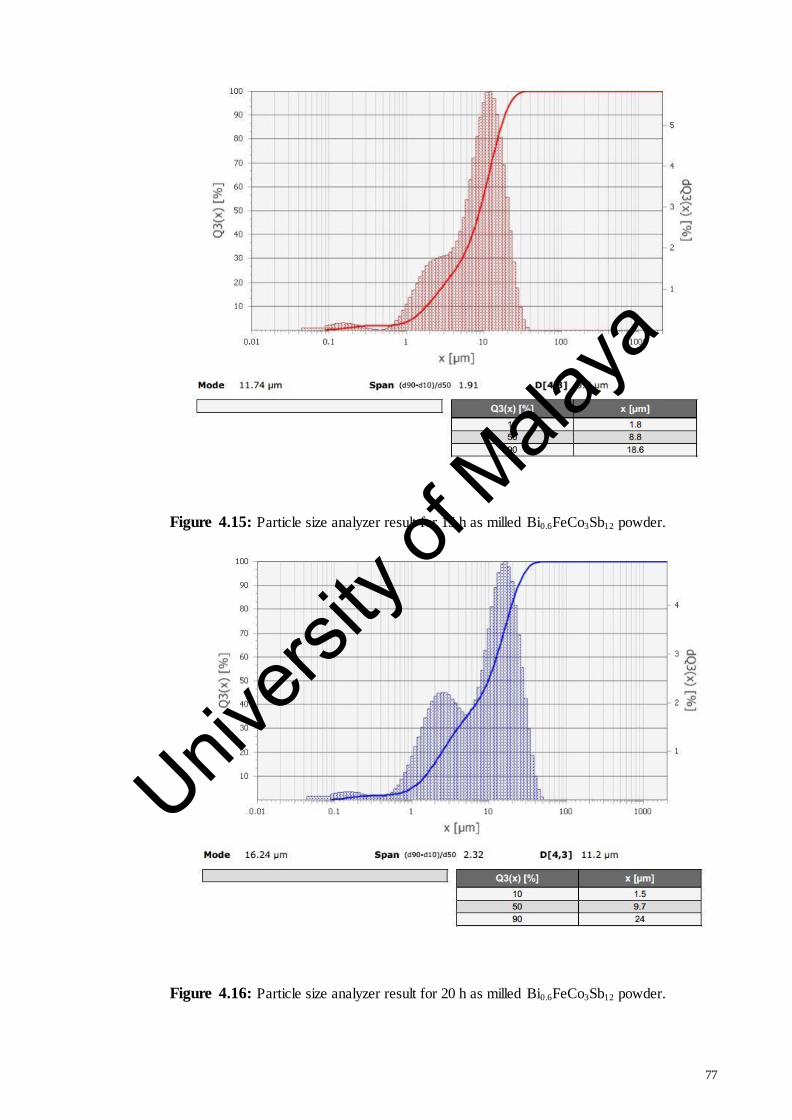

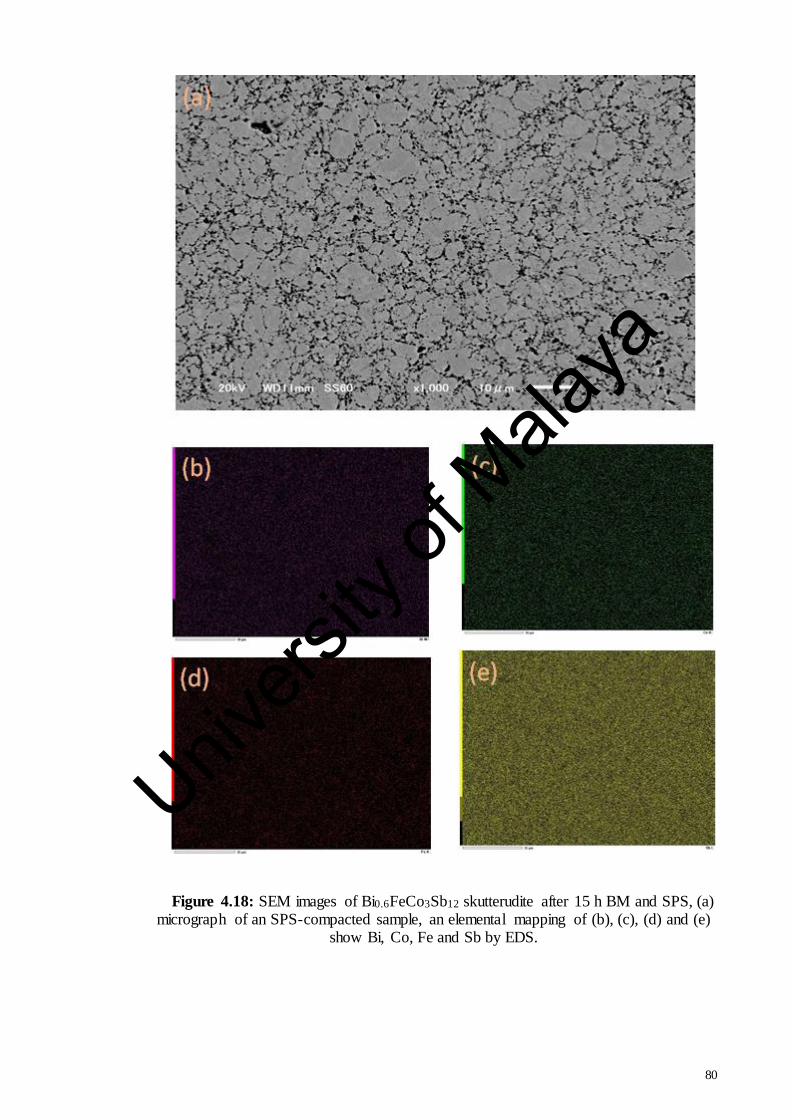

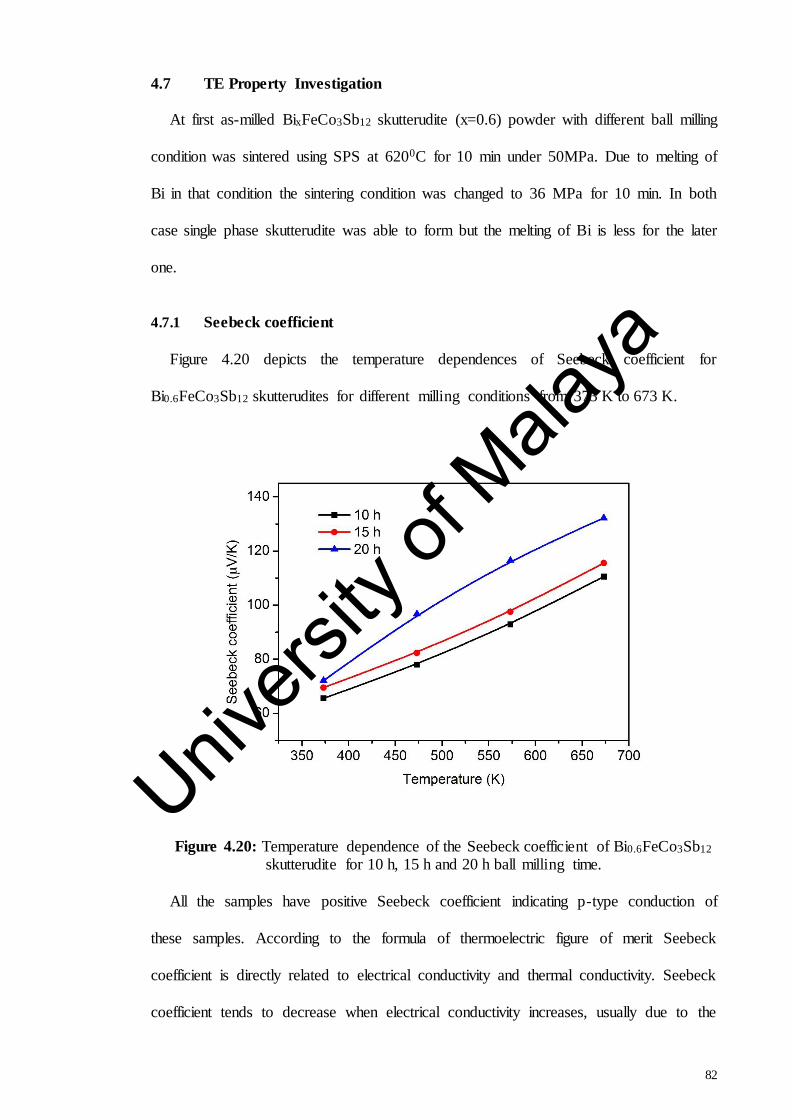


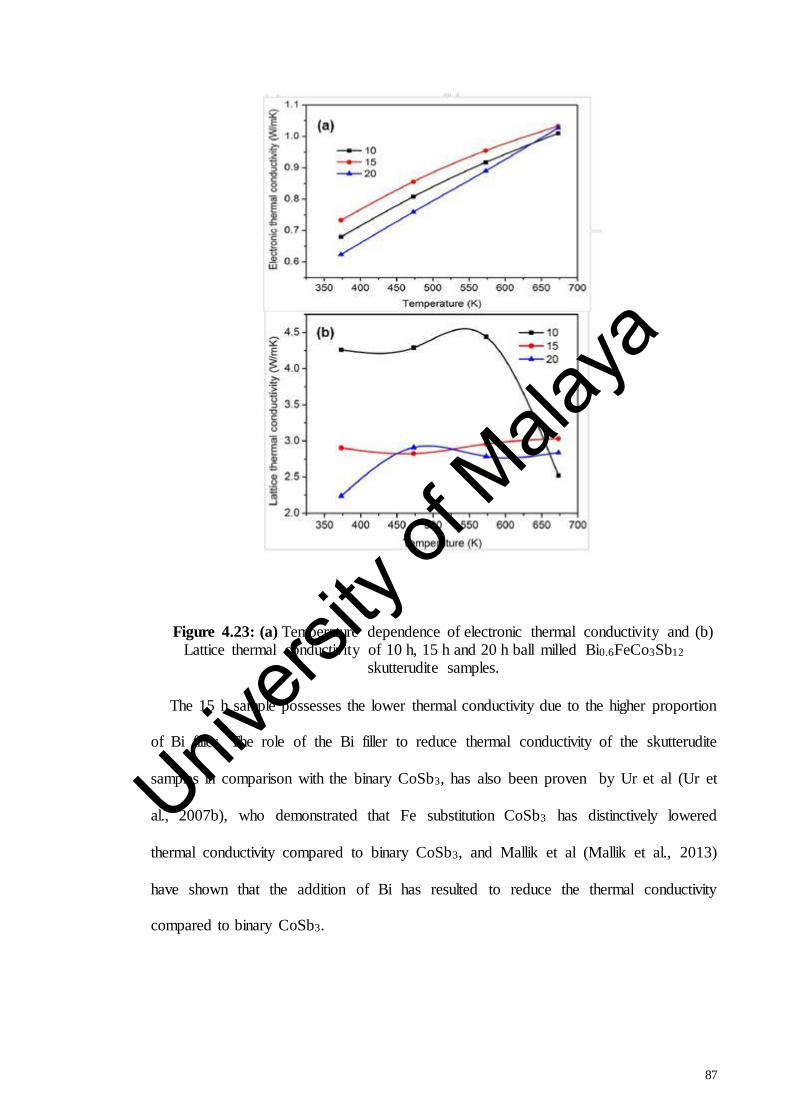


![A review of CoSb -based skutterudite thermoelectric materials...CoSb3 material at room temperature prepared by the Bridgman method is up to 10 W·m–1·K–1 [35]. Therefore, how](https://static.documents.pub/doc/80x56/60b544587211957a3620f23d/a-review-of-cosb-based-skutterudite-thermoelectric-materials-cosb3-material.jpg)


