Executive Summary Japan's average LNG import price is expected to go down to USD 8.8 - 9.0 per
million Btu in 2020, from USD 10 estimated for 2019. The global LNG market is expected to expand to 370 million tonnes in 2020,
thanks to significant increases in supply capacity. The global LNG market is estimated to grow more than 10% in 2019, while the
share of four major importing markets in Northeast Asia in the global total hasshrunk to 55% from 62% in 2018, as the region has been importing almost thesame volumes of LNG in 2019 as it did one year earlier.
A major portion of the expanded supply of LNG has been directed into Europewhere ample underground storage capacity is located. As spot LNG prices stay inthe lowest level in the history, the gap between them and long-term contractprices has been the widest ever in Northeast Asia. With stronger influences of gashub prices in Europe and the United States over LNG prices, underpinned by theincreasing LNG imports in Europe and increasing LNG exports from the UnitedStates, global interaction of LNG prices in different regions has been moreapparent.
In 2019, final investment decisions (FIDs) representing 71 million tonnes ofannual production capacity were announced, with many additional projectsapproaching the milestone.
Competition has been intensified in big city areas in Japan’s city-gas market,especially in the Kanto region, two years after the retail market was opened up.
In order to effectively utilise expected flexible LNG supply sources, Japanesecompanies and government are expected to contribute jointly to emerging marketdevelopment, infrastructure investment, and optimization of transportation.
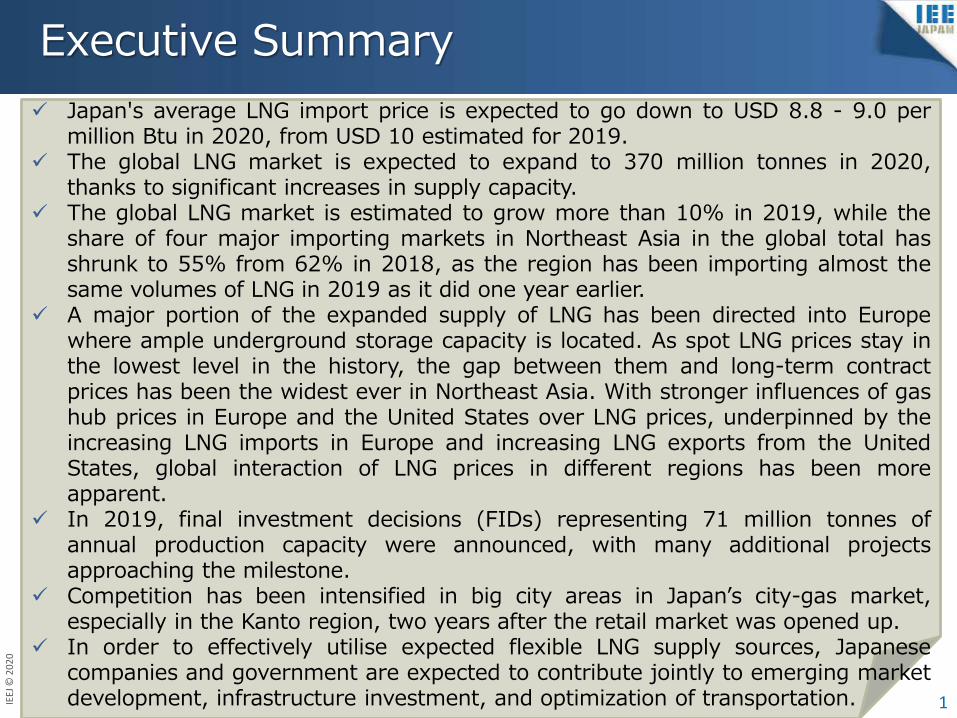
The combined natural gas consumption in the OECD countries, China and India -representing more than half of global total - grew by 112 bcm or 6% - higher thanglobal average - year-on-year to 2.1 tcm in 2018, and by 66 bcm or 4% from thesame period in 2018 during the first three quarters of 2019.
OECD Americas (+25 bcm or +3%) and China (+25 bcm or +10%) continuedriving further demand growth in 2019, while OECD Europe returned to growth inthe second quarter.
However, the growth rates have been slowed in OECD Americas and China. Southeast and South Asian countries also increase gas consumption modestly.
2
(Source) Compiled by the author based on data of IEA “Monthly Gas Statistics”, China’s NDRC and India’s PPAC
-
100
200
300
400
500
600
700
Q4 Q1 Q2 Q3 Q4 Q1 Q2 Q3 Q4 Q1 Q2 Q3
2016 2017 2018 2019
bcmGas Consumption in Selected Regions
OECD Americas OECD Europe OECD Asia Oceania China India
-20
-10
-
10
20
30
40
50
Q4 Q1 Q2 Q3 Q4 Q1 Q2 Q3 Q4 Q1 Q2 Q3
2016 2017 2018 2019
bcmYear-on-year Changes in Gas Consumption
OECD Americas OECD Europe OECD Asia Oceania China India
LNG Imports Surge in Europe Thanks to Expansion of Global Production
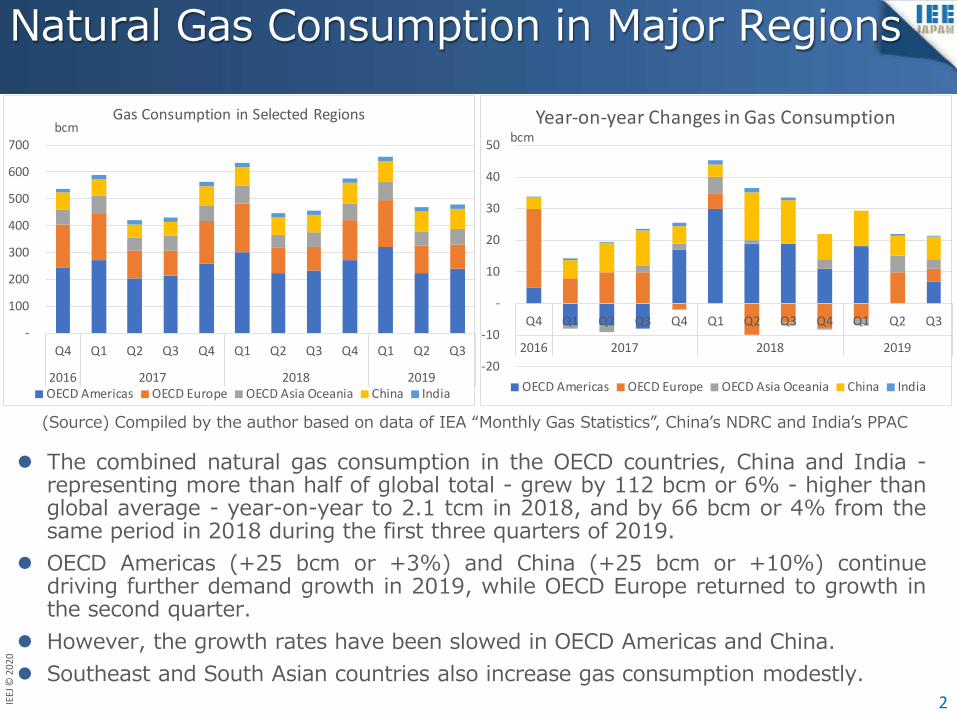
Global LNG imports grew by 12% to 260 milliontonnes during the first nine months of 2019
China’s LNG imports grew by 15% during the firstten months of 2019
Europe’s LNG imports grew by 83% to surpass 60million tonnes during the first nine months of 2019
Southeast and South Asia’s emerging LNGimporters have increased volumes significantly inrecent years, increasing by 25% or 1.7 milliontonnes and by 65% or 3.4 million tonnes duringthe first three quarters of 2019 3
(Source) Compiled by the author based on Cedigaz LNG Service data
0 10 20 30 40 50 60 70 80 90
1Q2Q3Q4Q1Q2Q3Q4Q1Q2Q3Q4Q1Q2Q3Q4Q1Q2Q3Q
2015
2016
2017
2018
2019
million tonnes
Global LNG Imports Driven by Production Expansion
Japan Korea China Chinese Taipei Thailand Malaysia
Singapore India Pakistan Bangladesh Kuwait Dubai
Israel Jordan Egypt Turkey Malta Greece
Italy Spain Portugal France Belgium Netherlands
Poland Lithuania Finland Sweden United Kingdom Russia
Canada United States Puerto Rico Mexico Dominican Republic Jamaica
Colombia Panama Argentina Brazil Chile
0 2 4 6 8 10 12
1Q
2Q
3Q
4Q
1Q
2Q
3Q
4Q
1Q
2Q
3Q
4Q
1Q
2Q
3Q
4Q
1Q
2Q
3Q
2015
2016
2017
2018
2019
million tonnes
LNG Imports in Southeast and South Asia
Thailand Malaysia Singapore
India Pakistan Bangladesh
-10
-5
0
5
10
15
20
25
30million tonnes
Changes of LNG Imports in the First Nine Months of the Year
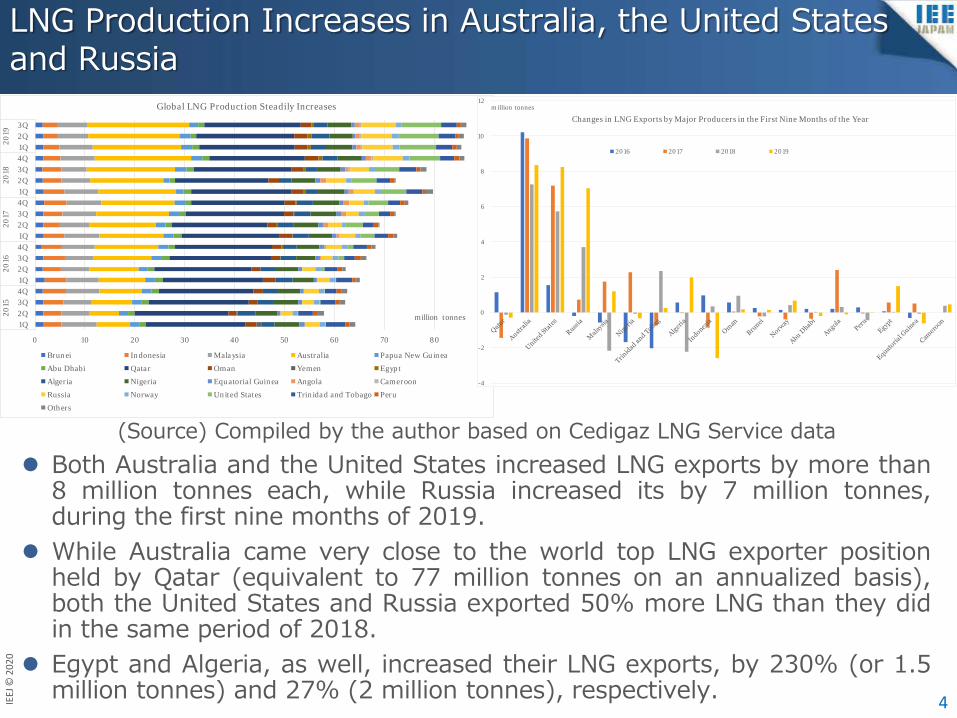
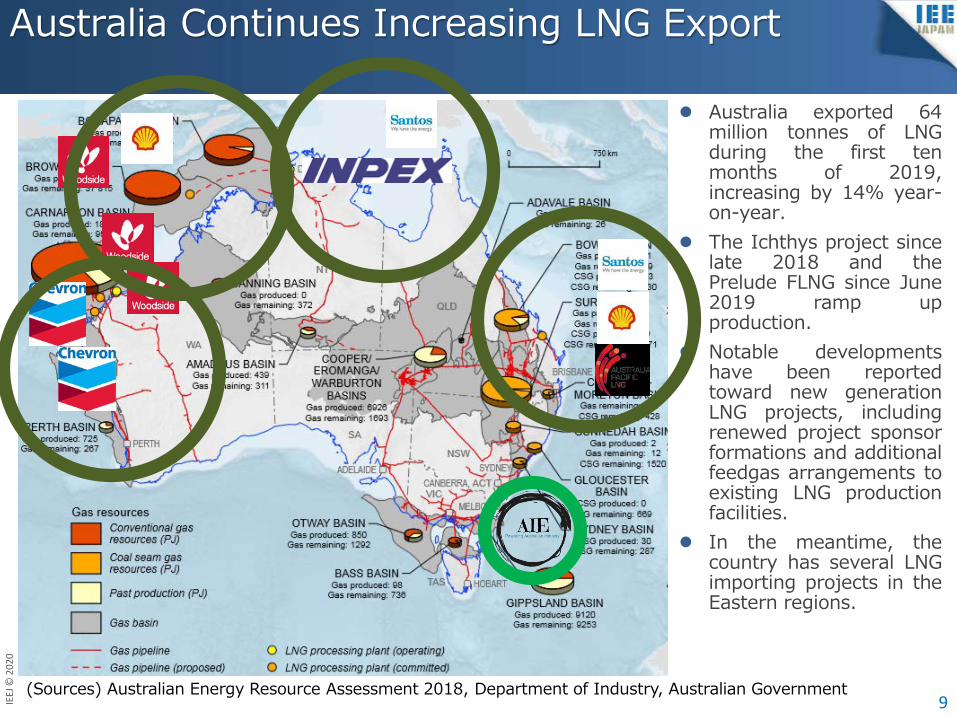
LNG Production Increases in Australia, the United States and Russia
Both Australia and the United States increased LNG exports by more than8 million tonnes each, while Russia increased its by 7 million tonnes,during the first nine months of 2019.
While Australia came very close to the world top LNG exporter positionheld by Qatar (equivalent to 77 million tonnes on an annualized basis),both the United States and Russia exported 50% more LNG than they didin the same period of 2018.
Egypt and Algeria, as well, increased their LNG exports, by 230% (or 1.5million tonnes) and 27% (2 million tonnes), respectively. 4
(Source) Compiled by the author based on Cedigaz LNG Service data
0 10 20 30 40 50 60 70 80 90
1Q2Q3Q4Q1Q2Q3Q4Q1Q2Q3Q4Q1Q2Q3Q4Q1Q2Q3Q
2015
2016
2017
2018
2019
million tonnes
Global LNG Production Steadily Increases
Brunei Indonesia Malaysia Australia Papua New Guinea
Abu Dhabi Qatar Oman Yemen Egypt
Algeria Nigeria Equatorial Guinea Angola Cameroon
Russia Norway United States Trinidad and Tobago Peru
Others
-4
-2
0
2
4
6
8
10
12million tonnes
Changes in LNG Exports by Major Producers in the First Nine Months of the Year
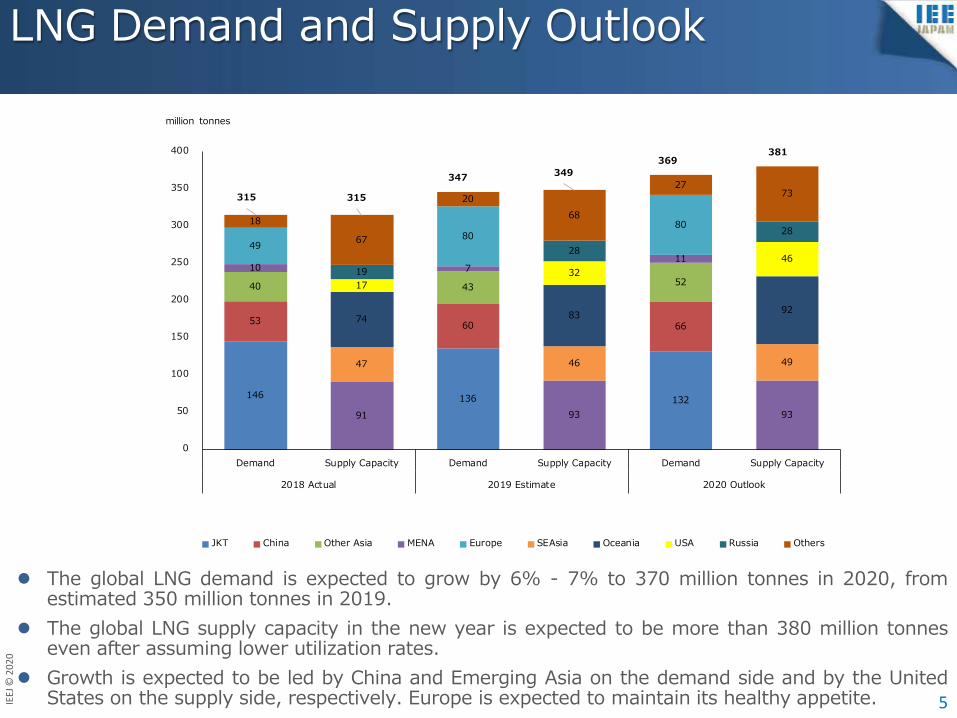
The global LNG demand is expected to grow by 6% - 7% to 370 million tonnes in 2020, fromestimated 350 million tonnes in 2019.
The global LNG supply capacity in the new year is expected to be more than 380 million tonneseven after assuming lower utilization rates.
Growth is expected to be led by China and Emerging Asia on the demand side and by the UnitedStates on the supply side, respectively. Europe is expected to maintain its healthy appetite.
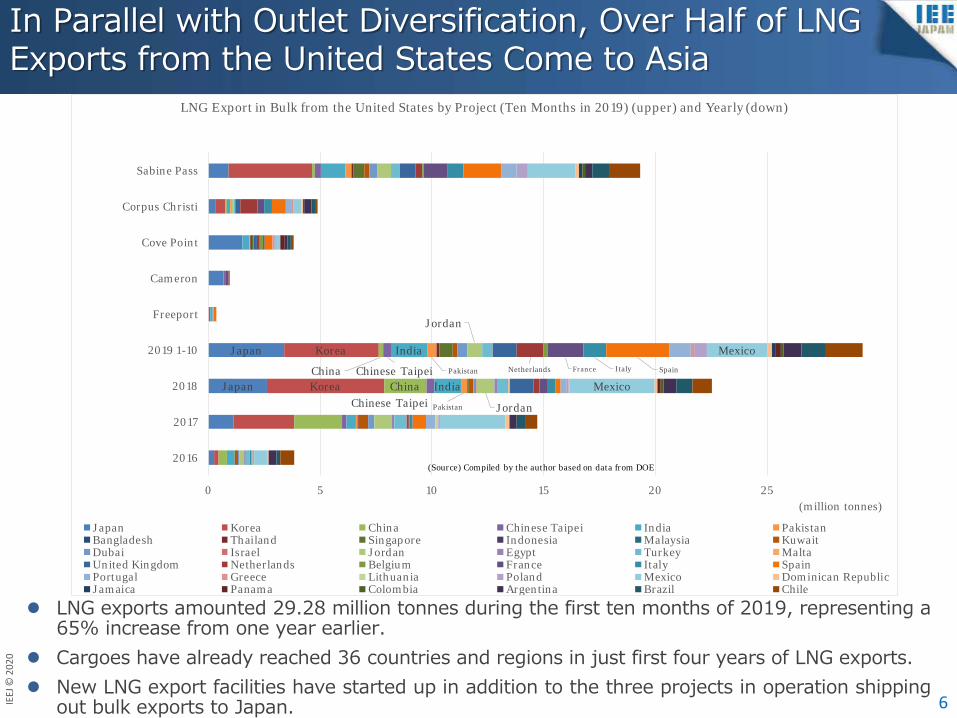
In Parallel with Outlet Diversification, Over Half of LNG Exports from the United States Come to Asia
LNG exports amounted 29.28 million tonnes during the first ten months of 2019, representing a65% increase from one year earlier.
Cargoes have already reached 36 countries and regions in just first four years of LNG exports. New LNG export facilities have started up in addition to the three projects in operation shipping
out bulk exports to Japan. 6
Japan
Japan
Korea
Korea
ChinaChina
Chinese Taipei
Chinese TaipeiIndia
India
Pakistan
Pakistan
Jordan
Jordan
Netherlands France Italy Spain
Mexico
Mexico
0 5 10 15 20 25
2016
2017
2018
2019 1-10
Freeport
Cameron
Cove Point
Corpus Christi
Sabine Pass
(million tonnes)
LNG Export in Bulk from the United States by Project (Ten Months in 2019) (upper) and Yearly (down)
Japan Korea China Chinese Taipei India PakistanBangladesh Thailand Singapore Indonesia Malaysia KuwaitDubai Israel Jordan Egypt Turkey MaltaUnited Kingdom Netherlands Belgium France Italy SpainPortugal Greece Lithuania Poland Mexico Dominican RepublicJamaica Panama Colombia Argentina Brazil Chile
(Source) Compiled by the author based on data from DOE
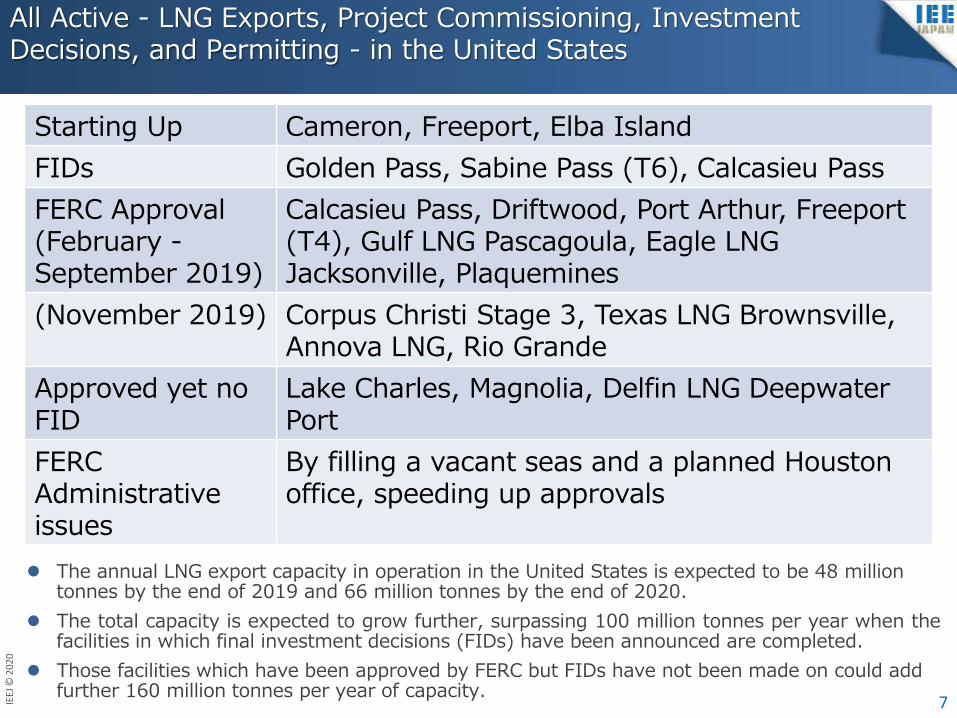
(November 2019) Corpus Christi Stage 3, Texas LNG Brownsville, Annova LNG, Rio Grande
Approved yet no FID
Lake Charles, Magnolia, Delfin LNG Deepwater Port
FERC Administrative issues
By filling a vacant seas and a planned Houston office, speeding up approvals
The annual LNG export capacity in operation in the United States is expected to be 48 million tonnes by the end of 2019 and 66 million tonnes by the end of 2020.
The total capacity is expected to grow further, surpassing 100 million tonnes per year when thefacilities in which final investment decisions (FIDs) have been announced are completed.
Those facilities which have been approved by FERC but FIDs have not been made on could add further 160 million tonnes per year of capacity.
Diversifying Business Models of LNG Export in the United States
8
SPA Model - Project company directly sells LNG volumes• While FOB deals give substantial flexibility to buyers, there have been some DES deals lately.• A unified feedgas arrangement provides the operator an advantage of simplified operation.• IPM (Integrated Production Marketing offered to gas producers)
The LNG project operator buys feedgas from a producer and pays a price netted back from the international market.
Tolling - Liquefaction service arrangement, in which a capacity holder is responsible to sell LNG volumes and procure feedgas supply
• Some Japanese trading houses and utility companies have already participated in such arrangements.• While the model provides a capacity holder with significant operational flexibility, it also requires a certain
level of expertise to operate in the dynamic gas and LNG markets.
Equity Model - Project leading company directly invests in the project entirely on the company’s balance sheet, or accepts equity injections from other companies including other developers or LNG buyers, with LNG lifting and sales commitments distributed based on equity holdings
• The largest LNG players finance a new project entirely on their balance sheets.• New entrants in LNG liquefaction projects try to entice international majors and established LNG buyers
into participating in the new projects.• Established LNG players incorporate volumes from new projects into their global LNG portfolios.• LNG buyers may have additional preferential purchasing allocations from the project leading company in
addition to volumes based on the buyers’ own equity participation.
Russia Increases LNG Exports and Advances Export Pipeline Projects
10
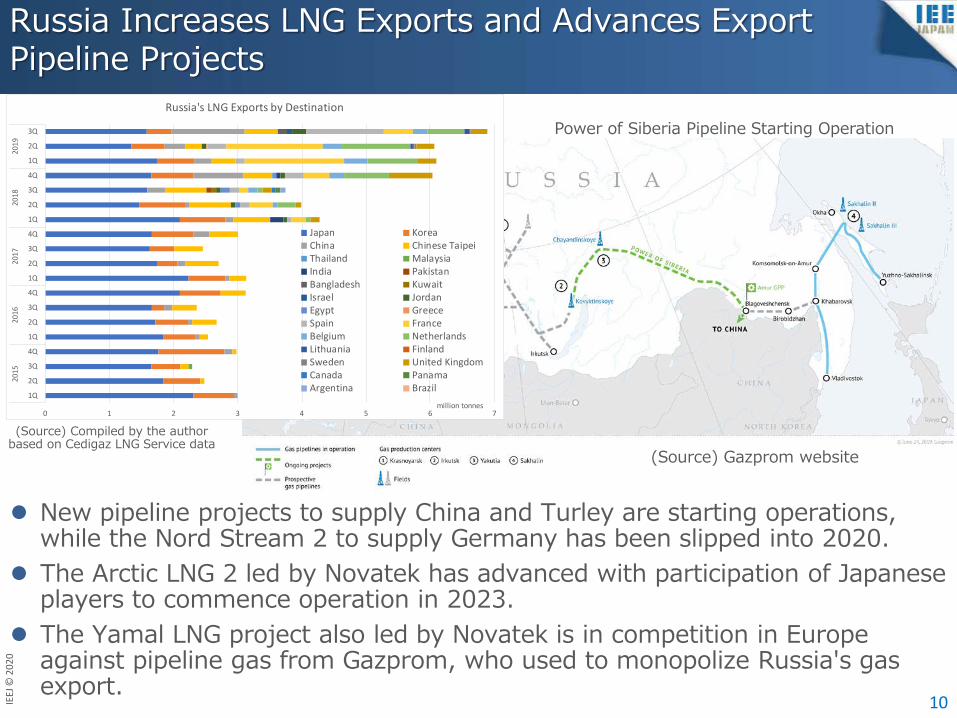
New pipeline projects to supply China and Turley are starting operations,while the Nord Stream 2 to supply Germany has been slipped into 2020.
The Arctic LNG 2 led by Novatek has advanced with participation of Japaneseplayers to commence operation in 2023.
The Yamal LNG project also led by Novatek is in competition in Europeagainst pipeline gas from Gazprom, who used to monopolize Russia's gasexport.
(Source) Compiled by the author based on Cedigaz LNG Service data
Power of Siberia Pipeline Starting Operation
(Source) Gazprom website
0 1 2 3 4 5 6 7
1Q
2Q
3Q
4Q
1Q
2Q
3Q
4Q
1Q
2Q
3Q
4Q
1Q
2Q
3Q
4Q
1Q
2Q
3Q
2015
2016
2017
2018
2019
million tonnes
Russia's LNG Exports by Destination
Japan KoreaChina Chinese TaipeiThailand MalaysiaIndia PakistanBangladesh KuwaitIsrael JordanEgypt GreeceSpain FranceBelgium NetherlandsLithuania FinlandSweden United KingdomCanada PanamaArgentina Brazil
China Continues Expanding Natural Gas Market at Slower Rates than Previous Years
11
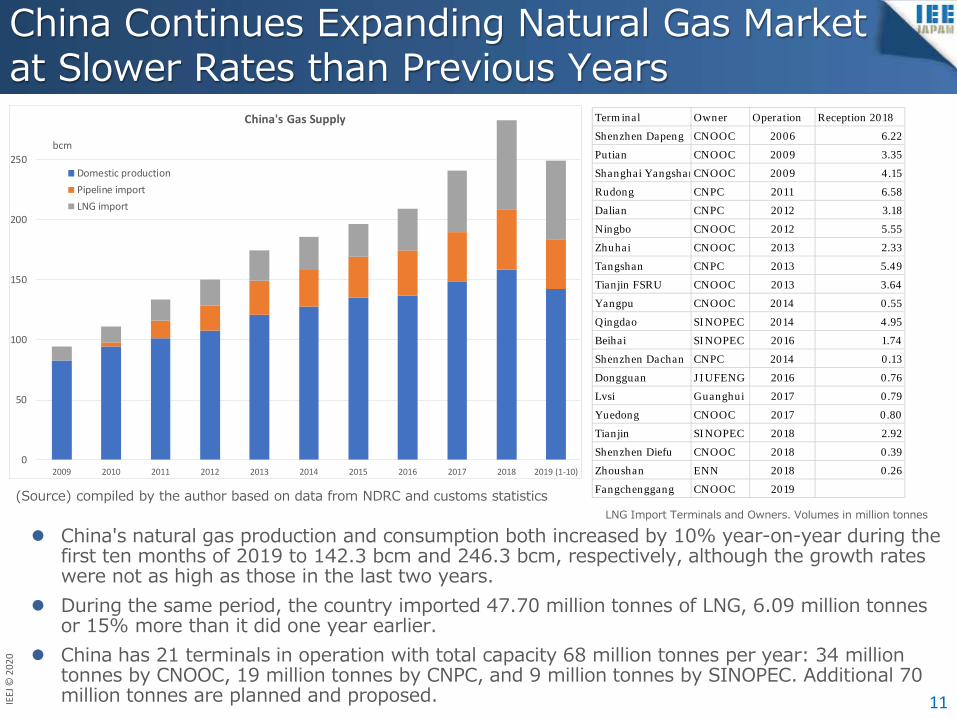
China's natural gas production and consumption both increased by 10% year-on-year during thefirst ten months of 2019 to 142.3 bcm and 246.3 bcm, respectively, although the growth rateswere not as high as those in the last two years.
During the same period, the country imported 47.70 million tonnes of LNG, 6.09 million tonnesor 15% more than it did one year earlier.
China has 21 terminals in operation with total capacity 68 million tonnes per year: 34 milliontonnes by CNOOC, 19 million tonnes by CNPC, and 9 million tonnes by SINOPEC. Additional 70million tonnes are planned and proposed.
(Source) compiled by the author based on data from NDRC and customs statisticsLNG Import Terminals and Owners. Volumes in million tonnes
Europe Increases Natural Gas Demand and Imports Significantly More LNG
12
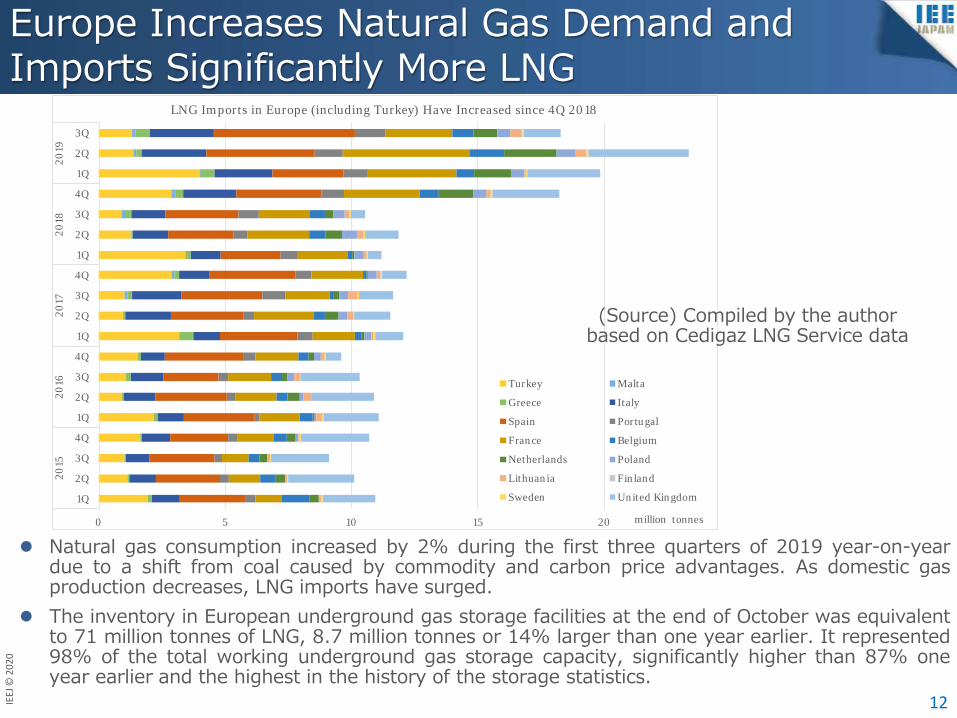
Natural gas consumption increased by 2% during the first three quarters of 2019 year-on-yeardue to a shift from coal caused by commodity and carbon price advantages. As domestic gasproduction decreases, LNG imports have surged.
The inventory in European underground gas storage facilities at the end of October was equivalentto 71 million tonnes of LNG, 8.7 million tonnes or 14% larger than one year earlier. It represented98% of the total working underground gas storage capacity, significantly higher than 87% oneyear earlier and the highest in the history of the storage statistics.
0 5 10 15 20
1Q
2Q
3Q
4Q
1Q
2Q
3Q
4Q
1Q
2Q
3Q
4Q
1Q
2Q
3Q
4Q
1Q
2Q
3Q
2015
2016
2017
2018
2019
million tonnes
LNG Imports in Europe (including Turkey) Have Increased since 4Q 2018
Turkey Malta
Greece Italy
Spain Portugal
France Belgium
Netherlands Poland
Lithuania Finland
Sweden United Kingdom
(Source) Compiled by the author based on Cedigaz LNG Service data
Dependence on Gas Imports Went Up to Over Half of Domestic Demand During the Last Ten Years in the United Kingdom
13
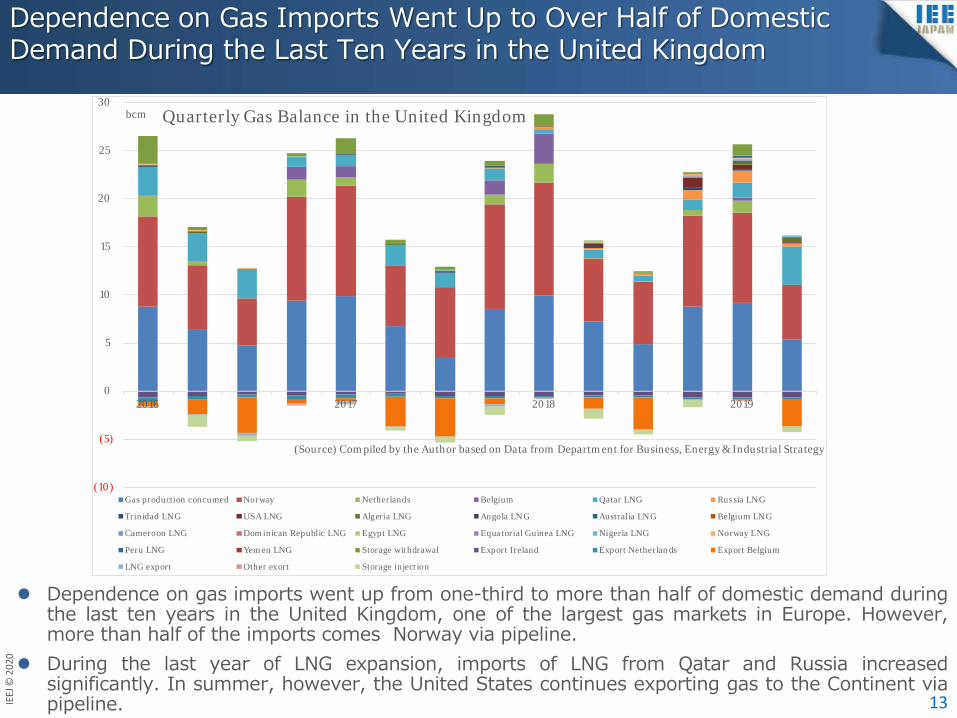
Dependence on gas imports went up from one-third to more than half of domestic demand duringthe last ten years in the United Kingdom, one of the largest gas markets in Europe. However,more than half of the imports comes Norway via pipeline.
During the last year of LNG expansion, imports of LNG from Qatar and Russia increasedsignificantly. In summer, however, the United States continues exporting gas to the Continent viapipeline.
(10)
(5)
0
5
10
15
20
25
30
2016 2017 2018 2019
bcm
(Source) Compiled by the Author based on Data from Department for Business, Energy & Industrial Strategy
Quarterly Gas Balance in the United Kingdom
Gas production concumed Norway Netherlands Belgium Qatar LNG Russia LNG
Trinidad LNG USA LNG Algeria LNG Angola LNG Australia LNG Belgium LNG
The Netherlands Decreases Gas Production, While It Continues Moving Gas Volumes Around
14
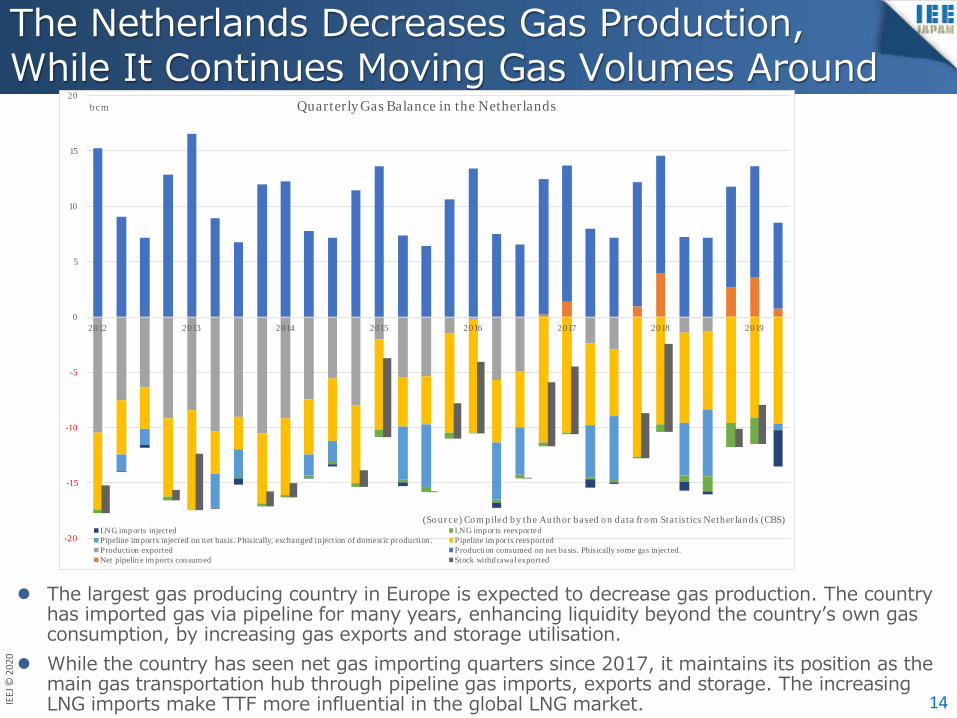
The largest gas producing country in Europe is expected to decrease gas production. The countryhas imported gas via pipeline for many years, enhancing liquidity beyond the country’s own gasconsumption, by increasing gas exports and storage utilisation.
While the country has seen net gas importing quarters since 2017, it maintains its position as themain gas transportation hub through pipeline gas imports, exports and storage. The increasingLNG imports make TTF more influential in the global LNG market.
-20
-15
-10
-5
0
5
10
15
20
2012 2013 2014 2015 2016 2017 2018 2019
bcm
(Source) Compiled by the Author based on data from Statistics Netherlands (CBS)
Quarterly Gas Balance in the Netherlands
LNG imports injected LNG imports reexportedPipeline imports injected on net basis. Phisically, exchanged injection of domestic production. Pipeline imports reexportedProduction exported Production consumed on net basis. Phisically some gas injected.Net pipeline imports consumed Stock withdrawal exported
A Significant Gap Between Spot LNG and Crude Oil Prices, as well as Crude Linked LNG prices
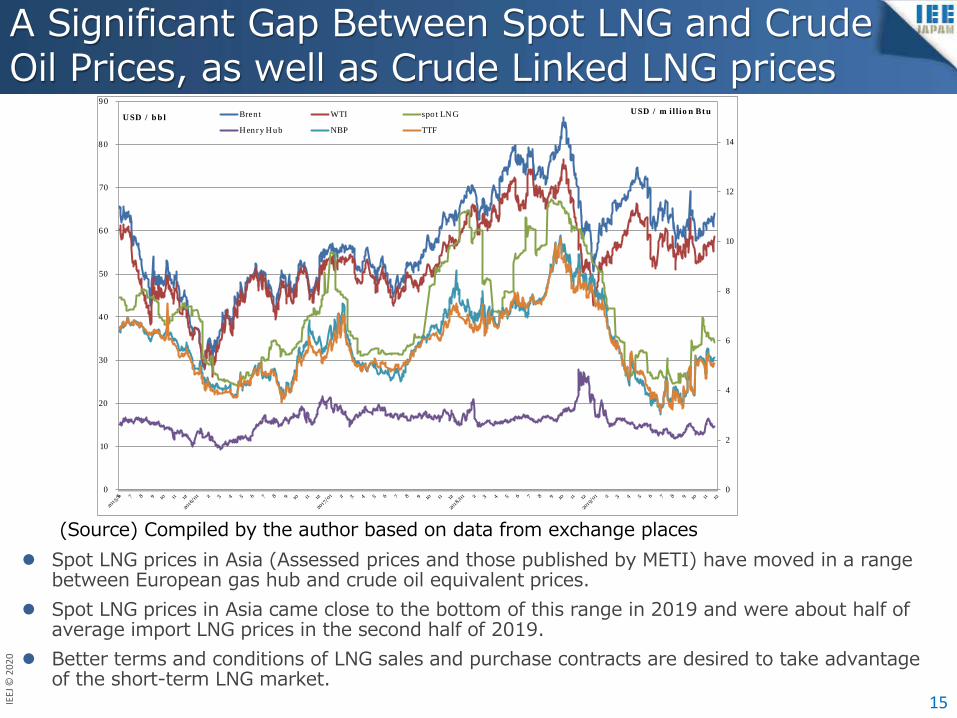
(Source) Compiled by the author based on data from exchange places Spot LNG prices in Asia (Assessed prices and those published by METI) have moved in a range
between European gas hub and crude oil equivalent prices. Spot LNG prices in Asia came close to the bottom of this range in 2019 and were about half of
average import LNG prices in the second half of 2019. Better terms and conditions of LNG sales and purchase contracts are desired to take advantage
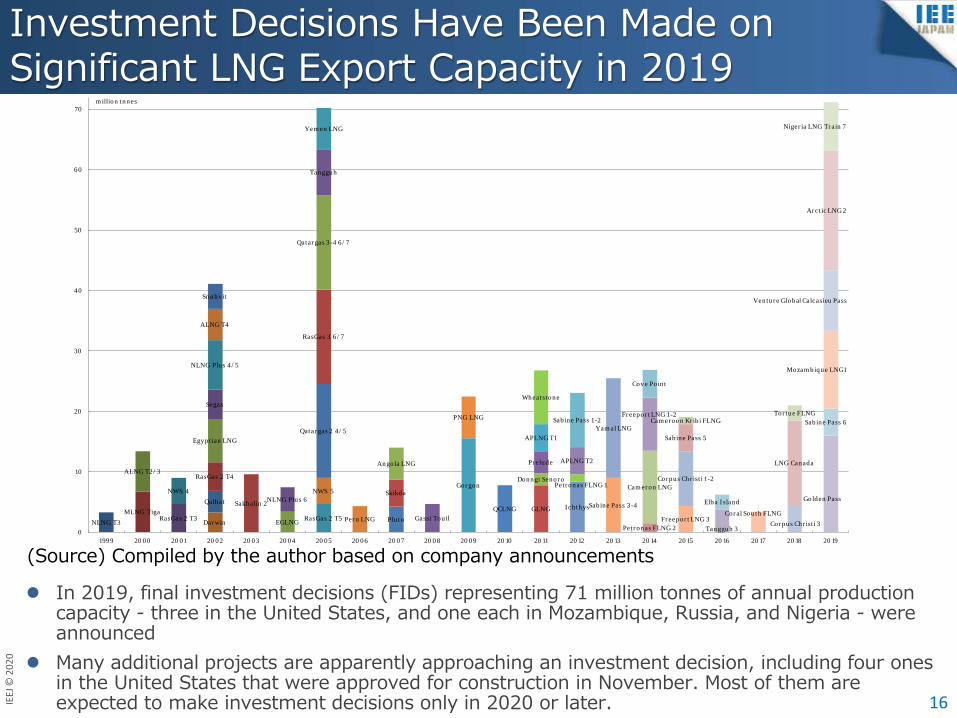
Investment Decisions Have Been Made on Significant LNG Export Capacity in 2019
(Source) Compiled by the author based on company announcements
In 2019, final investment decisions (FIDs) representing 71 million tonnes of annual productioncapacity - three in the United States, and one each in Mozambique, Russia, and Nigeria - wereannounced
Many additional projects are apparently approaching an investment decision, including four onesin the United States that were approved for construction in November. Most of them areexpected to make investment decisions only in 2020 or later. 16
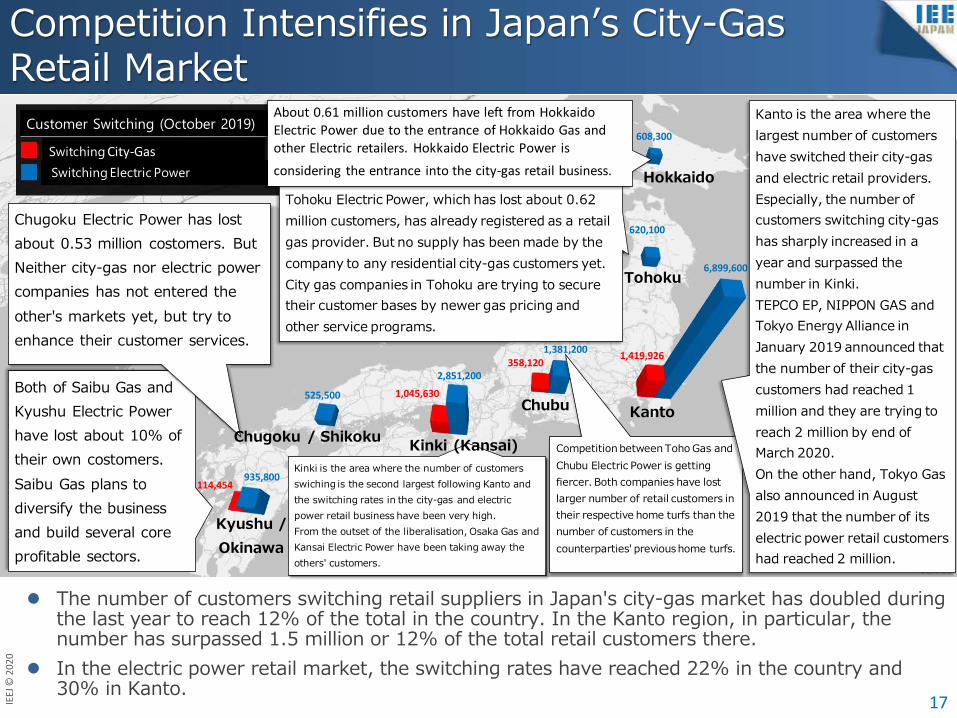
Competition Intensifies in Japan’s City-Gas Retail Market
The number of customers switching retail suppliers in Japan's city-gas market has doubled duringthe last year to reach 12% of the total in the country. In the Kanto region, in particular, thenumber has surpassed 1.5 million or 12% of the total retail customers there.
In the electric power retail market, the switching rates have reached 22% in the country and30% in Kanto.
17
608,300
525,500
2,851,200
1,381,200
6,899,600
620,100
935,800
1,419,926358,120
1,045,630
114,454
Both of Saibu Gas and Kyushu Electric Power have lost about 10% of their own costomers.Saibu Gas plans to diversify the business and build several core profitable sectors.
Chugoku Electric Power has lost about 0.53 million costomers. But Neither city-gas nor electric power companies has not entered the other's markets yet, but try to enhance their customer services.
Kinki is the area where the number of customers swiching is the second largest following Kanto and the switching rates in the city-gas and electric power retail business have been very high. From the outset of the liberalisation, Osaka Gas and Kansai Electric Power have been taking away the others' customers.
Competition between Toho Gas and Chubu Electric Power is getting fiercer. Both companies have lost larger number of retail customers in their respective home turfs than the number of customers in the counterparties' previous home turfs.
Hokkaido
Tohoku
KantoChubu
Kinki (Kansai)Chugoku / Shikoku
Kyushu / Okinawa
Tohoku Electric Power, which has lost about 0.62 million customers, has already registered as a retail gas provider. But no supply has been made by the company to any residential city-gas customers yet.City gas companies in Tohoku are trying to secure their customer bases by newer gas pricing and other service programs.
Kanto is the area where the largest number of customers have switched their city-gas and electric retail providers. Especially, the number of customers switching city-gas has sharply increased in a year and surpassed the number in Kinki.TEPCO EP, NIPPON GAS and Tokyo Energy Alliance in January 2019 announced that the number of their city-gas customers had reached 1 million and they are trying to reach 2 million by end of March 2020.On the other hand, Tokyo Gas also announced in August 2019 that the number of its electric power retail customers had reached 2 million.
About 0.61 million customers have left from Hokkaido Electric Power due to the entrance of Hokkaido Gas and other Electric retailers. Hokkaido Electric Power is considering the entrance into the city-gas retail business.
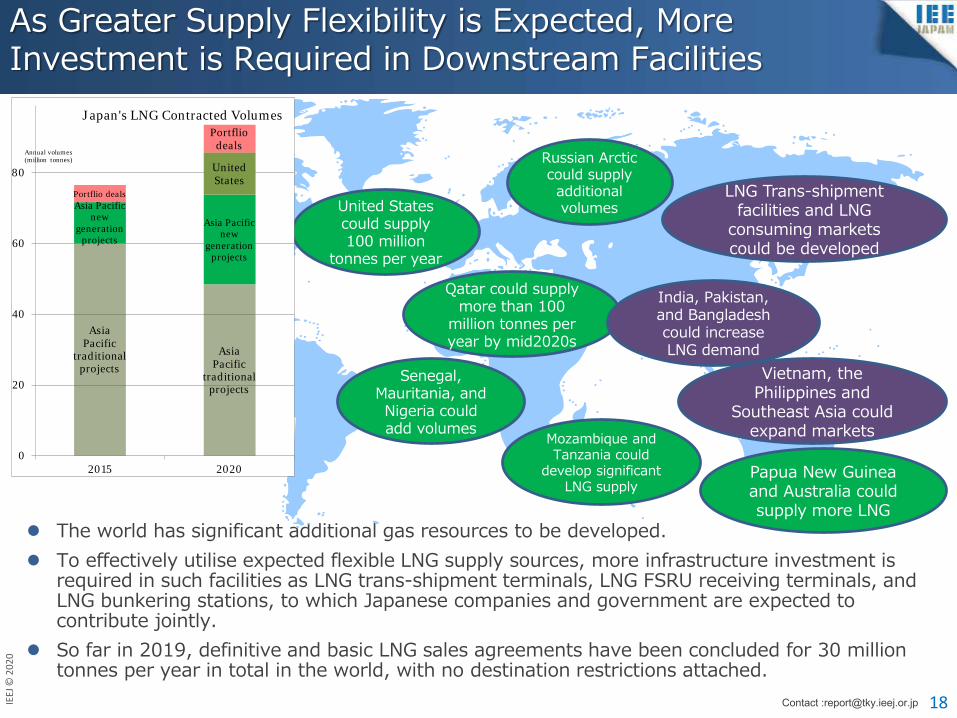
As Greater Supply Flexibility is Expected, More Investment is Required in Downstream Facilities
The world has significant additional gas resources to be developed. To effectively utilise expected flexible LNG supply sources, more infrastructure investment is
required in such facilities as LNG trans-shipment terminals, LNG FSRU receiving terminals, andLNG bunkering stations, to which Japanese companies and government are expected tocontribute jointly.
So far in 2019, definitive and basic LNG sales agreements have been concluded for 30 milliontonnes per year in total in the world, with no destination restrictions attached.
18
United States could supply 100 million
tonnes per year
Russian Arctic could supply additional volumes
Senegal, Mauritania, and Nigeria could add volumes
Mozambique and Tanzania could
develop significant LNG supply
Qatar could supply more than 100
million tonnes per year by mid2020s
Papua New Guinea and Australia could supply more LNG
Vietnam, the Philippines and
Southeast Asia could expand markets
India, Pakistan, and Bangladesh could increase LNG demand