21
IBM Sterling / © 2020 IBM Corporation 2020 Holiday Peak Readiness IBM Order Management SaaS

IBM Sterling / © 2020 IBM Corporation
2020 Holiday Peak Readiness
IBM Order Management SaaS

Speakers
Jaime ShoemakerSenior Onboarding Specialist –Order Management on Cloud
IBM Sterling / © 2019 IBM Corporation
Mike CallaghanProgram Director –Sterling Support
John RawlsSenior Manager –Order Management Support
Aparna SubramanianTechnical Lead –Order Management Support
Shoeb BihariTechnical Lead –Order Management Support
JS
Paresh VinaykyaSenior Accelerated Value Specialist

Our IBM Sterling Support mission is to partner
together to proactively position you for success,
quickly mitigate any issue that does arise.
IBM Sterling / © 2020 IBM Corporation
MC

Ensure Peak Day Excellence
✓ Regular standups across technical teams to quickly identify and address any new issues
✓ Monitoring Squad proactively review response / utilization KPIs to detect early sign of trouble
✓ Mobilization of cross-functional SWAT team with for rapid engagement 24x7
✓ Internal Executive awareness and readout of client activities and issues to ensure necessary Support
Ensure Client Readiness
✓ Questionnaire to understand client prep, projected volume, anticipated risks: ibm.biz/OMS-EventReadiness-Qs
✓ Proactive Review internally to ensure each client aligned with best practices for performance, stability
✓ Deliver recommendations and best practices thru webcast, blogs, individual 1-1 comebacks (as needed); offer additional IBM engagement
✓ Partner with clients as they implement and test best practices, prioritizing blocking issues
Ensure IBM Readiness
✓ Ongoing Platform improvements targeting performance, stability, serviceability
✓ Review workload projections and ensure hardware can meet expected capacity
✓ Continuous improvements to Monitoring, Alerting, Runbooks to ensure quick issue detection/mitigation
✓ Regular internal interlocks to review accounts, pervasive issues, prioritize backlog as needed
IBM Sterling Holiday Readiness Program
Identify potential risks across
product, platform, clients
Track at-risk clients via
internal IBM CSPO Watchlist
Prioritize, engage expert resources
to mitigate issues, risk
Excellence thru regular cadence, communication
MC

OMoC Platform Improvements
IBM OMoC continues to prioritize performance, stability, serviceability, and have released significant improvements within the 20.x platform.
Complete list of improvements can be found here.What’s planned for subsequent release can be found here.
Critical Fixes
• MQ, Liberty, DB2 stack upgrade
• DB2 -805 Too many open statements during Inventory Adjustments
• Application capacity availability enhanced
Self-Service
• JVM Metric Dashboards for Application server and Agent/integration server performance
• Self-manage OMoC Notification distribution
• Enhanced DB Performance Dashboard (Coming soon)
IBM Sterling / © 2019 IBM Corporation
Optimized Performance and Stability
• Reduce User Activity Contention during Authentication
• Optimized Order history purge performance
• Data Extract resiliency enhancements
• Ad-hoc indexes maintained during deployment
• New alerting for MQ connection and Queue depth
• Continuous improvement of monitoring, alerting, and internal runbooks based on prior critical incidents
MC

COVID-19 Impact?
New channels used for order fulfillment including BOPIS, SFS?
Significant increase in nodes in configured distribution groups?
2020 Readiness Questionnaire What’s New?
Any new integrations endpoints?
Additional real-time inventory calls?
Key Milestones
Brand, geo, channels or functionalities are to launch before peak?
How do 20.3, peak testing, code freeze align?
IBM Sterling / © 2020 IBM Corporation
Test Plans?
Able to achieve your SLAs with projected peak volume?
Tests representative of production data, volumes, concurrency?
IBM OMoC team recently released our annual Holiday Readiness Questionnaire.
Take the opportunity for self-assessment and jumpstart the conversation with IBM team about your concerns and risks!
2020 Holiday Readiness Questionnaire ibm.biz/OMS-EventReadiness-Qs
MC

MQ Configuration
✓ Validate MQ settings, avoid long-running transactions
✓ Ensure client has necessary queue-depth alerts in place
Agent/Server Config
✓ Optimize servers config; validate reference caching config; disable non-critical processes during peak
✓ Review and tune HotSKU and OLA config; identify and configure potential peak hot or contentious items
✓ Validate RTAM configuration, full-sync mode optimization and scheduling during peak, resource utilization
Database & Purge
✓ Optimize long-running or expensive queries
✓ Optimize schedule and duration of DB maintenance; disable maintenance during peak
✓ Validate transactional table sizes to ensure necessary purges being run regularly, but disabled during peak
Proactive Configuration Review
IBM Sterling / © 2019 IBM Corporation
IBM OMoC team is conducting a proactive review of configurations and activities to ensure each clientis aligned to current best practices
Are YOU ready? Self-assess your readiness across key areas
TIP! For details on existing best practices, see 2019 replay hereand presentation here!
MC

MQ Configuration
IBM Sterling / © 2019 IBM Corporation
Recommendations below are to help mitigate risk against MQ message creation and consumption , which will only magnify under peak load
1. Review SST Performance dashboard and address any JMS-related exceptions before peak (see KC link)
2. IBM will ensure MaxChannels is set to new default of 5000
3. Avoid using message Selector instead have dedicated internal/external queues.
4. Requests to IBM OMoC team for MQ config changes should be supported by results/validation from performance testing and tuning exercise
5. Avoid long running MQ transactions (hitting default MaxUncommittedMsglimit likely indicates too many long running transactions)
6. Review MessageBufferPutTime relative to ExecuteMessageCreated statistic from YFS_STATISTICS_DETAIL table for any slowness
7. Leverage Self-Serve Tool to find current MQ queue depth
8. Check for queues with very high queue depth(> 15000)
• Typically queues with large queue depth indicates the backlog and requires immediate action to clear the backlog
9. Ensure JMS properties yfs.jms.sender.multiThreaded & yfs.agent.bulk.sender.enabled are enablement
10. Engage OMoC Support to generate alerts for specific queues at particular depth threshold
READ OUR BLOG! MQ on OMoC - gearing up for the peak
Key Lessons Learned
• MQ Persistent Connection usage and importance of retry
• JMS Connections and the potential impact on external system
• MQ Failover or network event does terminate in-flight and idle connection
• Understand behavior of applications connecting to IBM MQ when persistent connection are terminated
• For custom service, ensure JMS Sender properties are set correctly
• Retry Interval (milliseconds) 100 ms
• Number of Retries – atleat 3 retries.
❑ Are you aware of, and leveraging the new SST performance dashboard?
❑ What is your current MQ connection / Max Channels high watermark in use?
❑ How does this compare to MaxChannels? Do you have sufficient buffer?
❑ Are you receiving alerts for max queue depth for all relevant queues?
❑ Are you checking in on queues with very high queue depth (>15000)
Are You READY?
AS

Agent/Server Configuration Hot SKU / OLA
Reference Data Cache
The following configurations have repeatedly been recommended to clients to help address known performance, stability, scalability issues:
1. Tune memory parameters based on analysis from GC logs (KC link )
• For NextGen platform, ensure appropriate profile is selected based on testing: Balanced, Compute, Memory
2. Optimize schedule of batch processes around expected peak loads
• Ex. Complete Inventory Sync before the peak hours begin; Add more JVMs in the wee hours of the peak day and complete the process well before the rush
3. Disable non-critical agents to reduce unnecessary contention and usage of resources by disabling any processes that are not business-critical during peak
1. Disable IBA which is known to be intrusive, and best to avoid peak usage
2. Explore option of disabling non-critical Order/Shipment Monitor rules
3. Configure and run Close Order agent before peak season (link)
4. Avoid having multiple agent criteria in same agent configuration; makes for easier troubleshooting.
5. Ensure naming convention of agent/integration server accurately represent function which it performs; makes for easier troubleshooting and assessing the impact
6. Reduce message payload by optimizing API, event templates, pull only required data (set TotalNumberOfRecords to restrict output)
• Caching a entity reduces DB overhead, stretches JVM memory foot print! Enable caching for a DB table only after careful evaluation.
• Performance issues or network limits may surface with excessive RMI calls with frequent refresh of reference data cache
• Monitor application logs for frequent cache refreshes, specifically look for YFS_INVENTORY_NODE_CONTROL, YPM_PRICE_LIST_LINE, YFS_ITEM, YFS_ITEM_SHIP_NODE, and either increase cache size (for relatively smaller tables that are reasonable to fit into memory), or disable the cache altogether (for very large table sizes) via customer overrides property file or via System Management console (SMA)
• Details understanding caching and tuning: see Technote
1. Hot SKU & OLA feature are enabled by default since OMoC v19.1.
2. Review and tune Hot SKU factory values based on expected order profile. (KC Link)
3. Review INV_INVENTORY_ITEM_LOCK table during performance tests and pre/post sales to assess the level of contention and items involved.
4. With OLA enabled, there will be granular level of locking on YFS_INVENTORY_DEMAND record (item, ship node, demand level)
• During peak time, avoid running inventory synchronization which updates YFS_INVENTORY_DEMANDalong side YFS_INVENTORY_SUPPLY
• Configure RTAM monitoring to generate alert to replenish the inventory or mark the item unavailable
AS

Real Time Availability Monitor (RTAM)
IBM Sterling / © 2019 IBM Corporation
Inventory Visibility (IV)
IBM suggests you take on the following activities proactively prior to peak season:
1. Run a round of supply sync to ensure supply picture is updated at IV prior to the peak sales
2. Ensure that the front end has updated snapshot of availability by calling publish_all snapshot a few hours prior to peak
sales
– Consider running a test on pre-prod to see how long this takes based on the volume of items
3. Run DG sync a day or two prior to the peak sales, Use syncDgAvailability = Y as part of Update Distribution
Group
4. Plan ahead to avoid making changes to DGs at peak time.
5. Set safety stock for items , this helps maintain a buffer inventory to ensure the channels do not over-promise
AS
1. Full sync mode is expensive, should be scheduled only during low-traffic hours (ie. during night). For peak season , careful planning needs to be done around business events and planned traffic
2. Preferred methods to push inventory availability out to external system are Activity-based and Quick-sync mode
3. For Activity-based RTAM, validate activities created by node capacity changes
4. Optimize RTAM performance with this high level configuration:
• yfs.jms.sender.multithreaded
Enable when publishing alerts to external queue; allows RTAM agent threads to publish message parallelly
• yfs.yfs.rtam.readInventoryForOnlyActivityNodes
Implicitly enabled based on conditions:
a. Running activity based RTAM
b. Monitoring item availability at node level and network level.
c. Property not explicitly disabled (i.e. yfs.rtam.readInventoryForOnlyActivityNodes=N)
d. Monitored items is not a bundle.
e. All DGs at network level are monitored at node level
• Number of Records To Buffer can be increased to 25K in reference to MessageBufferPutTime
• Disable Compute availability information with Ship Dates for RTAM flag (COMPUTE_AVAILABILITY_FOR_RTAM = N)
if availability information is not required.
• Optimize Event template to remove unnecessary attributes

1. Resource/Hardware sizing based on segment profile, but is validated as OUTCOME of performance testing, not a replacement for it
2. Database is common bottleneck, not due to capacity, but untuned queries, missing indexes, competing processes, unqualified end-user searches
3. Underlying config data has significant impact on performance, including database query execution plans, inventory sourcing rule evaluation
4. Accumulation of transactional data over long periods of time (and failure to purge as possible), may degraded query performance
5. Item distribution and commonality must reflect realistic peak load; high-demand / hot items (free-gift) may significantly impact concurrent processes
6. Composition of a custom service (Service definition framework) can lead to inefficient execution or potential lock contention, reducing throughput
7. Understanding queueing/de-queueing rates to align with business SLA / expectation (ie. create order, confirm shipment); SI needs to know when there is an issue to intervene / troubleshoot (ie. particular queue depth)
8. Agent/integration server throughput must be sufficient, but remain below max resource allocation; varies on number of instances, server profile
9. Important to understand / validate impact to upstream application (eComm) if specific synchronous calls into OMS slow or become unavailable
• COVID-19 led to more stores enabled for BOPIS which made DG significantly larger, which led to more time for synchronous inventory availability calls; similar scenarios where client had to split nodes in DG to improve throughput
• Rapid ramp up of in-store associates led to several unqualified searches in Store and Call Center apps which caused significant overall degradation
• multiAPI made 8 successive API calls led to poor response, needed to be refactored to use asynchronous requests (via MQ to drop message on queue)
• Custom service call to getOrderList API was missing OHK in input, each invocation caused fetch of 5K records which led to a crash, had to limit records
• Spawning additional (untuned) instances of agent to try and improve throughput let to exhaustion of resource allocation available
• Needed to throttle down instances/threads of agent to reduce concurrency contention issues (Create/Schedule/Release) and optimize throughput
• Gradual memory leak led to out-of-memory condition after a couple days; similarly untuned heap led to excessive GC overhead, high CPU, slowness
• Daily manual processing of orders via java client against single JVM bypassed load balancer and overwhelmed JVM to OOM/crash
• Upstream eComm site was unable to gracefully handle a short period of unavailability from backend OMS and took hours to recover
To best position for success on the OMS platform, it is important to understand how your application handles various scenarios known to challenges performance or stability. Testing in pre-production with data/workloads representative of production enables ability identify and address issues without impact to production business and operations.
Real Scenarios (Real impact…)
MC
Position for Peak Success

Performance Testing Guidance
Performance testing is an art, but a mandatory one! It is imperative to vet out issues in advance on pre-production load testing, rather than wait for it to surface as a business critical production issue!
Refer to Knowledge Center for detailed Tuning and performance guidance.
1. Projected peak volumes – Ensure business and IT are in sync on expected peak loads to ensure planned tests are accurate. Test for forecast of peak orders, orderlines, common cart skus/items, and real time inventory calls
2. Representative Combination Tests – Assemble components to reflect real time DATA, scenarios and run in parallel to ensure adherence with NFR; Stage data for various components and run them under full load (ie. Create + Schedule + Release+ Create Shipment + Confirm Shipment + Inventory Snapshot (IV) )
3. Agent and integration servers – ensure asynchronous batch processing components are tested in isolation and in combination with broader workload; ensure to tune agents (processes, threads, heap size) to meet expected peak SLAs/NFRs on throughput
4. Test Failure Scenarios – validate resiliency of overall system and operations, ensuring graceful recovery if front-end channel (web, mobile, Call Center, Store, EDI, JMS), backend OMS, or external integration endpoints fail. Include ‘kill switches’ in any components that can be disabled to avoid magnifying an isolated issue into system wide one, especially for any synchronous calls.
5. Confirm Peak days and Hours - Share any specific key dates or max burst times with IBM Support, including code freezes, flash sales.
6. Coordinate with IBM - Inform IBM (CSM/Support) in advance when load tests are planned if any data or diagnostics (such as against Database) are needing to be captured; IBM can also then review internal metrics and response in parallel. → Inform IBM in advance of major configuration changes (sourcing rule: Increase in SFS due to COVID).
Ensure you are clear on the actuals vs. projections of to facilitate accurate tests, and for IBM OMoC team to validate sufficient resources
❑ Are you leaving sufficient buffer between load tests and holiday freeze?
❑ Are performance tests representative of volumes (order lines, real time sync calls), plus:
▪ Asynchronous batch processes (agent and integration servers)
▪ Store (Pick, Pack, Ship) and Call Center concurrent user activity
❑ Do your performance test runs cover any potential common cart item, to determine if further configuration changes may be needed to avoid contention:
▪ Realistic inventory availability picture
▪ Orderlines to include expected commonality of free gift / hot items
❑ Performance validation of initial data load related to go-live. (Migrating Orders, Catalog, etc)
❑ Initial Inventory synchronization to IV.
❑ Will the endpoints external to OMoC be able to scale (rate limits, performance)?
❑ Adoption of Self Serve Tools & subscription to alert and notification.
Metric 2019 Peak 2020 YTD Peak 2020 Proj. Peak 2020 Load Test Peak
Orders / hour (max) ? ? ? ?
Orderlines / hour (max) ? ? ? ?
Get Inventory Availability ? ? ? ?
Reserve Inventory ? ? ? ?
Inventory Adjustment trickle ? ? ? ?
Inventory Adjustment burst ? ? ? ?
Concurrent Store/CC users ? ? ? ?
MC
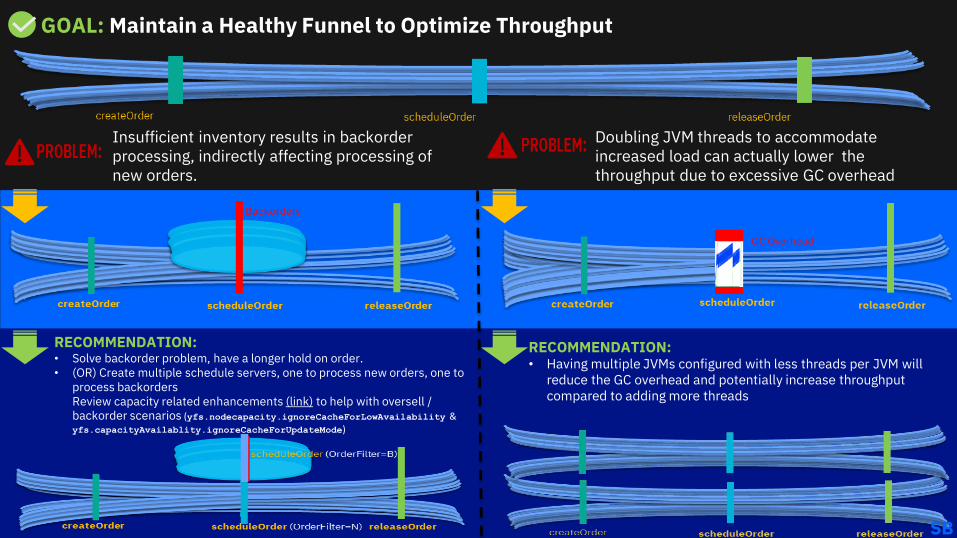
RECOMMENDATION: • Solve backorder problem, have a longer hold on order. • (OR) Create multiple schedule servers, one to process new orders, one to
process backordersReview capacity related enhancements (link) to help with oversell / backorder scenarios (yfs.nodecapacity.ignoreCacheForLowAvailability & yfs.capacityAvailablity.ignoreCacheForUpdateMode)
RECOMMENDATION:• Having multiple JVMs configured with less threads per JVM will
reduce the GC overhead and potentially increase throughput compared to adding more threads
Insufficient inventory results in backorder processing, indirectly affecting processing of new orders.
SB
GOAL: Maintain a Healthy Funnel to Optimize Throughput
Doubling JVM threads to accommodate increased load can actually lower the throughput due to excessive GC overhead
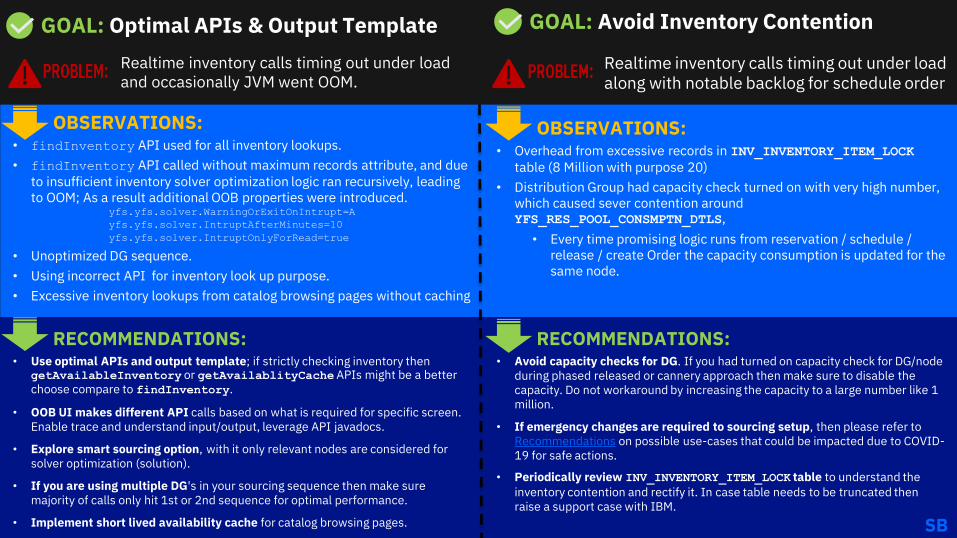
GOAL: Optimal APIs & Output Template
Realtime inventory calls timing out under load along with notable backlog for schedule order
OBSERVATIONS:• Overhead from excessive records in INV_INVENTORY_ITEM_LOCK
table (8 Million with purpose 20)
• Distribution Group had capacity check turned on with very high number, which caused sever contention around YFS_RES_POOL_CONSMPTN_DTLS,
• Every time promising logic runs from reservation / schedule / release / create Order the capacity consumption is updated for the same node.
Realtime inventory calls timing out under load and occasionally JVM went OOM.
OBSERVATIONS:• findInventory API used for all inventory lookups.
• findInventory API called without maximum records attribute, and due to insufficient inventory solver optimization logic ran recursively, leading to OOM; As a result additional OOB properties were introduced.
yfs.yfs.solver.WarningOrExitOnIntrupt=A
yfs.yfs.solver.IntruptAfterMinutes=10
yfs.yfs.solver.IntruptOnlyForRead=true
• Unoptimized DG sequence.
• Using incorrect API for inventory look up purpose.
• Excessive inventory lookups from catalog browsing pages without caching
RECOMMENDATIONS:• Avoid capacity checks for DG. If you had turned on capacity check for DG/node
during phased released or cannery approach then make sure to disable the capacity. Do not workaround by increasing the capacity to a large number like 1 million.
• If emergency changes are required to sourcing setup, then please refer to Recommendations on possible use-cases that could be impacted due to COVID-19 for safe actions.
• Periodically review INV_INVENTORY_ITEM_LOCK table to understand the
inventory contention and rectify it. In case table needs to be truncated then raise a support case with IBM.
RECOMMENDATIONS:• Use optimal APIs and output template; if strictly checking inventory then
getAvailableInventory or getAvailablityCacheAPIs might be a better choose compare to findInventory.
• OOB UI makes different API calls based on what is required for specific screen. Enable trace and understand input/output, leverage API javadocs.
• Explore smart sourcing option, with it only relevant nodes are considered for solver optimization (solution).
• If you are using multiple DG's in your sourcing sequence then make sure majority of calls only hit 1st or 2nd sequence for optimal performance.
• Implement short lived availability cache for catalog browsing pages.
GOAL: Avoid Inventory Contention
SB

GOAL: Avoid Intrusive Store/Call Center Search
Unable to take action on certain orders via Call Center.
OBSERVATIONS:• Excessive YFS_ORDER_HEADER for update queries in lock-wait.
• Single connection (Application Handle) blocking most of the queries, based on javacore it was identified that the thread holding the lock was in network socket read communicating to third party system. Exception stack indicated that this was manual multiAPI call.
• It was identified that multiAPI call was executed to settled payment for 100+ orders.
• Server had to be restarted to mitigate the issue.
Frequent DB IO utilization spikes with cascading impact to other critical transaction.
OBSERVATIONS:• Queries causing high IO were from APIs like getShipmentList,
getShipmentDetails and getOrderList executed via store and call center interface
• Queries were bad because either they were missing shipnode condition or searched by uncommon YFS_PERSON_INFO attribute or attribute value using like.
• Mitigated issue by adding indexes for common YFS_PERSON_INFOattributes, and corrected the resource permissions for store user such that enterprise and shipnode got stamped implicitly.
RECOMMENDATIONS:
• External synchronous call from UE must have timeout set.
• Avoid batch processing with synchronous calls, as a best practice setup an integration server to process such workload asynchronously.
RECOMMENDATIONS:
• In-store associates must be made aware of qualified search criteria when looking up the order or shipment. If there are commonly used searches then make sure querying volumes are indexed appropriately.
• Most common is YFS_PERSON_INFO attributes, not all customer uses same common attributes.
• Store users must be configured and linked with team/resource group such that general attributes like ShipNode, Organization, etc are stamped implicitly. Refer to team concept in documentation.
GOAL: Avoid Runaway Queries
SB

SUPPORT TICKET ( ) for issue with client-specific component
• If there are issues specific to a client, whether infrastructure or application, IBM Support will proactively open a Severity 1 Support case within the IBM Support Portal, informing the client of the situation, and in some cases either ask for approval to take a specific action, or request that the client take an action or review
IBM Sterling / © 2020 IBM Corporation
EMAIL ( ) for issue with Multi-tenant shared infrastructure component
• If there are issues from a shared component within data center such as firewall or network, an email notification would be sent to all potentially impacted clients as soon as IBM has determined the potential scope / impact
• Open a case for specific inquiries during incident for additional detail on root cause
Proactive Notifications
• Customer is not directly alerted for any level of IBM monitoring, except queue depth (if subscribed). However, IBM internally takes appropriate actions to fix the issues when alerts are raised. If the customer's site is unavailable, they will be notified.
• If there is a production outage or critical impact, support will work to provide detailed root cause analysis - if it can be obtained from available diagnostics, as well as preventative and serviceability measures being taken by IBM
• IBM has two methods for notifying clients ‘proactively’ when an issue occurs. The notifications may be just informational , or may require client intervention, action or approval to help mitigate the immediate issue.
• IBM performs the following types of monitoring for assessing the health of your production site and its services:
• System and infrastructure - checks health and well-being of physical server hardware, virtual machine resources, and network KC link
• Application - application JVM, application server node instances, database logical servers, and application components. KC link
• Synthetic - customer's application can be opened from the browser and whether the customer's server can be pinged. KC link
• Continuous improvement of alerting based on lessons learned across infrastructure, database, app servers, agent/integration servers, error conditions
• Continuous improvement of internal runbooks to quickly mitigate issues
!IMPORTANT!
• As of 20.2, self-manage notification distribution lists via SST!
• Update your IBM Support Portal profile with your phone number in case we need to engage you!
JR
Proactive Support Model

Production Alert Handling
Application Infrastructure
Synthetic
MQ Connectivity issue (Max connections, JMS Transaction Failures)
✓ Critical MQ connection issue → 5 JMS exceptions in 5 min.
✓ Excessive MQ Connection Reset -MQRC_CONNECTION_BROKEN → 10 in 10 min.
✓ MQ - Invalid Message → 2 in 10 min.
Database Connectivity Issue (Max connections, DB Transaction Failures)
✓ Excessive Database Query Timeouts (YFC0006) -> 100+ timeouts in 30 min.
✓ Critical DB connection issue (YFC0003 -Database Error) -> 5 exceptions in 5 min.
Application Server (Real Time Failure / Sync Calls)
✓ GC (Global) Overhead (High) → 5% for 10 min.
✓ Heap memory usage (High) → 80% for 15 min.
✓ Server Hung/Unresponsive → 90% threads used for 5 min.
✓ Excessive Errors by JVM - critical→ 20% error rate for 10 min.
✓ Server Startup Failure (YIC10004) - Cache Initialization→ 1 or more occurrences
✓ Excessive REST:HTTP 401 errors → 30 in 5 min.
✓ Process DOWN (Health Check , Missing POD)
Stale Agent/Integration Server (Stale Agents)
✓ Heap memory usage (High) → 80% for 60 min.
✓ GC (Global) Overhead (High) → 5% for 10 min.
✓ Custom Queue Depth Alert
✓ Agent & Integration Process DOWN
Database Server✓ Database CPU, Disk Utilization
✓ Host is not responding for 5 minutes.
✓ Transaction logs size
✓ HADR/TSA connection
✓ DB Read/Write/Disk Utilization
Other VM Host ✓ Local , NFS Disk Utilization
✓ VM (host) is not responding
✓ CPU, Memory , Disk Usage
✓ CPU Steal
✓ Cluster Health
Stale/Stuck Query ✓ DB: Lock-Wait
✓ DB: Long Running Query
✓ DB: Not enough storage is available, SQLCODE=-973 → 1 or more occurrences
✓ DB: Too many open statements, SQLCODE=-805 → 1 or more occurrences
Network/Connectivity Failures✓ Connectivity Issue (ConnectException,
SocketException) → 3 in 10 min.
✓ Data Extract Failure - YFS: SFTP server is not reachable
MQ Server (Active/Passive)✓ MQ Listener Down: No listener running for
(OM_QMGR)
✓ MQ Server Down
✓ Generic Queue depth alert 100K/30%
Low Severity alerts (Based on Exceptions)
✓ Data Extract Failures, monitored for ErrorCode: CDE100005, CDE100014, CDE100016,
CDE100019, CDE100020
✓ JMS: Queue not created Error: javax.naming.NameNotFoundException
✓ JMS: Queue connection configuration Error: javax.naming.NoInitialContextException
✓ DB: Inserted Column Data > Column Size, Error:
YDB92_001 (10+)
✓ DB: Failed Update due to concurrent
modification, Error: YFC0009 (100+)
IBM are continuously improving monitoring, alerting and runbooks to allow quick handling of production issues:
1. Proactive case will be opened by IBM Support to inform client/SI of triggered alert, and that investigation is underway
2. IBM capture, review diagnostics, determine source of alert
3. IBM take action to mitigate if possible, inform / get consent from client/SI as needed (such as restarting an agent/integration server)
4. In event client/SI needs to take action, the proactive case will be used to convey this information
Synthetic
Order Management Components✓ Availability Check
Inventory Visibility APIs
Self-Serve Tooling
Business User Control
Store Inventory Management APIs
JR

Your Role in Being Proactive
The SI plays a key role in maintaining the health and performance of the Order Management applications. Examples of what should be proactively reviewed below:
• MQ depth - Check on queues with very high queue depth, take action
• Application exceptions – Using Graylog/SST review errors and ensure errors are addressed to avoid noise, which could become misleading if new critical issue arises.
• Purge – Ensure all necessary purges are running to maintain healthy & lightweight database, which in-turn minimizes performance issues
• Disable unnecessary transaction audits. (Order Audits, General Audits, etc)
• DB queries - Proactively review most expensive and long running queries both in production, and load tests, and optimize to avoid contention which will increase further under heavy peak load (rework, add index, runstats)
• JVM tuning – Select correct JVM profile (*OMoC NextGen) based on analysis from verbose GC logs or your -Xmx/-Xms parameters(Legacy)
• Batch processes - Optimize schedule of batch processes around expected peak loads
• Firewall policies – Periodically review policies including necessary allowlist and custom/vendor certificate expiry
JR

OMoC Self-Service Tool
IBM OMoC is focused on providing client/SI necessary tooling to understand key aspects of the service
• Dashboards are available to help proactively monitor application usage and performance (KC link)
• NOTE: Monitoring dashboards are currently enabled only for the Production & Pre-Production environment.
The following types of dashboards are available:
• Agent and Integration Server Performance
• Database metrics
• Application Server Performance
• API Performance
• Business Performance
• JMS Metrics
• Agent and Integration Servers JVM Metrics
• Application Server JVM Metrics
• Refer to webcast replay for more details! (doesn’t not cover new dashboards). IBM Self Service tool(SST) for Order Management
JR

Join us again in early September for a Panel Discussion with IBM Performance Experts and final peak day tips!
Model load tests to be as representative of peak projection conditions as possible - order volumes, both synchronous and asynchronous processes
Ensure ongoing proactive actions are being taken from now through to peak; engage IBM Support as needed
Complete OMoC Holiday Readiness 2020 Questionnaire and upload to IBM Support case
ibm.biz/OMS-EventReadiness-Qs
Next Steps Toward Readiness
1 2 3 4
Over the next 4 months, partner with IBM OMoC team to identify, mitigate, and ultimately eliminate your risks
MC

IBM Sterling / © 2019 IBM Corporation


