24
2021 AGA Financial Forum May 2021

2021 AGA Financial ForumMay 2021

Forward-Looking StatementsThe statements in this presentation by RGC Resources, Inc. (the "Company") that are not historical facts constitute“forward-looking statements” made pursuant to the safe harbor provision of the Private Securities Litigation Reform Actof 1995 that involve risks and uncertainties. These statements include the Company's expectations regarding earnings pershare, EBITDA, future expansion opportunities, natural gas reserves and potential discoverable natural gas reserves,technological advances in natural gas production, comparison of natural gas consumption and natural gas production,cost of natural gas, including relativity to other fuel sources, demand for natural gas, possibility of system expansion,general potential for customer growth, relationship of Company with primary regulator, future capital expenditures,current and future economic growth, estimated completion dates for Mountain Valley Pipeline ("MVP") and MVPSouthgate milestones, potential of MVP to provide an additional source of natural gas, additional capacity to meet futuredemands, increased capital spending and area expansion opportunity and potential new customers and rate growth inpotential expansion area. Management cautions the reader that these forward-looking statements are only predictionsand are subject to a number of both known and unknown risks and uncertainties, and actual results may differ materiallyfrom those expressed or implied by these forward-looking statements as a result of a number of factors. These factorsinclude, without limitation, financial challenges affecting expected earnings per share and EBITDA, technical, political orregulatory issues with natural gas exploration, production or transportation, impact of increased natural gas demand onnatural gas price, relative cost of alternative fuel sources, lower demand for natural gas, regulatory, legal, technical,political or economic issues frustrating system or area expansion, regulatory, legal, technical, political or economic issuesthat may affect MVP, delay in completion of MVP, increase in cost to complete MVP, including by an increase in cost ofraw materials or labor to due economic factors or regulatory issues such as tariffs, economic challenges that may affectthe service area generally and customer growth or demand and deterioration of relationship with primary regulator, andthose risk factors described in the Company’s most recent Annual Report on Form 10-K and, if applicable, QuarterlyReport on Form 10-Q filed with the Securities and Exchange Commission, which is available at www.sec.gov and on theCompany’s website at www.rgcresources.com. Additionally, the COVID-19 pandemic creates significant economicuncertainty for the foreseeable future.
The statements made in this presentation are based on information available to the Company as of the first day of themonth set forth on the cover of this presentation and the Company undertakes no obligation to update any of theforward-looking statements after the date of this presentation.
1

Agenda
Company Overview
Financial Profile
Growth Strategy
Outlook
2

3
Organizational Structure
Regulated
Local Distribution Company (LDC), located in Roanoke, VA
Founded in 1883
Non-Utility
Partner in Mountain Valley Pipeline (MVP)
Partner in proposed MVP Southgate project
NASDAQ: RGCOC-Corp formed 1998
4
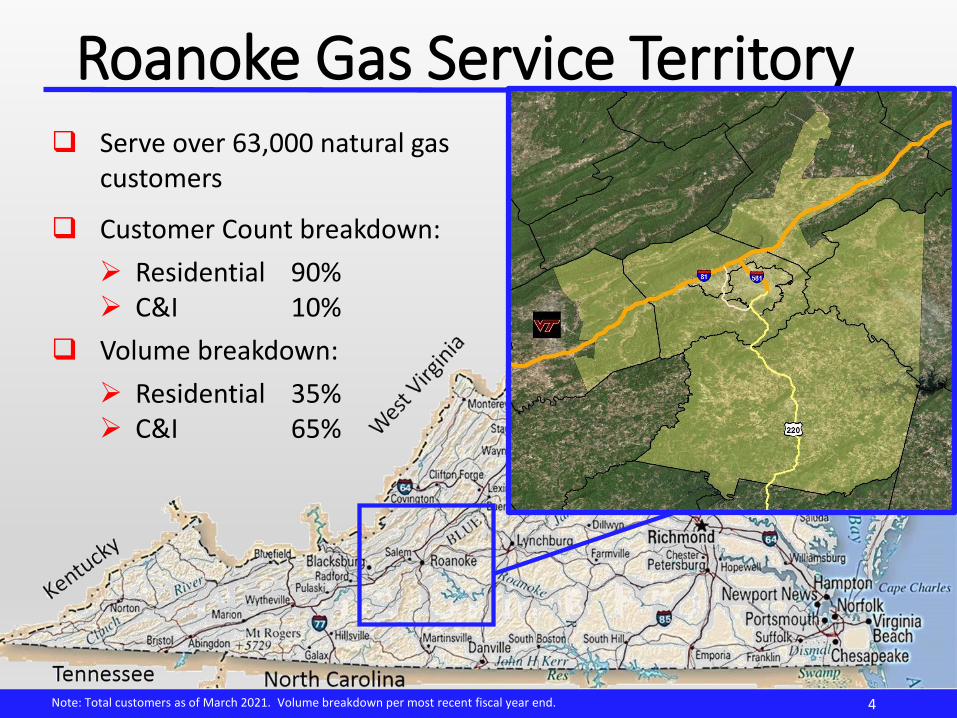
Roanoke Gas Service Territory
Note: Total customers as of March 2021. Volume breakdown per most recent fiscal year end.
Serve over 63,000 natural gas customers
Customer Count breakdown:
Residential 90% C&I 10%
Volume breakdown:
Residential 35% C&I 65%

5
Roanoke Gas
VA State Corporation Commission (SCC)
9.44% authorized ROE
Alternative Cost Recovery Mechanisms
Weather Normalization Revenue Sharing Infrastructure Riders
SAVE infrastructure replacement rider approved through 2024
Highly StableBusiness Model
Regulated Utility
6
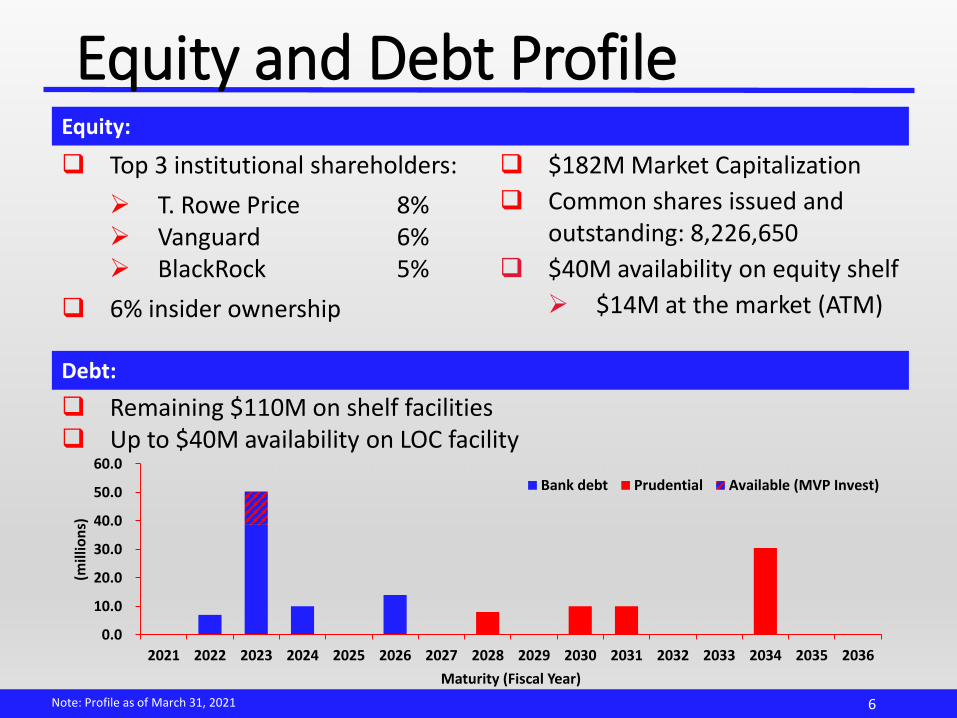
Equity and Debt Profile
0.0
10.0
20.0
30.0
40.0
50.0
60.0
2021 2022 2023 2024 2025 2026 2027 2028 2029 2030 2031 2032 2033 2034 2035 2036
(mill
ion
s)
Maturity (Fiscal Year)
Bank debt Prudential Available (MVP Invest)
Note: Profile as of March 31, 2021
Top 3 institutional shareholders:
T. Rowe Price 8% Vanguard 6% BlackRock 5%
6% insider ownership
$182M Market Capitalization
Common shares issued and outstanding: 8,226,650
$40M availability on equity shelf
$14M at the market (ATM)
Equity:
Remaining $110M on shelf facilities Up to $40M availability on LOC facility
Debt:

7
Shareholder Return
77 years dividend payments
17 years dividend increases
65.7%$0.74
years record earnings
dividend increase
annual dividend(per share)
Note: Graph includes stock prices through May 14, 2021.
8
Growth Strategy Regulated Utility Investment CapEx
Ongoing Regulated Utility Growth Customer Growth Volumes Delivered
Non-Utility InvestmentsMVPMVP Southgate
9
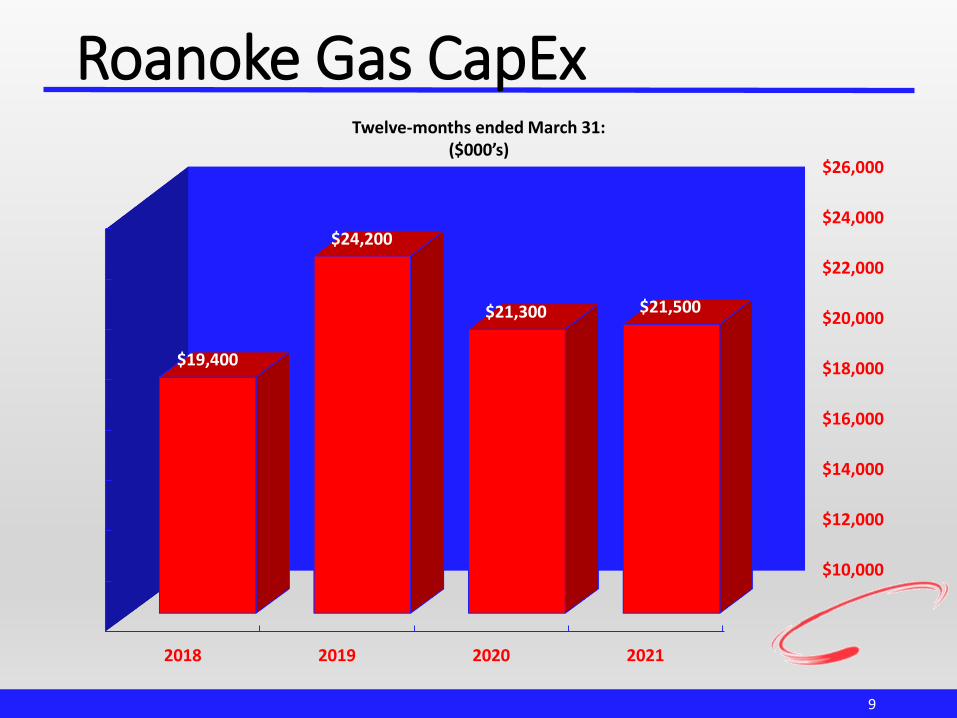
Roanoke Gas CapEx
$10,000
$12,000
$14,000
$16,000
$18,000
$20,000
$22,000
$24,000
$26,000
2018 2019 2020 2021
$19,400
$24,200
$21,300 $21,500
Twelve-months ended March 31:($000’s)

10
SAVE Rider$4.5
CustomerGrowth &
System Expansion
$3.0
Other Capital
$1.5
20202021
$0.5
$2.5
$4.5
$6.5
$8.5
$10.5
$12.5
Total Capital Expenditures
Mill
ion
s
$1.4 million or 13% decrease
Roanoke Gas CapExFiscal YTD at March 31:

11
Customers
59,000
60,000
61,000
62,000
63,000
2018 2019 2020 2021
Average Customers(Twelve months ended March 31)
3% growth since 2018
New customer additions:YTD Fiscal 2021 330
Fiscal 2020 550
Fiscal 2019 670
Fiscal 2018 600

12
-
500
1,000
1,500
2,000
2,500
3,000
3,500
Residential Commercial Industrial
Tho
usa
nd
s
Volumes Delivered (DTH)Fiscal YTD 2020 Fiscal YTD 2021
Natural Gas Volumes
2021 vs 2020
Total Volumes 3%
Residential and Commercial Volumes 7%
HDD 5%

13
Earnings Per Share
Fiscal YTD at
March 31:
2021 2020
Basic: $0.58 $0.70
Diluted: $0.58 $0.70
$0.86
$1.10
$1.39
$1.27
$0.60 $0.64
$0.68 $0.72
$0.45
$0.55
$0.65
$0.75
$0.85
$0.95
$1.05
$1.15
$1.25
$1.35
2018 2019 2020 2021
Dividends/Share
TTM March 31:

14
Return on Equity
8.0%
9.0%
10.0%
11.0%
12.0%
2018 2019 2020 2021
9.1%
10.8%
12.9%
11.0%
Twelve months ended March 31:

15
Outlook
ESG
Strategic Opportunities
Economic Development

16
Environmental System Modernization
Emissions Reductions
Reduced Carbon Footprint
Customer Partnerships
Social Employees
Community Engagement
Safety
Economic Development
Governance Diverse Board of Directors
Compliance and Risk Management
Diversified Shareholder Ownership
Incentive Compensation Aligned with Mission
www.rgcresources.com/esg

17
Strategic Opportunities
Midstream
CapEx
System Expansion

18
Construction resumed
Project 92% complete
Target summer 2022
MVP
Workers for the Mountain Valley Pipeline weld together sections of pipe near Lindside, WV. (Jenny Harnish/The Register-Herald)
$37.6
$45.3
$48.0
$65.0 $12.0
$- $20 $40 $60 $80
2019
2020
YTD 2021
In-service
MVP Investment
Cash Investment AFUDC
MVP Investment (cumulative)
($mm)
75 mile MVP extension
Target spring 2023
Southgate

19
Roanoke Gas System Expansion
Blue Ridge, VA
Phase I complete
Phase II
$1 million
6,800 feet
Blue Ridge Expansion
5.8 main extension miles FY21
3.3 miles YTD
2.5 miles projected
350 Customers
Customer Growth

20
Roanoke Gas Capital Budget$22.9
$21.1 $20.0 $20.0
$18.0 $18.0
$0
$5
$10
$15
$20
$25
2020A 2021E 2022E 2023E 2024E 2025E
Mill
ion
s
Forecast totals through 2025:
SAVE Infrastructure Replacement $39.3
Customer Growth & System Expansion $32.2
Utility Maintenance $25.6
Total $97.1

21
Economic DevelopmentEconomists say Carilion
Clinic adds over $3.2 Billion to Virginia’s Economy
The Roanoke Times (Times) Jan 2020
Munters Group AB,
a global leader in
energy-efficient and sustainable
climate solutions will build a state-of-
the-art facility. The company will
invest $36 million.Roanoke Regional Partnership (Roanoke.org) – 3.25.2021
Lumber grading facility
added 4 natural gas-
fired kilns. Capacity to
burn additional 210,000
DTH annually.
Top 20 customer
Mack Trucks opens 13th U.S. truck factory in Roanoke County, to hire 250Times – 8.16.2020
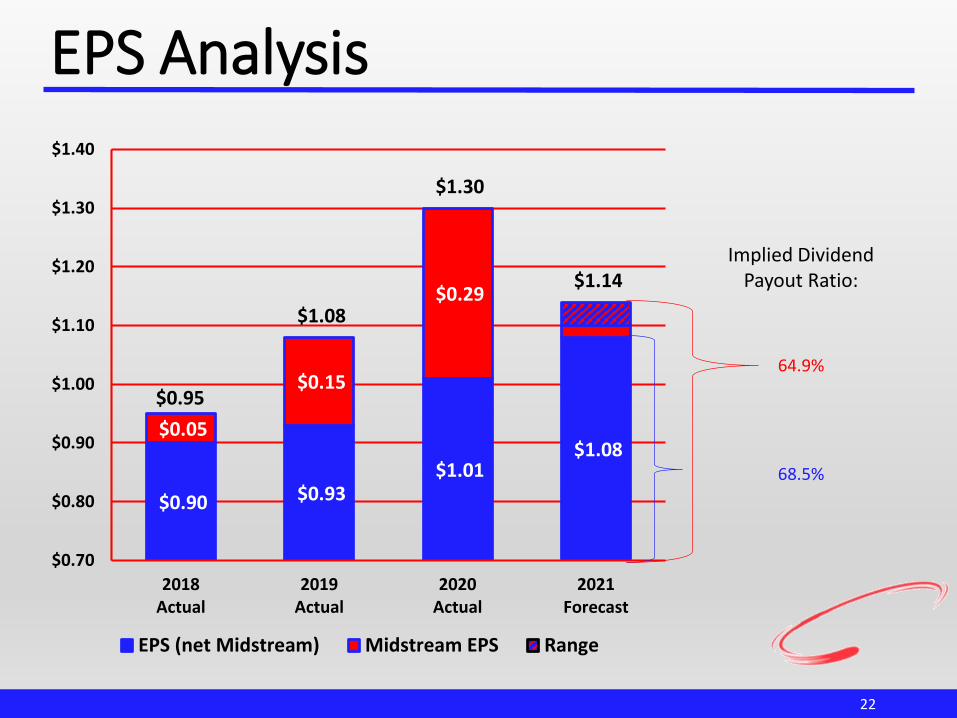
EPS Analysis
22
$0.90 $0.93 $1.01
$1.08 $0.05
$0.15
$0.29
$0.95
$1.08
$1.30
$1.14
$0.70
$0.80
$0.90
$1.00
$1.10
$1.20
$1.30
$1.40
2018Actual
2019Actual
2020Actual
2021Forecast
EPS (net Midstream) Midstream EPS Range
Implied DividendPayout Ratio:
64.9%
68.5%


