28
2021 SECOND QUARTER Results & Earnings
2021 SECOND QUARTERResults & Earnings

Forward-Looking Statements
This presentation contains “forward-looking statements" within the meaning of Section 27A of the Securities Act of 1933, as amended, and Section 21E of the Securities Exchange Act of 1934, as amended. Generally, the words “anticipate,” “estimate,” “expect,” “project,” “intend,” “plan,” "contemplate," "predict," “project,” “forecast,” “likely,” “believe,” “target,” “will,” “could,” “would,” “should,” "potential," "may" and similar expressions or their negative, may, but are not necessary to, identify forward-looking statements. By their nature, forward-looking statements address uncertain matters and include any statements that are not historical, such as statements about our strategy, financial plans, outlook, objectives, plans, intentions or goals; or address possible or future results of operations or financial performance, including statements relating to orders, revenues, operating margins and earnings per share growth.
Although we believe that the expectations reflected in any of our forward-looking statements are reasonable, actual results could differ materially from those projected or assumed in any of our forward-looking statements. Our future financial condition and results of operations, as well as any forward-looking statements, are subject to change and to inherent risks and uncertainties, many of which are beyond our control. Additionally, many of these risks and uncertainties are, and may continue to be, amplified by the coronavirus (“COVID-19”) pandemic. Important factors that could cause our actual results, performance and achievements, or industry results to differ materially from estimates or projections contained in or implied by our forward-looking statements include, among others, the following: overall industry and economic conditions, including industrial, governmental and private sector spending and the strength of the residential and commercial real estate markets; geopolitical, regulatory, economic and other risks associated with international operations; continued uncertainty around the COVID-19 pandemic’s magnitude, duration and impacts on our business, operations, growth, and financial condition, as well as uncertainty around approved vaccines and the pace ofrecovery when the pandemic subsides; actual or potential other epidemics, pandemics or global health crises; manufacturing and operating cost increases due to inflation, prevailing price changes, tariffs and other factors; fluctuations in foreign currencyexchange rates; disruption, competition and pricing pressures in the markets we serve; cybersecurity incidents or other disruptions of information technology systems on which we rely, or involving our products; disruptions in operations at our facilities or that of third parties upon which we rely; availability of products, parts, electronic components and raw materials from our supply chain; availability, regulation and interference with radio spectrum used by some of our products; our ability to retain and attract senior management and other key talent; uncertainty related to restructuring and realignment actions and related charges and savings; our ability to continue strategic investments for growth; our ability to successfully identify, execute and integrate acquisitions; risks relating to products, including defects, security, warranty and liability claims, and recalls; difficulty predicting our financial results, including uncertainties due to the nature of our short- and long-cycle businesses; volatility in our results due to weather conditions; our ability to borrow or refinance our existing indebtedness and the availability of liquidity sufficient to meet our needs; risk of future impairments to goodwill and other intangible assets; failure to comply with, or changes in, laws or regulations, including those pertaining to anti-corruption, data privacy and security, export and import, competition, and the environment and climate change; changes in our effective tax rates or tax expenses; legal, governmental or regulatory claims, investigations or proceedings and associated contingent liabilities; and other factors set forth under “Item 1A. Risk Factors” in our Annual Report on Form 10-K for the year ended December 31, 2020 ("2020 Annual Report") and in subsequent filings we make with the Securities and Exchange Commission (“SEC”).
All forward-looking statements made herein are based on information currently available to us as of the date of this presentation. We undertake no obligation to publicly update or revise any forward-looking statements, whether as a result of new information, future events or otherwise, except as required by law.
Q2 2021 Results & Earnings 2
Organic* Revenue Organic* Orders Adj. EBITDA* Margin
Adj. EPS* Sustainability
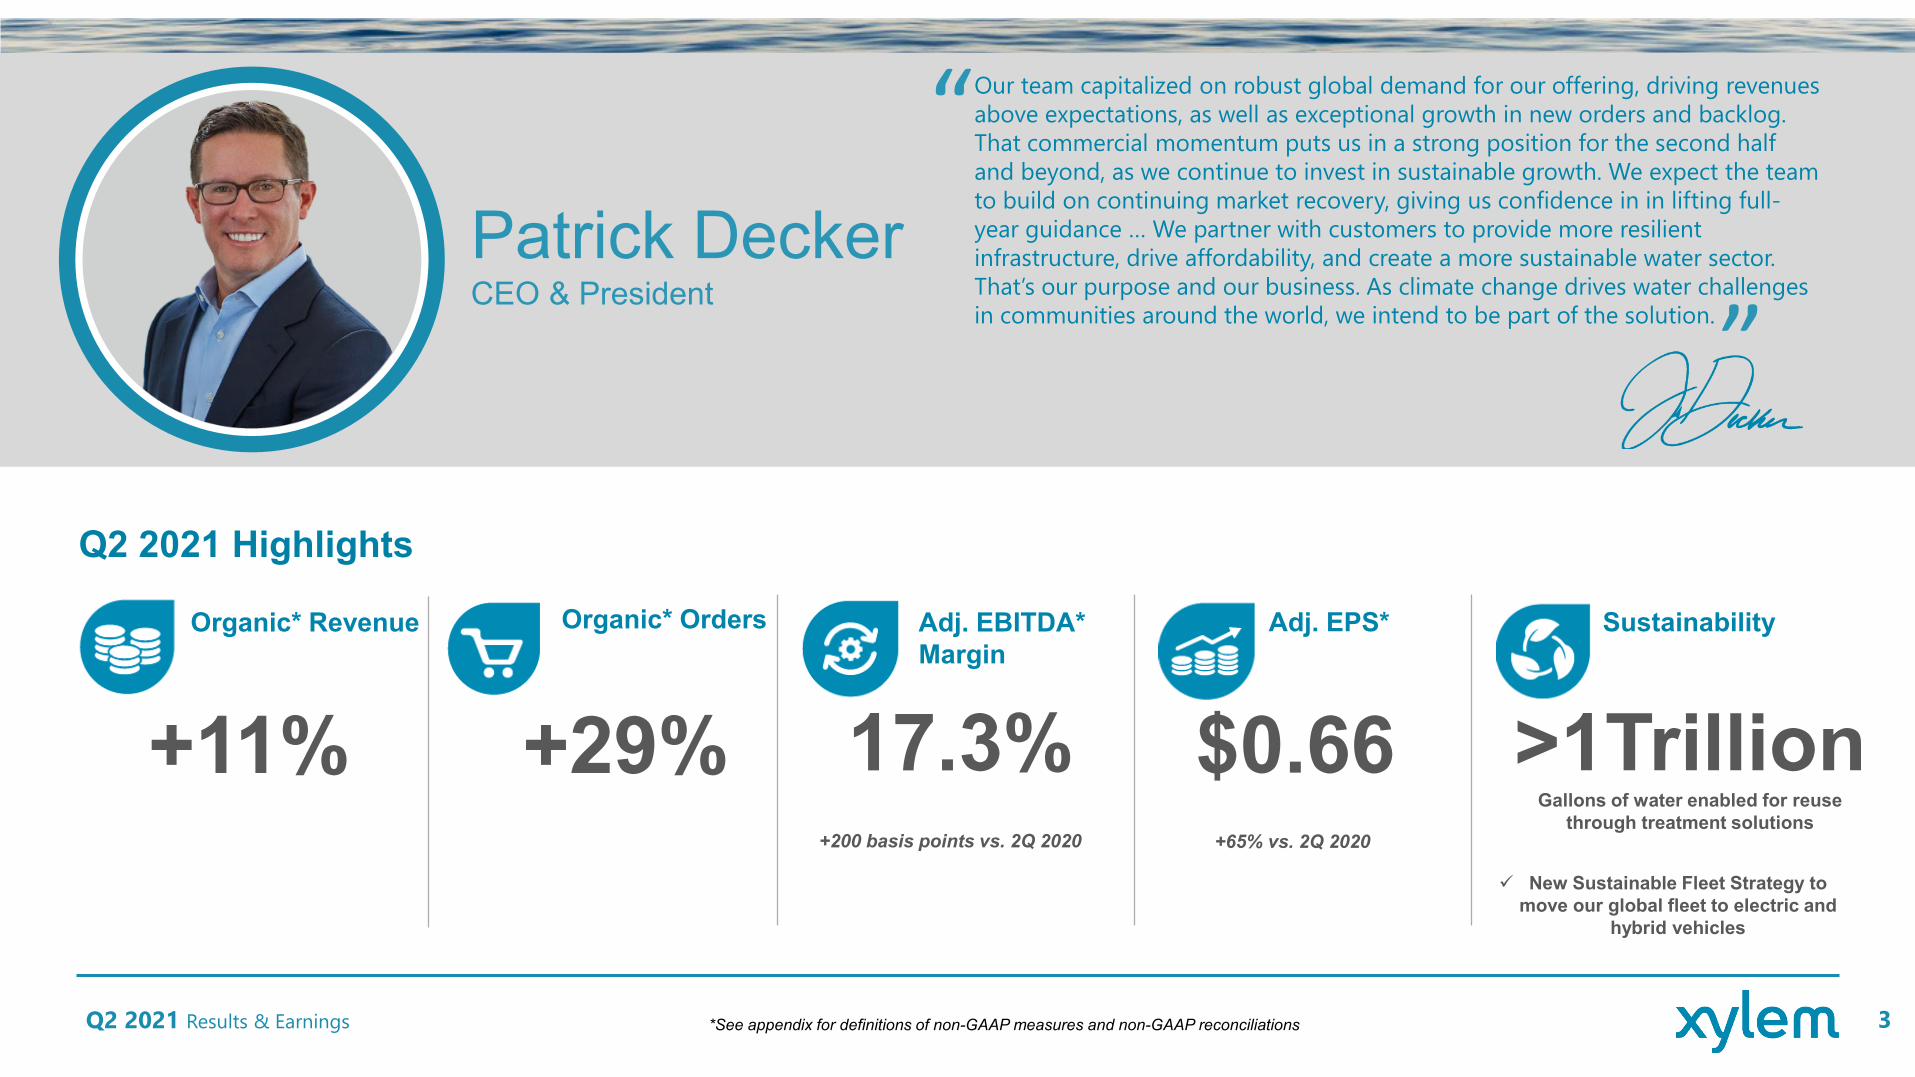
+11% +29% 17.3% $0.66 New Sustainable Fleet Strategy to
move our global fleet to electric and hybrid vehicles
+200 basis points vs. 2Q 2020 +65% vs. 2Q 2020
Q2 2021 Results & Earnings 3
Patrick DeckerCEO & President
Our team capitalized on robust global demand for our offering, driving revenues above expectations, as well as exceptional growth in new orders and backlog. That commercial momentum puts us in a strong position for the second half and beyond, as we continue to invest in sustainable growth. We expect the team to build on continuing market recovery, giving us confidence in in lifting full-year guidance … We partner with customers to provide more resilient infrastructure, drive affordability, and create a more sustainable water sector. That’s our purpose and our business. As climate change drives water challenges in communities around the world, we intend to be part of the solution.
*See appendix for definitions of non-GAAP measures and non-GAAP reconciliations
Q2 2021 Highlights
“
“>1Trillion
Gallons of water enabled for reuse through treatment solutions

Q2 2021XYLEM PERFORMANCE
• Organic* Orders up 29% with strong underlying demand across segments; Backlog up 35%
• Organic* Revenue growth 11%; double digit growth across Industrial, Commercial and Residential end markets, while Utilities growth improves sequentially driven by Clean Water applications
• Emerging Markets tops revenue growth (+18%) led by strength in China (+15%); Western Europe with continued robust demand (+17%); U.S. returns to growth (+5%) with orders up double-digits
• Adj. EBITDA Margin* and Adj. EPS* drivers:
• Productivity drives 390 bps EBITDA Margin expansion (EPS +$0.24)
• Volume/Mix/Price/Other improves EBITDA Margin by 330 bps (EPS +$0.31)
• Cost Inflation reduces EBITDA Margin by 370 bps (EPS -$0.22)
• Strategic investments reduces EBITDA Margin by 150 bps (EPS -$0.07)
Tax Rate*: 17.9% Interest/Other Expense: $21M Share Count: 181.3M
KEY PERFORMANCE DRIVERS
Utilities 6%
Industrial 17%
Commercial 12%
Residential 29%
Emerging Markets 18%
Western Europe 17%
United States 5%
Q2 2020 Q2 2021 Q2 2020 Q2 2021 Q2 2020 Q2 2021
15.0% 13.8% $0.89 $0.81
Q2 2021 Results & Earnings 4
Organic Growth* by End Market
Organic Growth* by Region
$1,160 $1,351
Organic*11%
15.3% 17.3% $0.40 $0.66
REVENUE ADJUSTED EBITDA MARGIN*
ADJUSTED EPS*
Adj. Op Margin* 9.3% 12.3%
*See appendix for definitions of non-GAAP measures and non-GAAP reconciliations
+200 bps +65%
Q2 2020 Vol, Mix, Price &Other
Productivity Savings Material, Labor,Freight & OH
Inflation
Acquisitions &Investments
Q2 2021
19.0% 19.0%3.2%1.3%
0.4%
4.1%
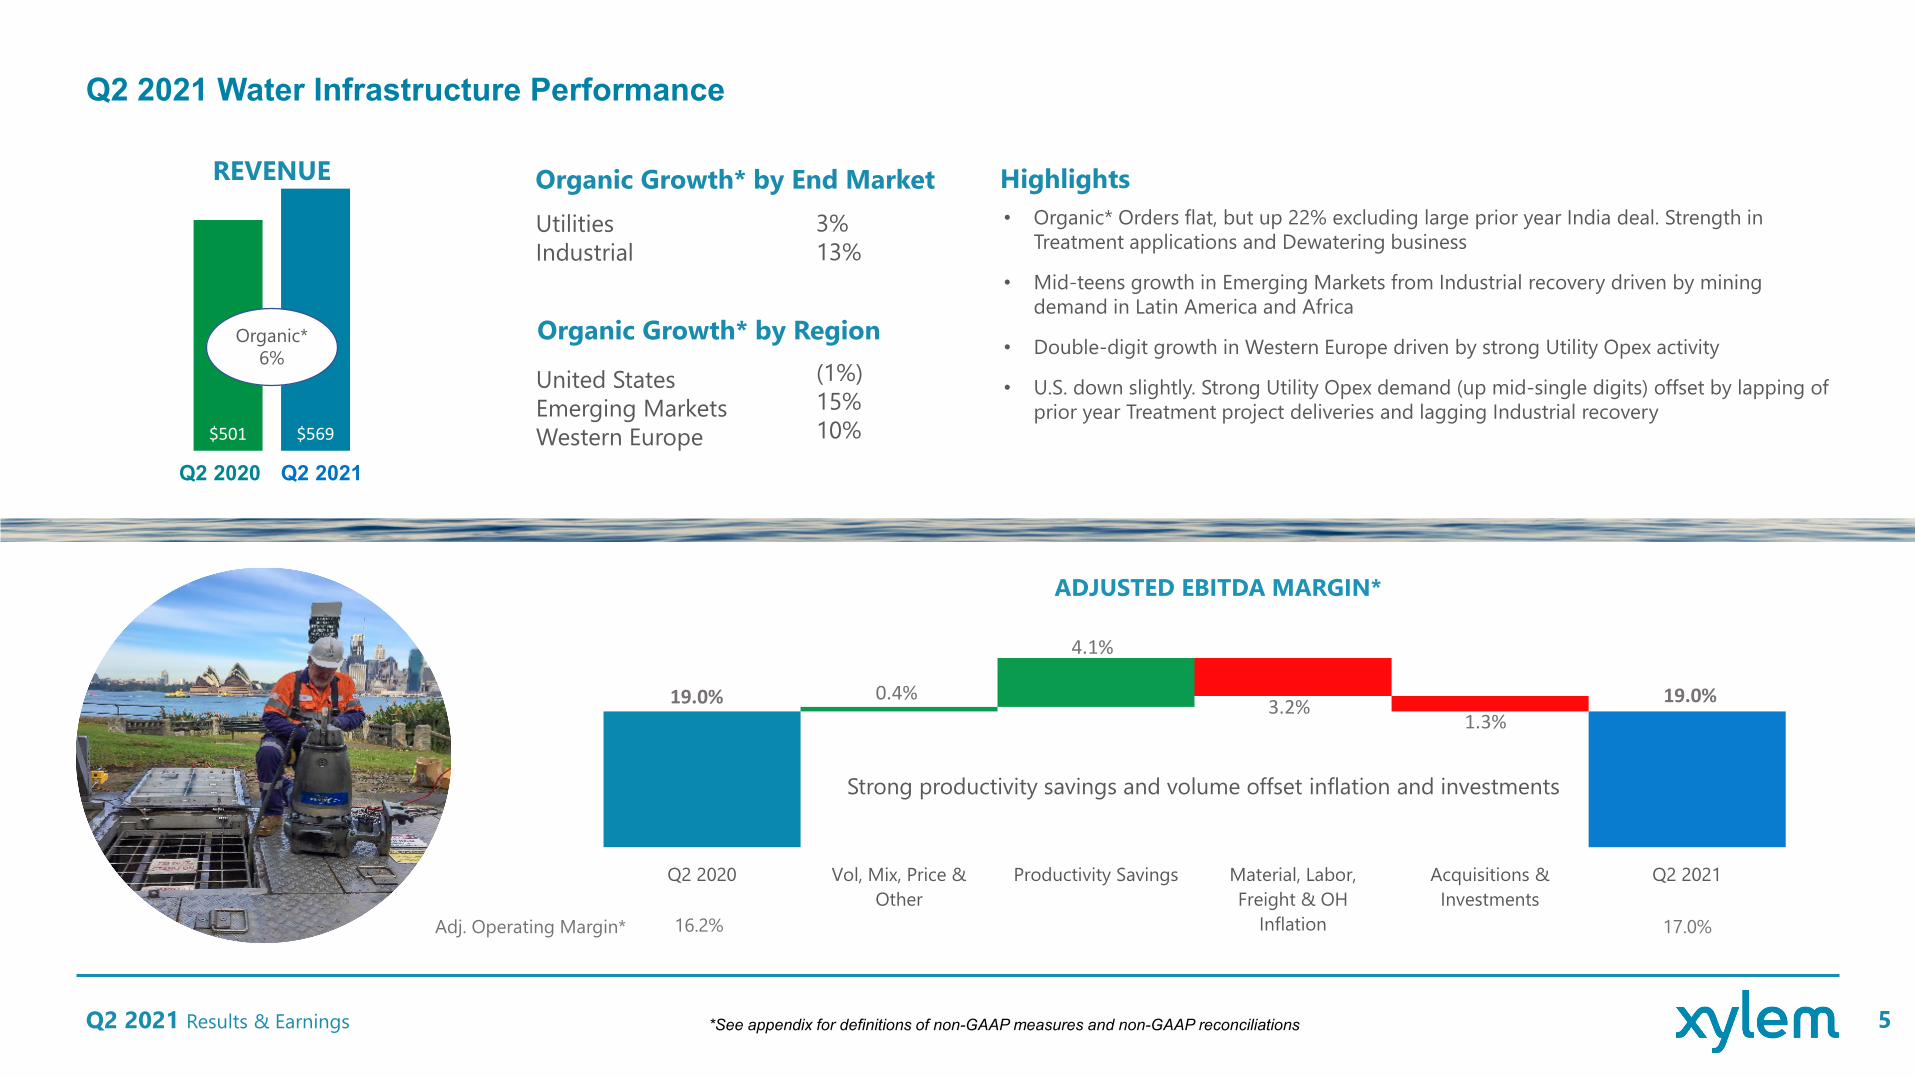
$501 $569
Q2 2021 Results & Earnings 5
Q2 2020 Q2 2021
Organic*6%
UtilitiesIndustrial
Organic Growth* by End Market
United StatesEmerging MarketsWestern Europe
Organic Growth* by Region
• Organic* Orders flat, but up 22% excluding large prior year India deal. Strength in Treatment applications and Dewatering business
• Mid-teens growth in Emerging Markets from Industrial recovery driven by mining demand in Latin America and Africa
• Double-digit growth in Western Europe driven by strong Utility Opex activity
• U.S. down slightly. Strong Utility Opex demand (up mid-single digits) offset by lapping of prior year Treatment project deliveries and lagging Industrial recovery
Highlights
$125$124
Strong productivity savings and volume offset inflation and investments
3%13%
(1%)15%10%
REVENUE
16.2% 17.0%
ADJUSTED EBITDA MARGIN*
Adj. Operating Margin*
*See appendix for definitions of non-GAAP measures and non-GAAP reconciliations
Q2 2021 Water Infrastructure Performance
Q2 2020 Vol, Mix, Price &Other
Productivity Savings Material, Labor,Freight & OH
Inflation
Acquisitions &Investments
Q1 2021
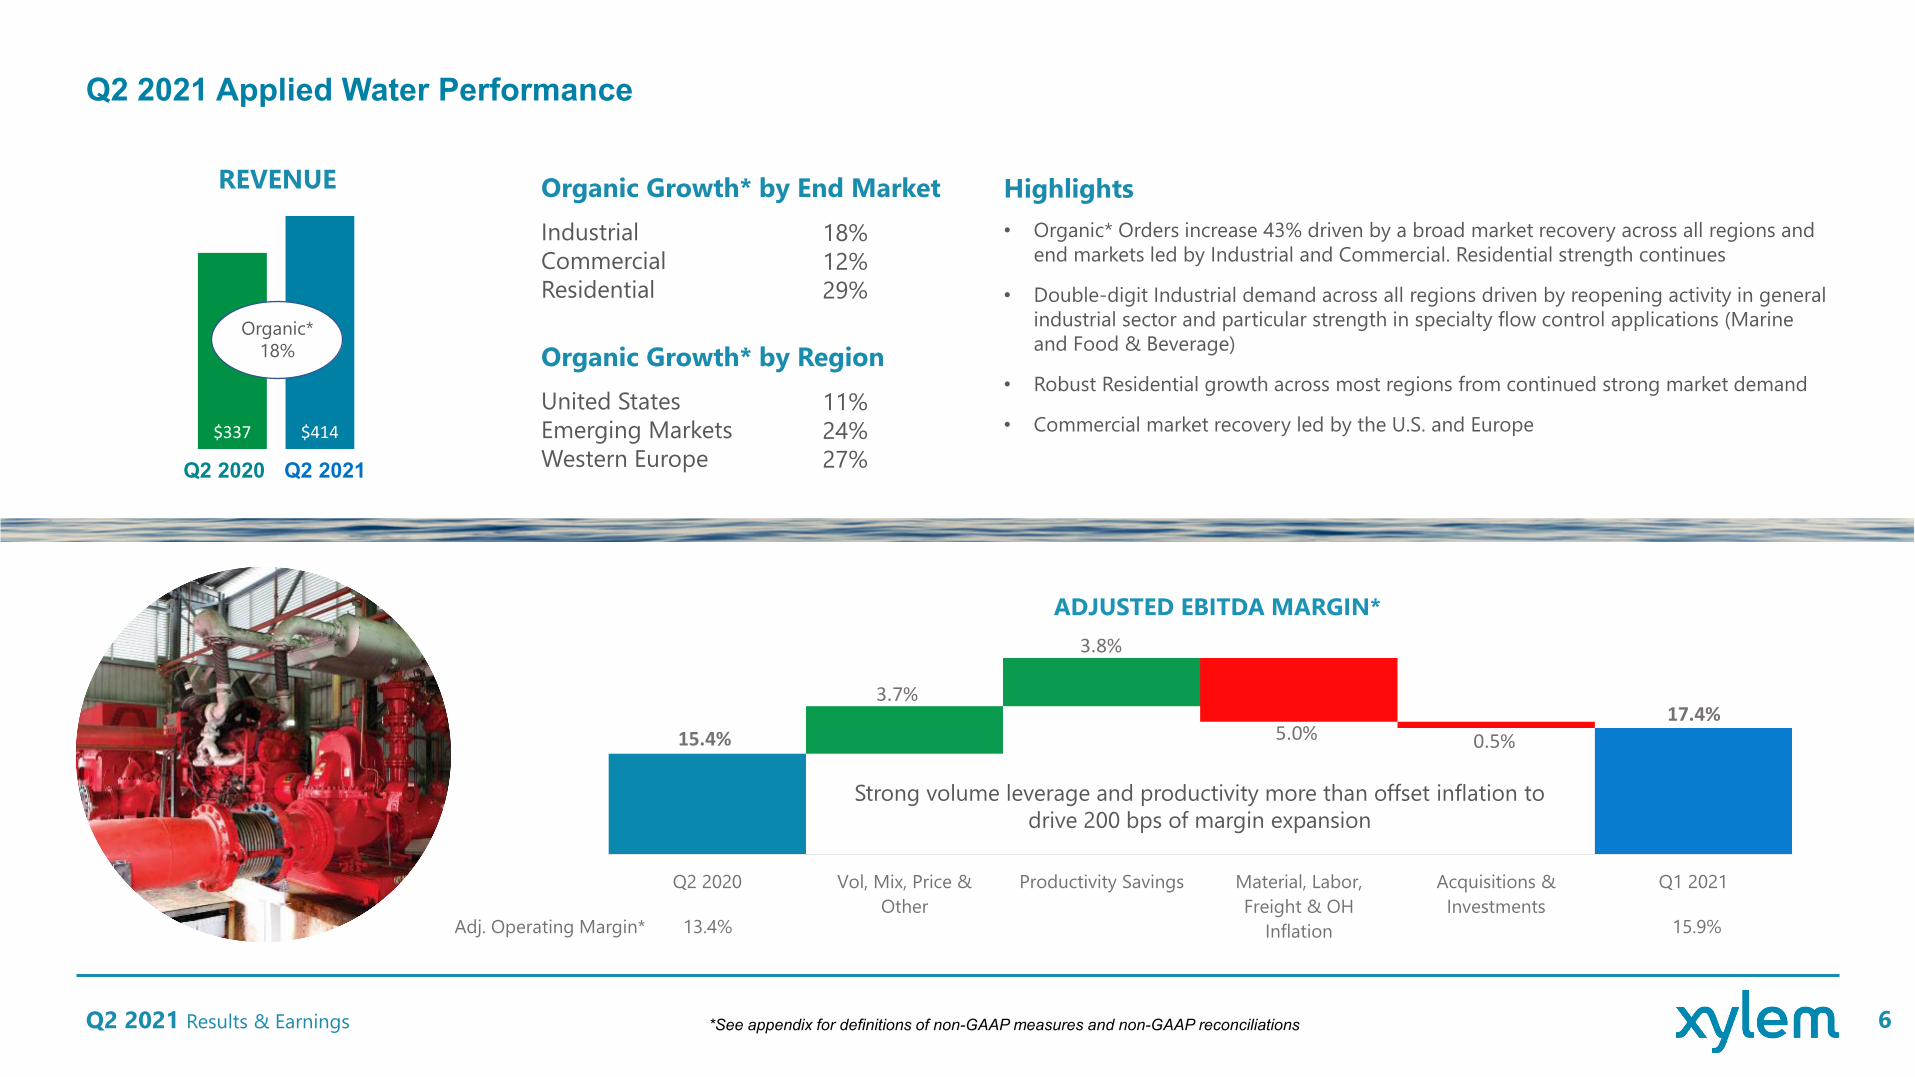
15.4%17.4%
5.0% 0.5%
3.7%
3.8%
$337 $414
Q2 2021 Applied Water Performance
Q2 2021 Results & Earnings 6
Q2 2020 Q2 2021
Organic*18%
IndustrialCommercialResidential
Organic Growth* by End Market
United States Emerging MarketsWestern Europe
Organic Growth* by Region
• Organic* Orders increase 43% driven by a broad market recovery across all regions and end markets led by Industrial and Commercial. Residential strength continues
• Double-digit Industrial demand across all regions driven by reopening activity in general industrial sector and particular strength in specialty flow control applications (Marine and Food & Beverage)
• Robust Residential growth across most regions from continued strong market demand
• Commercial market recovery led by the U.S. and Europe
Highlights
Strong volume leverage and productivity more than offset inflation to drive 200 bps of margin expansion
18%12%29%
11%24%27%
REVENUE
13.4% 15.9%
ADJUSTED EBITDA MARGIN*
Adj. Operating Margin*
*See appendix for definitions of non-GAAP measures and non-GAAP reconciliations

Q2 2020 Vol, Mix, Price &Other
Productivity Savings Material, Labor,Freight & OH
Inflation
Acquisitions &Investments
Q2 2021
9.3%
13.9%2.7% 0.5%
4.0%
3.8%
$322 $368
Q2 2021 Measurement & Control Solutions Performance
Q2 2021 Results & Earnings 7
Q2 2020 Q2 2021
Organic*11%
WaterEnergy
Organic Growth* by Application
United StatesEmerging MarketsWestern Europe
Organic Growth* by Region
Highlights
Strong productivity savings, favorable mix and volume leverage more than offset inflation and investments for 460 bps of margin expansion
17%(3%)
6%20%25%
REVENUE
(1.6%) 3.5%
ADJUSTED EBITDA MARGIN*
Adj. Operating Margin*
*See appendix for definitions of non-GAAP measures and non-GAAP reconciliations
• Strong Organic* Orders growth of 70% led by large water metrology contracts following the easing of site access restrictions, further aided by global demand for water quality testing products
• Strong water revenue growth of 17% driven by large water metrology contracts in the UK and double-digit growth in water quality applications in North America, Europe and Emerging Markets
• Modest decline in Energy due to timing of project deployments• Total backlog of $1.5B up ~50% organically vs PY fueled by large contract wins and
demand for digital solutions
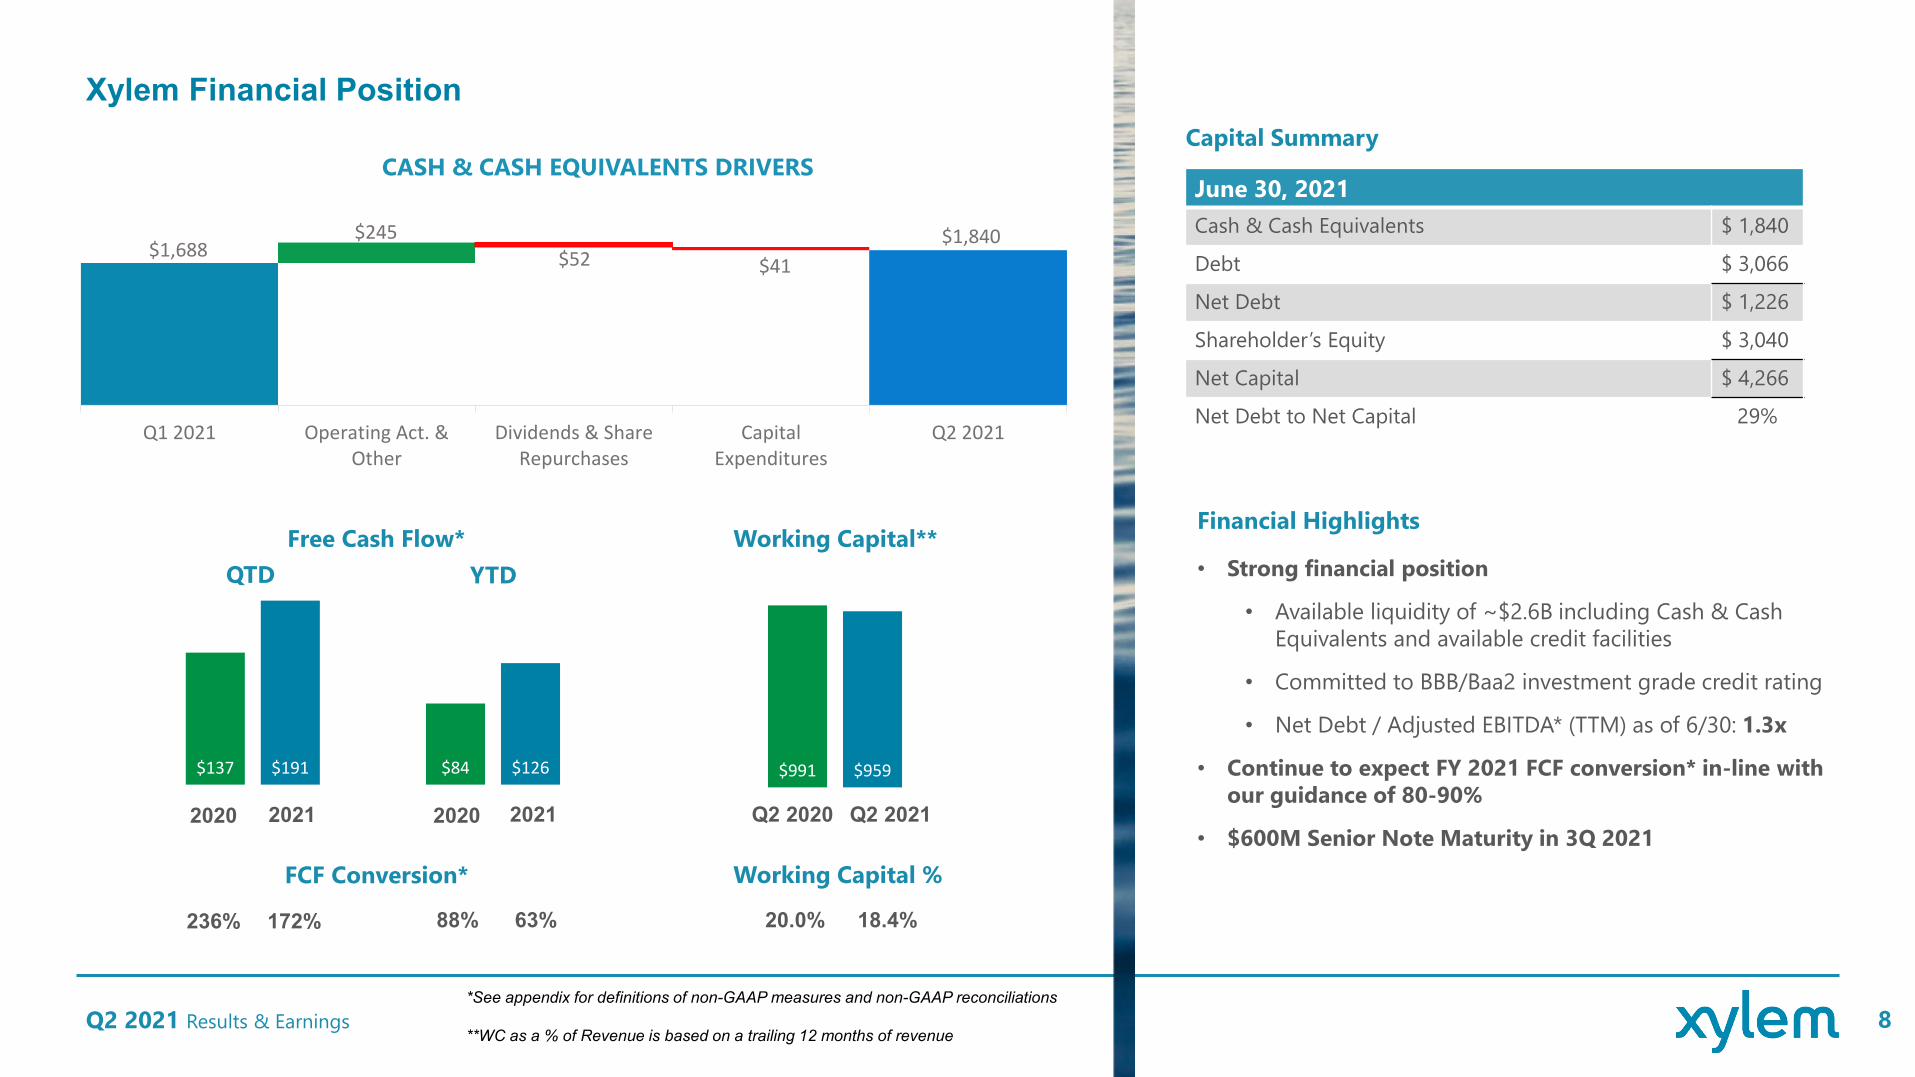
Xylem Financial Position
Q2 2021 Results & Earnings 8
$337$323
2020 2021
236% 172%
June 30, 2021Cash & Cash Equivalents $ 1,840
Debt $ 3,066
Net Debt $ 1,226
Shareholder’s Equity $ 3,040
Net Capital $ 4,266
Net Debt to Net Capital 29%
Capital Summary
$919
Q2 2020 Q2 2021
Working Capital %
20.0% 18.4%
• Strong financial position
• Available liquidity of ~$2.6B including Cash & Cash Equivalents and available credit facilities
• Committed to BBB/Baa2 investment grade credit rating
• Net Debt / Adjusted EBITDA* (TTM) as of 6/30: 1.3x
• Continue to expect FY 2021 FCF conversion* in-line with our guidance of 80-90%
• $600M Senior Note Maturity in 3Q 2021
Financial Highlights
$137 $191
Q1 2021 Operating Act. &Other
Dividends & ShareRepurchases
CapitalExpenditures
Q2 2021
$1,688 $1,840
$52 $41
$245
CASH & CASH EQUIVALENTS DRIVERS
*See appendix for definitions of non-GAAP measures and non-GAAP reconciliations
**WC as a % of Revenue is based on a trailing 12 months of revenue
$991 $959
$337$323
2020 2021
FCF Conversion*
88% 63%
$84 $126
Free Cash Flow* Working Capital**YTDQTD

Progress on Our Top Priorities for 20211. MAINTAIN OPERATIONAL DISCIPLINE AND EXECUTION
Q2 2021 Results & Earnings 9
• Working Capital & Free Cash Flow
• Margin expansion
2. CAPITALIZE ON SUSTAINABLE GROWTH PLATFORMS• Advanced digital solutions for network transformation
• High-growth geographies
• Capital deployment to support organic and inorganic growth
3. EXTEND LEADERSHIP IN SUSTAINABILITY AND IN ESG• Healthy progress on 2025 signature sustainability goals across company,
customers and communities
• 2020 Sustainability Report and Green Bond Report published in June

HEADLINE HRE
• Focus on Opex needs and mission-critical applications in developed markets of Europe and North America (operation and maintenance of Wastewater networks and Treatment sites). Expect modest growth generally in-line with Opex budgets
• Long-term capital project spending outlook and bid activity remains robust in Emerging Markets, especially China and India. Very strong post-COVID China recovery. Expect uneven India growth with large projects and uncertainty given heightened COVID impact
• U.S. Utilities: No indication of pause from customers based on preliminary Infrastructure plans. Opex activity continues to be steady and resilient. Capex bidding pipeline on projects and orders very healthy
Wastewater Utilities~28% of Revenue
Q2 2021 Results & Earnings 10
• Large metrology project deployment timing impacted by global shortage of electronic components. Very strong backlog position and orders momentum for when supply constraint expected to ease in mid-2022
• Healthy momentum in test business for water quality products in outdoor water and process (Treatment) markets globally
• Increased demand for smart water solutions and digital offerings reinforces continued desire to push up technology curve and drive resilience and affordability for Utilities customers
Clean Water Utilities~27% of Revenue
FY 2021 END MARKET OUTLOOK COMMENTARYSee appendix for end market key facts

HEADLINE HRE
Industrial ~30% of Revenue
• Strong rebound in “light” Industrial activity from Applied Water businesses globally (especially specialty flow control businesses for Marine and Food & Bev)
• Industrial Dewatering business recovery especially in Emerging Markets from mining demand. Strong orders and backlog combined with easing site access restrictions yields activity
• Strong growth in Emerging Markets and Western Europe in the first half while North America positive, but slightly lagged. Expect a flip of these markets in the second half primarily based on comparisons
• U.S. replacement business (book and ship) solid. New Commercial building expected to be soft most of 2021. ABI and Dodge leading indicators reflect optimism for late 2021 recovery in new construction / institutional sector
• Healthy activity in Europe (double-digit growth in 1H) from modest share gains, supply chain resiliency (vs. peers). Smart and eco-friendly products launched ahead of impending regulations
• Demand and activity from increased Residential users / work-from-home in U.S. & Europe
• Primarily replacement revenue serviced through long-standing distributor / dealer network
• Strong demand for secondary water supply products in China
Q2 2021 Results & Earnings 11
Commercial~10% of Revenue
Residential~5% of Revenue
FY 2021 END MARKET OUTLOOK COMMENTARYSee appendix for end market key facts
17.2% to
17.7%
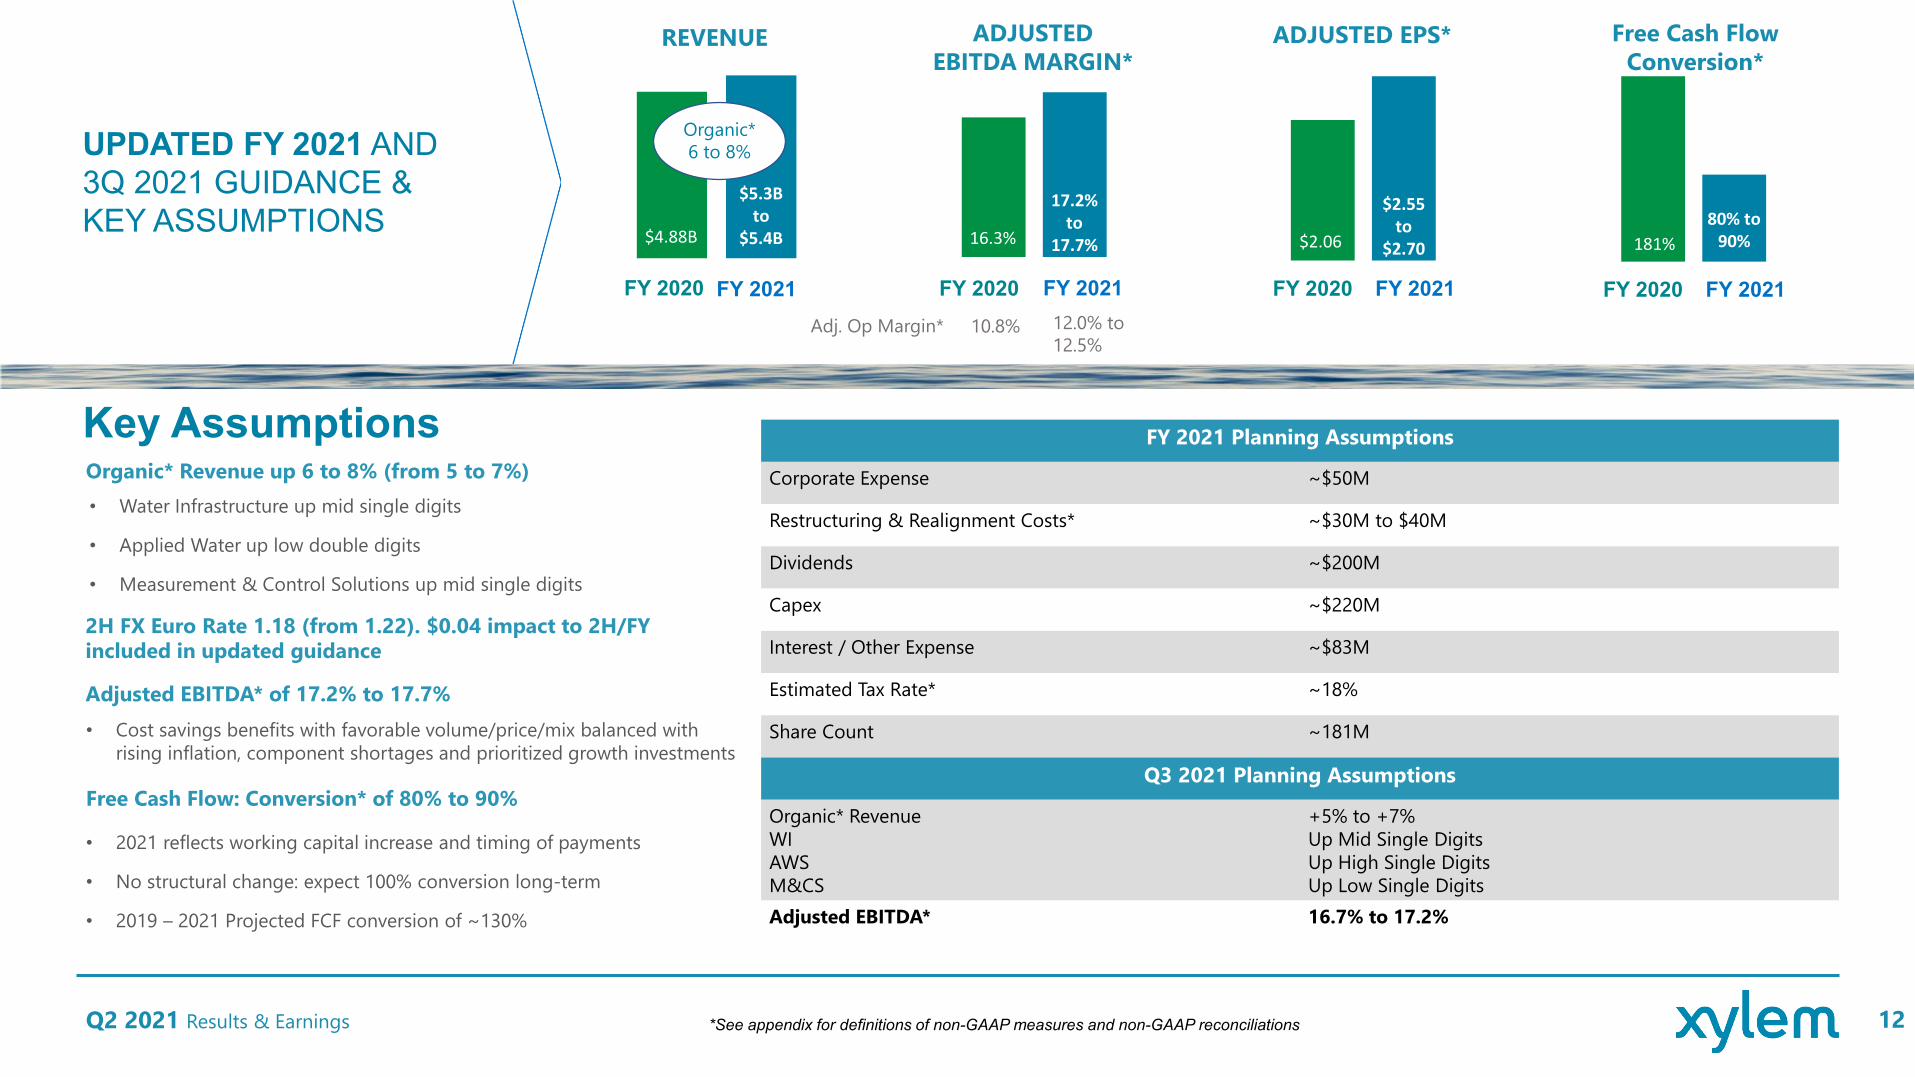
UPDATED FY 2021 AND 3Q 2021 GUIDANCE & KEY ASSUMPTIONS
Key Assumptions
Q2 2021 Results & Earnings 12
Organic* Revenue up 6 to 8% (from 5 to 7%)• Water Infrastructure up mid single digits
• Applied Water up low double digits
• Measurement & Control Solutions up mid single digits
Adjusted EBITDA* of 17.2% to 17.7%• Cost savings benefits with favorable volume/price/mix balanced with
rising inflation, component shortages and prioritized growth investments
Free Cash Flow: Conversion* of 80% to 90%
• 2021 reflects working capital increase and timing of payments
• No structural change: expect 100% conversion long-term
• 2019 – 2021 Projected FCF conversion of ~130%
FY 2021 Planning Assumptions
Corporate Expense ~$50M
Restructuring & Realignment Costs* ~$30M to $40M
Dividends ~$200M
Capex ~$220M
Interest / Other Expense ~$83M
Estimated Tax Rate* ~18%
Share Count ~181M
Q3 2021 Planning Assumptions
Organic* RevenueWIAWSM&CS
+5% to +7%Up Mid Single DigitsUp High Single DigitsUp Low Single Digits
Adjusted EBITDA* 16.7% to 17.2%
FY 2020 FY 2021 FY 2020 FY 2021 FY 2020 FY 2021
16.3%$0.89 $0.81
$5.3B to
$5.4B$4.88B
Organic*6 to 8%
$2.55 to
$2.70$2.06
REVENUE ADJUSTED EBITDA MARGIN*
ADJUSTED EPS*
Adj. Op Margin* 10.8% 12.0% to 12.5%
FY 2020 FY 2021
$0.89 $0.81181%
80% to 90%
Free Cash Flow Conversion*
*See appendix for definitions of non-GAAP measures and non-GAAP reconciliations
2H FX Euro Rate 1.18 (from 1.22). $0.04 impact to 2H/FY included in updated guidance
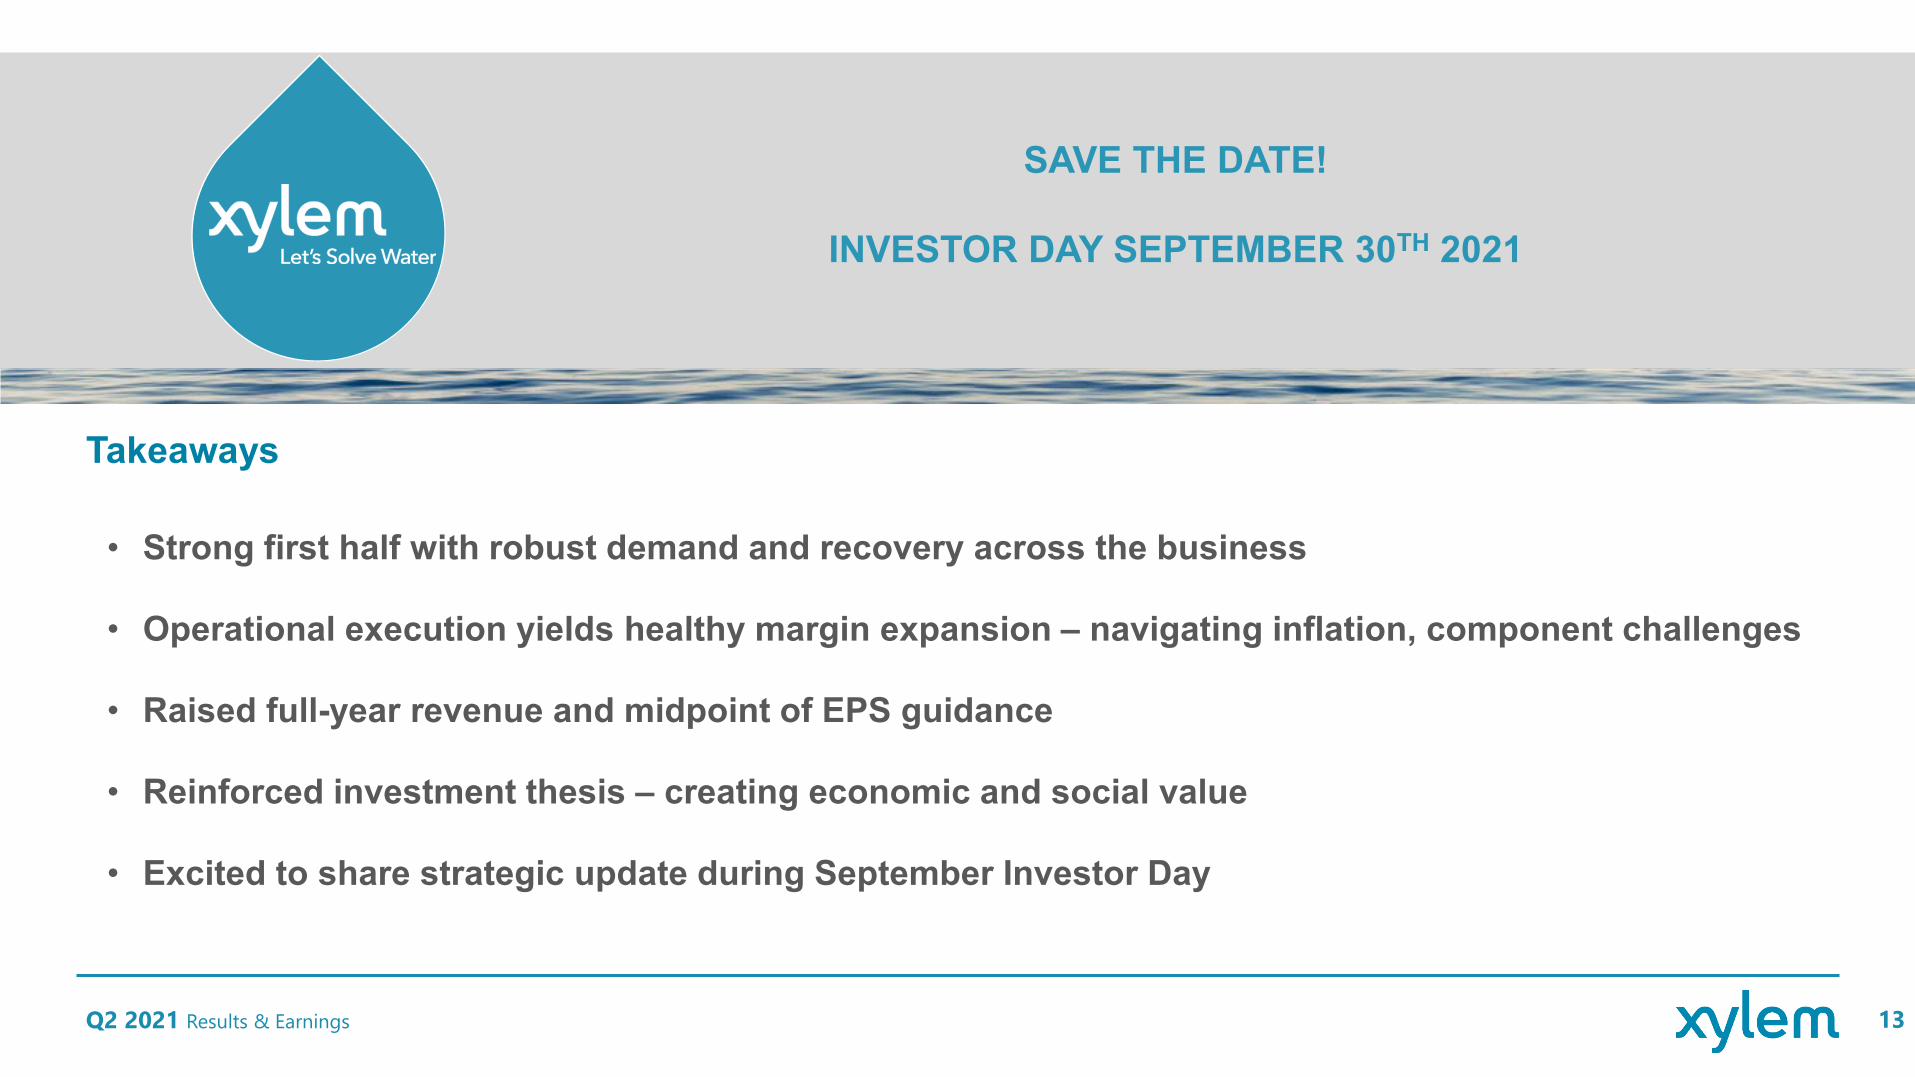
• Strong first half with robust demand and recovery across the business
• Operational execution yields healthy margin expansion – navigating inflation, component challenges
• Raised full-year revenue and midpoint of EPS guidance
• Reinforced investment thesis – creating economic and social value
• Excited to share strategic update during September Investor Day
SAVE THE DATE!
INVESTOR DAY SEPTEMBER 30TH 2021
Takeaways
Q2 2021 Results & Earnings 13
Appendix
Q2 2021 Results & Earnings 14
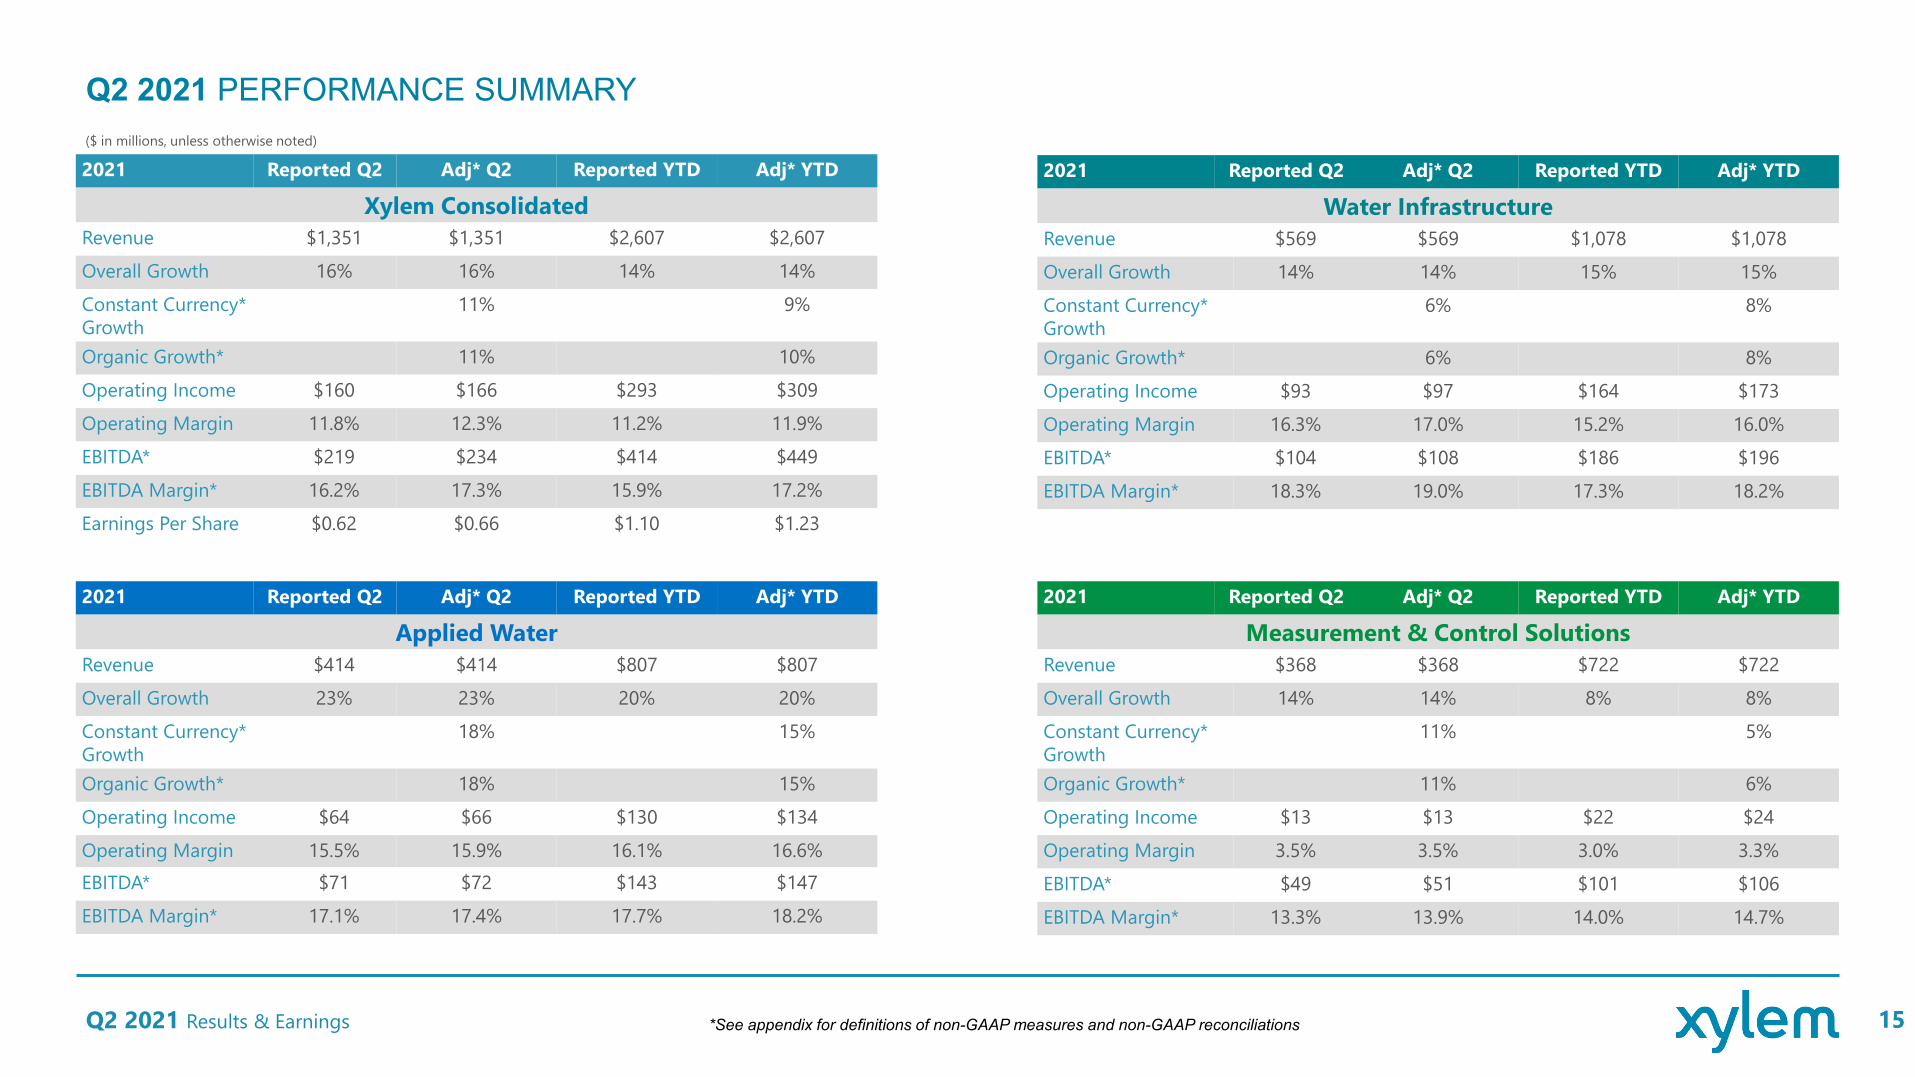
Q2 2021 PERFORMANCE SUMMARY
Q2 2021 Results & Earnings 15
($ in millions, unless otherwise noted)
2021 Reported Q2 Adj* Q2 Reported YTD Adj* YTD
Xylem ConsolidatedRevenue $1,351 $1,351 $2,607 $2,607Overall Growth 16% 16% 14% 14%Constant Currency* Growth
11% 9%
Organic Growth* 11% 10%Operating Income $160 $166 $293 $309Operating Margin 11.8% 12.3% 11.2% 11.9%EBITDA* $219 $234 $414 $449EBITDA Margin* 16.2% 17.3% 15.9% 17.2%Earnings Per Share $0.62 $0.66 $1.10 $1.23
2021 Reported Q2 Adj* Q2 Reported YTD Adj* YTD
Water InfrastructureRevenue $569 $569 $1,078 $1,078Overall Growth 14% 14% 15% 15%Constant Currency* Growth
6% 8%
Organic Growth* 6% 8%Operating Income $93 $97 $164 $173Operating Margin 16.3% 17.0% 15.2% 16.0%EBITDA* $104 $108 $186 $196EBITDA Margin* 18.3% 19.0% 17.3% 18.2%
2021 Reported Q2 Adj* Q2 Reported YTD Adj* YTD
Applied WaterRevenue $414 $414 $807 $807Overall Growth 23% 23% 20% 20%Constant Currency* Growth
18% 15%
Organic Growth* 18% 15%Operating Income $64 $66 $130 $134Operating Margin 15.5% 15.9% 16.1% 16.6%EBITDA* $71 $72 $143 $147EBITDA Margin* 17.1% 17.4% 17.7% 18.2%
2021 Reported Q2 Adj* Q2 Reported YTD Adj* YTD
Measurement & Control SolutionsRevenue $368 $368 $722 $722Overall Growth 14% 14% 8% 8%Constant Currency* Growth
11% 5%
Organic Growth* 11% 6%Operating Income $13 $13 $22 $24Operating Margin 3.5% 3.5% 3.0% 3.3%EBITDA* $49 $51 $101 $106EBITDA Margin* 13.3% 13.9% 14.0% 14.7%
*See appendix for definitions of non-GAAP measures and non-GAAP reconciliations

END MARKET KEY FACTS
Q2 2021 Results & Earnings 16
WASTEWATER UTILITIES• Revenue: ~50% of Xylem Utilities Revenue
• Opex/Capex Split: ~65% / ~35%
• XYL Businesses: Primarily Water Infrastructure segment
• Geographic Split: US ~35% / W. Europe ~35% / Em. Mkts & Other ~30%
• U.S. Utility Wastewater Capex: ~4% of total Xylem Revenue
• US & W. Europe leading installed base & strong recurring revenue through Opex
• Emerging Markets mostly greenfield & currently skewed to Capex
CLEAN WATER UTILITIES • Revenue: ~50% of Xylem Utilities Revenue
• Opex/Capex Split: ~70% / ~30%
• XYL Businesses: Primarily MCS segment
• Geographic Split: US ~70% / W. Europe ~15% / Em. Mkts & Other ~15%
• U.S. Utility Clean Water Capex: ~4% of total Xylem Revenue
• Adoption of AMI & digital technologies to address non-revenue water & remote capabilities expected to be long-term secular trend globally
• Under-penetrated international presence, but opportunities increasing
INDUSTRIAL
• Oil & Gas Revenue: <2% of total Xylem
• Mining Revenue: ~4% of total Xylem
• “Light” Industrial Revenue: ~25% of total Xylem
• XYL Businesses: All 3 segments (~40% of WI, ~45% of AWS, 15% of MCS)
• Equipment is generally not tied to output; keeps facilities ‘up-and-running’
(~30% Revenue)
COMMERCIAL
• XYL Businesses: Applied Water
• New build / Replacement (aftermarket): 30% / 70%
• Geographic Split: N. America ~60% / Europe ~20% / Em Mkts & Other ~20%
• Energy efficiency, reliability and “connectivity” critical to customers; exposure to institutional sector
(~10% Revenue)
RESIDENTIAL
• XYL Businesses: Applied Water
• New build / Replacement: 10% / 90%
• Geographic Split: N. America ~70% / W. Europe ~10% / Em Mkts & Other ~20%
• Sales almost exclusively via channel partners
(~5% Revenue)
UTILITIES ~55% REVENUE

Foreign Exchange Translation Sensitivity
Q2 2021 Results & Earnings 17
FOREIGN EXCHANGE TRANSLATION• The table below illustrates the impact of FX fluctuations on Xylem’s reported results
Currency 2021 FY Guidance Rate Revenue Impact on FY 2021 of 5% Decrease in Rate
EPS Impact on FY 2021 of 5% Decrease in Rate
Euro 1.19 ($48M) ($0.11)
GBP 1.38 ($15M) $0.00
SEK 0.12 ($6M) $0.02
RMB 0.15 ($18M) ($0.02)
CAD 0.81 ($10M) ($0.00)
All Other ($42M) ($0.01)
Total ($139M) ($0.12)* Increase in rate would have inverse impact on results
RULE OF THUMB: 1 PENNY MOVEMENT IN EUR/USD RATE,EQUATES TO MORE THAN ONE PENNY MOVEMENT IN EPS FOR THE FULL YEAR
APPENDIX
Q2 2021 Results & Earnings 18
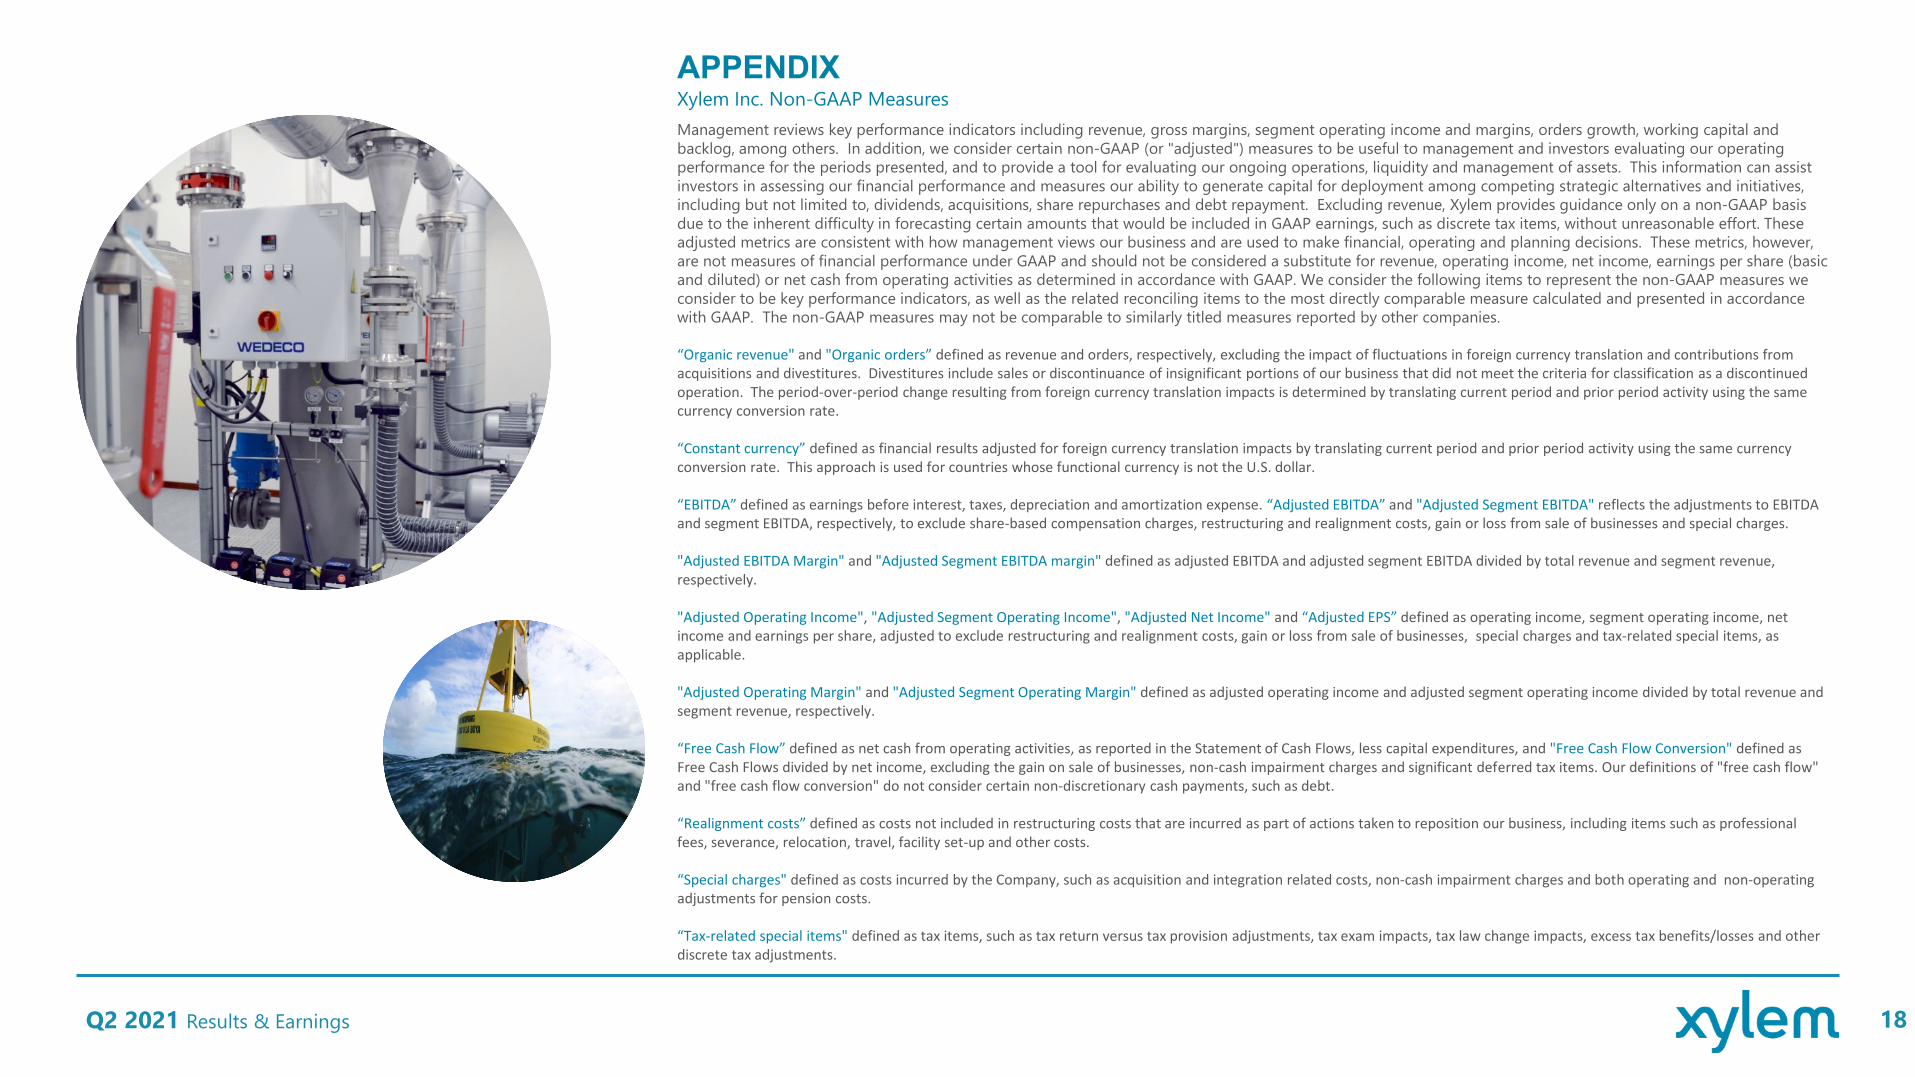
Xylem Inc. Non-GAAP MeasuresManagement reviews key performance indicators including revenue, gross margins, segment operating income and margins, orders growth, working capital and backlog, among others. In addition, we consider certain non-GAAP (or "adjusted") measures to be useful to management and investors evaluating our operating performance for the periods presented, and to provide a tool for evaluating our ongoing operations, liquidity and management of assets. This information can assist investors in assessing our financial performance and measures our ability to generate capital for deployment among competing strategic alternatives and initiatives, including but not limited to, dividends, acquisitions, share repurchases and debt repayment. Excluding revenue, Xylem provides guidance only on a non-GAAP basis due to the inherent difficulty in forecasting certain amounts that would be included in GAAP earnings, such as discrete tax items, without unreasonable effort. These adjusted metrics are consistent with how management views our business and are used to make financial, operating and planning decisions. These metrics, however, are not measures of financial performance under GAAP and should not be considered a substitute for revenue, operating income, net income, earnings per share (basic and diluted) or net cash from operating activities as determined in accordance with GAAP. We consider the following items to represent the non-GAAP measures we consider to be key performance indicators, as well as the related reconciling items to the most directly comparable measure calculated and presented in accordance with GAAP. The non-GAAP measures may not be comparable to similarly titled measures reported by other companies.
“Organic revenue" and "Organic orders” defined as revenue and orders, respectively, excluding the impact of fluctuations in foreign currency translation and contributions from acquisitions and divestitures. Divestitures include sales or discontinuance of insignificant portions of our business that did not meet the criteria for classification as a discontinued operation. The period-over-period change resulting from foreign currency translation impacts is determined by translating current period and prior period activity using the same currency conversion rate.
“Constant currency” defined as financial results adjusted for foreign currency translation impacts by translating current period and prior period activity using the same currency conversion rate. This approach is used for countries whose functional currency is not the U.S. dollar.
“EBITDA” defined as earnings before interest, taxes, depreciation and amortization expense. “Adjusted EBITDA” and "Adjusted Segment EBITDA" reflects the adjustments to EBITDA and segment EBITDA, respectively, to exclude share-based compensation charges, restructuring and realignment costs, gain or loss from sale of businesses and special charges.
"Adjusted EBITDA Margin" and "Adjusted Segment EBITDA margin" defined as adjusted EBITDA and adjusted segment EBITDA divided by total revenue and segment revenue, respectively.
"Adjusted Operating Income", "Adjusted Segment Operating Income", "Adjusted Net Income" and “Adjusted EPS” defined as operating income, segment operating income, net income and earnings per share, adjusted to exclude restructuring and realignment costs, gain or loss from sale of businesses, special charges and tax-related special items, as applicable.
"Adjusted Operating Margin" and "Adjusted Segment Operating Margin" defined as adjusted operating income and adjusted segment operating income divided by total revenue and segment revenue, respectively.
“Free Cash Flow” defined as net cash from operating activities, as reported in the Statement of Cash Flows, less capital expenditures, and "Free Cash Flow Conversion" defined as Free Cash Flows divided by net income, excluding the gain on sale of businesses, non-cash impairment charges and significant deferred tax items. Our definitions of "free cash flow" and "free cash flow conversion" do not consider certain non-discretionary cash payments, such as debt.
“Realignment costs” defined as costs not included in restructuring costs that are incurred as part of actions taken to reposition our business, including items such as professional fees, severance, relocation, travel, facility set-up and other costs.
“Special charges" defined as costs incurred by the Company, such as acquisition and integration related costs, non-cash impairment charges and both operating and non-operating adjustments for pension costs.
“Tax-related special items" defined as tax items, such as tax return versus tax provision adjustments, tax exam impacts, tax law change impacts, excess tax benefits/losses and other discrete tax adjustments.
Appendix
Q2 2021 Results & Earnings 19
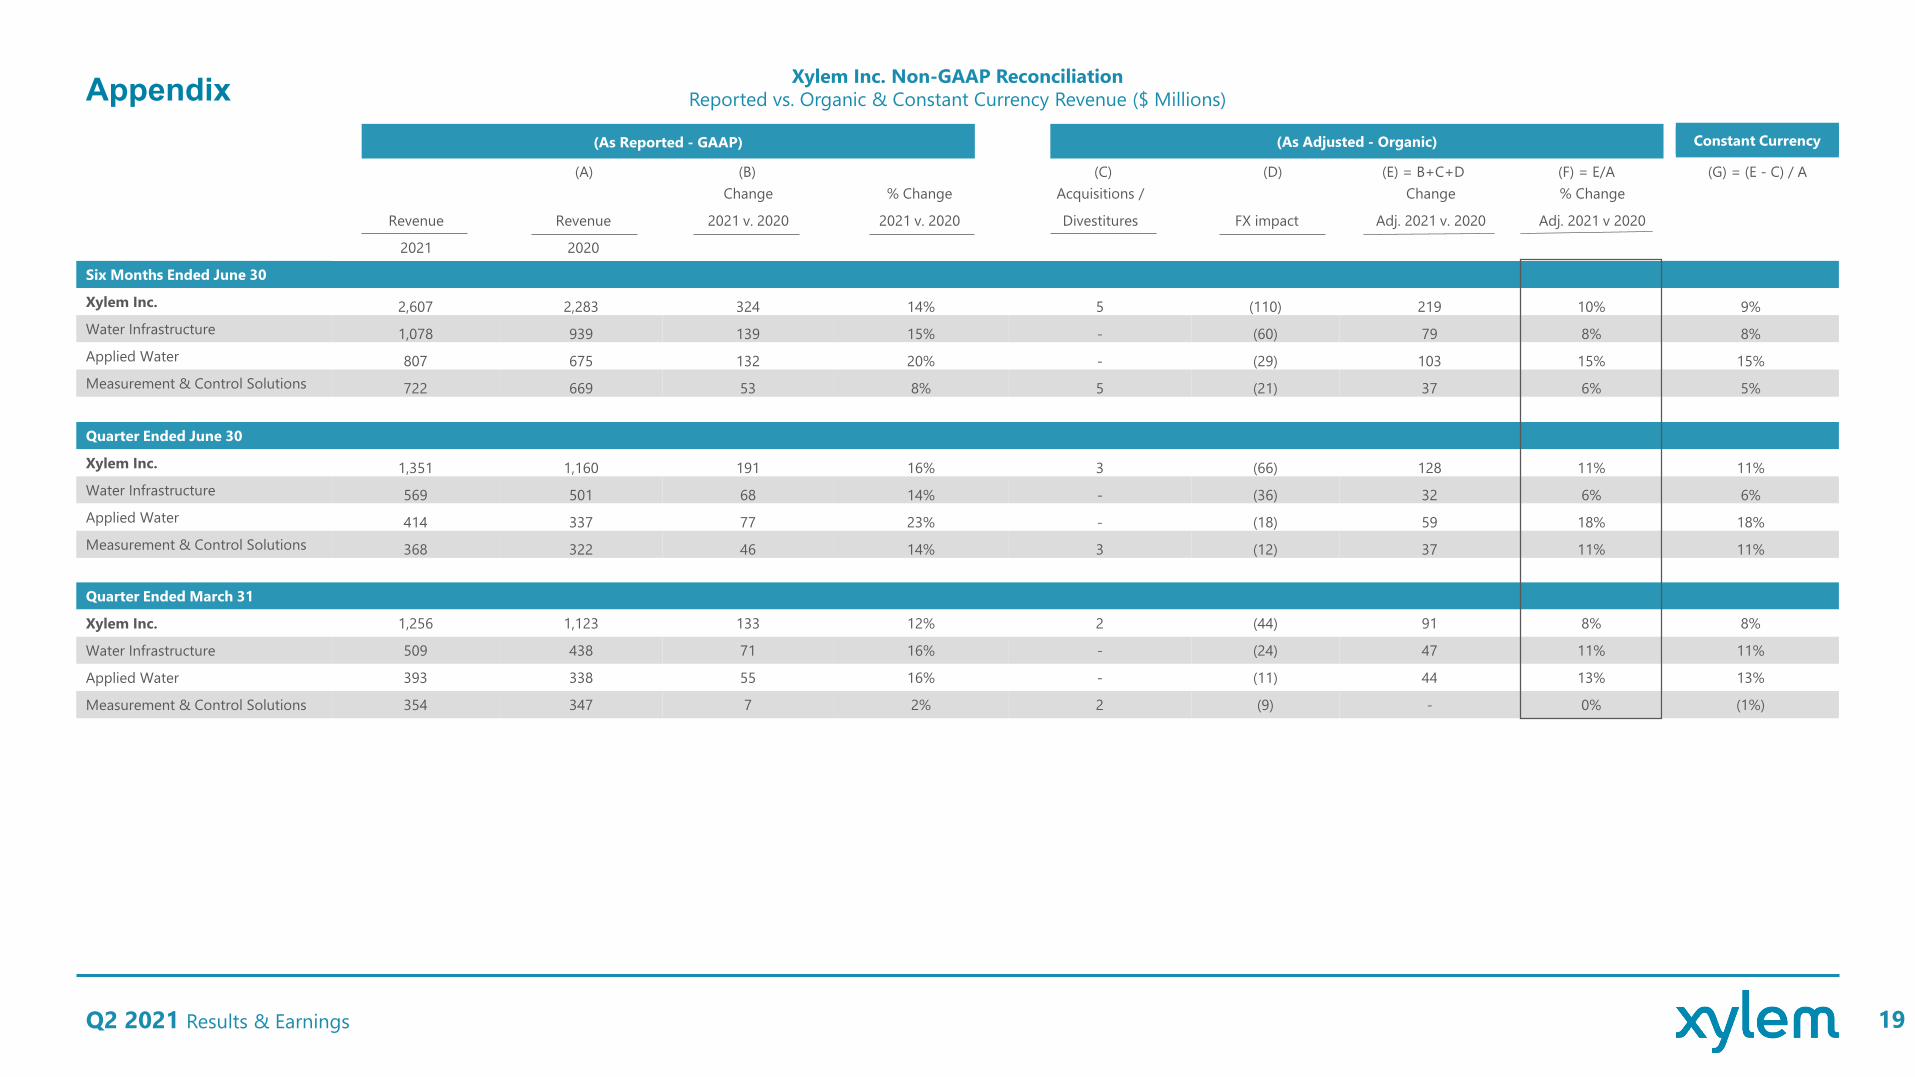
Six Months Ended June 30
Xylem Inc. 2,607 2,283 324 14% 5 (110) 219 10% 9%Water Infrastructure 1,078 939 139 15% - (60) 79 8% 8%Applied Water 807 675 132 20% - (29) 103 15% 15%Measurement & Control Solutions 722 669 53 8% 5 (21) 37 6% 5%
Xylem Inc. Non-GAAP ReconciliationReported vs. Organic & Constant Currency Revenue ($ Millions)
(As Reported - GAAP) (As Adjusted - Organic) Constant Currency
(A) (B) (C) (D) (E) = B+C+D (F) = E/A (G) = (E - C) / AChange % Change Acquisitions / Change % Change
Revenue Revenue 2021 v. 2020 2021 v. 2020 Divestitures FX impact Adj. 2021 v. 2020 Adj. 2021 v 2020
2021 2020
Quarter Ended June 30
Xylem Inc. 1,351 1,160 191 16% 3 (66) 128 11% 11%Water Infrastructure 569 501 68 14% - (36) 32 6% 6%Applied Water 414 337 77 23% - (18) 59 18% 18%Measurement & Control Solutions 368 322 46 14% 3 (12) 37 11% 11%
Quarter Ended March 31
Xylem Inc. 1,256 1,123 133 12% 2 (44) 91 8% 8%
Water Infrastructure 509 438 71 16% - (24) 47 11% 11%
Applied Water 393 338 55 16% - (11) 44 13% 13%
Measurement & Control Solutions 354 347 7 2% 2 (9) - 0% (1%)

Appendix
Q2 2021 Results & Earnings 20
Change % Change Acquisitions / Change % Change
Orders Orders 2021 v. 2020 2021 v. 2020 Divestitures FX impact Adj. 2021 v. 2020 Adj. 2021 v 2020
2021 2020
Year Ended December 31
Xylem Inc. 5,033 5,339 (306) (6%) 4 18 (284) (5%) (5%)
Water Infrastructure 2,134 2,234 (100) (4%) - 20 (80) (4%) (4%)
Applied Water 1,483 1,556 (73) (5%) - - (73) (5%) (5%)
Measurement & Control Solutions 1,416 1,549 (133) (9%) 4 (2) (131) (8%) (9%)
Xylem Inc. Non-GAAP ReconciliationReported vs. Organic & Constant Currency Orders ($ Millions)
(A) (B) (C) (D) (E) = B+C+D (F) = E/A (G) = (E - C) / A
(As Reported - GAAP) (As Adjusted - Organic) Constant Currency
Six Months Ended June 30
Xylem Inc. 3,198 2,493 705 28% 8 (123) 590 24% 23% Water Infrastructure 1,250 1,112 138 12% - (68) 70 6% 6% Applied Water 963 698 265 38% - (33) 232 33% 33% Measurement & Control Solutions 985 683 302 44% 8 (22) 288 42% 41%
Quarter Ended June 30
Xylem Inc. 1,660 1,232 428 35% 1 (74) 355 29% 29% Water Infrastructure 639 598 41 7% - (41) - 0% 0% Applied Water 486 326 160 49% - (20) 140 43% 43% Measurement & Control Solutions 535 308 227 74% 1 (13) 215 70% 69%
Quarter Ended March 31
Xylem Inc. 1,538 1,261 277 22% 7 (49) 235 19% 18%
Water Infrastructure 611 514 97 19% - (27) 70 14% 14%
Applied Water 477 372 105 28% - (13) 92 25% 25%
Measurement & Control Solutions 450 375 75 20% 7 (9) 73 19% 18%

Appendix
Q1 2021 Results & Earnings
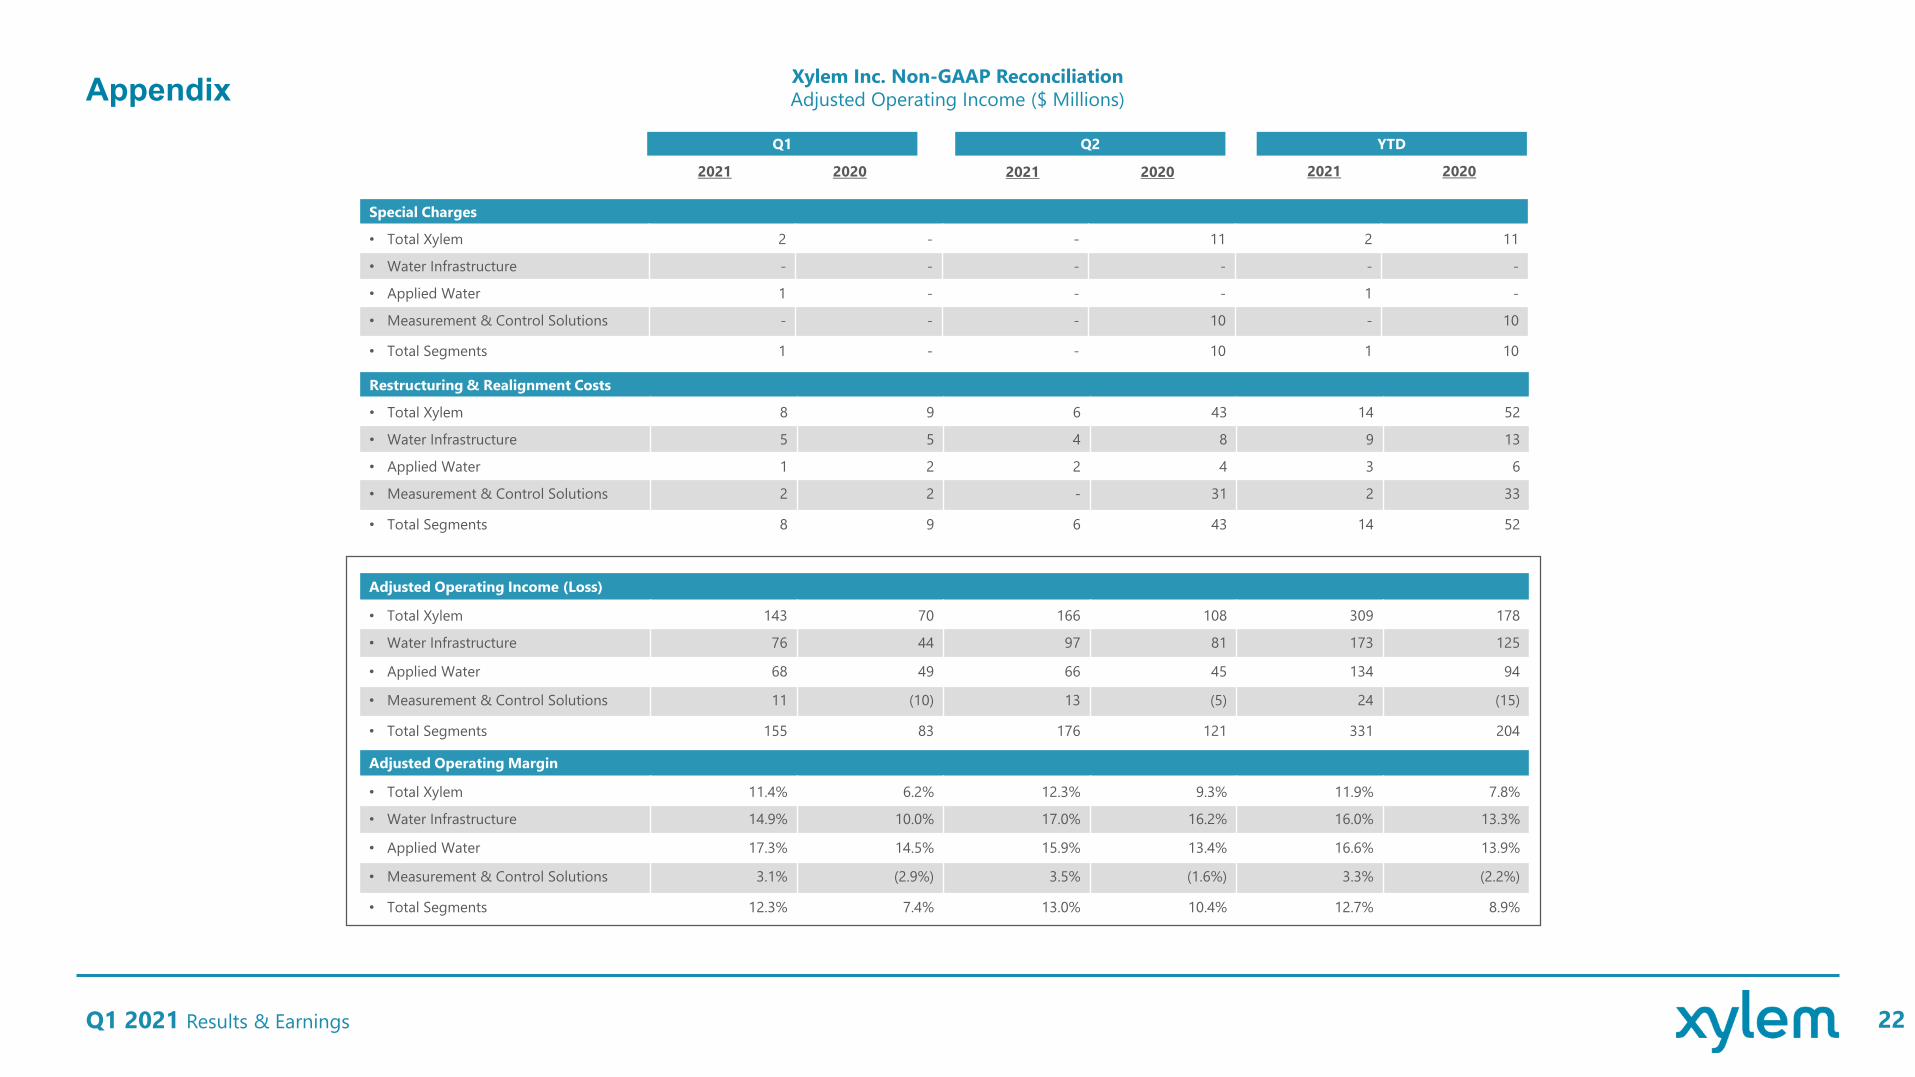
Xylem Inc. Non-GAAP ReconciliationAdjusted Operating Income ($ Millions)
Total Revenue
• Total Xylem 1,256 1,123 1,351 1,160 2,607 2,283
• Water Infrastructure 509 438 569 501 1,078 939
• Applied Water 393 338 414 337 807 675
• Measurement & Control Solutions 354 347 368 322 722 669
Operating Income (Loss)
• Total Xylem 133 61 160 54 293 115
• Water Infrastructure 71 39 93 73 164 112
• Applied Water 66 47 64 41 130 88
• Measurement & Control Solutions 9 (12) 13 (46) 22 (58)
• Total Segments 146 74 170 68 316 142
Operating Margin
• Total Xylem 10.6% 5.4% 11.8% 4.7% 11.2% 5.0%
• Water Infrastructure 13.9% 8.9% 16.3% 14.6% 15.2% 11.9%
• Applied Water 16.8% 13.9% 15.5% 12.2% 16.1% 13.0%
• Measurement & Control Solutions 2.5% (3.5%) 3.5% (14.3%) 3.0% (8.7%)
• Total Segments 11.6% 6.6% 12.6% 5.9% 12.1% 6.2%
YTDQ2Q1
2021 2020 2021 2020 2021 2020
21
Appendix
Q1 2021 Results & Earnings
Xylem Inc. Non-GAAP ReconciliationAdjusted Operating Income ($ Millions)
Restructuring & Realignment Costs
• Total Xylem 8 9 6 43 14 52
• Water Infrastructure 5 5 4 8 9 13
• Applied Water 1 2 2 4 3 6
• Measurement & Control Solutions 2 2 - 31 2 33
• Total Segments 8 9 6 43 14 52
YTDQ2Q1
2021 2020 2021 2020 2021 2020
Special Charges
• Total Xylem 2 - - 11 2 11
• Water Infrastructure - - - - - -
• Applied Water 1 - - - 1 -
• Measurement & Control Solutions - - - 10 - 10
• Total Segments 1 - - 10 1 10
Adjusted Operating Income (Loss)
• Total Xylem 143 70 166 108 309 178
• Water Infrastructure 76 44 97 81 173 125
• Applied Water 68 49 66 45 134 94
• Measurement & Control Solutions 11 (10) 13 (5) 24 (15)
• Total Segments 155 83 176 121 331 204
Adjusted Operating Margin
• Total Xylem 11.4% 6.2% 12.3% 9.3% 11.9% 7.8%
• Water Infrastructure 14.9% 10.0% 17.0% 16.2% 16.0% 13.3%
• Applied Water 17.3% 14.5% 15.9% 13.4% 16.6% 13.9%
• Measurement & Control Solutions 3.1% (2.9%) 3.5% (1.6%) 3.3% (2.2%)
• Total Segments 12.3% 7.4% 13.0% 10.4% 12.7% 8.9%
22

Diluted EPS $ 0.62 $ 0.04 $ 0.66 $ 0.17 $ 0.23 $ 0.40
Appendix
Q2 2021 Results & Earnings 23
Total Revenue 1,351 - 1,351 1,160 - 1,160
Operating Income 160 6 a 166 54 54 a 108
Operating Margin 11.8% 12.3% 4.7% 9.3%
Interest Expense (21) - (21) (18) - (18)
Other Non-Operating Income (Expense)Gain/(Loss) From Sale of Business
(3)2
3(2)
b --
(1)-
2-
b 1-
Income before Taxes 138 7 145 35 56 91
Provision for Income Taxes (25) (1) c (26) (4) (14) c (18)
Net Income Attributable to Xylem 113 6 119 31 42 73
Diluted Shares 181.3 181.3 180.6 180.6
Year-over-year currency translation impact on current year diluted EPS $ 0.05 $ - $ 0.05
Diluted EPS at Constant Currency $ 0.57 $ 0.04 $ 0.61
Xylem Inc. Non-GAAP ReconciliationAdjusted Diluted EPS
($ Millions, except per share amounts)
As Reported Adjustments Adjusted As Reported Adjustments Adjusted
Q2 2021 Q2 2020
a) Quarter-to-date: Restructuring & realignment costs of $6 million in 2021 and $43 million in 2020, as well as special charges of $11m ($10 million of intangible asset impairment and $1 million of other charges) in 2020.
b) Quarter-to-date: Special non-operating charges consist of $3 million in 2021 and $2 million in 2020, of pension costs related to the UK pension plan that is going to be part of a buyout.
c) Quarter-to-date: Net tax impact on restructuring & realignment costs of $1 million in 2021 and $10 million in 2020; and $1 million of tax on special tax items in 2021 and $3 million of tax on special tax items in 2020; $1m positive adjustment in 2021 from tax related special charges and $1 million of negative adjustment from tax related special benefits in 2020, respectively.

Diluted EPS $ 1.10 $ 0.13 $ 1.23 $ 0.38 $ 0.25 $ 0.63
Appendix
Q2 2021 Results & Earnings 24
Total Revenue 2,607 - 2,607 2,283 - 2,283
Operating Income 293 16 a 309 115 63 a 178
Operating Margin 11.2% 11.9% 5.0% 7.8%
Interest Expense (42) - (42) (34) - (34)
Other Non-Operating Income (Expense)Gain/(Loss) From Sales of Business
(1)2
4(2)
b 3-
(4)-
3-
b (1)-
Income before Taxes 252 18 270 77 66 143
Provision for Income Taxes (52) 3 c (49) (8) (20) c (28)
Net Income Attributable to Xylem 200 21 221 69 46 115
Diluted Shares 181.4 181.4 181.0 181.0
Year-over-year currency translation impact on current year diluted EPS $ 0.09 $ 0.02 $ 0.11
Diluted EPS at Constant Currency $ 1.01 $ 0.11 $ 1.12
Xylem Inc. Non-GAAP ReconciliationAdjusted Diluted EPS
($ Millions, except per share amounts)
As Reported Adjustments Adjusted As Reported Adjustments Adjusted
Q2 YTD 2021 Q2 YTD 2020
a) Year-to-date: Restructuring & realignment costs of $14 million and $52 million in 2021 and 2020, respectively; special charges of $2 million ($1 million of intangible asset impairment charges and $1 million of other charges) and $11 million of special charges in 2020 ($10 million of intangible asset impairment charges and $1 million of other charges).
b) Year-to-date: Special non-operating charges consist of $4 million in 2021 and $3 million in 2020, of pension costs related to the UK pension plan that is going to be part of a buyout.
c) Year-to-date: Net tax impact on restructuring & realignment costs of $3 million and $12 million in 2021 and 2020, respectively; $1 million and $3 million of tax impact on special charges in 2021 and 2020, respectively; and $7 million of positive adjustment from tax related special charges in 2021 and $5 million of negative adjustment from tax related special benefits in 2020, respectively.

2020
Q1 Q2 Q3 Q4 Total
Net Income 38 31 37 148 254
Income Tax Expense (Benefit) 4 4 13 10 31
Interest Expense (Income), net 14 16 20 20 70
Depreciation 29 29 30 29 117
Amortization 35 33 33 33 134
EBITDA 120 113 133 240 606
Share-based Compensation 8 8 3 7 26
Restructuring & Realignment 9 43 15 10 77
Special Charges 1 13 71 1 86
Adjusted EBITDA 138 177 222 258 795
Revenue 1,123 1,160 1,220 1,373 4,876
Adjusted EBITDA Margin 12.3% 15.3% 18.2% 18.8% 16.3%
Appendix
Q2 2021 Results & Earnings 25
2021
Q1 Q2 Q3 Q4 Total
Net Income 87 113 200
Income Tax Expense 27 25 52
Interest Expense (Income), net 19 19 38
Depreciation 30 29 59
Amortization 32 33 65
EBITDA 195 219 414
Share-based Compensation 9 8 17
Restructuring & Realignment 8 6 14
Loss/(Gain) from sale of business
- (2) (2)
Special Charges 3 3 6
Adjusted EBITDA 215 234 449
Revenue 1,256 1,351 2,607
Adjusted EBITDA Margin 17.1% 17.3% 17.2%
Xylem Inc. Non-GAAP ReconciliationEBITDA and Adjusted EBITDA by Quarter
($ Millions)
Xylem Inc. Non-GAAP ReconciliationEBITDA and Adjusted EBITDA by Quarter Water Infrastructure
($ Millions)
2021
Q1 Q2 Q3 Q4 Total
Pre-Tax Income 70 92 162
Interest Expense (Income), net (1) (1) (2)
Depreciation 11 11 22
Amortization 2 2 4
EBITDA 82 104 186
Share-based Compensation 1 - 1
Restructuring & Realignment 5 4 9
Adjusted EBITDA 88 108 196
Revenue 509 569 1,078
Adjusted EBITDA Margin 17.3% 19.0% 18.2%
2020
Q1 Q2 Q3 Q4 Total
Pre-Tax Income 37 71 85 116 309
Interest Expense (Income), net - (1) - - (1)
Depreciation 11 11 11 11 44
Amortization 4 5 2 2 13
EBITDA 52 86 98 129 365
Share-based Compensation - 1 - 1 2
Restructuring & Realignment 5 8 8 7 28
Adjusted EBITDA 57 95 106 137 395
Revenue 438 501 524 616 2,079
Adjusted EBITDA Margin 13.0% 19.0% 20.2% 22.2% 19.0%
Appendix
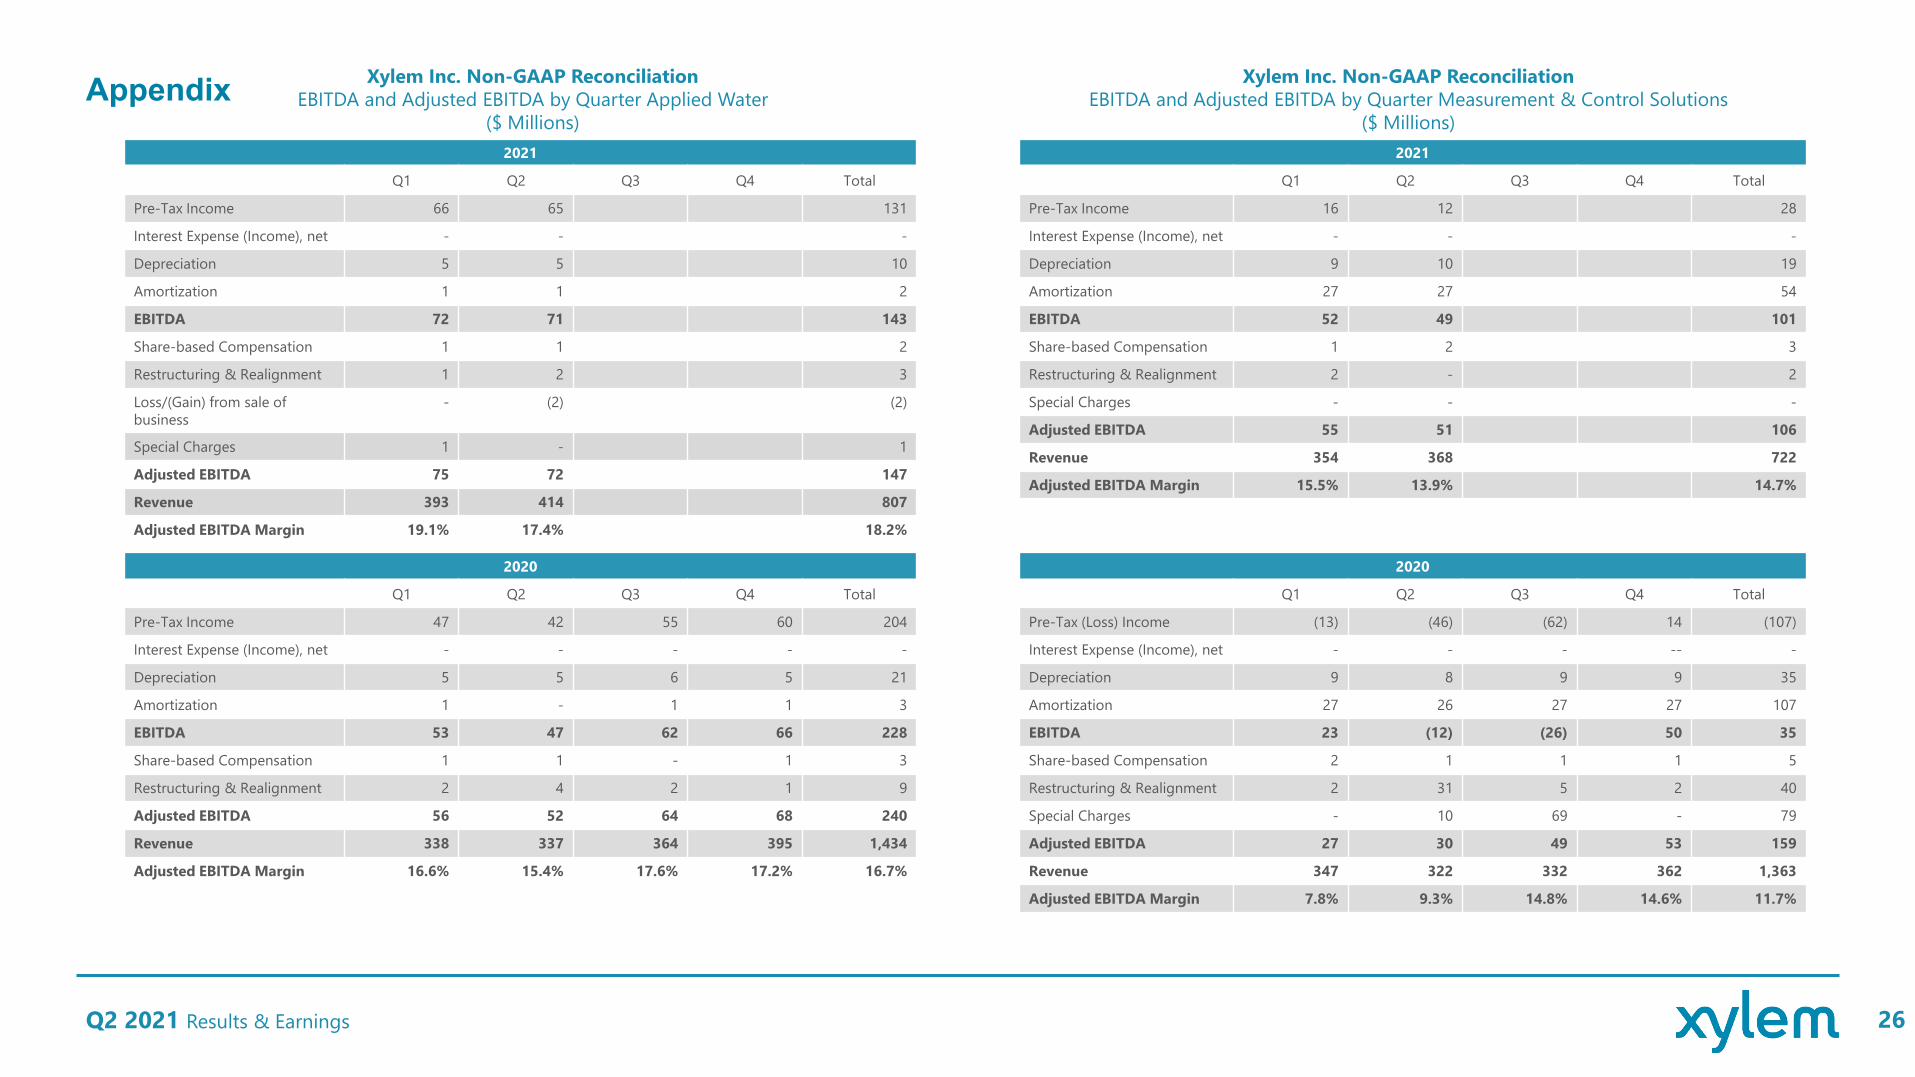
Q2 2021 Results & Earnings 26
2021
Q1 Q2 Q3 Q4 Total
Pre-Tax Income 66 65 131
Interest Expense (Income), net - - -
Depreciation 5 5 10
Amortization 1 1 2
EBITDA 72 71 143
Share-based Compensation 1 1 2
Restructuring & Realignment 1 2 3
Loss/(Gain) from sale of business
- (2) (2)
Special Charges 1 - 1
Adjusted EBITDA 75 72 147
Revenue 393 414 807
Adjusted EBITDA Margin 19.1% 17.4% 18.2%
Xylem Inc. Non-GAAP ReconciliationEBITDA and Adjusted EBITDA by Quarter Applied Water
($ Millions)
2020
Q1 Q2 Q3 Q4 Total
Pre-Tax Income 47 42 55 60 204
Interest Expense (Income), net - - - - -
Depreciation 5 5 6 5 21
Amortization 1 - 1 1 3
EBITDA 53 47 62 66 228
Share-based Compensation 1 1 - 1 3
Restructuring & Realignment 2 4 2 1 9
Adjusted EBITDA 56 52 64 68 240
Revenue 338 337 364 395 1,434
Adjusted EBITDA Margin 16.6% 15.4% 17.6% 17.2% 16.7%
2021
Q1 Q2 Q3 Q4 Total
Pre-Tax Income 16 12 28
Interest Expense (Income), net - - -
Depreciation 9 10 19
Amortization 27 27 54
EBITDA 52 49 101
Share-based Compensation 1 2 3
Restructuring & Realignment 2 - 2
Special Charges - - -
Adjusted EBITDA 55 51 106
Revenue 354 368 722
Adjusted EBITDA Margin 15.5% 13.9% 14.7%
Xylem Inc. Non-GAAP ReconciliationEBITDA and Adjusted EBITDA by Quarter Measurement & Control Solutions
($ Millions)
2020
Q1 Q2 Q3 Q4 Total
Pre-Tax (Loss) Income (13) (46) (62) 14 (107)
Interest Expense (Income), net - - - -- -
Depreciation 9 8 9 9 35
Amortization 27 26 27 27 107
EBITDA 23 (12) (26) 50 35
Share-based Compensation 2 1 1 1 5
Restructuring & Realignment 2 31 5 2 40
Special Charges - 10 69 - 79
Adjusted EBITDA 27 30 49 53 159
Revenue 347 322 332 362 1,363
Adjusted EBITDA Margin 7.8% 9.3% 14.8% 14.6% 11.7%
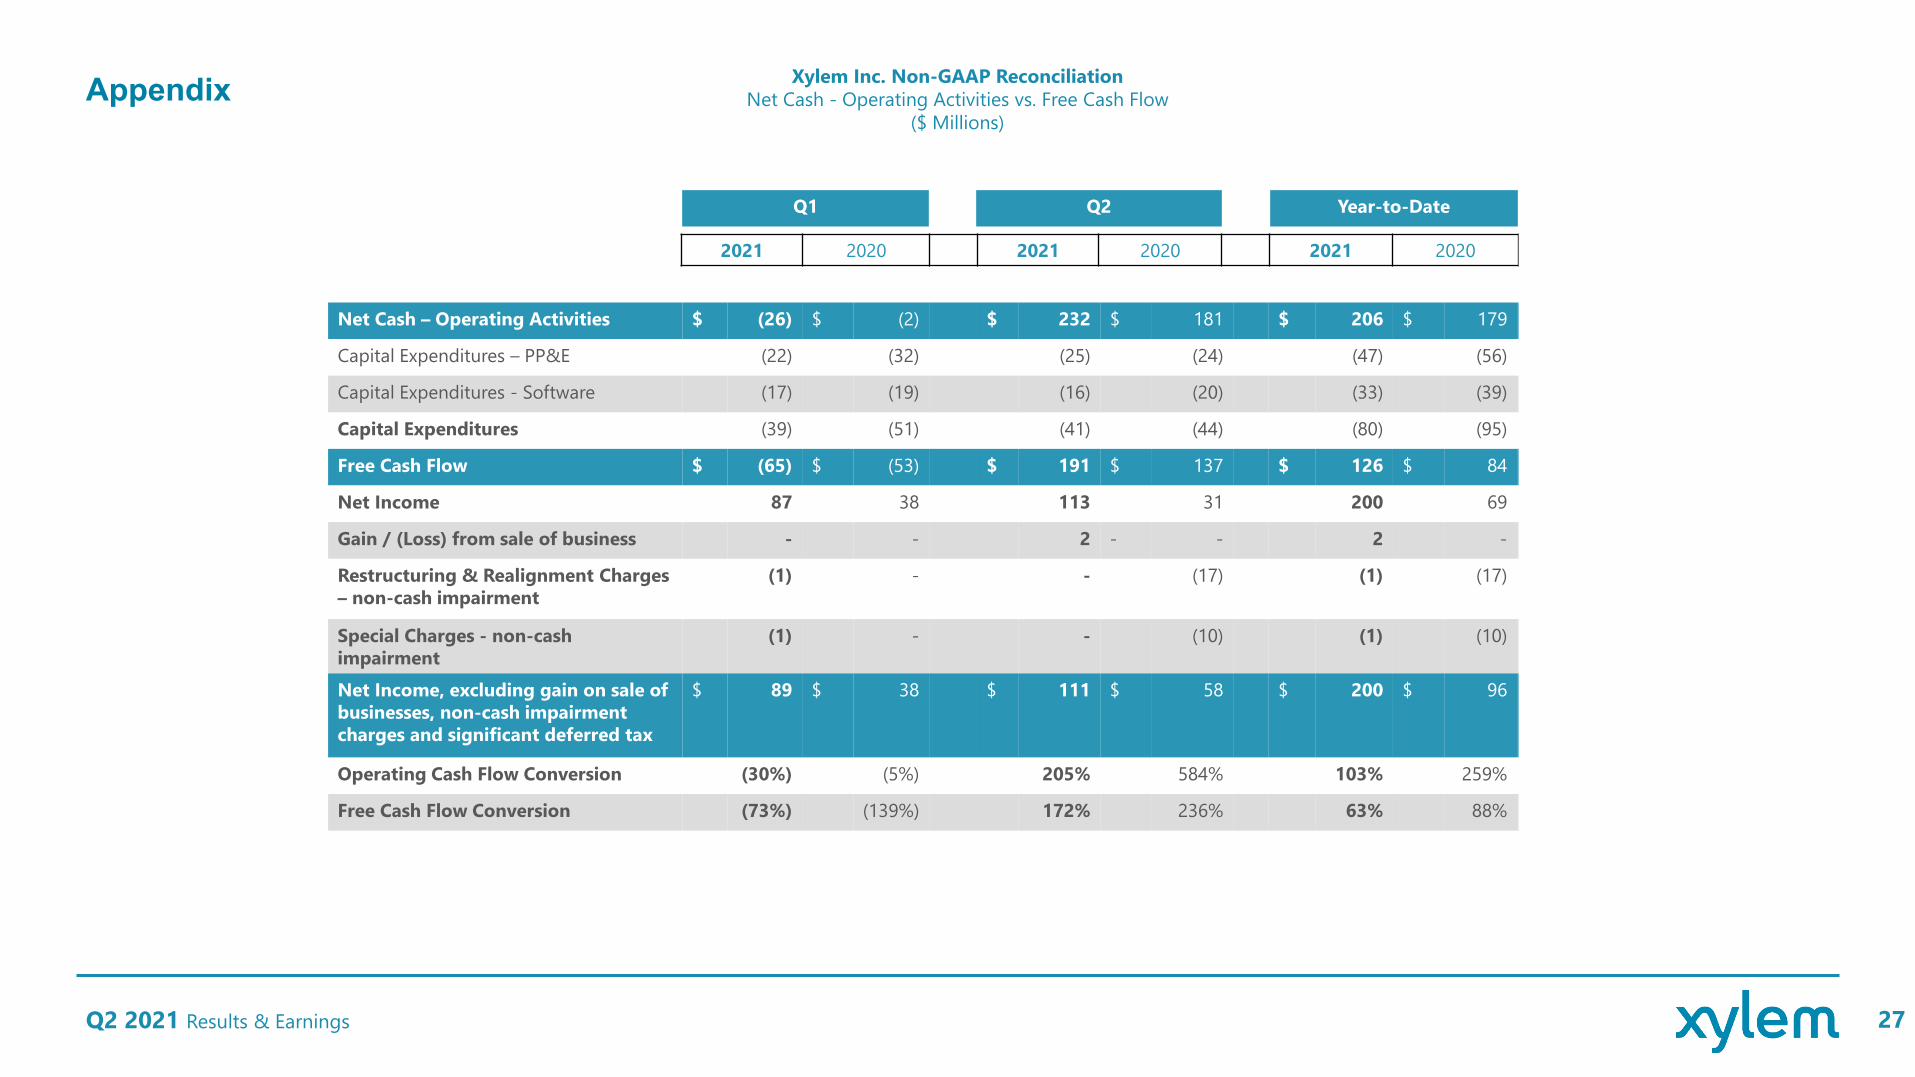
Appendix
Q2 2021 Results & Earnings 27
Xylem Inc. Non-GAAP ReconciliationNet Cash - Operating Activities vs. Free Cash Flow
($ Millions)
Q1 Q2 Year-to-Date Q4
2021 2020 2021 2020 2021 2020 2021 2020 20
Net Cash – Operating Activities $ (26) $ (2) $ 232 $ 181 $ 206 $ 179 $ $ $
Capital Expenditures – PP&E (22) (32) (25) (24) (47) (56)
Capital Expenditures - Software (17) (19) (16) (20) (33) (39)
Capital Expenditures (39) (51) (41) (44) (80) (95)
Free Cash Flow $ (65) $ (53) $ 191 $ 137 $ 126 $ 84 $ $ $
Net Income 87 38 113 31 200 69
Gain / (Loss) from sale of business - - 2 - - 2 -
Restructuring & Realignment Charges– non-cash impairment
(1) - - (17) (1) (17)
Special Charges - non-cash impairment
(1) - - (10) (1) (10)
Net Income, excluding gain on sale of businesses, non-cash impairment charges and significant deferred tax
$ 89 $ 38 $ 111 $ 58 $ 200 $ 96 $ $ $
Operating Cash Flow Conversion (30%) (5%) 205% 584% 103% 259%
Free Cash Flow Conversion (73%) (139%) 172% 236% 63% 88%

THANK YOUQ2 2021 Results & Earnings
Matt Latino, VP, Investor RelationsGraham Hackett, Sr. Manager, Investor RelationsMike Pilla, IR Associate, Finance Leadership Development Program
NYSE: XYL
Xylem Investor Relations Website
LinkedIn | Twitter | Facebook | YouTube | Instagram


