30
Second - Quarter 2021 Review August 10, 2021
Second-Quarter 2021 ReviewAugust 10, 2021
2
Forward-Looking Statementsand Ownership Structure
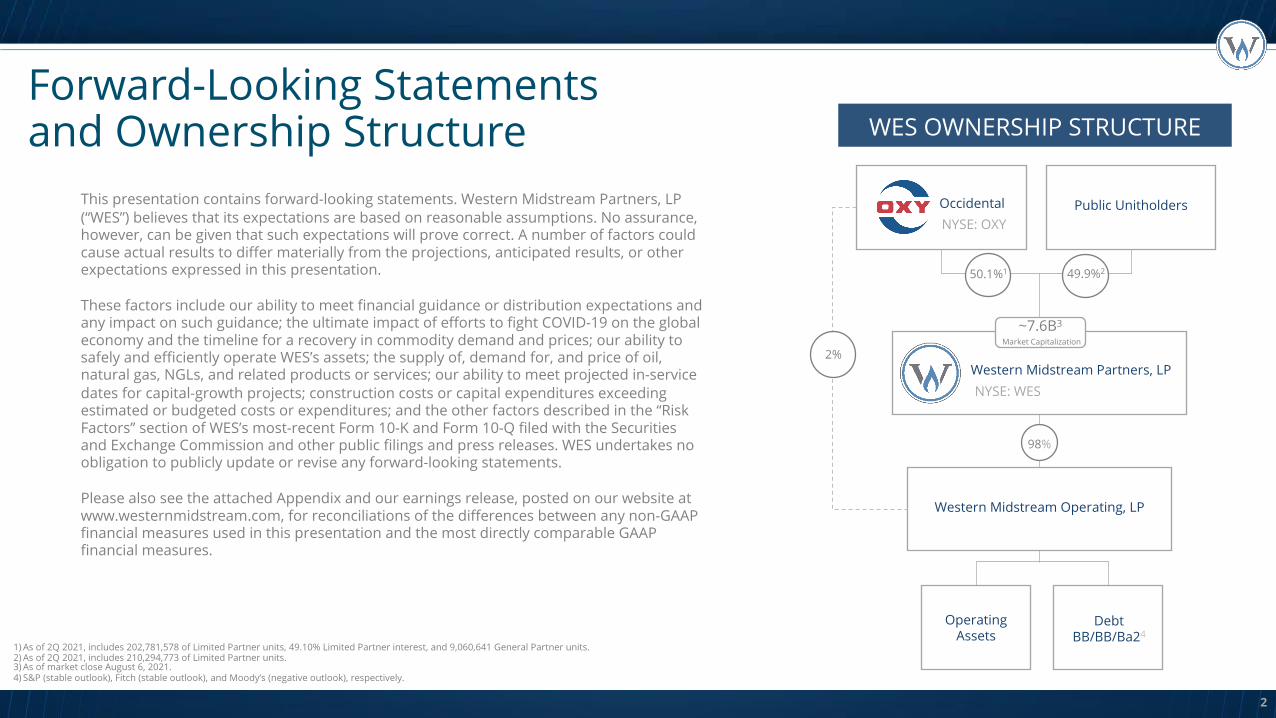
This presentation contains forward-looking statements. Western Midstream Partners, LP (“WES”) believes that its expectations are based on reasonable assumptions. No assurance, however, can be given that such expectations will prove correct. A number of factors could cause actual results to differ materially from the projections, anticipated results, or other expectations expressed in this presentation.
These factors include our ability to meet financial guidance or distribution expectations and any impact on such guidance; the ultimate impact of efforts to fight COVID-19 on the global economy and the timeline for a recovery in commodity demand and prices; our ability to safely and efficiently operate WES’s assets; the supply of, demand for, and price of oil, natural gas, NGLs, and related products or services; our ability to meet projected in-service dates for capital-growth projects; construction costs or capital expenditures exceeding estimated or budgeted costs or expenditures; and the other factors described in the “Risk Factors” section of WES’s most-recent Form 10-K and Form 10-Q filed with the Securities and Exchange Commission and other public filings and press releases. WES undertakes no obligation to publicly update or revise any forward-looking statements.
Please also see the attached Appendix and our earnings release, posted on our website at www.westernmidstream.com, for reconciliations of the differences between any non-GAAP financial measures used in this presentation and the most directly comparable GAAP financial measures.
WES OWNERSHIP STRUCTURE
OccidentalNYSE: OXY
Public Unitholders
Western Midstream Partners, LPNYSE: WES
Western Midstream Operating, LP
OperatingAssets
DebtBB/BB/Ba24
2%
50.1%1 49.9%2
98%
~7.6B3
Market Capitalization
1) As of 2Q 2021, includes 202,781,578 of Limited Partner units, 49.10% Limited Partner interest, and 9,060,641 General Partner units.2) As of 2Q 2021, includes 210,294,773 of Limited Partner units.3) As of market close August 6, 2021. 4) S&P (stable outlook), Fitch (stable outlook), and Moody’s (negative outlook), respectively.

3
Financial Performance

($ in millions)2Q 2021 Actuals
Operating Cash Flow $452.1
Cash Capital Investments1 $72.3
Free Cash Flow2 $379.8
Cash Distributions Paid3 $133.0
Free Cash Flow After Distributions $246.8
4
Financial Performance
1) Includes net distributions to equity investments. Accrued capital (includes equity investments, excludes capitalized interest, and excludes capital expenditures associated with the 25% third-party interest in Chipeta) for second-quarter 2021 was $84.0 million.
2) See appendix for Free Cash Flow reconciliation.3) Cash distributions paid in second-quarter 2021, declared in first-quarter 2021. Cash distributions declared in second-quarter 2021 were approximately $134.7 million. 4) Represents net income (loss) available to limited partners.
$226 million
Net Income4
$491 million
Adjusted EBITDA

($ in millions)
Adjusted EBITDA1 $1,825 - $1,925
Total Capital Expenditures2 $275 - $375
Leverage Target3 ≤4.0x
Per-Unit Cash Distribution4 ≥$1.24
5
2021 Guidance
1)A reconciliation of the Adjusted EBITDA range to net cash provided by operating activities and net income (loss) is not provided because the items necessary to estimate such amounts are not reasonably estimable at this time.2)Accrual-based, includes equity investments, excludes capitalized interest, and excludes capital expenditures associated with the 25% third-party interest in Chipeta.3)Debt-to-Adjusted EBITDA (trailing twelve months) target at year-end 2021.4)Full-year 2021 distributions of at least $1.24 per unit. Our Board of Directors will continue to evaluate the distribution on a quarterly basis.
6
Operational Update

Operational Performance
Note: Represents total throughput attributable to WES, which excludes the 2.0% Occidental subsidiary-owned limited partner interest in WES Operating and, for natural-gas assets, the 25% third-party interest in Chipeta, which collectively represent WES’s noncontrolling interests.
2Q 2021 Actuals
Natural-Gas Throughput (MMcf/d) 4,265
Adjusted Gross Margin for Natural-Gas Assets ($/Mcf)
$1.21
Crude-Oil and NGLs Throughput (MBbls/d) 687
Adjusted Gross Margin for Crude-Oil and NGLs Assets ($/Bbl)
$2.40
Produced-Water Throughput (MBbls/d) 688
Adjusted Gross Margin for Produced-Water Assets ($/Bbl)
$0.92
7

OILGAS WATER
8
Expected 2021 Growth
High-Single Digits
Mid-SingleDigits
HighTeens
Note: Expected 2021 exit rate compared to 2020 exit rate.

9
Q&A

10
Appendix
11
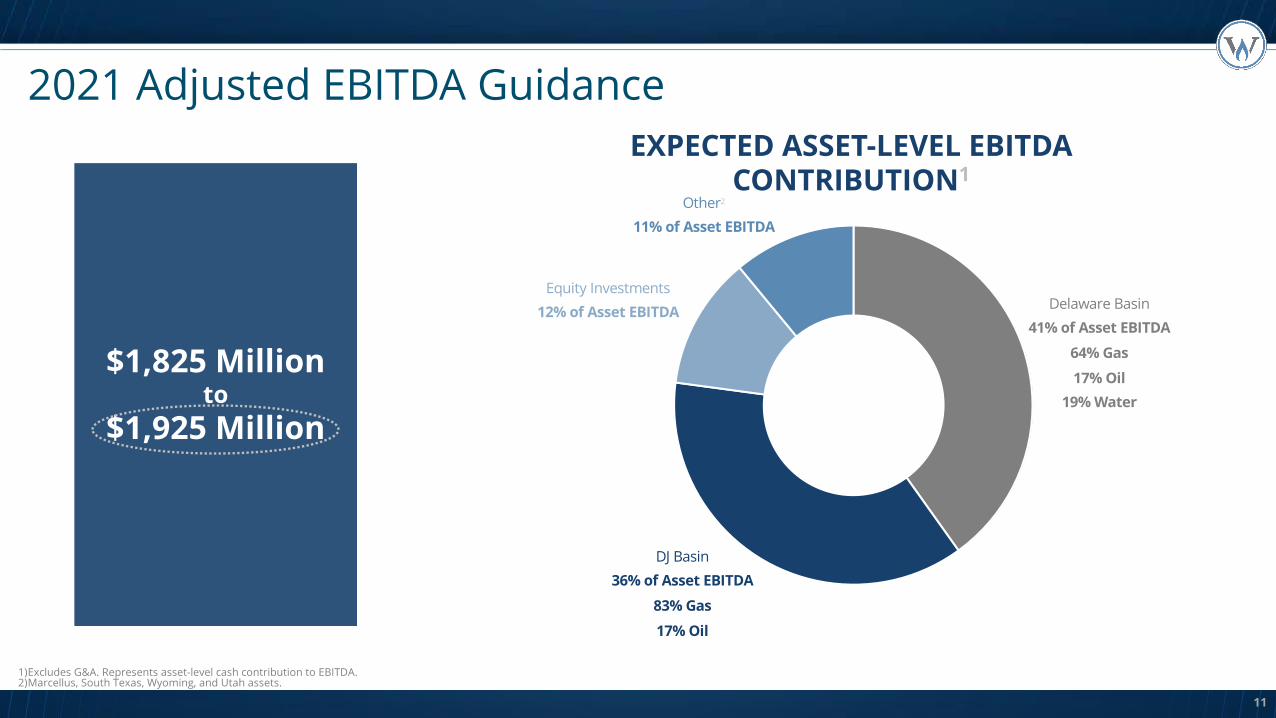
2021 Adjusted EBITDA Guidance
Delaware Basin41% of Asset EBITDA
64% Gas
17% Oil19% Water
DJ Basin36% of Asset EBITDA
83% Gas
17% Oil
Other2
11% of Asset EBITDA
Equity Investments12% of Asset EBITDA
$1,825 Millionto
$1,925 Million
1)Excludes G&A. Represents asset-level cash contribution to EBITDA.2)Marcellus, South Texas, Wyoming, and Utah assets.
EXPECTED ASSET-LEVEL EBITDA CONTRIBUTION1

2021 Capital Guidance
12
$275 Millionto
$375 Million
Equity Investments4%
Other15%
DJ Basin14%75% Gas25% Oil
Delaware Basin67%62% Gas13% Oil25% Water
Well Connect28%
Equity Investments4%
Expansion43%
Maintenance15%
Other10%
Note: Accrual-based, includes equity investments, excludes capitalized interest, and excludes capital expenditures associated with the 25% third-party interest in Chipeta.

13
WES Liquidity Profile
Maturities($ in millions)
2021 $0
2022-20241 $821
2025+ $6,650
Note: As of June 30, 2021.1)Due between July 1, 2022 and December 31, 2024.
Liquidity($ in millions)
RCF Capacity $1,995
Cash $306
0
500
1000
1500
2000
2500
2020 2021 2022 2023 2024
Near-Term Maturity Profile ($ in millions)
Liquidity

14
2021 Sensitivity Analysis
Note: Volume changes are to Delaware and DJ Basins throughput equally from all producers, excluding any impact as a result of force majeure events.
-10% VOLUME
5% to 6% decreasein EBITDA
+10% VOLUME
-20% VOLUME
+20% VOLUME
5% to 6% increasein EBITDA
10% to 12%decreasein EBITDA
10% to 12% increasein EBITDA

15
Premier Asset Portfolio
1) Revenue and Total Capital are based on full-year 2020 actuals.2) Based on full-year 2020 wellhead volumes for gas and total throughput for liquids, excludes equity investments.3) As of December 31, 2020. MVC is defined as minimum-volume commitment with associated deficiency fee.
23 GATHERINGSYSTEMS
71 PROCESSING &TREATING FACILITIES
6 NATURAL-GAS PIPELINES
15 CRUDE-OIL/NGLsPIPELINES
17K PIPELINE MILES~WES Assets
WES Equity Interests
WES Equity-Interest Pipelines
Revenue: 46% Delaware Basin, 38% DJ Basin
Total Capital: 68% Delaware Basin, 10% DJ
Basin
~93% Fee-Based Gas Contracts100% Fee-Based Liquids Contracts
Value-Focused Portfolio1
Direct Commodity Exposure Protection2
MVC or Cost-of-Service Protection3
79% Natural-Gas Throughput
85% Crude-Oil and NGLs Throughput
100% Produced-Water Throughput

16
Delaware Basin: Expansive Multi-Product Infrastructure
145 141 147168
192 202183 178 162
184
0
50
100
150
200
1Q 2019 2Q 2019 3Q 2019 4Q 2019 1Q 2020 2Q 2020 3Q 2020 4Q 2020 1Q 2021 2Q 2021
MBb
ls/d
Oil
1,178 1,179 1,272 1,274 1,389 1,309 1,294 1,196 1,133 1,244
0
500
1000
1500
1Q 2019 2Q 2019 3Q 2019 4Q 2019 1Q 2020 2Q 2020 3Q 2020 4Q 2020 1Q 2021 2Q 2021
MM
cf/d
Gas
518 515580 610
717 773687 670
607702
0
200
400
600
1Q 2019 2Q 2019 3Q 2019 4Q 2019 1Q 2020 2Q 2020 3Q 2020 4Q 2020 1Q 2021 2Q 2021
MBb
ls/d
Water
Long-Term Contract Support
Product Weighted-Average Remaining Life2
Gas ~7 Years
Oil +11 Years
Water ~11 Years
1) Percentage of production from Occidental as of year-end 2020. 2) Weighted-average remaining contract life by volume as of year-end 2020.
Customer Base
Product Percentage of Related-Party Volumes1
Gas 47%
Oil 96%
Water 87%

17
Delaware Basin: Gas Infrastructure
WES Gas ProcessingWest Texas Complex
1.370 Bcf/d
Equity-Interest Gas Processing
Mi Vida 200 MMcf/d
Ranch Westex125 MMcf/d
Note: Expected capacity as of year-end 2021.Under 5% of total gas throughput from New Mexico federal lands.
5 MILES
NEW MEXICO
TEXAS
CULBERSON
REEVES
LOVING
WINKLER
WARD
LEAEDDY
RAMSEY
MENTONE
MI VIDA RANCHWESTEX
Gas-Processing Plant
Gas-Gathering Lines
Federal Land (Surface and Mineral)
State Land (Surface and Mineral)

18
Delaware Basin: Oil Infrastructure
Note: Expected capacity as of year-end 2021.Under 5% of total gas throughput from New Mexico federal lands.
NEW MEXICO
TEXAS
CULBERSON
REEVES
LOVING
WINKLER
WARD
LEAEDDY
REEVES
NORTH LOVING
Oil Treating256 MBbls/d Capacity
Regional-Oil-Treating Facility
Oil Pipelines
Federal Land (Surface and Mineral)
State Land (Surface and Mineral)
5 MILES

19
Delaware Basin: Water Infrastructure
Note: Expected capacity as of year-end 2021.Under 5% of total gas throughput from New Mexico federal lands.
NEW MEXICO
TEXAS
CULBERSON
REEVES
LOVING
WINKLER
WARD
LEAEDDY
Salt-Water Disposal1,180 MBbls/d Capacity
Salt-Water Disposal Wells
Water-Gathering Lines
Federal Land (Surface and Mineral)
State Land (Surface and Mineral)
5 MILES

20
DJ Basin
102 112 128 129 128 11386 78 82 98
0
100
1Q 2019 2Q 2019 3Q 2019 4Q 2019 1Q 2020 2Q 2020 3Q 2020 4Q 2020 1Q 2021 2Q 2021
MBb
ls/d
Oil
1,258 1,266 1,1241,295 1,407 1,329 1,290 1,197 1,344 1,413
0
500
1000
1500
1Q 2019 2Q 2019 3Q 2019 4Q 2019 1Q 2020 2Q 2020 3Q 2020 4Q 2020 1Q 2021 2Q 2021
MM
cf/d
Gas
Long-Term Contract Support
Product Weighted-Average Remaining Life2
Gas ~81% = ~8 Years~19% = Life of Lease
Oil +7.5 Years
Customer Base
Product Percentage of Related-Party Volumes1
Gas ~65%
Oil 100%
1) Percentage of production from Occidental as of year-end 2020. 2) Weighted-average remaining contract life by volume as of year-end 2020.

21
DJ Basin
Gas Processing1,730 MMcf/d
Oil Stabilization155 MBbls/d
Note: Expected capacity as of year-end 2021.
COLORADO
LARIMER
BOULDER
ADAMS
WELD
5 MILES
Gas-Processing Plant
Oil-Treating Facilities
Pipelines (Oil and Gas)
LATHAM CRYO
COSF
WATTENBERG PLANT
LANCASTER COMPLEX
COLORADO
LARIMER
BOULDER
ADAMS
WELD
5 MILES
LATHAM CRYO
COSF
WATTENBERG PLANT
LANCASTER COMPLEX
Gas-Processing Plant
Oil-Treating Facilities
Pipelines (Oil and Gas)
Federal Land
State Land

22
Additional Portfolio Assets
PennsylvaniaMarcellus Gas Gathering
WyomingHilight Complex
Granger ComplexRed Desert Complex
South TexasSpringfield Gathering
Brasada Gas Plant
UtahChipeta

23
Equity Investment Overview
WES Equity InterestsWES Equity-Interest Pipelines
Equity InvestmentWES
Ownership Location Description Operator
Ranch Westex 50% Ward County, TX 125 MMcf/d gas-processing plant Energy Transfer
Mi Vida 50% Ward County, TX 200 MMcf/d gas-processing plant Energy Transfer
Red Bluff Express 30% Reeves County, TX to Waha, TX 1.5 Bcf/d natural-gas pipeline Energy Transfer
Cactus II 15% Wink, TX to Corpus Christi, TX 670 MBbls/d crude-oil pipeline Plains All American
Whitethorn LLC 20% Midland, TX to Houston, TX 620 MBbls/d crude-oil pipeline Enterprise
Mont Belvieu JV 25% Mont Belvieu, TX 170 MBbls/d NGL fractionation Enterprise
Saddlehorn 20% DJ Basin to Cushing, OK 340 MBbls/d crude-oil pipeline Magellan
Front Range Pipeline 33.33% DJ Basin to Skellytown, TX 250 MBbls/d NGL pipeline Enterprise
Texas Express Pipeline 20% Skellytown, TX to Mont Belvieu, TX 366 MBbls/d NGL pipeline Enterprise
Texas Express Gathering 20% TX Panhandle/OK to Mont Belvieu, TX 138 mi NGL-gathering system Midcoast
White Cliffs 10% DJ Basin to Cushing, OK 180+ MBbls/d crude/NGL pipelines Energy Transfer
Panola 15% Carthage, TX to Mont Belvieu, TX 100 MBbls/d NGL pipeline Enterprise
Rendezvous 22% SW Wyoming ~450 MMcf/d natural-gas pipeline Marathon
PROVIDES STABILITY AND DIVERSIFICATION OF MIDSTREAM SERVICE, CASH FLOW, AND CUSTOMER BASE
STABLE CASH FLOWS SUPPORTED BY +80% MINIMUM-VOLUME COMMITMENTS OR COST-OF-SERVICE CONTRACTS

24
Creating Long-Term Value for Stakeholders
2021Focus Areas
Enhance OperationalApproach
Provide ExceptionalCustomer Service
Refine BusinessModel
Minimize EnvironmentalFootprint

25
Our Approach to ESG
Supporting Sustainable
Environment
We are implementing industry-leading environmental
protection practices and technologies while
maintaining employee safety.
FocusingOn People
We are focused on improving the quality of
life for our workforce and communities. When they succeed, so will our
company.
Operating Responsibly
We are developing intentional and robust
governance systems that support our ESG efforts and our priority to keep
our workforce, communities, and the
environment safe.
26
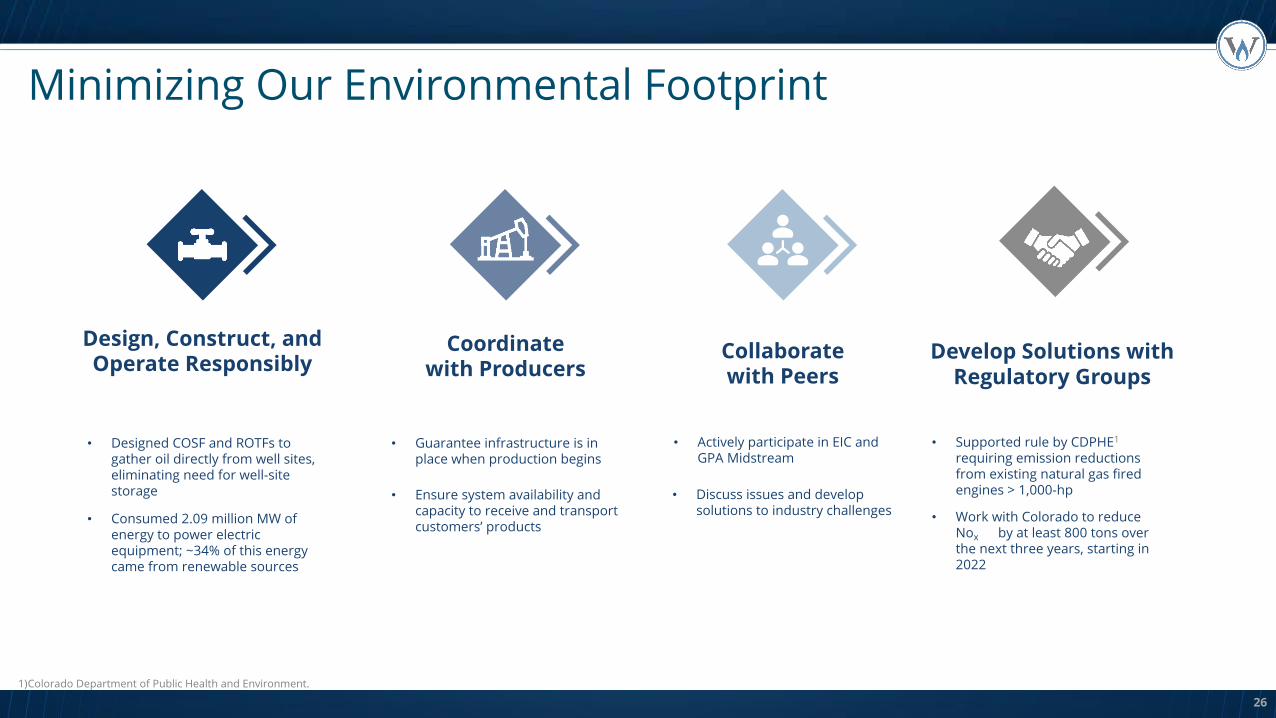
Minimizing Our Environmental Footprint
1)Colorado Department of Public Health and Environment.
Design, Construct, and Operate Responsibly
• Designed COSF and ROTFs to gather oil directly from well sites, eliminating need for well-site storage
• Consumed 2.09 million MW of energy to power electric equipment; ~34% of this energy came from renewable sources
Coordinatewith Producers
• Guarantee infrastructure is in place when production begins
• Ensure system availability and capacity to receive and transport customers’ products
Collaboratewith Peers
• Discuss issues and develop solutions to industry challenges
• Actively participate in EIC and GPA Midstream
Develop Solutions with Regulatory Groups
• Work with Colorado to reduce Nox by at least 800 tons over the next three years, starting in 2022
• Supported rule by CDPHE1
requiring emission reductions from existing natural gas fired engines > 1,000-hp
27
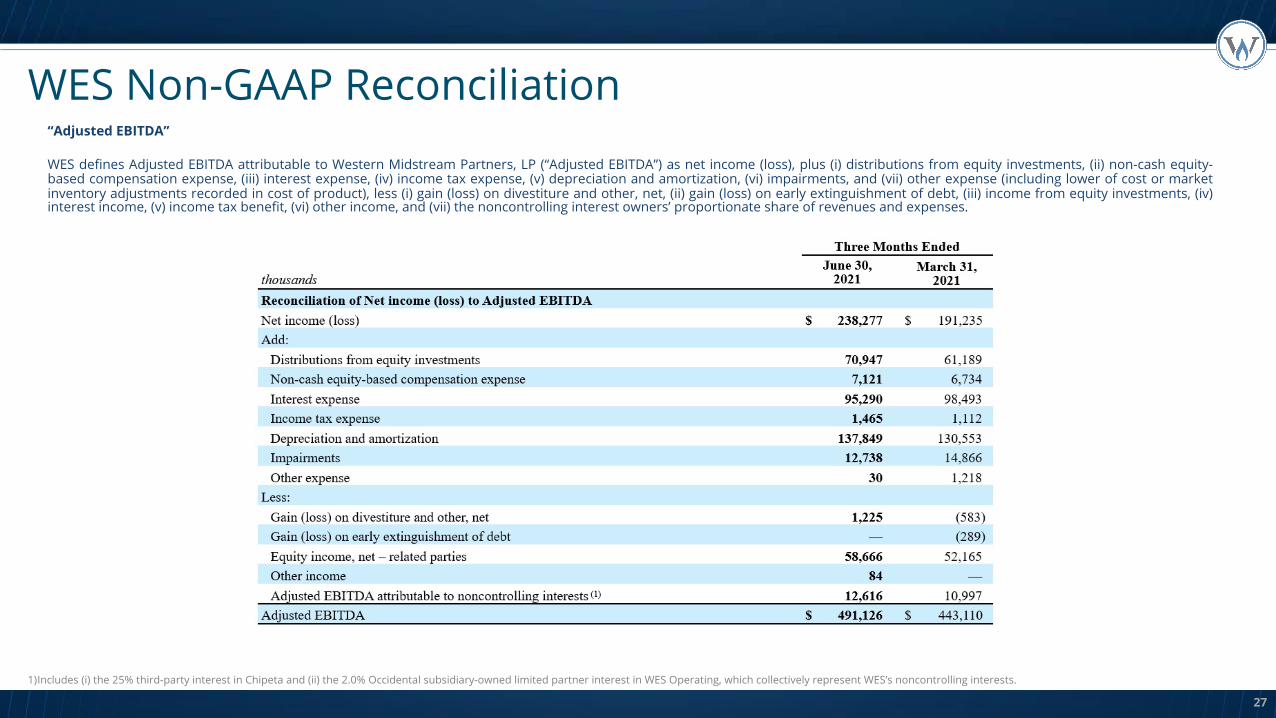
WES Non-GAAP Reconciliation“Adjusted EBITDA”
WES defines Adjusted EBITDA attributable to Western Midstream Partners, LP (“Adjusted EBITDA”) as net income (loss), plus (i) distributions from equity investments, (ii) non-cash equity-based compensation expense, (iii) interest expense, (iv) income tax expense, (v) depreciation and amortization, (vi) impairments, and (vii) other expense (including lower of cost or marketinventory adjustments recorded in cost of product), less (i) gain (loss) on divestiture and other, net, (ii) gain (loss) on early extinguishment of debt, (iii) income from equity investments, (iv)interest income, (v) income tax benefit, (vi) other income, and (vii) the noncontrolling interest owners’ proportionate share of revenues and expenses.
1)Includes (i) the 25% third-party interest in Chipeta and (ii) the 2.0% Occidental subsidiary-owned limited partner interest in WES Operating, which collectively represent WES’s noncontrolling interests.

28
WES Non-GAAP Reconciliation
1)Includes (i) the 25% third-party interest in Chipeta and (ii) the 2.0% Occidental subsidiary-owned limited partner interest in WES Operating, which collectively represent WES’s noncontrolling interests.
“Adjusted EBITDA”
WES defines Adjusted EBITDA attributable to Western Midstream Partners, LP (“Adjusted EBITDA”) as net income (loss), plus (i) distributions from equity investments, (ii) non-cash equity-based compensation expense, (iii) interest expense, (iv) income tax expense, (v) depreciation and amortization, (vi) impairments, and (vii) other expense (including lower of cost or marketinventory adjustments recorded in cost of product), less (i) gain (loss) on divestiture and other, net, (ii) gain (loss) on early extinguishment of debt, (iii) income from equity investments, (iv)interest income, (v) income tax benefit, (vi) other income, and (vii) the noncontrolling interest owners’ proportionate share of revenues and expenses.

29
WES Non-GAAP Reconciliation“Free Cash Flow”
WES defines Free cash flow as net cash provided by operating activities less total capital expenditures and contributions to equity investments, plus distributions from equity investmentsin excess of cumulative earnings.
30
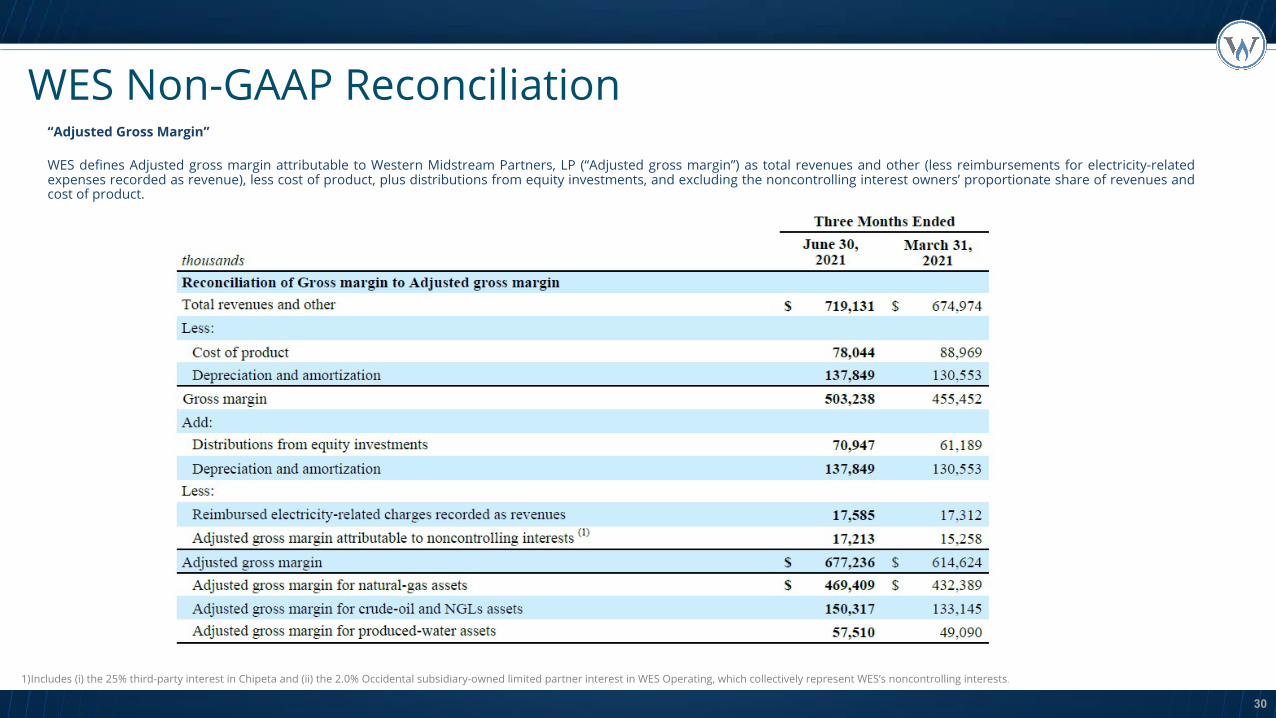
WES Non-GAAP Reconciliation“Adjusted Gross Margin”
WES defines Adjusted gross margin attributable to Western Midstream Partners, LP (“Adjusted gross margin”) as total revenues and other (less reimbursements for electricity-relatedexpenses recorded as revenue), less cost of product, plus distributions from equity investments, and excluding the noncontrolling interest owners’ proportionate share of revenues andcost of product.
1)Includes (i) the 25% third-party interest in Chipeta and (ii) the 2.0% Occidental subsidiary-owned limited partner interest in WES Operating, which collectively represent WES’s noncontrolling interests.


