Abrams Associates TRAFFIC ENGINEERING, INC. City of Berkeley January 14, 2019 2628 Shattuck Avenue Mixed Use Project 2628 Shattuck Avenue Mixed Use Project Transportation Impact Analysis Prepared by: Abrams Associates 1875 Olympic Boulevard, Suite 210 Walnut Creek CA 94596 Abrams Associates TRAFFIC ENGINEERING, INC. Land Use Planning Received January 14, 2019 ATTACHMENT 6 ZAB 01-24-19 Page 1 of 25
Transcript
Abrams AssociatesTRAFFIC ENGINEERING, INC.
City of Berkeley
January 14, 2019
2628 Shattuck Avenue Mixed Use Project2628 Shattuck Avenue Mixed Use ProjectTransportation Impact Analysis
Prepared by:Abrams Associates
1875 Olympic Boulevard, Suite 210Walnut Creek CA 94596
The 2628 Shattuck Avenue mixed use project is proposed to include 78 apartment units, 1,255 square feet of office space, and a 725 square foot cafe. The project is planned to be developed on the southwest corner of Shattuck Avenue and Carleton Street in the City of Berkeley. The site is currently occupied by a 41-bed assisted living facility. Figure 1 shows the location of the project and the surrounding roadway network. Figure 2 shows the ground floor site plan for the project. Based on the trip generation forecasts the project would generate approximately 42 vehicle trips during the AM peak hour and 29 trips during the PM peak hour.
Based on the project’s design and a detailed analysis conducted according to the City’s guidelines there would be no significant transportation impacts according to the City’s significance criteria and no off-site traffic or transportation mitigations would be required.1 The City’s base zoning ordinance would be 54 spaces and can be reduced with a Use Permit to 25 spaces, as proposed. The project is proposing to accommodate its parking demand by providing 25 off-street parking spaces in an on-site garage. The project is also proposing to exceed the requirements for on-site bicycle parking with 56 secure on-site bicycle parking spaces.
2) INTRODUCTION
This transportation impact analysis describes the existing and baseline conditions for transportation and circulation both with and without the proposed project. The study presents information on the regional and local roadway networks, the pedestrian and transit conditions, and provides an analysis of the effects on transportation facilities associated with the project.
This study also describes the regulatory setting; the criterion used for determining the significance of environmental impacts; and summarizes potential environmental impacts and appropriate mitigation measures when necessary. This study has been conducted in accordance with the requirements and methodologies set forth by the City of Berkeley, Alameda County, Caltrans, and the applicable provisions of CEQA.
3) ENVIRONMENTAL SETTING
This section of the report describes the roadways, traffic conditions and other existing transportation characteristics in the vicinity of the project. The primary basis for the traffic operations portion of the analysis is the peak hour level of service at the key study intersections. In this report, these peak commute hours will be identified as the AM and PM peak hours.
1 Guide for Development of Traffic Impact Reports, City of Berkeley Office of Transportation, Berkeley, CA, January, 2009.
3.3 Project Study Intersections To provide a baseline for identification of impacts on the local roadway network, existing traffic operating conditions have been determined for the key local intersections that may be affected by the project. For this analysis three study intersections were selected based on the City’s Guidelines for Development of Traffic Impact Reports and their potential to be impacted by the proposed project. The three study intersections are:
1. Carleton Avenue at Milvia Street 2. Carleton Street at the Proposed Project Entrance 3. Carleton Street at Shattuck Avenue
3.2 Traffic Analysis Scenarios The study intersections were evaluated for the following six scenarios: Scenario 1: Existing Conditions – Level of Service (LOS) based on existing peak hour
volumes and existing intersection configurations.
Scenario 2: Existing Plus Project – Existing traffic volumes plus trips from the proposed project.
Scenario 3: Baseline (No Project) Conditions – The Baseline scenario is based on the
existing volumes plus growth in background traffic (for two years) plus the traffic from all reasonably foreseeable developments that could substantially affect the volumes at the project study intersection.
Scenario 4: Baseline Plus Project Conditions – This scenario is based on the Baseline
traffic volumes plus the trips that would be generated by the proposed project.
3.3 Existing Roadway Network
As shown on Figure 1, the roads that would be primarily affected by the project are Shattuck Avenue, Carleton Street, and Milvia Street. The following is a brief description of these roadways:
Shattuck Avenue – Shattuck Avenue is a four lane arterial roadway extending south from Vine Street to terminate to the south at Telegraph Avenue in the City of Oakland. It serves school, residential and commercial traffic and is an important north-south travel route. It is designated as a major street and a primary transit route in the City’s General Plan.
Carleton Street – Carleton Street is a two lane local road extending east from Berkeley’s Aquatic Park to terminate to the east just east of Telegraph Avenue. It has parking on both sides and serves residential and commercial traffic and has a prima facie speed limit of 25 mph.
Milvia Street – Milvia Street is a two lane collector street extending north from Russell
Road to Yolo Avenue. It serves school, residential and commercial traffic and is designated as an important north-south bicycle boulevard.
Caltrans has established restrictions on the use of multi-way stop signs and the California Manual of Uniform Traffic Control Devices (MUTCD) provides detailed guidance on when multi-way stop applications and traffic signals are appropriate.1 Caltrans’ guidelines state that a traffic signal or all-way stop control shall be considered if: “Five or more reported crashes, of types susceptible to correction by a traffic control signal, have occurred within a 12-month period, each crash involving personal injury or property damage apparently exceeding the applicable requirements for a reportable crash“. A detailed review of the accident history in the study area (back to 2012) was conducted using data available from the California Highway Patrol’s Statewide Integrated Traffic Records System (SWITRS). This data is included in the technical appendix and verifies the accident history in the area would not warrant installation of additional traffic signals or multi-way stop control. Please note that over the past six years there were no more than two accidents per year reported at any of the intersections in the area with two exceptions. In 2013 there were three accidents reported in the vicinity of Shattuck Avenue and Parker Street and in 2014 there were four accidents reported at Shattuck Avenue and Carleton Street. However, only three of the accidents at Carleton Street were the result of right-of way issues within the intersection, which could potentially be considered correctable with changes to traffic controls. 3.5 Intersection Analysis Methodology
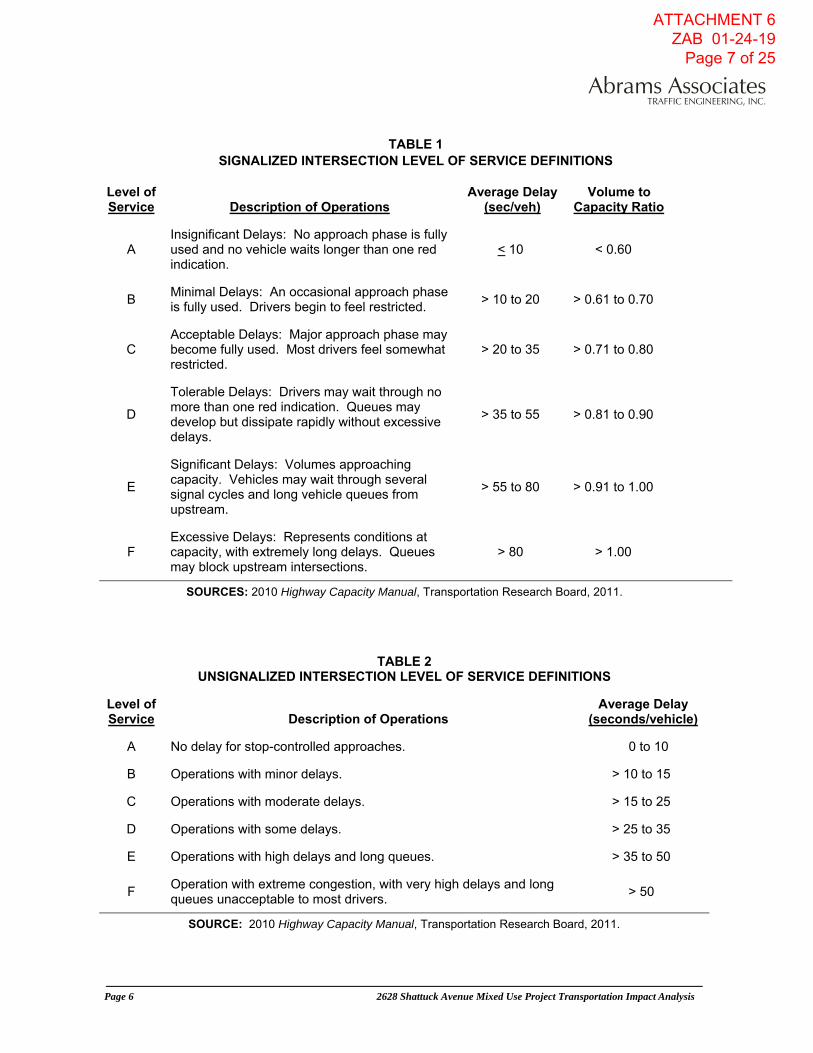
Existing operational conditions at the study intersection were evaluated according to the requirements set forth by the City of Berkeley. Analysis of traffic operations was conducted using the 2010 Highway Capacity Manual (HCM) Level of Service (LOS) methodology with Synchro software.2 Level of service is an expression, in the form of a scale, of the relationship between the capacity of an intersection (or roadway segment) to accommodate the volume of traffic and the traffic moving through it at any given time. The level of service scale describes traffic flow with six ratings ranging from A to F, with “A” indicating relatively free flow of traffic and “F” indicating stop-and-go traffic characterized by traffic jams. As the amount of traffic moving through a given intersection or roadway segment increases, the traffic flow conditions that motorists experience rapidly deteriorate as the capacity of the intersection or roadway segment is reached. Under such conditions, there is general instability in the traffic flow, which means that relatively small incidents (e.g., momentary engine stall) can cause considerable fluctuations in speeds and delays that lead to traffic congestion. This near-capacity situation is labeled level of service (LOS) E. Beyond LOS E, the intersection or roadway segment capacity has effectively been exceeded, and arriving traffic will exceed the ability of the intersection to accommodate it. Table 1 summarizes the relationship between LOS, average control delay, and the volume to capacity ratio at signalized intersections. Table 2 summarizes the relationship between LOS and delay at unsignalized intersections For signalized intersections, The City of Berkeley’s LOS standards are based on the average delay for the entire intersection. The HCM methodology determines the capacity of each lane group approaching the intersection. The LOS is then based on average control delay (in
1 California MUTCD, Chapter 2B, Caltrans, Sacramento, CA, November 7, 2014. 2 2010 Highway Capacity Manual, Transportation Research Board, Washington D.C., 2011
seconds per vehicle) for the various movements within the intersection. A combined weighted average control delay and LOS are presented for the intersection. A summary of the HCM results and copies of the detailed HCM LOS calculations are included in the appendix to this report. For unsignalized (all-way stop controlled and two-way stop controlled) intersections, the average control delay and LOS operating conditions are calculated by approach (e.g., northbound) and movement (e.g., northbound left-turn) for those movements that are subject to delay. Operating conditions for unsignalized intersections are presented for the worst approach. 3.6 Existing Intersection Capacity Conditions
The existing intersection geometry at the project study intersections is presented in Figure 3. The existing traffic volumes at these intersections for the weekday AM and PM peak hours are presented in Figure 4. Traffic counts at the intersection were conducted in December, 2017. Table 3 summarizes the associated LOS computation results for the existing weekday AM and PM peak hour conditions at these intersections. As shown in Table 3, all of the study intersections currently have acceptable conditions (LOS D or better) during the weekday AM and PM peak hours. Please note the detailed LOS calculations are included in the technical appendix to this report. 3.7 Pedestrian and Bicycle Facilities
Bicycle paths, lanes and routes are typical examples of bicycle transportation facilities, which are defined by Caltrans as being in one of the following three classes:
Class I – Provides a completely separated facility designed for the exclusive use of bicyclists and pedestrians with crossing points minimized. Class II – Provides a restricted right-of-way designated lane for the exclusive or semi-exclusive use of bicycles with through travel by motor vehicles or pedestrians prohibited, but with vehicle parking and cross-flows by pedestrians and motorists permitted. Class III – Provides a right-of-way designated by signs or permanent markings and shared with pedestrians and motorists.
There are existing bike lanes (Class II) to the south on Adeline Street. North of Allston Way Milvia Street is a Class III bike route and it is designated as an official bicycle boulevard with signage and pavement markings encouraging motorists to share the road with bicyclists. Russell Road to the east of Adeline Street is also designated as an official bicycle boulevard.
TABLE 3 EXISTING INTERSECTION LEVEL OF SERVICE CONDITIONS
INTERSECTION CONTROL PEAK HOUR
EXISTING
Delay LOS
1 MILVIA STREET & CARLETON STREET All Way Stop AM 7.8 A PM 7.8 A
2 PROJECT ENTRANCE & CARLETON STREET Side Street Stop AM N/A N/A PM N/A N/A
3 SHATTUCK AVENUE & CARLETON STREET Side Street Stop AM 9.7 A PM 10.1 B
SOURCE: Abrams Associates, 2018
NOTES: HCM LOS results are presented in terms of average intersection delay in seconds per vehicle.
ATTACHMENT 6 ZAB 01-24-19
Page 8 of 25
Malcom XElementary
School
GrovePark
Berkeley Public LibrarySouth Branch
Moellering Field
Medical Center:
800 18
80
36
12 F
6
King St
Wheeler St
Lorina St
Walker St
Howe StDeakin StNewbury St
Fairview St
66th St66th St
Woolsey St
65th St
Alcatraz Ave65th St
Deakin St
Webster St
Carleton St
Dover St
Whitney St
Tremont St
Parker St
Derby St
Ward StAd
elin
e St
Otis St
Harper St
Ellis St
Woolsey St
Emerson St
Essex St
Prince St
Stuart St
t
Dwight Wy
Blake St
Carleton St
Parker St
Oregon St
Derby St
Ward St
Adel
ine
St
Ashby Ave
Shattuck Ave
Shattuck A
ve
Tele
grap
h Av
e
Fulton StMilvia St
Fulton St
Ellsworth St
Martin Luther King Jr W
y
Shattuck A
ve
Tele
grap
h Av
e
Halcyon
12 3
LEGEND
Bicycle Boulevard
Bicycle Station
Bus RouteF
3
SHAT
TUCK
AVE
CARLETON ST
2
PROJ
ECT E
NTRA
NCE
CARLETON ST
1
MILV
IA ST
CARLETON ST
STOP
STOP
2628 Shattuck Avenue Mixed Use ProjectTRANSPORTATION IMPACT REPORT
City of Berkeley
FIGURE 3 EXISTING LANE CONFIGURATIONS
Abrams AssociatesTRAFFIC ENGINEERING, INC.
ProjectLocation
NearestBus Stop
ATTACHMENT 6 ZAB 01-24-19
Page 9 of 25
Malcom XElementary
School
GrovePark
Berkeley Public LibrarySouth Branch
Moellering Field
Medical Center:
King St
Wheeler St
Lorina St
Walker St
Howe StDeakin StNewbury St
Fairview St
66th St66th St
65th St
Alcatraz Ave65th St
Deakin St
Webster St
Carleton St
Dover St
Whitney St
Tremont St
Parker St
Derby St
Ward StAd
elin
e St
Otis St
Harper St
Ellis St
Woolsey St
Emerson St
Essex St
Prince St
Stuart St
t
Dwight Wy
Blake St
Carleton St
Parker St
Oregon St
Derby St
Ward St
Adel
ine
St
Ashby Ave
Shattuck Ave
Shattuck A
ve
Tele
grap
h Av
e
Fulton StMilvia St
Fulton St
Ellsworth St
Martin Luther King Jr W
y
Shattuck A
ve
Tele
grap
h Av
e
Halcyon
12 3
3
SHAT
TUCK
AVE
CARLETON ST
42 (37)63 (65)50 (25)28
(35)
22 (3
1)10
20 (1
150)
36 (8
1)46 (44)67 (53)
36 (26)
1005
(107
7)30
(50)
2
PROJ
ECT E
NTRA
NCE
CARLETON ST
129 (196)
149 (123)
1
MILV
IA ST
CARLETON ST
9 (15)79 (99)21 (16)7 (
5)
32 (2
2)14
(13)
19 (1
3)83 (77)17 (11)
1 (16)
14 (1
0)0 (
1)
ProjectLocation
2628 Shattuck Avenue Mixed Use ProjectTRANSPORTATION IMPACT REPORT
The Ashby Avenue Berkeley BART station is located on Adeline Street at Ashby, which is just under a half-mile from the project site. This station is located on the Richmond-Fremont Line which connected to other destinations in the Bay Area at the MacArthur Station. There is also direct service to Downtown San Francisco as well as continuing service to Milbrae (please note the service to Milbrae only operates before 8 AM Monday through Friday). As shown in Figure 3, there is also extensive bus transit service provided by Alameda-Contra Costa County (AC)
Transit at the BART Station. In addition to local bus route 19, the following lines operate adjacent to the project on Shattuck Avenue:
800: All Nighter. Richmond BART to Market St. and Van Ness Ave, S.F., via Macdonald Ave, San Pablo Ave, University Ave, Telegraph Ave and downtown Oakland. Returns via Market St. and West Oakland BART. F: UC Campus to Transbay Temporary Terminal, San Francisco via Shattuck Ave, Adeline St and 40th St.
Please note the nearest bus stop to the site is located on Shattuck Avenue at the southerly end of the project site. 4) REGULATORY CONTEXT Existing policies, laws and regulations that apply to the proposed project are summarized below. 4.1 State The California Department of Transportation (Caltrans) has jurisdiction over State highways and any improvements to these roadways would require Caltrans’ approval. 4.2 Local City of Berkeley General Plan - The Transportation and Circulation Element the City of Berkeley General Plan addresses the location and extent of existing and planned transportation routes, terminals, and other local public utilities and facilities. The General Plan identifies roadway and transit goals and policies that have been adopted to ensure that the transportation system of the City will have adequate capacity to serve planned growth. These goals and policies are intended to provide a plan and implementation measures for an integrated, multi-modal transportation system that will safely and efficiently meet the transportation needs of all economic and social segments of the City. 4.3 Significance Criteria The City’s level of service standard states that an impact is significant when the criteria are reduced from LOS A, B, C, or D to LOS E (with the addition of two (2) seconds of average delay) for signalized intersections. Intersections that exceed this service level threshold are considered to be impacted and should be considered for mitigation. Exceptions to the LOS D standard arise when the project is not expected to add more than two seconds at an intersection going from LOS D to LOS E or more than three seconds of delay at an intersection that is already operating at LOS E. In addition, it would also be considered a significant impact if a project would increase the volume to capacity (V/C) ratio by more than 0.01 at an intersection that is already operating at LOS F.
For unsignalized intersections, additional considerations are involved, including the number of vehicles on the critical approach, vehicles contributed by the proposed project, and signal warrant analysis. At an unsignalized intersection, mitigation is required if a movement is LOS F, the peak hour signal warrant is met, and a minimum of 10 vehicles are added to the critical movement. In this case the project has not been found to have any significant impacts but according to CEQA guidelines, a project would also have a significant impact if it would:
Conflict with an applicable plan, ordinance or policy establishing measures of effectiveness for the performance of the circulation system, taking into account all modes of transportation including mass transit and non-motorized travel and relevant components of the circulation system, including, but not limited to, intersections, streets, highways and freeways, pedestrian and bicycle paths and mass transit.
Conflict with an applicable congestion management program, including, but not limited to, level-of-service standards, and travel demand measures, or other standards established by a county congestion management agency for designated roadways.
Result in inadequate emergency vehicle access.
Conflict with adopted policies, plans, or programs regarding public transit, bicycle, or pedestrian facilities, or otherwise decrease the performance or safety of such facilities.
Result in an internal circulation system design that does not meet City standards. It should again be noted that this project has not been found to have any significant impacts according to CEQA and the above mentioned criteria are presented for informational purposes. 5) IMPACTS AND MITIGATION MEASURES
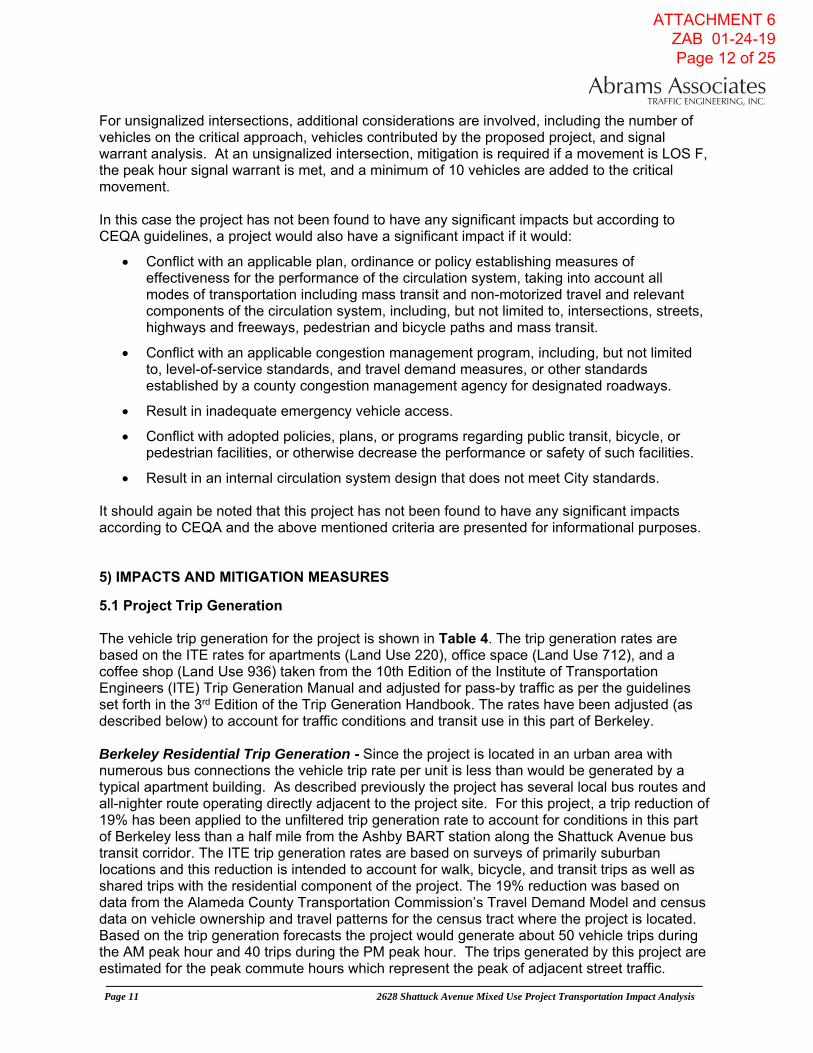
5.1 Project Trip Generation The vehicle trip generation for the project is shown in Table 4. The trip generation rates are based on the ITE rates for apartments (Land Use 220), office space (Land Use 712), and a coffee shop (Land Use 936) taken from the 10th Edition of the Institute of Transportation Engineers (ITE) Trip Generation Manual and adjusted for pass-by traffic as per the guidelines set forth in the 3rd Edition of the Trip Generation Handbook. The rates have been adjusted (as described below) to account for traffic conditions and transit use in this part of Berkeley. Berkeley Residential Trip Generation - Since the project is located in an urban area with numerous bus connections the vehicle trip rate per unit is less than would be generated by a typical apartment building. As described previously the project has several local bus routes and all-nighter route operating directly adjacent to the project site. For this project, a trip reduction of 19% has been applied to the unfiltered trip generation rate to account for conditions in this part of Berkeley less than a half mile from the Ashby BART station along the Shattuck Avenue bus transit corridor. The ITE trip generation rates are based on surveys of primarily suburban locations and this reduction is intended to account for walk, bicycle, and transit trips as well as shared trips with the residential component of the project. The 19% reduction was based on data from the Alameda County Transportation Commission’s Travel Demand Model and census data on vehicle ownership and travel patterns for the census tract where the project is located. Based on the trip generation forecasts the project would generate about 50 vehicle trips during the AM peak hour and 40 trips during the PM peak hour. The trips generated by this project are estimated for the peak commute hours which represent the peak of adjacent street traffic.
Subtotals from the New Land Uses 449 22 29 50 23 18 40
ITE Assisted Living Facility Trip Rates - Trips per bed
254 2.60 0.12 0.07 0.19 0.10 0.16 0.26
Subtotals for the Existing Assisted Living Facility
41
beds 107 5 3 8 4 7 11
Net New Trip Generation for the Project
343 17 26 42 19 10 29
SOURCE: Institute of Transportation Engineers Trip Generation Manual (10th Edition) and the Trip Generation Handbook (3rd Edition)
It is important to note that a 41-bed assisted living facility currently operates on the site. As shown in Table 4 this facility is estimated to generate about 8 trips during the AM peak hour and about 11 trips during the PM peak hour. If this existing traffic is subtracted out then the traffic associated with the new project is forecast to be a net increase of about 42 vehicle trips during the AM peak hour and 29 trips during the PM peak hour. The trips generated by this proposed development are estimated for the peak commute hours which represent the peak of adjacent street traffic. Please note that reductions for transit are typically not applied to assisted living uses. In addition, to be conservative, the traffic from the existing assisted living facility was not subtracted out in the analysis of traffic operations. The potential reduction due to the removal of existing traffic is only presented in Table 4 for informational purposes. This was, in part, because the proposed project would focus the majority of its traffic at one driveway on Carleton
Street, versus the existing assisted living facility which is currently served by two separate driveways and has its primary access on Shattuck Avenue. In general, the PM peak hour traffic generated by the proposed project would be expected to be about 23 trips more than what is generated by the assisted living facility, but again, the actual LOS analysis included in this study was based on an increase of 50 vehicle trips during the AM peak hour and 40 trips during the PM peak hour.
5.2 Project Trip Distribution
The trip distribution assumptions have been based on the existing traffic count data including daily directional volume and peak-hour turning movements, the Alameda County travel demand model, and knowledge of the surrounding area such as commute patterns and the overall land use patterns in the area. Figure 5 shows the project traffic that would be added at the project study intersections.
5.3 Existing Plus Project Intersection Capacity Conditions
This scenario evaluates the existing conditions with the addition of traffic from the proposed project. A comparison of the capacity calculations for the conditions with the addition of traffic from the project is shown in Table 5. Figure 6 presents the existing plus project volumes used in the analysis. The corresponding LOS analysis calculation sheets are presented in the Traffic Analysis Appendix. As shown in Table 5, all of the study intersections would continue to have acceptable conditions (LOS D or better) during the weekday AM and PM peak hours. Therefore, the addition of traffic to these intersections would not be considered a significant impact according to City of Berkeley guidelines.
TABLE 5 EXISTING PLUS PROJECT INTERSECTION LEVEL OF SERVICE CONDITIONS
INTERSECTION CONTROL PEAK HOUR
EXISTING EXISTING PLUS
PROJECT
Delay LOS Delay LOS
1 MILVIA STREET & CARLETON STREET All Way Stop AM 7.8 A 7.8 A PM 7.8 A 7.9 A
2 PROJECT ENTRANCE & CARLETON STREET Side Street Stop AM N/A N/A 9.7 A PM N/A N/A 9.5 A
3 SHATTUCK AVENUE & CARLETON STREET Side Street StopAM 9.2 A 9.6 A PM 9.5 A 9.8 B
SOURCE: Abrams Associates, 2018
NOTES: HCM LOS results are presented in terms of average intersection delay in seconds per vehicle.
5.4 Baseline Intersection Capacity Conditions
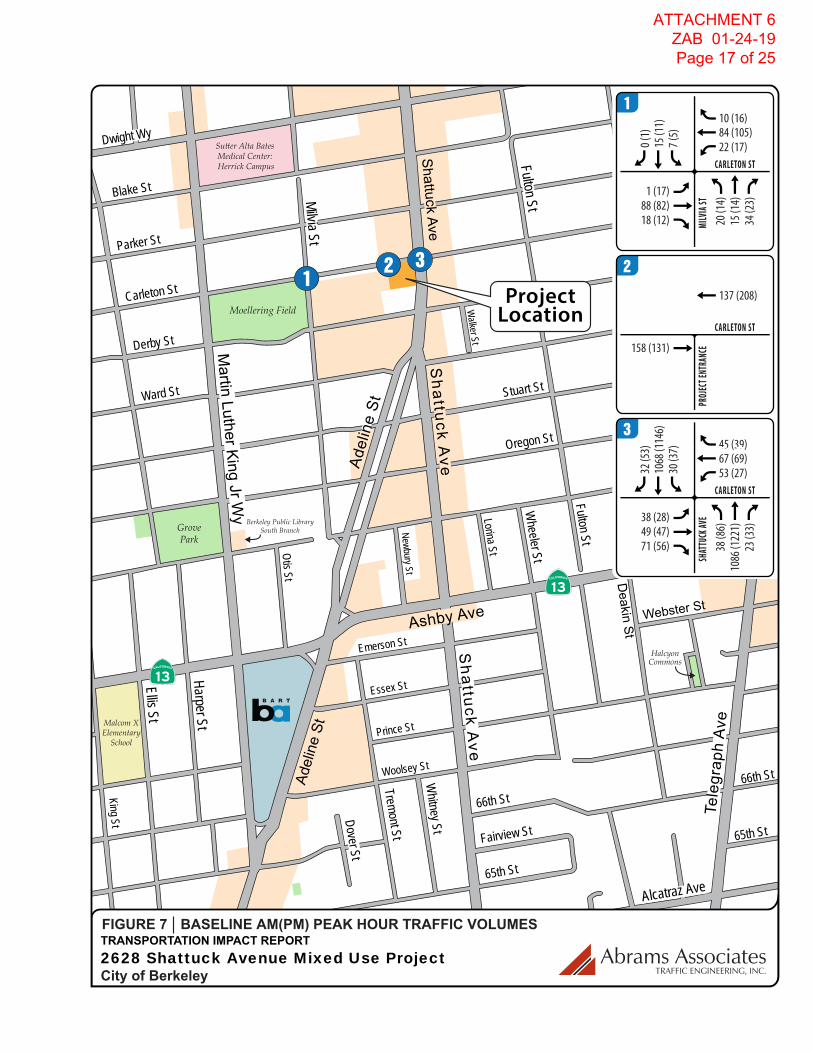
Trip generation and trip assignment assumptions for the approved projects were based on the traffic study reports prepared for each project, where available. Approved projects include developments that are either under construction, built but not fully occupied, or not built but have final development approval from the City. For background growth traffic from approved developments that could potentially affect the volumes at the project study intersections was identified. To ensure full accounting for the growth in background traffic the existing traffic volumes were conservatively increased by 2% per year for three years based on the assumption that the project completion date would be 2021. Figure 7 presents the resulting baseline volumes at each of the project study intersections Table 5 summarizes the LOS
ATTACHMENT 6 ZAB 01-24-19 Page 14 of 25
Malcom XElementary
School
GrovePark
Berkeley Public LibrarySouth Branch
Moellering Field
Medical Center:
King St
Wheeler St
Lorina St
Walker St
Howe StDeakin StNewbury St
Fairview St
66th St66th St
65th St
Alcatraz Ave65th St
Deakin St
Webster St
Carleton St
Dover St
Whitney St
Tremont St
Parker St
Derby St
Ward StAd
elin
e St
Otis St
Harper St
Ellis St
Woolsey St
Emerson St
Essex St
Prince St
Stuart St
t
Dwight Wy
Blake St
Carleton St
Parker St
Oregon St
Derby St
Ward St
Adel
ine
St
Ashby Ave
Shattuck Ave
Shattuck A
ve
Tele
grap
h Av
e
Fulton StMilvia St
Fulton St
Ellsworth St
Martin Luther King Jr W
y
Shattuck A
ve
Tele
grap
h Av
e
Halcyon
12 3
3
SHAT
TUCK
AVE
CARLETON ST
1 (1)
6 (7)1 (1)
11 (4)
6 (3)
4 (4)
2
PROJ
ECT E
NTRA
NCE
CARLETON ST11 (12)
18 (8
)8 (
3)
5 (6)
1
MILV
IA ST
CARLETON ST
2 (1)5 (2)1 (0)1 (
2)
1 (1)3 (3)
ProjectLocation
2628 Shattuck Avenue Mixed Use ProjectTRANSPORTATION IMPACT REPORT
City of Berkeley
FIGURE 5 PROJECT AM(PM) PEAK HOUR TRIPS
Abrams AssociatesTRAFFIC ENGINEERING, INC.
ATTACHMENT 6 ZAB 01-24-19 Page 15 of 25
Malcom XElementary
School
GrovePark
Berkeley Public LibrarySouth Branch
Moellering Field
Medical Center:
King St
Wheeler St
Lorina St
Walker St
Howe StDeakin StNewbury St
Fairview St
66th St66th St
65th St
Alcatraz Ave65th St
Deakin St
Webster St
Carleton St
Dover St
Whitney St
Tremont St
Parker St
Derby St
Ward StAd
elin
e St
Otis St
Harper St
Ellis St
Woolsey St
Emerson St
Essex St
Prince St
Stuart St
t
Dwight Wy
Blake St
Carleton St
Parker St
Oregon St
Derby St
Ward St
Adel
ine
St
Ashby Ave
Shattuck Ave
Shattuck A
ve
Tele
grap
h Av
e
Fulton StMilvia St
Fulton St
Ellsworth St
Martin Luther King Jr W
y
Shattuck A
ve
Tele
grap
h Av
e
Halcyon
12 3
3
SHAT
TUCK
AVE
CARLETON ST
42 (37)64 (66)50 (25)28
(35)
22 (3
1)10
20 (1
150)
42 (8
8)47 (45)78 (57)
42 (29)
1005
(107
7)34
(54)
2
PROJ
ECT E
NTRA
NCE
CARLETON ST
129 (196)11 (12)
18 (8
)8 (
3)
149 (123)5 (6)
1
MILV
IA ST
CARLETON ST
11 (16)84 (101)22 (16)8 (
7)
33 (2
3)14
(13)
19 (1
3)86 (80)17 (11)
1 (16)
14 (1
0)0 (
1)
ProjectLocation
2628 Shattuck Avenue Mixed Use ProjectTRANSPORTATION IMPACT REPORT
City of Berkeley
FIGURE 6 EXISTING PLUS PROJECT AM(PM) PEAK HOUR TRAFFIC VOLUMES
Abrams AssociatesTRAFFIC ENGINEERING, INC.
ATTACHMENT 6 ZAB 01-24-19 Page 16 of 25
Malcom XElementary
School
GrovePark
Berkeley Public LibrarySouth Branch
Moellering Field
Medical Center:
King St
Wheeler St
Lorina St
Walker St
Howe StDeakin StNewbury St
Fairview St
66th St66th St
65th St
Alcatraz Ave65th St
Deakin St
Webster St
Carleton St
Dover St
Whitney St
Tremont St
Parker St
Derby St
Ward StAd
elin
e St
Otis St
Harper St
Ellis St
Woolsey St
Emerson St
Essex St
Prince St
Stuart St
t
Dwight Wy
Blake St
Carleton St
Parker St
Oregon St
Derby St
Ward St
Adel
ine
St
Ashby Ave
Shattuck Ave
Shattuck A
ve
Tele
grap
h Av
e
Fulton StMilvia St
Fulton St
Ellsworth St
Martin Luther King Jr W
y
Shattuck A
ve
Tele
grap
h Av
e
Halcyon
12 3
3
SHAT
TUCK
AVE
CARLETON ST
45 (39)67 (69)53 (27)30
(37)
23 (3
3)10
86 (1
221)
38 (8
6)49 (47)71 (56)
38 (28)
1068
(114
6)32
(53)
2
PROJ
ECT E
NTRA
NCE
CARLETON ST
137 (208)
158 (131)
1
MILV
IA ST
CARLETON ST
10 (16)84 (105)22 (17)7 (
5)
34 (2
3)15
(14)
20 (1
4)88 (82)18 (12)
1 (17)
15 (1
1)0 (
1)
ProjectLocation
2628 Shattuck Avenue Mixed Use ProjectTRANSPORTATION IMPACT REPORT
results for the Baseline and Baseline Plus Project weekday AM and PM peak hour conditions. The corresponding LOS analysis calculation sheets are presented in the Traffic Analysis Appendix. As shown in Table 5, all of the study intersections currently have acceptable conditions (LOS D or better) during the weekday AM and PM peak hours. Please note the detailed LOS calculations are included in the technical appendix to this report.
5.5 Baseline Plus Project Intersection Capacity Conditions
The Baseline plus proposed project traffic forecasts were developed by adding project-related traffic to the baseline traffic volumes. As noted above, Table 6 summarizes the LOS results for the Baseline Plus Project weekday AM and PM peak hour conditions (i.e. the existing roadway network). Figure 8 presents the resulting baseline plus project volumes at each of the project study intersections. Please note that the corresponding LOS analysis calculation sheets are presented in the appendix. As shown in Table 5, all of the study intersections would continue to have acceptable conditions (LOS D or better) during the weekday AM and PM peak hours. Therefore, the addition of traffic to these intersections would not be considered a significant impact according to City of Berkeley guidelines.
TABLE 6 BASELINE PLUS PROJECT INTERSECTION LEVEL OF SERVICE CONDITIONS
INTERSECTION CONTROL PEAK HOUR
BASELINE BASELINE PLUS
PROJECT
Delay LOS Delay LOS
1 MILVIA STREET & CARLETON STREET All Way Stop AM 7.9 A 7.9 A PM 7.9 A 7.9 A
2 PROJECT ENTRANCE & CARLETON STREET Side Street Stop AM N/A N/A 9.8 A PM N/A N/A 9.6 A
3 SHATTUCK AVENUE & CARLETON STREET Side Street StopAM 9.6 A 10.0 B PM 9.9 B 10.2 B
SOURCE: Abrams Associates, 2018
NOTES: HCM LOS results are presented in terms of seconds per vehicle.
5.6 Internal Circulation and Access
No site circulation or access issues have been identified that would cause any traffic safety issues or any unusual traffic congestion or delay. Please note the garage exit will require pedestrian audio/visual signals for when vehicles are exiting the site. Accident records for surrounding streets within a block of the project site are included in the technical appendix to this report.
5.7 Parking
This section discusses the City of Berkeley’s zoning and estimated parking demand for the project, which is located in Zoning District C-1. As per the City’s Municipal Code, the base zoning ordinance would be 64 spaces and can be modified with a Use Permit to 25 spaces as proposed, per BMC 23E.52.070.D.5 in order to encourage mixed use projects. With respect to bicycle parking, Section 23E.80.080.C of the City’s Municipal Code requires one bicycle parking space for each 2,000 square feet of commercial space.
ATTACHMENT 6 ZAB 01-24-19 Page 18 of 25
Malcom XElementary
School
GrovePark
Berkeley Public LibrarySouth Branch
Moellering Field
Medical Center:
King St
Wheeler St
Lorina St
Walker St
Howe StDeakin StNewbury St
Fairview St
66th St66th St
65th St
Alcatraz Ave65th St
Deakin St
Webster St
Carleton St
Dover St
Whitney St
Tremont St
Parker St
Derby St
Ward StAd
elin
e St
Otis St
Harper St
Ellis St
Woolsey St
Emerson St
Essex St
Prince St
Stuart St
t
Dwight Wy
Blake St
Carleton St
Parker St
Oregon St
Derby St
Ward St
Adel
ine
St
Ashby Ave
Shattuck Ave
Shattuck A
ve
Tele
grap
h Av
e
Fulton StMilvia St
Fulton St
Ellsworth St
Martin Luther King Jr W
y
Shattuck A
ve
Tele
grap
h Av
e
Halcyon
12 3
3
SHAT
TUCK
AVE
CARLETON ST
45 (39)68 (70)53 (27)30
(37)
23 (3
3)10
86 (1
221)
44 (9
3)50 (48)82 (60)
44 (31)
1068
(114
6)36
(57)
2
PROJ
ECT E
NTRA
NCE
CARLETON ST
137 (208)11 (12)
18 (8
)8 (
3)
158 (131)5 (6)
1
MILV
IA ST
CARLETON ST
12 (17)89 (107)23 (17)8 (
7)
35 (2
4)15
(14)
20 (1
4)91 (85)18 (12)
1 (17)
15 (1
1)0 (
1)
ProjectLocation
2628 Shattuck Avenue Mixed Use ProjectTRANSPORTATION IMPACT REPORT
City of Berkeley
FIGURE 8 BASELINE PLUS PROJECT AM(PM) PEAK HOUR TRAFFIC VOLUMES
For the proposed project with 1,980 square feet of commercial space this equates to a requirement for parking two bicycles and the project is proposing to exceed this requirement by providing bicycle parking within a secure room within the building. Please note the BMC sections that apply to this site do not require bicycle parking for residential uses. It should also be noted that there are draft bicycle parking standards that have been proposed that, once approved, would increase the bicycle parking requirements for the project. Based on the draft standards the project would require 34 long term bicycle parking spaces and also 5 short term spaces.
Parking Demand in Berkeley - For this location on a major bus route the parking demand would be less than the typical ITE rate in the Parking Generation Manual. This is based on many of the same characteristics that are discussed in the trip generation section. The availability of transit, the use of bicycles, and the attractiveness of walking in a mixed-use environment clearly results in reduced vehicle trip generation and an associated reduction in the need for parking. Since Berkeley has numerous opportunities for public transportation and the apartment residents are not all expected to have personal vehicles, it is anticipated that a substantial portion of all travel will occur by walking, bicycling, and through the use of public transit. Please note in addition to being less than a mile from a BART station there are bus stops adjacent to the site that include access to local routes with direct access to BART as well as transbay and all-nighter bus routes.
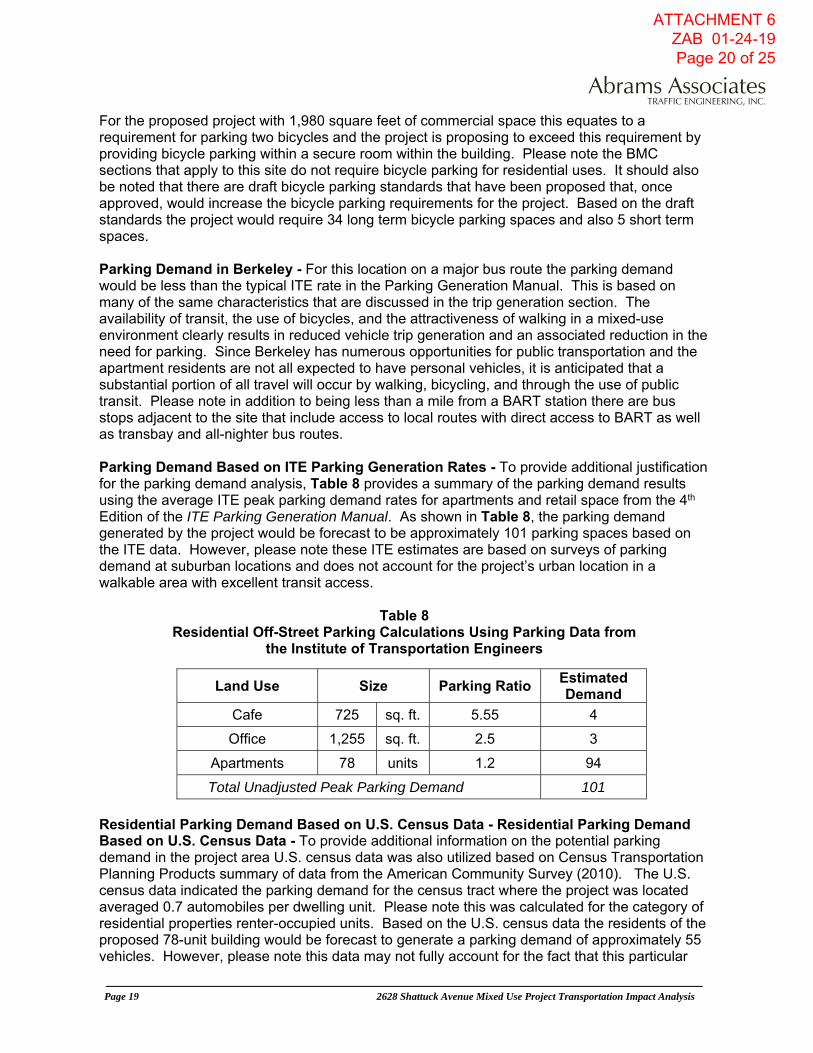
Parking Demand Based on ITE Parking Generation Rates - To provide additional justification for the parking demand analysis, Table 8 provides a summary of the parking demand results using the average ITE peak parking demand rates for apartments and retail space from the 4th Edition of the ITE Parking Generation Manual. As shown in Table 8, the parking demand generated by the project would be forecast to be approximately 101 parking spaces based on the ITE data. However, please note these ITE estimates are based on surveys of parking demand at suburban locations and does not account for the project’s urban location in a walkable area with excellent transit access.
Table 8 Residential Off-Street Parking Calculations Using Parking Data from
the Institute of Transportation Engineers
Land Use Size Parking Ratio Estimated Demand
Cafe 725 sq. ft. 5.55 4
Office 1,255 sq. ft. 2.5 3
Apartments 78 units 1.2 94
Total Unadjusted Peak Parking Demand 101
Residential Parking Demand Based on U.S. Census Data - Residential Parking Demand Based on U.S. Census Data - To provide additional information on the potential parking demand in the project area U.S. census data was also utilized based on Census Transportation Planning Products summary of data from the American Community Survey (2010). The U.S. census data indicated the parking demand for the census tract where the project was located averaged 0.7 automobiles per dwelling unit. Please note this was calculated for the category of residential properties renter-occupied units. Based on the U.S. census data the residents of the proposed 78-unit building would be forecast to generate a parking demand of approximately 55 vehicles. However, please note this data may not fully account for the fact that this particular
site is only a half mile from a BART station. This project would be in a closer proximity to BART than many of the residences in the census tract where the project is located. On-Street Parking Surveys - In order to evaluate the local parking situation on-street parking occupancy surveys were conducted based on the standard traffic engineering guidelines for a study area specified by the City of Berkeley. The results of the survey are attached at the end of this report. This survey included a detailed inventory of all on-street and public off-street parking within two blocks of the project site. The study involved a block-by-block survey of the number and types of spaces, and the parking occupancy on weekday afternoons and weekday evenings. The surveys were conducted February 27 and 28, and on March 1, 2018 (a Tuesday, Wednesday, and Thursday). The survey indicated there are approximately 490 on-street parking spaces located within about two blocks of the project site, but there are only 93 spaces in this area that are not part of the residential parking permit program. This means that motorists without residential permits are limited to no more than two hours from 8:00 AM to 7:00 PM. The studies found that during the afternoon between 1:00 and 3:00 PM, there are about 90 spaces (97%) that are occupied, and only about 3 spaces available. During the evening between 6:00 and 8:00 PM, about 53 of the 93 non-permit parking spaces were occupied, which is an occupancy rate of 57%, with about 40 available on-street spaces. Summary of Findings on Parking - Based on these studies, the residential parking provided (45 spaces) could be up to 14 spaces short of the estimated demand using U.S. Census data for the residential portion of the project and the base municipal code requirements for the commercial space. However, the project could still meet the City’s zoning requirements, subject to approval by the City. With an approved use permit the zoning could allow 25 spaces as proposed, per BMC 23E.52.070.D.5 which is intended to encourage mixed use projects. The following are considerations that may affect the parking demand and shortfall:
1) The availability of transit has been shown to result in a significant reduction in the demand for parking.3 The Ashby Avenue Berkeley BART station is located on Adeline Street at Ashby, which is just under a half mile from the project site. This station is located on the Richmond-Fremont Line which connects to other destinations in the Bay Area, including San Francisco, at the MacArthur Station. There is also extensive bus transit service provided by Alameda-Contra Costa County (AC) Transit at the BART Station. Please note the nearest bus stops for Routes 18, 49, and 800 are less than a block from the site at Shattuck Avenue and Derby Street. Therefore, for this project it is anticipated that a higher portion of travel will occur by walking and through the use of public transit. 4 As a result, it is also expected that some of the apartment residents will forego owning a car, or having an extra car, because of the close proximity to transit.5
2) The on-street parking surveys conducted for the project indicate there are typically a minimum of about 40 available on-street parking spaces within two blocks of the project during the evening when the project would have its peak parking demand. However, based on the survey it is not recommended that the project should displace as many as 30 vehicles (based on US Census data) into the neighborhood that has only 40 spaces available.
3 Evaluating the Impact of Transit Service on Parking Demand and Requirements, Transportation Research Board, Washington D.C., 2010. 4 Trip and Parking Generation at Transit-Oriented Developments: Five US Case Studies, University of Utah, Salt Lake City, UT, 2016. 5 Effects of TOD on Housing, Parking, and Travel, Transportation Research Board, Washington D.C., 2010.
3) The project is proposing to exceed the requirements for on-site bicycle parking with 56secure on-site bicycle parking spaces.
4) There are numerous existing car sharing locations in the area. Please note that within1/2 mile of the project site there are 3 Zipcar locations.
5.8 Pedestrian and Bicycle Conditions
The proposed project would not generate a significant increase in pedestrian traffic in the area (in comparison to the existing volumes) given the size of the proposed project. Based on data from MTC’s Bay Area Travel Survey for projects within 1/2 mile of a BART station during the peak commute hours the project would be forecast to generate approximately 5 transit trips, 2 bicycle trips and 9 pedestrian trips. In addition to the relatively low trip generation, the proposed project would not significantly impact or change the design of any existing pedestrian facilities and should not create any new safety problems in the area. The proposed project would also not significantly impact any existing bicycle facilities. The project will add some pedestrians and bicyclists who will utilize sidewalks and bicycle facilities in the area. Please note there are existing sidewalks and crosswalks along the route from the project to the Ashby BART station. In relation to the existing conditions, the proposed project would not cause substantial changes to the pedestrian or bicycle traffic in the area and would not significantly impact or require changes to the design of any existing bicycle or pedestrian facilities.
5.9 Transit
The proposed project would not interfere with any existing bus routes and would not remove or relocate any existing bus stops. The proposed Project also would not conflict with any transit plans or goals of the City of Berkeley. Based on the size of the project, it is not forecast to cause a degradation of the level of service (or a significant increase in delay) on any roadway segments currently being utilized by bus transit in the area and, as such, no significant impacts to transit are expected.
5.10 Summary of Transportation Issues and Potential Improvement Measures
TR-1 Demolition and construction activities associated with the proposed project would result in an increase in traffic to and from the site and would require an appropriate construction management plan developed and approved by the City of Berkeley, consistent with the already existing and broadly applicable standard conditions that apply to projects similar in nature.
The increase in traffic as a result of demolition and construction activities associated with the proposed project has been quantified assuming single phase construction period of 18 months.
Heavy Equipment
Heavy equipment transport to and from the site could cause traffic impacts in the vicinity of the project site during construction. However, each overweight/oversized load would be required to obtain all necessary permits, which would include conditions. Prior to issuance of grading and building permits, the project applicant would be required to submit and have approved a Traffic Control Plan.
The requirements within the Traffic Control Plan include, but are not limited to, the following: truck drivers would be notified of and required to use the most direct route between the site and I-80, as determined by the City Traffic Engineering Department; all site ingress and egress would occur only at the main driveway to the project site and construction activities may require temporary traffic controls as determined by the City Engineer. Please note construction traffic will be directed to use Shattuck Avenue as the City has a goal of minimizing construction traffic on local streets. Specifically, designated travel routes for large vehicles would be monitored and controlled by flaggers for large construction vehicle ingress and egress. Any debris and mud caused by trucks would be monitored daily and may require instituting a street cleaning program. In addition, several loads of heavy equipment being hauled to and from the site each month would be short-term and temporary.
Employees
The weekday work is expected to begin around 7:00 AM and end around 4:00 PM. The construction worker arrival peak would occur between 6:30 AM and 7:30 AM, and the departure peak would occur between 4:00 PM and 5:00 PM. These peak hours are slightly before the citywide commute peaks. It should be noted that the trips generated during construction would be temporary
Based on past construction of similar projects, construction workers could require parking for up to 20 vehicles during the peak construction period. Additionally, deliveries, visits, and other activities may generate peak non-worker parking demand of 5 to 10 trucks and automobiles per day. Therefore, up to 30 vehicle parking spaces may be required during the peak construction period for the construction employees. It should be noted the developer and their construction team are required to provide off-street parking for their employees on the site, if possible. Furthermore, the Traffic Control Plan requires that if construction employee parking cannot be provided on the project site then other provisions will need to be made for off-site parking, subject to approval of the City Traffic Engineering Department.
Construction Material Import
The project would also require the importation of construction material, including raw materials for the building pads, the buildings, the parking area, and landscaping. Based on past construction of similar projects, importing this material is estimated to require substantial amounts of truck traffic. Under the provisions of the Traffic Control Plan, if importation and exportation of material becomes a traffic nuisance, then the City Engineer may limit the hours the activities can take place.
Impacts of Construction on Pedestrians and Bicyclists
The project would most likely require temporary closures of sidewalks and/or vehicle lanes adjacent to the site for safety. This would require a detailed plan for detouring pedestrian and bicycle traffic. This plan will need to be reviewed and approved by the City Engineer. The analysis of traffic operations at the driveway indicates there would be no significant changes to the traffic volumes, delay, or safety on Shattuck Avenue with the addition of traffic from the proposed project. The City requires permission to close sidewalks and an acceptable traffic control plan for closures to be permitted. In general, the pedestrian and bicycle operations in the area would not be expected to
change significantly during construction beyond the addition of some truck traffic to the area.
Traffic Control Plan
The Traffic Control Plan would indicate how parking for construction workers would be provided during construction and ensure a safe flow of traffic in the project area during construction. This analysis assumed construction of the entire project in one phase to identify the potential worst-case traffic effects. Each phase will be subject to a Traffic Control Plan and oversight by the City Engineer and construction traffic is not forecast to exceed the post construction traffic conditions created by the proposed project. As a result, the potential construction traffic impacts have been adequately addressed through the project impact analysis. The goal of the conditional requirements of the City is to make construction impacts less than significant. There is some increase in traffic associated with all construction projects, however the required traffic management plan is intended to ensure the effects of construction are acceptable to the City. Therefore, the demolition and construction activities associated with the proposed project or its individual phases would be expected to result in a less-than-significant impact.
Mitigation Measure(s) None required.
TR-2 Impacts related to site access and circulation.
Based on a review of the proposed site plan it was determined that the internal garage circulation should function well and should not cause any safety or operational problems. The project site design has been required to conform to City design standards and is not expected to create any significant impacts to pedestrians, bicyclists or traffic operations. Therefore, impacts related to site access and circulation to the proposed project would be less-than-significant.
Mitigation Measure(s) None required.
TR-3 Impacts regarding emergency vehicle access on and surrounding the proposed project site.
Sufficient emergency access is determined by factors such as number of access points, roadway width, and proximity to fire stations. The land use plan for the proposed project would be subject to approval of the fire department. All lane widths adjacent to the project would meet the minimum width that can accommodate an emergency vehicle; therefore, the width of the roadways would be adequate. Therefore, the development of the proposed project is expected to have less-than-significant impacts regarding emergency vehicle access.
Mitigation Measure(s) None required.
5.11 Mitigations
Based on this analysis there would be no significant transportation impacts according to established standards and no off-site traffic or transportation mitigations would be required.