2.7 Downlink Load 2.7.1 Monitoring Principles The downlink capacity of a cell is limited by its total available transmit power, which is determined by the NodeB power amplifier capability and the power configured for the cell. The downlink transmit power consists of the following, as shown in Figure 2-7: Common channel (CCH) power Non-HSPA power without CCH HSPA power Power margin Figure 2-7 Dynamic power resource allocation Downlink power resources are allocated as follows: 1. Downlink power resources are first reserved for common physical channels and allocated to the DPCH. The remaining power resources are available for HSPA, including HSUPA and HSDPA. 2. The HSPA power resources are first allocated to the HSUPA downlink control channels, including the E-AGCH, E-RGCH, and E-HICH. The remaining power resources are available for HSDPA. 3. The HSDPA power resources are first allocated to the downlink control channel HS- SCCH. The remaining power resources are available for the traffic channel HS-PDSCH. Downlink power consumption is related to cell coverage, UE locations, and the traffic load in the cell. Large cell coverage, UEs being far away from the cell center, and heavy traffic load all contribute to large downlink power consumption. Therefore, downlink power overload is more likely to occur in hotspots or in cells with large coverage. When the downlink transmit power is insufficient, the following occurs: The cell coverage shrinks.
Transcript
2.7 Downlink Load
2.7.1 Monitoring Principles
The downlink capacity of a cell is limited by its total available transmit power, which is
determined by the NodeB power amplifier capability and the power configured for the cell.
The downlink transmit power consists of the following, as shown in Figure 2-7:
Common channel (CCH) power
Non-HSPA power without CCH
HSPA power
Power margin
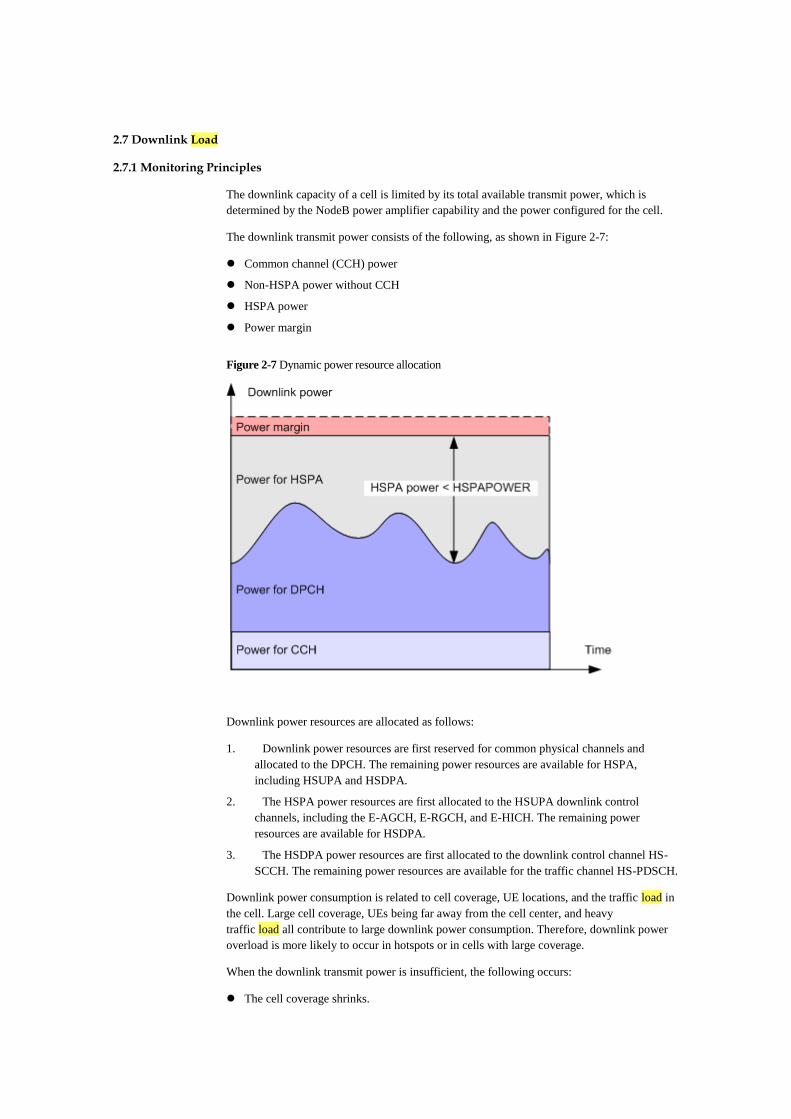
Figure 2-7 Dynamic power resource allocation
Downlink power resources are allocated as follows:
1. Downlink power resources are first reserved for common physical channels and
allocated to the DPCH. The remaining power resources are available for HSPA,
including HSUPA and HSDPA.
2. The HSPA power resources are first allocated to the HSUPA downlink control
channels, including the E-AGCH, E-RGCH, and E-HICH. The remaining power
resources are available for HSDPA.
3. The HSDPA power resources are first allocated to the downlink control channel HS-
SCCH. The remaining power resources are available for the traffic channel HS-PDSCH.
Downlink power consumption is related to cell coverage, UE locations, and the traffic load in
the cell. Large cell coverage, UEs being far away from the cell center, and heavy
traffic load all contribute to large downlink power consumption. Therefore, downlink power
overload is more likely to occur in hotspots or in cells with large coverage.
When the downlink transmit power is insufficient, the following occurs:
The cell coverage shrinks.
The data throughput decreases.
The service quality declines.
New service requests are likely to be rejected.
2.7.2 Monitoring Methods
The following TCP-associated counters are defined for Huawei RNCs:
VS.MeanTCP: mean transmitted power of carrier for cell
VS.MeanTCP.NonHS: mean Non-HSDPA transmitted carrier power for cell
VS.HSDPA.MeanChThroughput: mean downlink throughput of single HSDPA MAC-d
flows for cell
The downlink cell load is indicated by the mean utility ratio of transmitted carrier power in a
cell.
The mean utility ratio of the transmitted carrier power for non-HSPA users in a cell
(including non-HSPA users on CCHs) is calculated using the following formula:
MeanNonHSTCP Utility Ratio = MeanNonHSTCP/MAXTXPOWER x 100%
The mean utility ratio of the transmitted carrier power for all users in a cell is calculated
using the following formula:
MeanTCP Utility Ratio = MeanTCP/MAXTXPOWER x 100%
To obtain MAXTXPOWER, run the LST UCELL command, query the value of
the Max Transmit Power of Cell parameter, and convert the parameter value from
the unit "0.1 dBm" to "watt."
2.7.3 Optimization Suggestions
Perform capacity expansion in the following scenarios:
The MeanNonHSTCP Utility Ratio is greater than 70% during peak hours for three
consecutive days in one week.
The MeanTCP Utility Ratio is greater than 85% and the value of the
VS.HSDPA.MeanChThroughput counter is lower than the value (for example, 300
kbit/s) required by subscribers during peak hours for three consecutive days in one
week.
The capacity expansion methods are as follows:
For cells with heavy traffic, add a carrier for the current sector if possible; add a NodeB or
split the sector if the number of carriers in the sector reaches the maximum.
For cells with light traffic and poor coverage, add a NodeB.
2.8 Uplink Load
2.8.1 Monitoring Principles
Use the RTWP to measure the uplink cell capability on WCDMA networks.
RTWP includes the background noise, intra-system interference, and RF interference. Intra-
system interference includes the uplink signals sent by the UEs in the serving and neighboring
cells. RF interference includes the RF interference from an external source (for example, the
RF interference from another RAT or from equipment other than communication equipment)
and intra-system RF interference (for example, intermodulation interference produced by
hardware components).
The NodeB measures the RTWP on each receive channel in each cell. The cell RTWP
obtained by the RNC is the linear average of the RTWPs measured on all receive channels in
a cell under the NodeB. The RTWP reflects the interference to a NodeB and indicates the
signal strength on the RX port on the RF module.
The uplink cell capacity is restricted by the rise over thermal (RoT), which equals the RTWP
minus the cell background noise. The formula is as follows:
If there is no RF interference, the RoT is generated by intra-system interference. Under this
condition, the RoT is used as a criterion to evaluate the uplinkload.
The relationship between the RoT and the uplink load factor is as follows:
For example, a 3 dB noise increase corresponds to 50% of the uplink load and a 6 dB noise
increase corresponds to 75% of the uplink load.
Figure 2-8 Relationship between RTWP, noise increase, and uplink load
A large RTWP value in a cell is caused by traffic overflow, hardware faults (for example,
poor quality of antennas or feeder connectors), or external interference. If the RTWP value is
too large, the cell coverage shrinks, the quality of admitted services declines, or new service
requests are rejected.
2.8.2 Monitoring Methods
The RTWP and Equivalent Number of Users (ENU) are indicated by the following counters:
VS.MeanRTWP: average RTWP in a cell
VS.MinRTWP: minimum RTWP in a cell
VS.RAC.UL.EqvUserNum: number of uplink ENUs on all dedicated channels in a cell
The ENU can be specified by the following parameter:
UlTotalEqUserNum: UL total equivalent user number, which can be queried using the RNC
command LST UCELLCAC.
The uplink ENU ratio (UL ENU Ratio) is calculated using the following formula:
UL ENU Ratio = VS.RAC.UL.EqvUserNum/UlTotalEqUserNum
In some areas, the background noise increases to -106 dBm or above due to external
interference or hardware faults. If this occurs, the value of the VS.MinRTWP counter (the
RTWP value obtained when the cell carries no traffic) is considered the background noise.
The RTWP of a cell is considered too high when the value of the VS.MeanRTWP counter is
greater than -100 dBm during off-peak hours or greater than -90 dBm during peak hours for
two or three consecutive days in one week.
A cell is considered heavily loaded if the UL ENU Ratio exceeds 75% during peak hours for
two or three consecutive days in one week.
2.8.3 Optimization Suggestions
Perform capacity expansion in the following scenarios:
If the value of the VS.MinRTWP counter is greater than -100 dBm or less than -110 dBm
during off-peak hours for three consecutive days in one week, hardware faults or
external interference exists. Locate and rectify the faults.
The following table lists the RF alarms reported by the NodeB.
Alarm ID Alarm Name
ALM-26522 RF Unit RX Channel RTWP/RSSI Unbalanced
ALM-26521 RF Unit RX Channel RTWP/RSSI Too Low
ALM-26532 RF Unit Hardware Fault
ALM-26752 ALD Hardware Fault
ALM-26758 TMA Running Data and Configuration Mismatch
ALM-26755 TMA Bypass
ALM-26757 RET Antenna Running Data and Configuration Mismatch
ALM-26541 ALD Maintenance Link Failure
ALM-26529 RF Unit VSWR Threshold Crossed
If the value of the VS.MeanRTWP counter is greater than 90 dBm during peak hours for
three consecutive days in one week, there are hardware faults or external interference.
Locate and rectify the faults. If the value of the VS.MeanRTWP counter is greater than
90 dBm after hardware faults and external interference are rectified, enable the
following features as required:
− WRFD-140215 Dynamic Configuration of HSDPA CQI Feedback Period
− WRFD-010712 Adaptive Configuration of Traffic Channel Power offset for
HSUPA
For details about how to enable the "WRFD-140215 Dynamic Configuration of
HSDPA CQI Feedback Period" feature, see Dynamic Configuration Based on the
Uplink Load Feature Parameter Description in RAN Feature Documentation.
For details about how to enable the " WRFD-010712 Adaptive Configuration of
Traffic Channel Power offset for HSUPA" feature, see Power Control Feature
Parameter Description in RAN Feature Documentation.
If the uplink capacity of the cell still does not meet the requirements after the preceding
features are enabled, add carriers as required. If there are no additional UARFCNs
available, add NodeBs as required.
If the number of uplink ENUs is insufficient and the amount of uplink power is sufficient,
run the MOD UCELLCAC command with the UL total equivalent user
number parameter set to a larger value. In addition, run the SET
UADMCTRL command with the AF of hsupa interactive service andAF of hsupa
background service parameters set to 10.
2.9 OVSF Code Usage
2.9.1 Monitoring Principles
On WCDMA networks, channels are distinguished by code. Each channel uses two types of
code: scrambling code and orthogonal variable spreading factor (OVSF) code.
In the uplink, each UE is allocated a unique scrambling code. In the downlink, each cell is
allocated a unique scrambling code. That is, all UEs in a cell use the same scrambling code
but each of them is allocated a unique OVSF code. Therefore, OVSF codes distinguish the
downlink physical channels of different UEs in a cell.
In a WCDMA cell, different user data is distinguished by CDMA technique, and all user data
is transmitted over the same central frequency almost at the same time. OVSF codes provide
perfect orthogonality, minimizing interference between different users.
Figure 2-9 shows an OVSF code tree.
Figure 2-9 OVSF code tree
In the downlink, the maximum spreading factor (SF) is 256.
An OVSF code tree can be divided into 4 SF4 codes, 8 SF8 codes, 16 SF16 codes, ..., 256
SF256 codes. Codes with various SFs can be considered as equivalent to SF256 codes. For
example, a code with SF8 is equivalent to 32 codes with SF256. Using this method, the OVSF
code usage can be calculated for a user or a cell.
In a cell, only one OVSF code tree is available. In the OVSF code tree, sibling codes are
orthogonal to each other, but are non-orthogonal to their parent or child codes. As a result,
once a code is allocated to a user, neither its parent nor child code can be allocated to any
other user. OVSF code resources are limited. If available OVSF codes are insufficient, a new
call request is rejected.
After HSDPA service is introduced, HSDPA and R99 services share OVSF codes. HS-
PDSCH code resource management can be performed at both RNC and NodeB levels. RNC-
controlled static or dynamic code allocation is enabled through the Allocate Code
Mode parameter. NodeB-controlled dynamic code allocation is enabled through