33
Go Further 4Q 2015 AND FULL YEAR FIXED INCOME REVIEW AND 2016 OUTLOOK JANUARY 28, 2016 (PRELIMINARY RESULTS)
Go Further
4Q 2015 AND FULL YEAR FIXED INCOME REVIEW AND 2016 OUTLOOK
JANUARY 28, 2016(PRELIMINARY RESULTS)
SLIDE 1
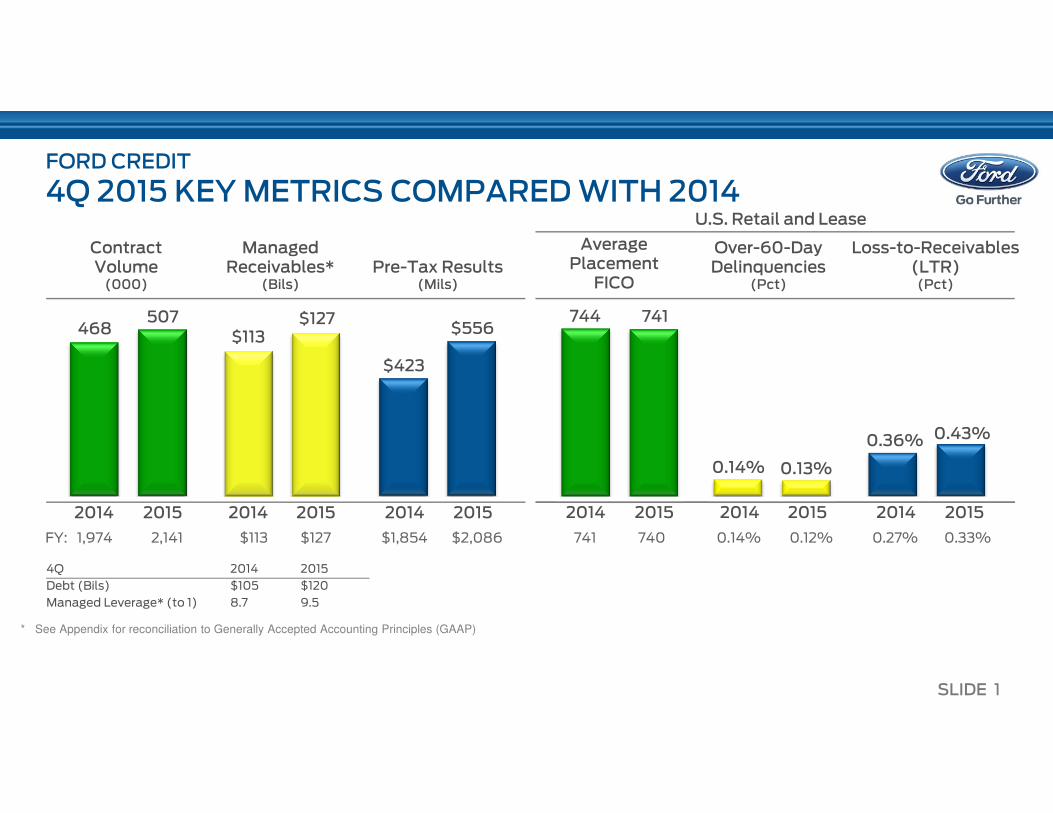
FORD CREDIT
4Q 2015 KEY METRICS COMPARED WITH 2014
* See Appendix for reconciliation to Generally Accepted Accounting Principles (GAAP)
507468 $556
$423
Managed Receivables*
(Bils)
Contract Volume(000)
Pre-Tax Results(Mils)
FY: 1,974 2,141 $113 $127 $1,854 $2,086 741 740 0.14% 0.12% 0.27% 0.33%
$113$127
20152014 20152014 20152014
4Q 2014 2015
Debt (Bils) $105 $120
Managed Leverage* (to 1) 8.7 9.5
Over-60-DayDelinquencies
(Pct)
Average Placement
FICO
Loss-to-Receivables (LTR)(Pct)
741744
0.13%0.14%
0.36% 0.43%
20152014 20152014 20152014
U.S. Retail and Lease
SLIDE 2
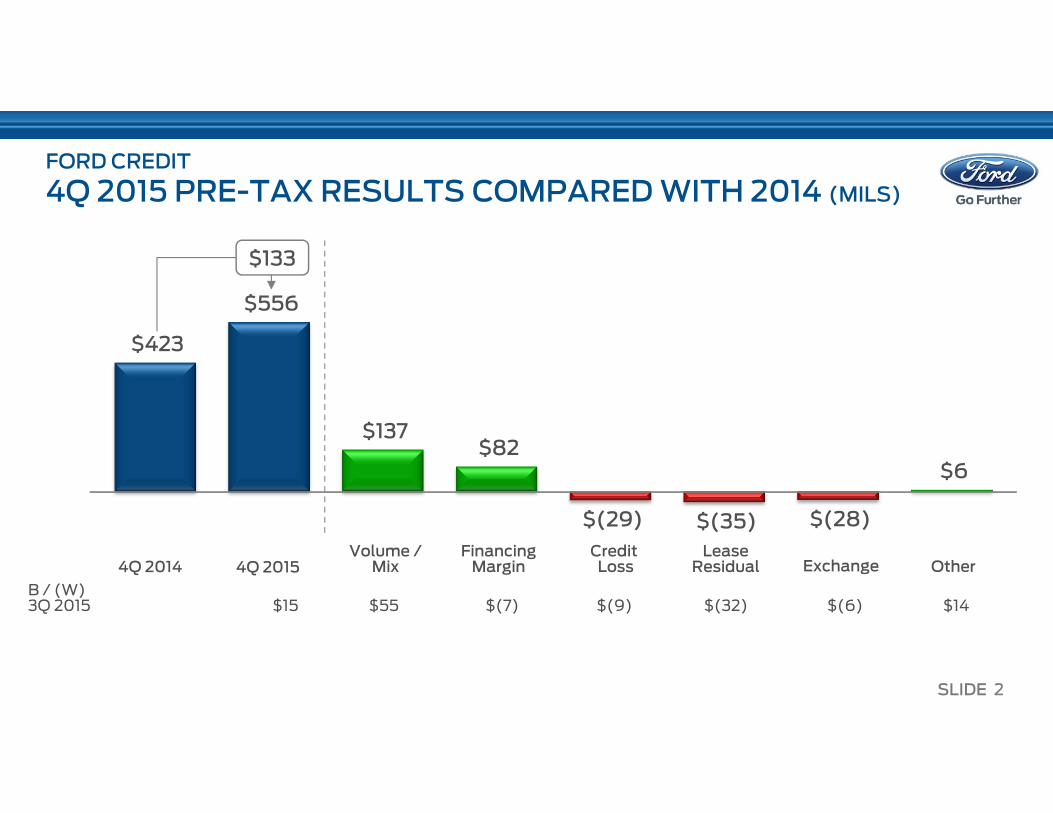
FORD CREDIT
4Q 2015 PRE-TAX RESULTS COMPARED WITH 2014 (MILS)
$423
$556
$137 $82
$(29) $(35) $(28)
$6
4Q 20154Q 2014Volume /
MixFinancing Margin
Lease Residual Exchange Other
B / (W)3Q 2015 $15 $55 $(7) $(9) $(32) $(6) $14
CreditLoss
$133
SLIDE 3
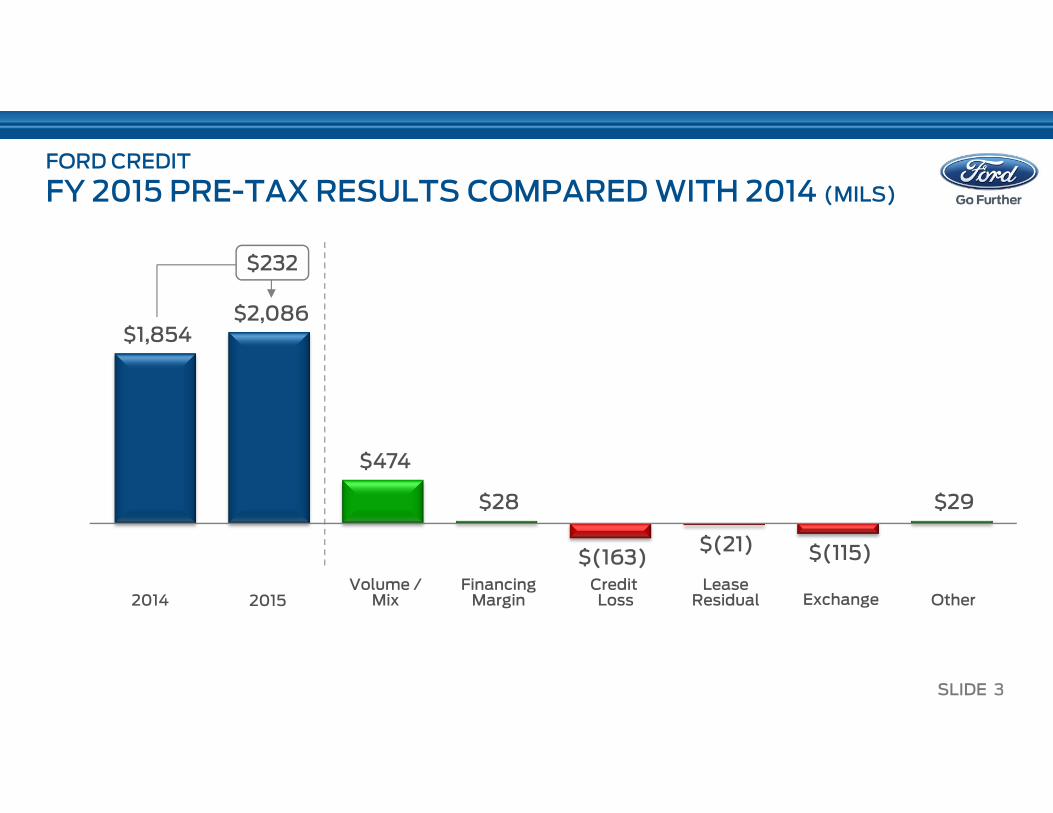
FORD CREDIT
FY 2015 PRE-TAX RESULTS COMPARED WITH 2014 (MILS)
$1,854 $2,086
$474
$28
$(163)$(21) $(115)
$29
20152014Volume /
MixFinancing Margin
Lease Residual Exchange Other
CreditLoss
$232
SLIDE 4
FORD CREDIT
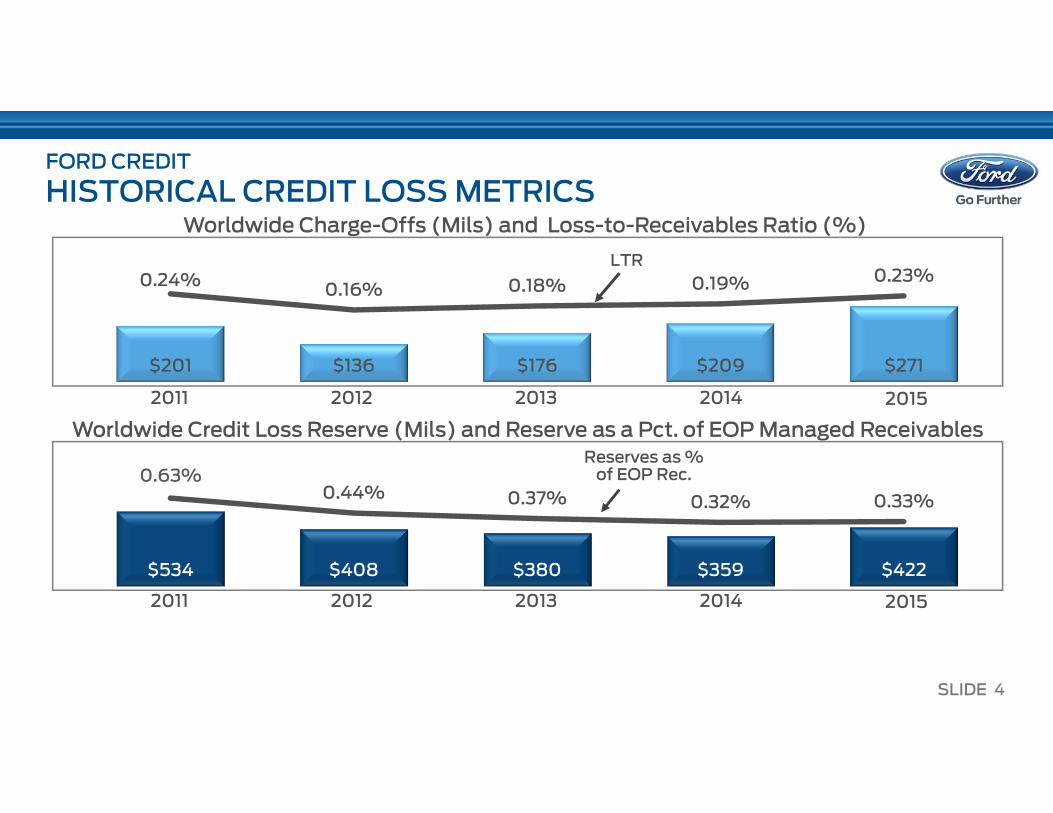
HISTORICAL CREDIT LOSS METRICS
$201 $136 $176 $209 $271
0.24%0.16% 0.18% 0.19% 0.23%
Worldwide Charge-Offs (Mils) and Loss-to-Receivables Ratio (%)
Worldwide Credit Loss Reserve (Mils) and Reserve as a Pct. of EOP Managed Receivables
2011 2012 2013 2014 2015
$534 $408 $380 $359 $422
0.63%0.44% 0.37% 0.32% 0.33%
2011 2012 2013 2014 2015
LTR
Reserves as % of EOP Rec.
SLIDE 5
FORD CREDIT
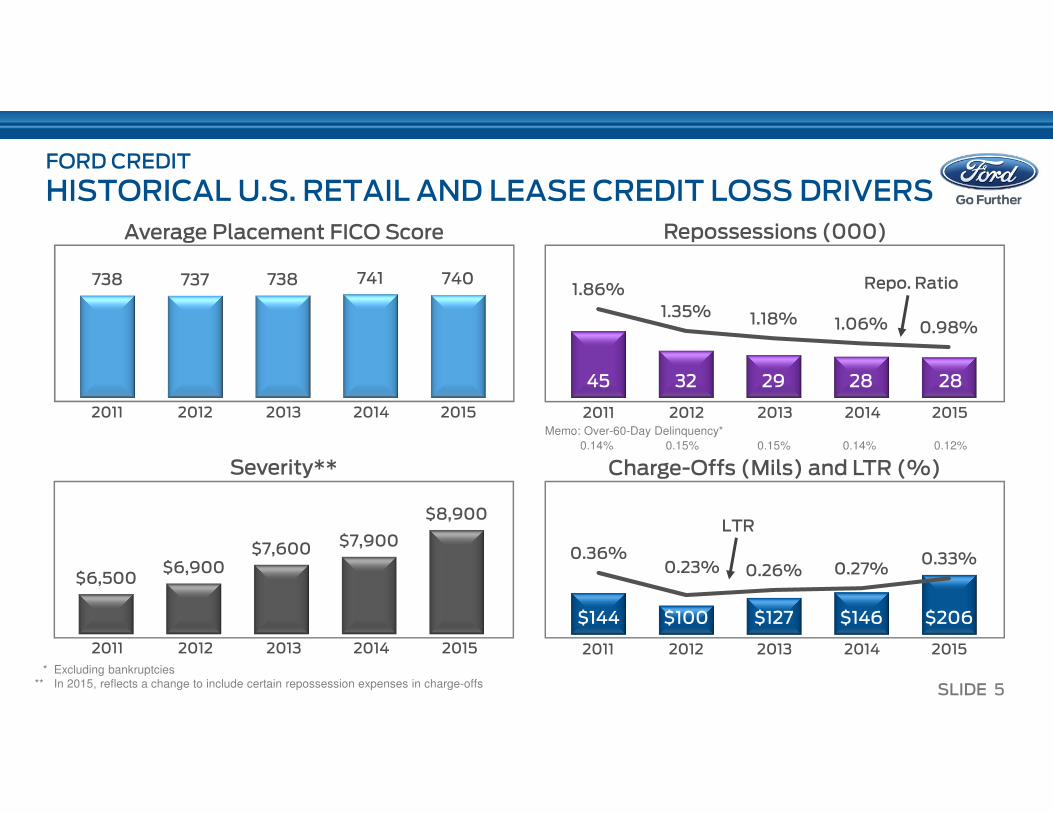
HISTORICAL U.S. RETAIL AND LEASE CREDIT LOSS DRIVERS
Average Placement FICO Score
738 737 738 741 740
Charge-Offs (Mils) and LTR (%)
$144 $100 $127 $146 $206
0.36%0.23% 0.26% 0.27%
0.33%
LTR
2011 2012 2013 2014 2015
2011 2012 2013 2014 2015
45 32 29 28 28
1.86%
1.35% 1.18% 1.06% 0.98%
Repossessions (000)
Repo. Ratio
2011 2012 2013 2014 2015
0.14% 0.15% 0.15% 0.14% 0.12%
Memo: Over-60-Day Delinquency*
* Excluding bankruptcies** In 2015, reflects a change to include certain repossession expenses in charge-offs
Severity**
$6,500$6,900
$7,600 $7,900
$8,900
2011 2012 2013 2014 2015
SLIDE 6
FORD CREDIT
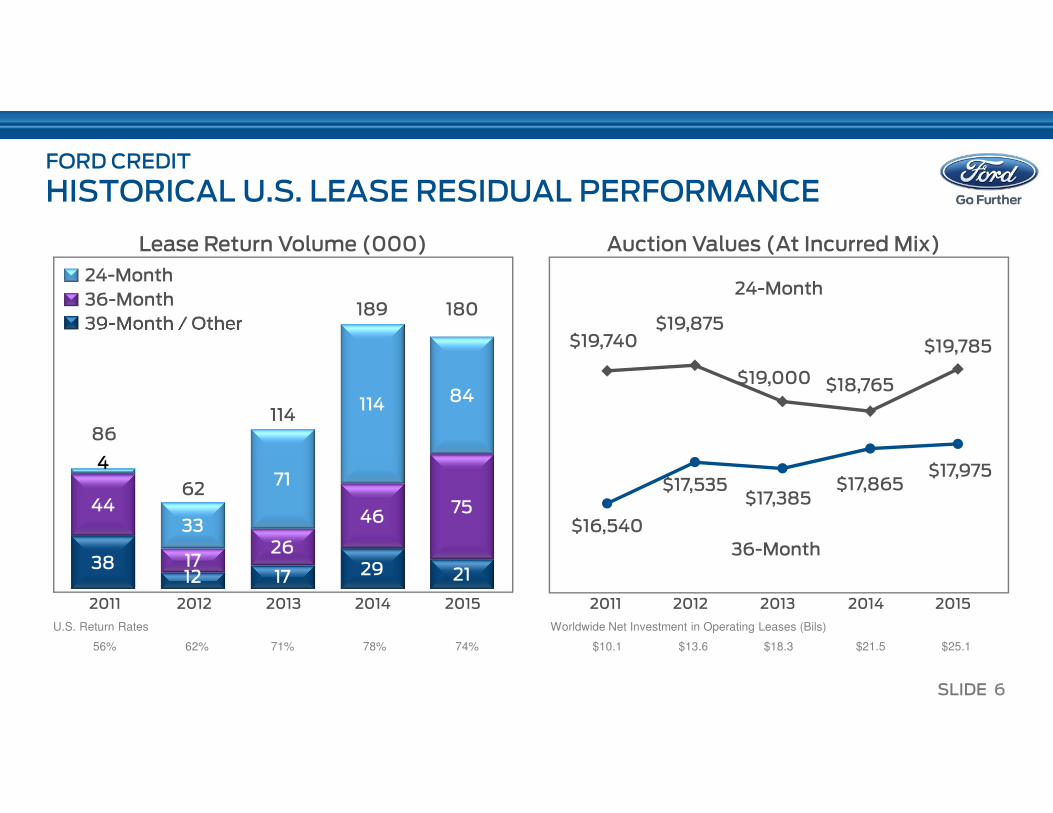
HISTORICAL U.S. LEASE RESIDUAL PERFORMANCE
Lease Return Volume (000) Auction Values (At Incurred Mix)
56% 62% 71% 78% 74% $10.1 $13.6 $18.3 $21.5 $25.1
U.S. Return Rates Worldwide Net Investment in Operating Leases (Bils)
24-Month
36-Month
39-Month / Other$19,740
$19,875
$19,000 $18,765
$19,785
$16,540
$17,535$17,385
$17,865$17,975
36-Month
24-Month
2011 2012 2013 2014 2015 2011 2012 2013 2014 2015
3812 17 29 21
44
1726
4675
4
33
71
114 84
86
62
114
189 180
SLIDE 7
FORD CREDIT
2015 FULL YEAR FUNDING HIGHLIGHTS
� Completed our Full Year funding plan, highlights include:
– Issued about $30 billion of public term funding in the U.S., Canada, Europe, Mexico, China, and Australia
– Issued our first Reg AB II compliant securitization transaction
– Completed our first unsecured financial bond in China and two additionalasset-backed transactions -- total public funding was RMB 8 billion
� Ended the year with net liquidity of about $24 billion
– Ford extended and increased its revolving credit facility to $13.4 billion including $3 billion allocated to Ford Credit
� Key elements of our funding strategy remain unchanged, and our liquidity remains strong
SLIDE 8
FORD CREDIT
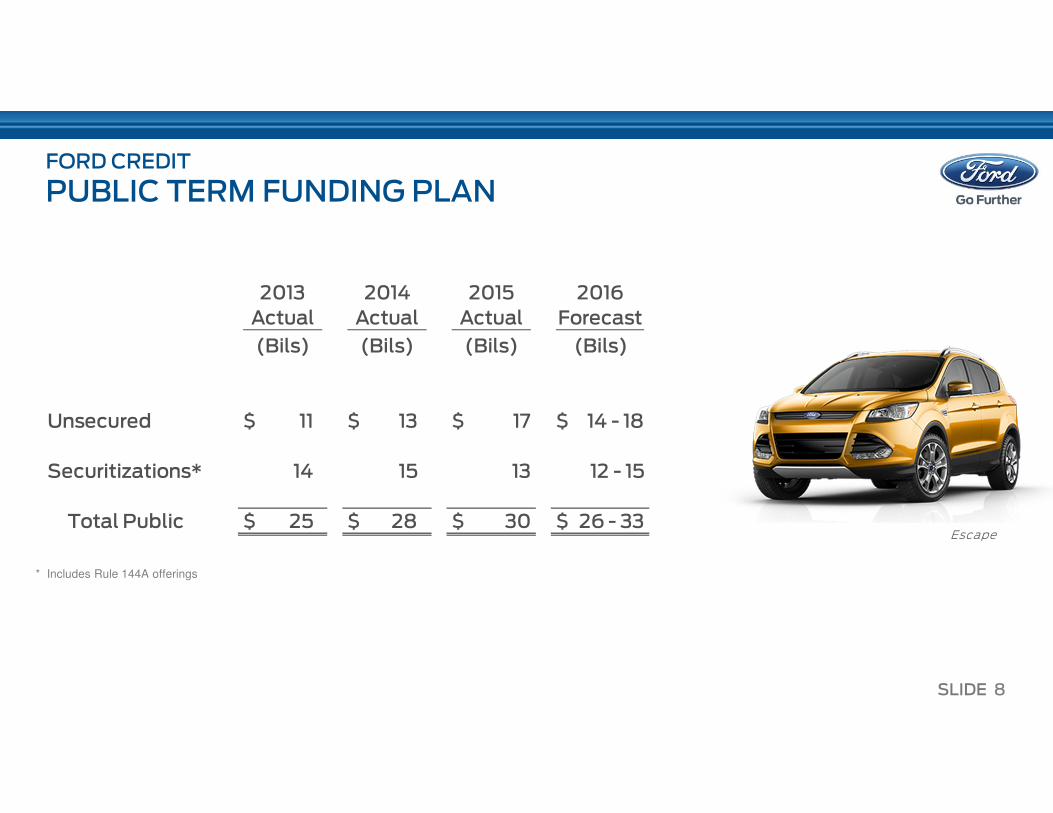
PUBLIC TERM FUNDING PLAN
* Includes Rule 144A offerings
Unsecured $ 11 $ 13 $ 17 $ 14 - 18
Securitizations* 14 15 13 12 - 15
Total Public $ 25 $ 28 $ 30 $ 26 - 33
2013
Actual
(Bils)(Bils) (Bils) (Bils)
2016
Forecast
20152014
Actual Actual
Escape
SLIDE 9
FORD CREDIT
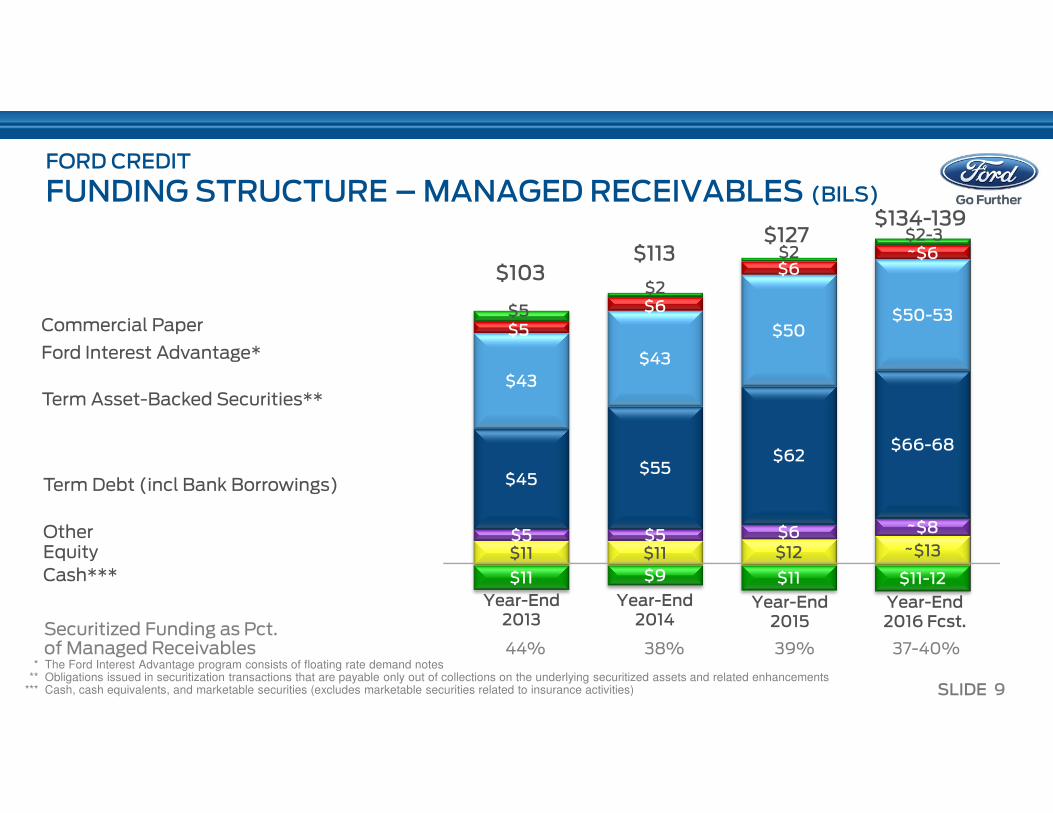
FUNDING STRUCTURE –MANAGED RECEIVABLES (BILS)
$11 $9 $11 $11-12
$11 $11 $12 ~$13$5 $5 $6 ~$8
$45$55
$62$66-68
$43
$43
$50$50-53
$5
$6
$6~$6
$5
$2
$2$2-3
$113$127
$134-139
$103
Securitized Funding as Pct.of Managed Receivables 44% 38% 39% 37-40%
* The Ford Interest Advantage program consists of floating rate demand notes** Obligations issued in securitization transactions that are payable only out of collections on the underlying securitized assets and related enhancements
*** Cash, cash equivalents, and marketable securities (excludes marketable securities related to insurance activities)
Term Asset-Backed Securities**
Term Debt (incl Bank Borrowings)
Cash***
Ford Interest Advantage*
Commercial Paper
OtherEquity
Year-End2013
Year-End2014
Year-End2016 Fcst.
Year-End2015
SLIDE 10
FORD CREDIT
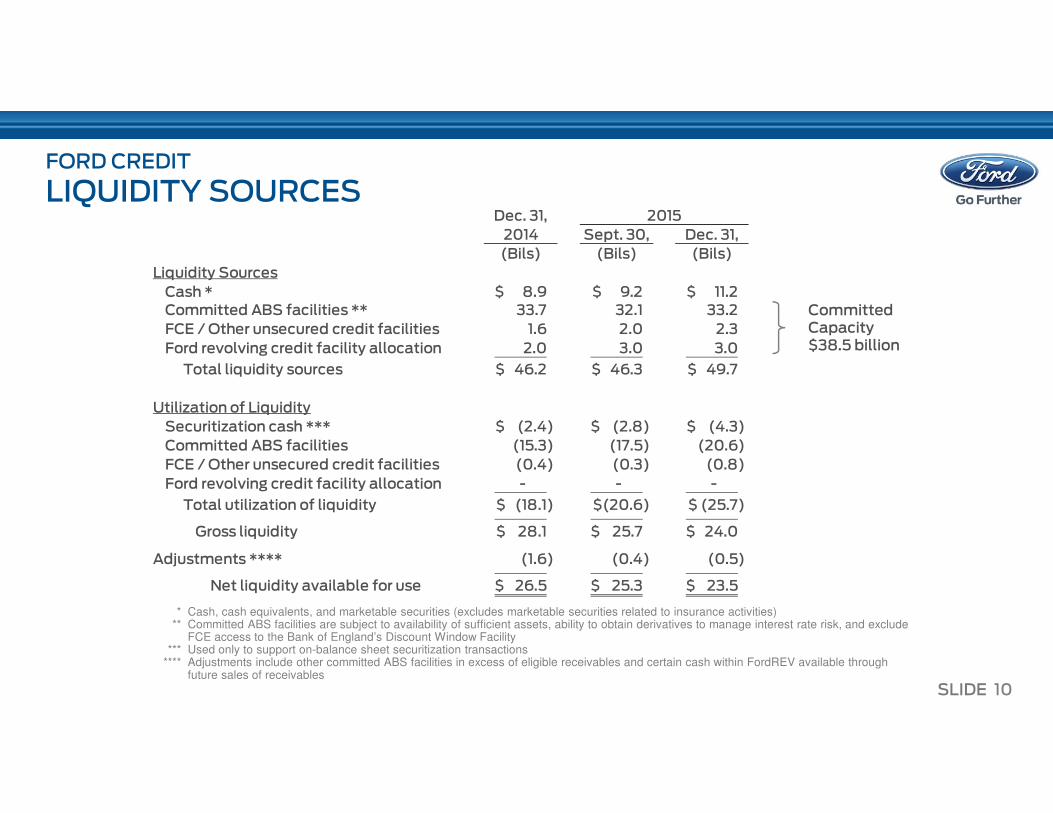
LIQUIDITY SOURCES
Committed Capacity$38.5 billion
Dec. 31,
2014 Sept. 30, Dec. 31,
(Bils) (Bils) (Bils)
Liquidity Sources
Cash * 8.9$ 9.2$ 11.2$
Committed ABS facilities ** 33.7 32.1 33.2
FCE / Other unsecured credit facilities 1.6 2.0 2.3
Ford revolving credit facility allocation 2.0 3.0 3.0
Total liquidity sources 46.2$ 46.3$ 49.7$
Utilization of Liquidity
Securitization cash *** (2.4)$ (2.8)$ (4.3)$
Committed ABS facilities (15.3) (17.5) (20.6)
FCE / Other unsecured credit facilities (0.4) (0.3) (0.8)
Ford revolving credit facility allocation - - -
Total utilization of liquidity (18.1)$ (20.6)$ (25.7)$
Gross liquidity 28.1$ 25.7$ 24.0$
Adjustments **** (1.6) (0.4) (0.5)
Net liquidity available for use 26.5$ 25.3$ 23.5$
2015
* Cash, cash equivalents, and marketable securities (excludes marketable securities related to insurance activities)** Committed ABS facilities are subject to availability of sufficient assets, ability to obtain derivatives to manage interest rate risk, and exclude
FCE access to the Bank of England’s Discount Window Facility*** Used only to support on-balance sheet securitization transactions
**** Adjustments include other committed ABS facilities in excess of eligible receivables and certain cash within FordREV available through future sales of receivables
SLIDE 11
AUTOMOTIVE SECTOR
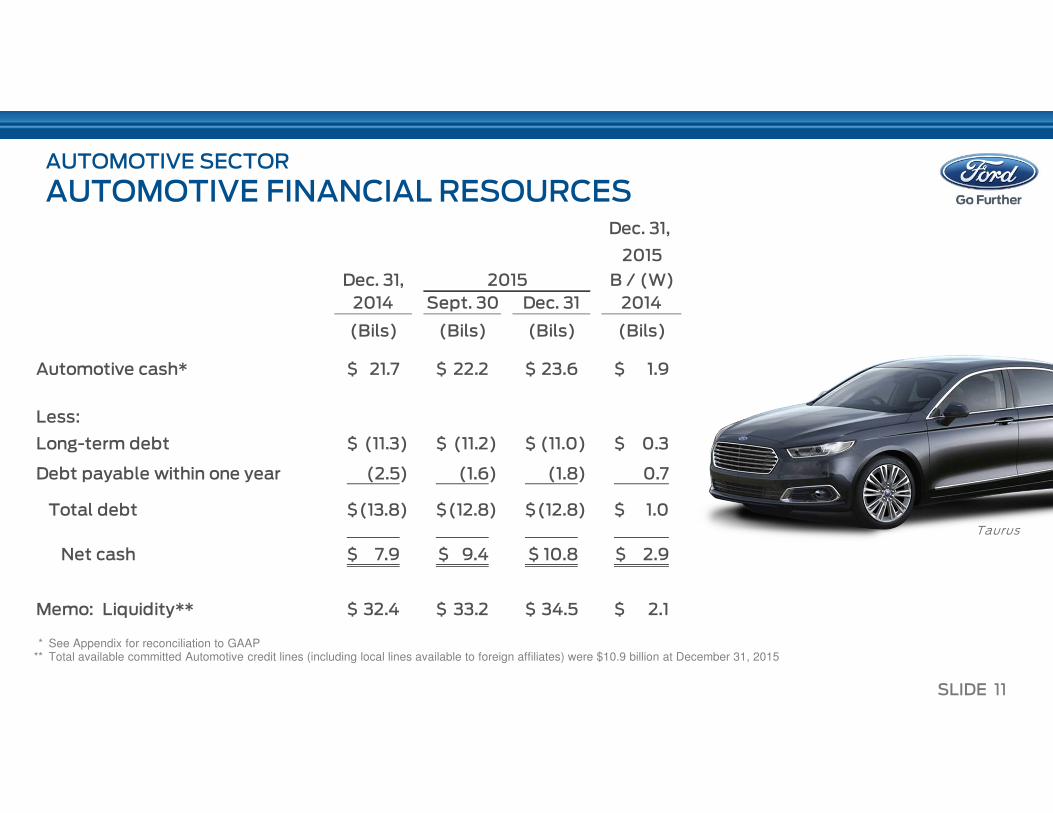
AUTOMOTIVE FINANCIAL RESOURCES
* See Appendix for reconciliation to GAAP** Total available committed Automotive credit lines (including local lines available to foreign affiliates) were $10.9 billion at December 31, 2015
Taurus
Dec. 31,
2015
Dec. 31, B / (W)
2014 Sept. 30 Dec. 31 2014
(Bils) (Bils) (Bils) (Bils)
Automotive cash* 21.7$ 22.2$ 23.6$ 1.9$
Less:
Long-term debt (11.3)$ (11.2)$ (11.0)$ 0.3$
Debt payable within one year (2.5) (1.6) (1.8) 0.7
Total debt (13.8)$ (12.8)$ (12.8)$ 1.0$
Net cash 7.9$ 9.4$ 10.8$ 2.9$
Memo: Liquidity** 32.4$ 33.2$ 34.5$ 2.1$
2015
SLIDE 12
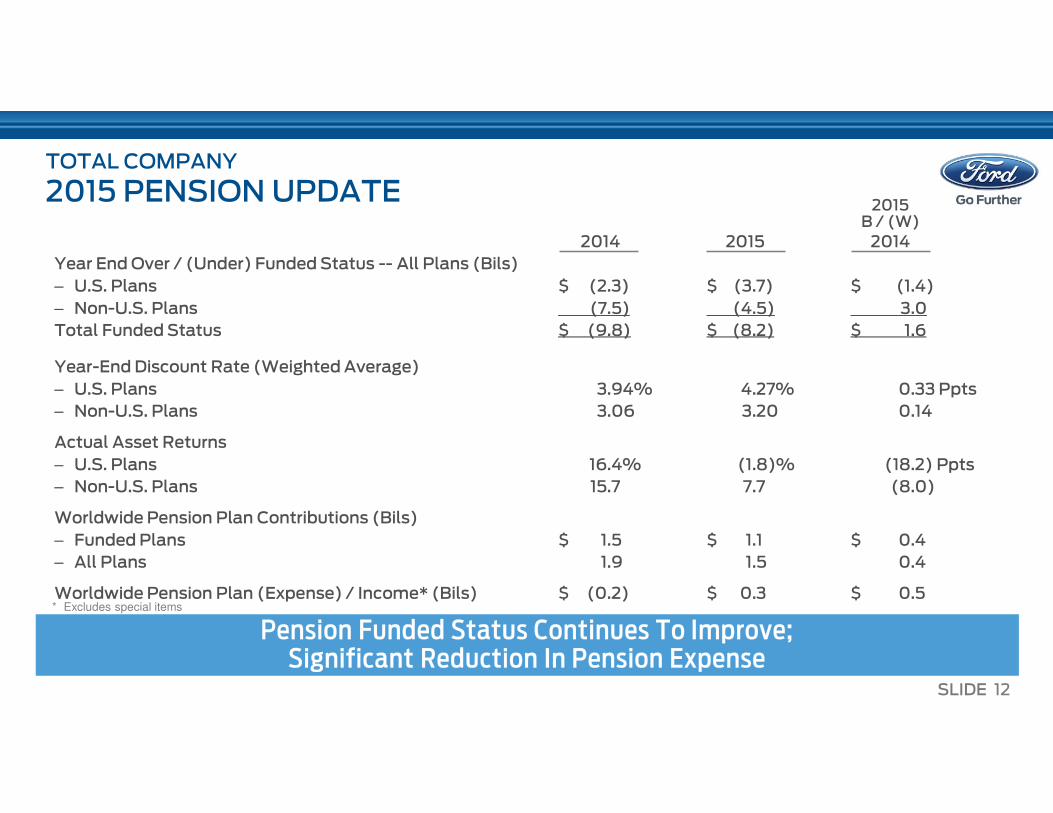
TOTAL COMPANY
2015 PENSION UPDATE
Pension Funded Status Continues To Improve; Significant Reduction In Pension Expense
* Excludes special items
2015B / (W)
2014 2015 2014
Year End Over / (Under) Funded Status -- All Plans (Bils)
– U.S. Plans $ (2.3) $ (3.7) $ (1.4)
– Non-U.S. Plans (7.5) (4.5) 3.0
Total Funded Status $ (9.8) $ (8.2) $ 1.6
Year-End Discount Rate (Weighted Average)
– U.S. Plans 3.94% 4.27% 0.33 Ppts
– Non-U.S. Plans 3.06 3.20 0.14
Actual Asset Returns
– U.S. Plans 16.4% (1.8)% (18.2) Ppts
– Non-U.S. Plans 15.7 7.7 (8.0)
Worldwide Pension Plan Contributions (Bils)
– Funded Plans $ 1.5 $ 1.1 $ 0.4
– All Plans 1.9 1.5 0.4
Worldwide Pension Plan (Expense) / Income* (Bils) $ (0.2) $ 0.3 $ 0.5
SLIDE 13
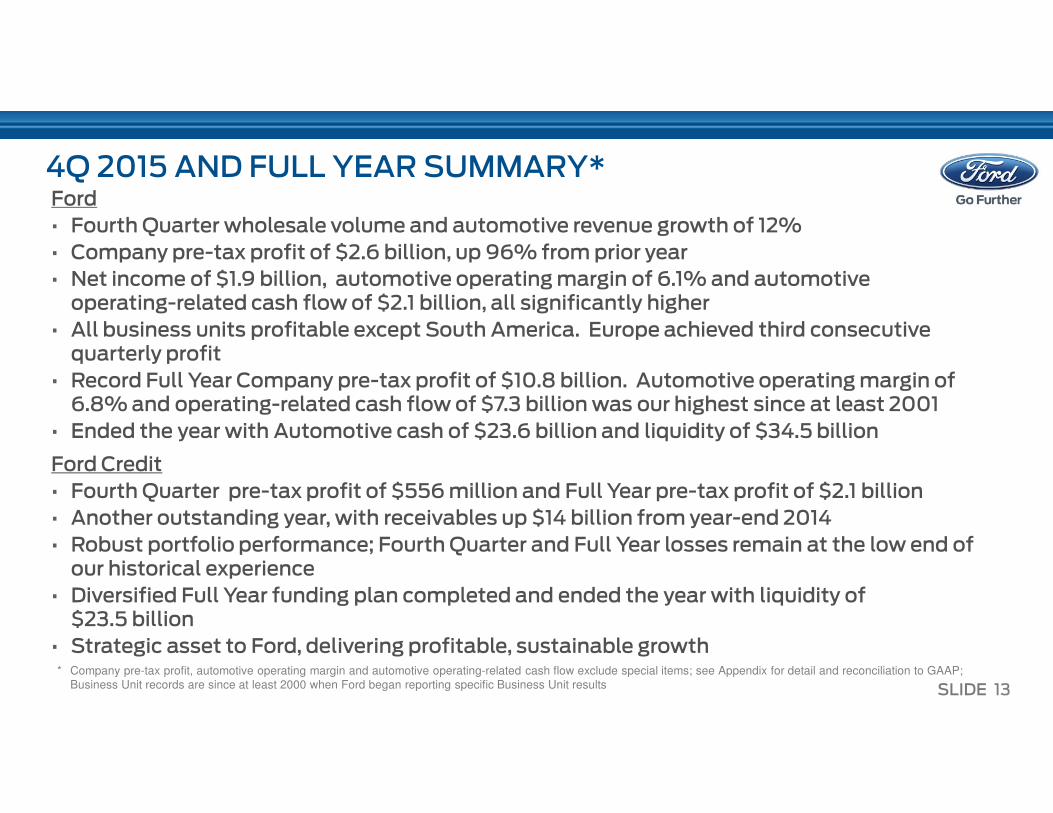
4Q 2015 AND FULL YEAR SUMMARY*Ford
• Fourth Quarter wholesale volume and automotive revenue growth of 12%
• Company pre-tax profit of $2.6 billion, up 96% from prior year
• Net income of $1.9 billion, automotive operating margin of 6.1% and automotive operating-related cash flow of $2.1 billion, all significantly higher
• All business units profitable except South America. Europe achieved third consecutive quarterly profit
• Record Full Year Company pre-tax profit of $10.8 billion. Automotive operating margin of 6.8% and operating-related cash flow of $7.3 billion was our highest since at least 2001
• Ended the year with Automotive cash of $23.6 billion and liquidity of $34.5 billion
Ford Credit
• Fourth Quarter pre-tax profit of $556 million and Full Year pre-tax profit of $2.1 billion
• Another outstanding year, with receivables up $14 billion from year-end 2014
• Robust portfolio performance; Fourth Quarter and Full Year losses remain at the low end of our historical experience
• Diversified Full Year funding plan completed and ended the year with liquidity of $23.5 billion
• Strategic asset to Ford, delivering profitable, sustainable growth* Company pre-tax profit, automotive operating margin and automotive operating-related cash flow exclude special items; see Appendix for detail and reconciliation to GAAP;
Business Unit records are since at least 2000 when Ford began reporting specific Business Unit results
SLIDE 14
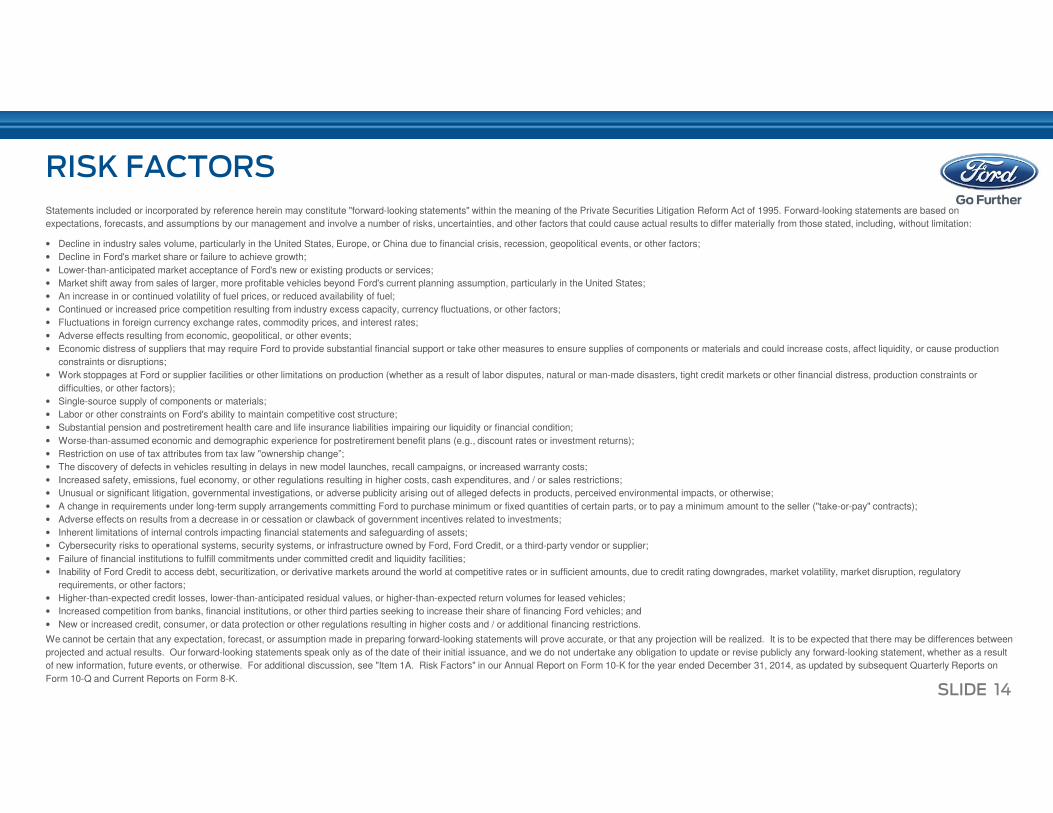
RISK FACTORS
Statements included or incorporated by reference herein may constitute "forward-looking statements" within the meaning of the Private Securities Litigation Reform Act of 1995. Forward-looking statements are based on
expectations, forecasts, and assumptions by our management and involve a number of risks, uncertainties, and other factors that could cause actual results to differ materially from those stated, including, without limitation:
• Decline in industry sales volume, particularly in the United States, Europe, or China due to financial crisis, recession, geopolitical events, or other factors;
• Decline in Ford's market share or failure to achieve growth;
• Lower-than-anticipated market acceptance of Ford's new or existing products or services;
• Market shift away from sales of larger, more profitable vehicles beyond Ford's current planning assumption, particularly in the United States;
• An increase in or continued volatility of fuel prices, or reduced availability of fuel;
• Continued or increased price competition resulting from industry excess capacity, currency fluctuations, or other factors;
• Fluctuations in foreign currency exchange rates, commodity prices, and interest rates;
• Adverse effects resulting from economic, geopolitical, or other events;
• Economic distress of suppliers that may require Ford to provide substantial financial support or take other measures to ensure supplies of components or materials and could increase costs, affect liquidity, or cause production
constraints or disruptions;
• Work stoppages at Ford or supplier facilities or other limitations on production (whether as a result of labor disputes, natural or man-made disasters, tight credit markets or other financial distress, production constraints or
difficulties, or other factors);
• Single-source supply of components or materials;
• Labor or other constraints on Ford's ability to maintain competitive cost structure;
• Substantial pension and postretirement health care and life insurance liabilities impairing our liquidity or financial condition;
• Worse-than-assumed economic and demographic experience for postretirement benefit plans (e.g., discount rates or investment returns);
• Restriction on use of tax attributes from tax law "ownership change”;
• The discovery of defects in vehicles resulting in delays in new model launches, recall campaigns, or increased warranty costs;
• Increased safety, emissions, fuel economy, or other regulations resulting in higher costs, cash expenditures, and / or sales restrictions;
• Unusual or significant litigation, governmental investigations, or adverse publicity arising out of alleged defects in products, perceived environmental impacts, or otherwise;
• A change in requirements under long-term supply arrangements committing Ford to purchase minimum or fixed quantities of certain parts, or to pay a minimum amount to the seller ("take-or-pay" contracts);
• Adverse effects on results from a decrease in or cessation or clawback of government incentives related to investments;
• Inherent limitations of internal controls impacting financial statements and safeguarding of assets;
• Cybersecurity risks to operational systems, security systems, or infrastructure owned by Ford, Ford Credit, or a third-party vendor or supplier;
• Failure of financial institutions to fulfill commitments under committed credit and liquidity facilities;
• Inability of Ford Credit to access debt, securitization, or derivative markets around the world at competitive rates or in sufficient amounts, due to credit rating downgrades, market volatility, market disruption, regulatory
requirements, or other factors;
• Higher-than-expected credit losses, lower-than-anticipated residual values, or higher-than-expected return volumes for leased vehicles;
• Increased competition from banks, financial institutions, or other third parties seeking to increase their share of financing Ford vehicles; and
• New or increased credit, consumer, or data protection or other regulations resulting in higher costs and / or additional financing restrictions.
We cannot be certain that any expectation, forecast, or assumption made in preparing forward-looking statements will prove accurate, or that any projection will be realized. It is to be expected that there may be differences between
projected and actual results. Our forward-looking statements speak only as of the date of their initial issuance, and we do not undertake any obligation to update or revise publicly any forward-looking statement, whether as a result
of new information, future events, or otherwise. For additional discussion, see "Item 1A. Risk Factors" in our Annual Report on Form 10-K for the year ended December 31, 2014, as updated by subsequent Quarterly Reports on
Form 10-Q and Current Reports on Form 8-K.

Q&A
APPENDIX
APPENDIX INDEX
Total Company• Income from Continuing Operations 1• Credit Ratings 2Automotive Sector• Cash Reconciliation to GAAP 3• Automotive Debt 4Ford Credit• 2015 Full Year Key Metrics Compared with 2014 5• Operating Highlights 6• Net Finance Receivables and Operating Leases 7• Managed Leverage Reconciliation to GAAP 8• Worldwide Credit Loss Metrics 9• U.S. Retail and Lease Credit Loss Drivers 10• U.S. Lease Residual Performance 11• Liquidity Profile Balance Sheet 12FCE Bank plc• Net Loans & Advances to Customers by Market 13• Credit Loss Ratio (Loss-to-Receivables Ratio) 14• Public Term Funding Plan 15
No.
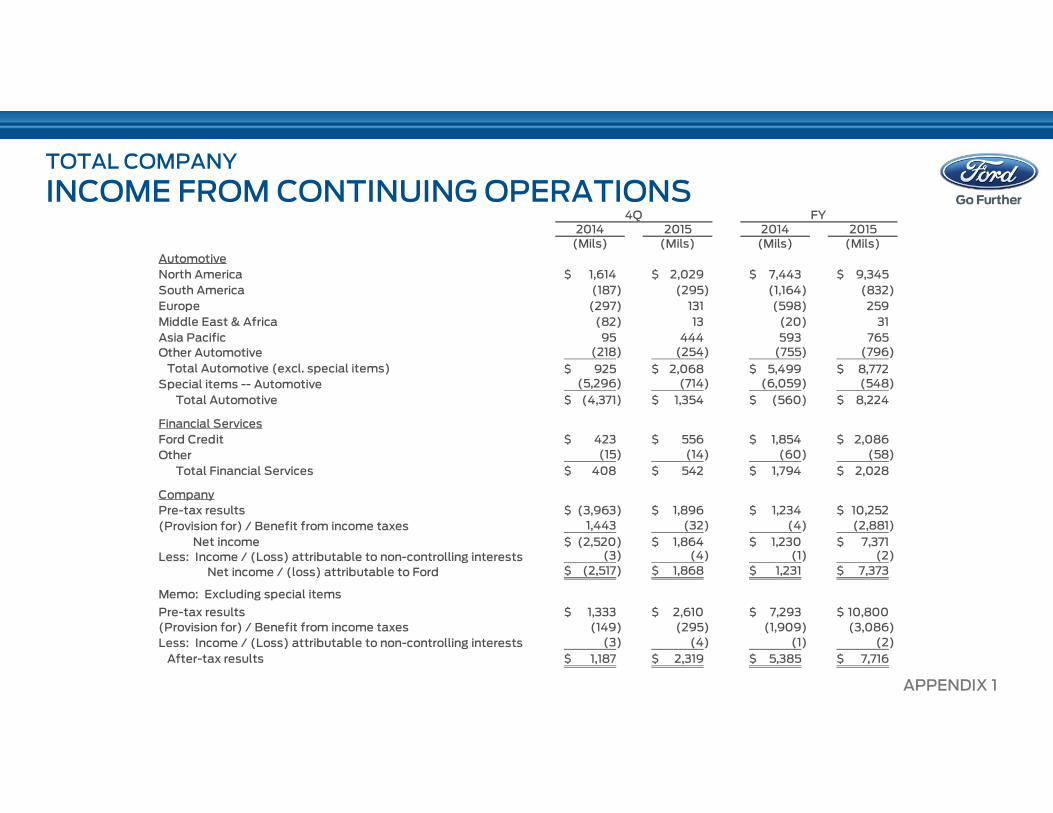
TOTAL COMPANY
INCOME FROM CONTINUING OPERATIONS
APPENDIX 1
2014 2015 2014 2015
(Mils) (Mils) (Mils) (Mils)
Automotive
North America 1,614$ 2,029$ 7,443$ 9,345$
South America (187) (295) (1,164) (832)
Europe (297) 131 (598) 259
Middle East & Africa (82) 13 (20) 31
Asia Pacific 95 444 593 765
Other Automotive (218) (254) (755) (796)
Total Automotive (excl. special items) 925$ 2,068$ 5,499$ 8,772$
Special items -- Automotive (5,296) (714) (6,059) (548)
Total Automotive (4,371)$ 1,354$ (560)$ 8,224$
Financial Services
Ford Credit 423$ 556$ 1,854$ 2,086$
Other (15) (14) (60) (58)
Total Financial Services 408$ 542$ 1,794$ 2,028$
Company
Pre-tax results (3,963)$ 1,896$ 1,234$ 10,252$
(Provision for) / Benefit from income taxes 1,443 (32) (4) (2,881)
Net income (2,520)$ 1,864$ 1,230$ 7,371$
Less: Income / (Loss) attributable to non-controlling interests (3) (4) (1) (2)
Net income / (loss) attributable to Ford (2,517)$ 1,868$ 1,231$ 7,373$
Memo: Excluding special items
Pre-tax results 1,333$ 2,610$ 7,293$ 10,800$
(Provision for) / Benefit from income taxes (149) (295) (1,909) (3,086)
Less: Income / (Loss) attributable to non-controlling interests (3) (4) (1) (2)
After-tax results 1,187$ 2,319$ 5,385$ 7,716$
4Q FY
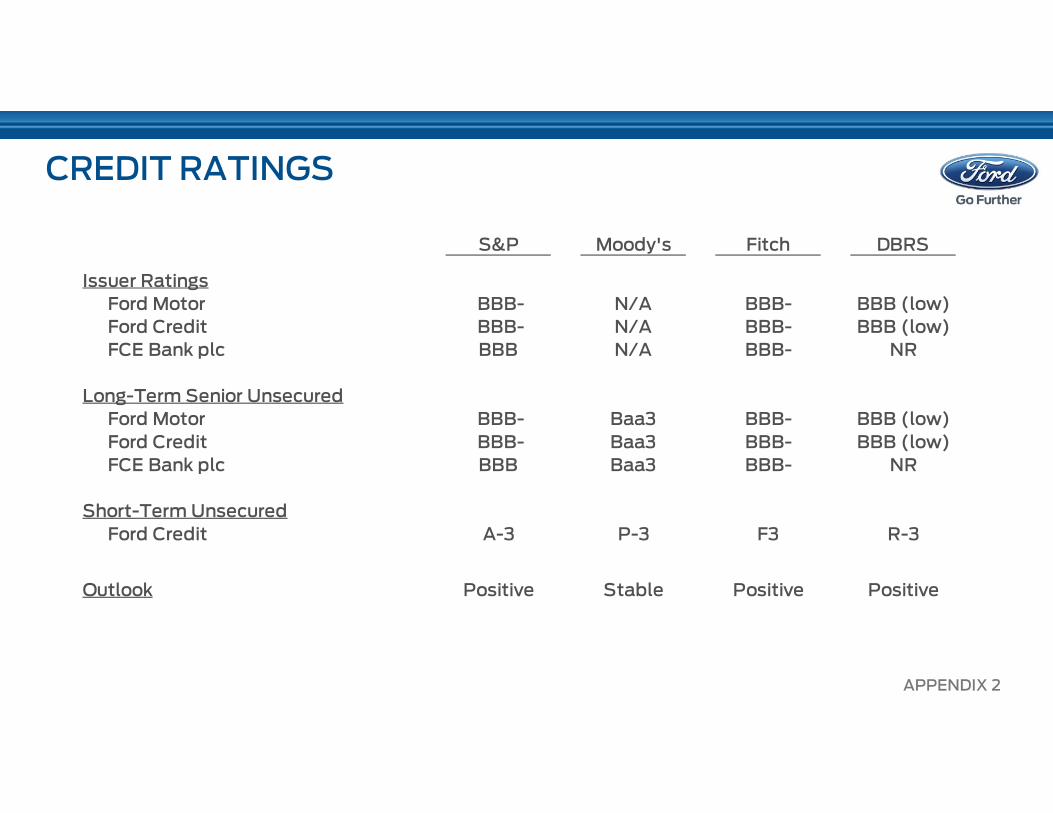
CREDIT RATINGS
S&P Moody's Fitch DBRS
Issuer Ratings
Ford Motor BBB- N/A BBB- BBB (low)
Ford Credit BBB- N/A BBB- BBB (low)
FCE Bank plc BBB N/A BBB- NR
Long-Term Senior Unsecured
Ford Motor BBB- Baa3 BBB- BBB (low)
Ford Credit BBB- Baa3 BBB- BBB (low)
FCE Bank plc BBB Baa3 BBB- NR
Short-Term Unsecured
Ford Credit A-3 P-3 F3 R-3
Outlook Positive Stable Positive Positive
APPENDIX 2
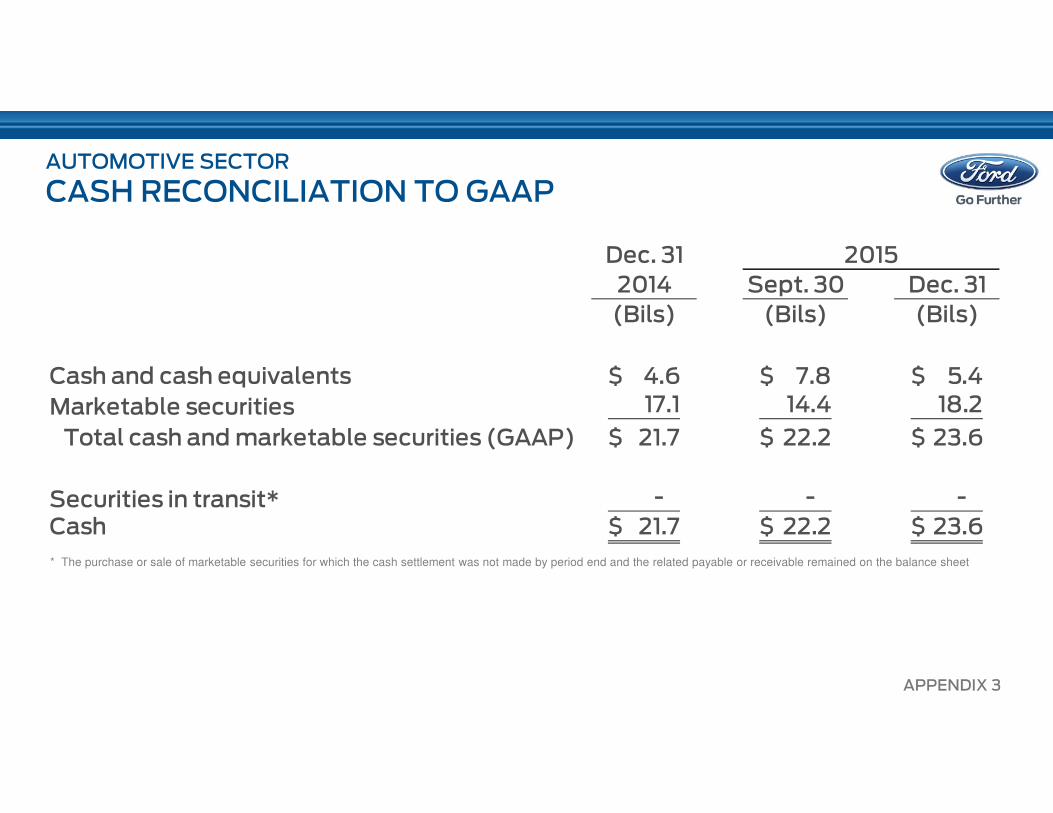
AUTOMOTIVE SECTOR
CASH RECONCILIATION TO GAAP
APPENDIX 3
* The purchase or sale of marketable securities for which the cash settlement was not made by period end and the related payable or receivable remained on the balance sheet
2014 Sept. 30 Dec. 31
(Bils) (Bils) (Bils)
Cash and cash equivalents 4.6$ 7.8$ 5.4$
Marketable securities 17.1 14.4 18.2
Total cash and marketable securities (GAAP) 21.7$ 22.2$ 23.6$
Securities in transit* - - -
Cash 21.7$ 22.2$ 23.6$
Dec. 31 2015

AUTOMOTIVE SECTOR
AUTOMOTIVE DEBT
APPENDIX 4
Dec. 31,
2014 Sept. 30 Dec. 31
(Bils) (Bils) (Bils)
Public unsecured debt 6.6$ 6.5$ 6.4$
U.S. Department of Energy 4.4 4.0 3.8
Other debt (including International) 2.8 2.3 2.6
Total Automotive debt 13.8$ 12.8$ 12.8$
Memo:
Automotive debt payable within one year 2.5$ 1.6$ 1.8$
2015
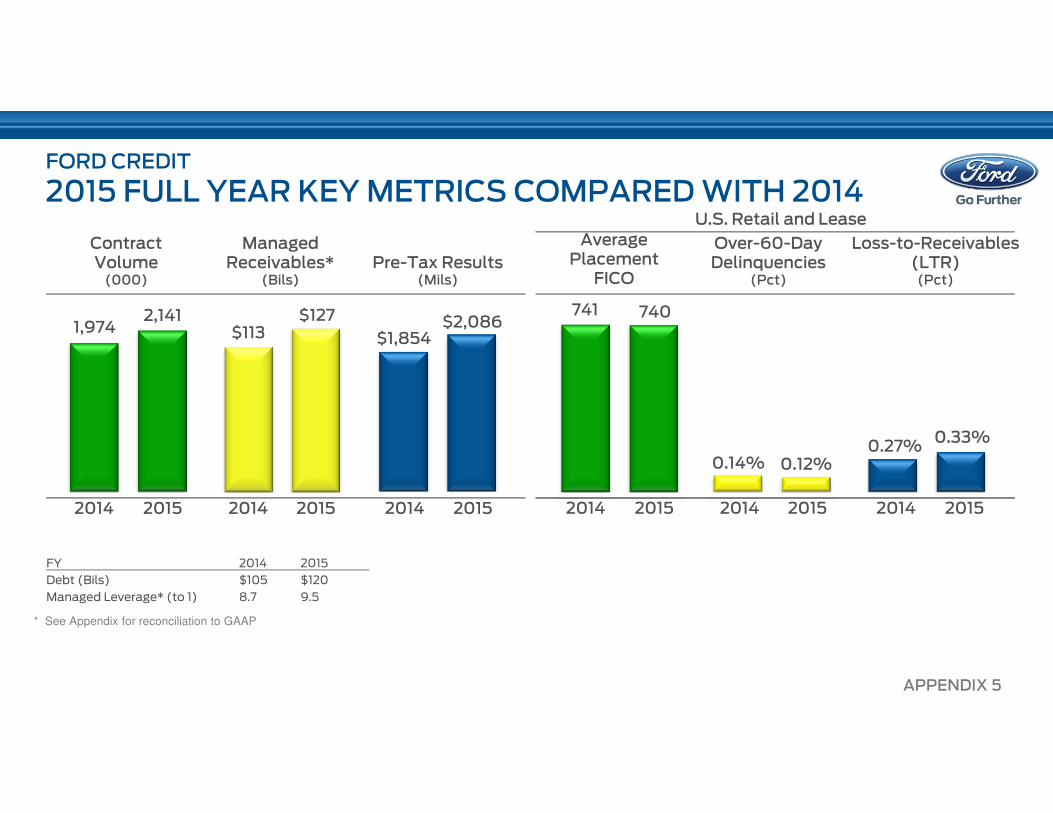
FORD CREDIT
2015 FULL YEAR KEY METRICS COMPARED WITH 2014
2,1411,974 $2,086
$1,854
Managed Receivables*
(Bils)
Contract Volume(000)
Pre-Tax Results(Mils)
$113$127
20152014 20152014 20152014
FY 2014 2015
Debt (Bils) $105 $120
Managed Leverage* (to 1) 8.7 9.5
Over-60-DayDelinquencies
(Pct)
Average Placement
FICO
Loss-to-Receivables (LTR)(Pct)
740741
0.12%0.14%0.27%
0.33%
20152014 20152014 20152014
* See Appendix for reconciliation to GAAP
APPENDIX 5
U.S. Retail and Lease
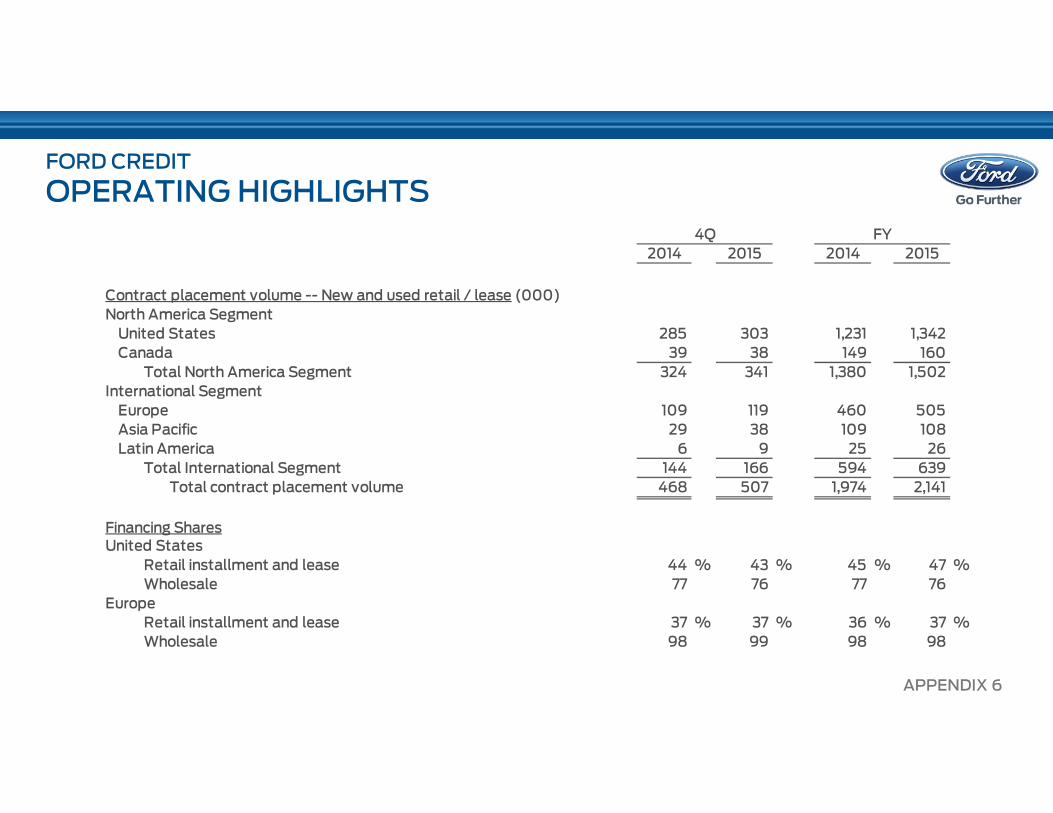
FORD CREDIT
OPERATING HIGHLIGHTS
APPENDIX 6
2014 2015 2014 2015
Contract placement volume -- New and used retail / lease (000)
North America Segment
United States 285 303 1,231 1,342
Canada 39 38 149 160
Total North America Segment 324 341 1,380 1,502
International Segment
Europe 109 119 460 505
Asia Pacific 29 38 109 108
Latin America 6 9 25 26
Total International Segment 144 166 594 639
Total contract placement volume 468 507 1,974 2,141
Financing SharesUnited States
Retail installment and lease 44 % 43 % 45 % 47 %
Wholesale 77 76 77 76
Europe
Retail installment and lease 37 % 37 % 36 % 37 %
Wholesale 98 99 98 98
4Q FY

FORD CREDIT
NET FINANCE RECEIVABLES AND OPERATING LEASES
APPENDIX 7
Dec. 31, 2014 Dec. 31, 2015
Net Receivables* (Bils) (Bils)
Finance receivables -- North America Segment
Consumer retail financing 44.1$ 49.2$
Non-consumer: Dealer financing** 22.5 25.5
Non-consumer: Other 1.0 0.9
Total finance receivables -- North America Segment 67.6$ 75.6$
Finance receivables -- International Segment
Consumer retail financing 11.8$ 12.9$
Non-consumer: Dealer financing** 9.3 10.5
Non-consumer: Other 0.3 0.3
Total finance receivables -- International Segment 21.4$ 23.7$
Unearned interest supplements (1.8) (2.1)
Allowance for credit losses (0.3) (0.4)
Finance receivables, net 86.9$ 96.8$
Net investment in operating leases 21.5 25.1
Total net receivables 108.4$ 121.9$
Managed Receivables
Total net receivables 108.4$ 121.9$
Unearned interest supplements and residual support 3.9 4.5
Allowance for credit losses 0.4 0.4
Other, primarily accumulated supplemental depreciation 0.1 0.4
Total managed receivables 112.8$ 127.2$
* Includes finance receivables (retail and wholesale) sold for legal purposes and net investment in operating leases included in securitization transactions that do not satisfy the requirements for accounting sale treatment. These receivables and operating leases are reported on Ford Credit’s balance sheet and are available only for payment of the debt issued by, and other obligations of, the securitization entities that are parties to those securitization transactions; they are not available to pay the other obligations of Ford Credit or the claims of Ford Credit’s other creditors
** Dealer financing primarily includes wholesale loans to dealers to finance the purchase of vehicle inventory
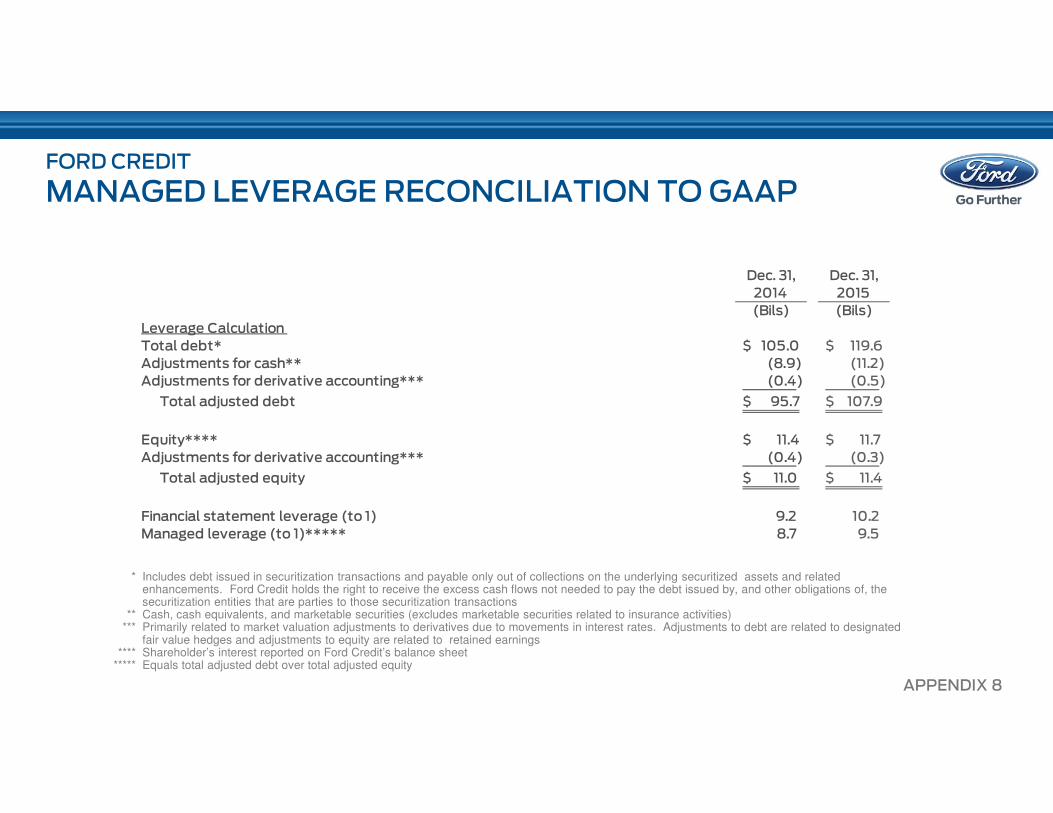
FORD CREDIT
MANAGED LEVERAGE RECONCILIATION TO GAAP
* Includes debt issued in securitization transactions and payable only out of collections on the underlying securitized assets and related enhancements. Ford Credit holds the right to receive the excess cash flows not needed to pay the debt issued by, and other obligations of, the securitization entities that are parties to those securitization transactions
** Cash, cash equivalents, and marketable securities (excludes marketable securities related to insurance activities)*** Primarily related to market valuation adjustments to derivatives due to movements in interest rates. Adjustments to debt are related to designated
fair value hedges and adjustments to equity are related to retained earnings**** Shareholder’s interest reported on Ford Credit’s balance sheet
***** Equals total adjusted debt over total adjusted equity
APPENDIX 8
Dec. 31, Dec. 31,
2014 2015
(Bils) (Bils)
Leverage Calculation
Total debt* $ 105.0 [ $ 119.6 ]
Adjustments for cash** (8.9) [ (11.2) ]
Adjustments for derivative accounting*** (0.4) [ (0.5) ]
Total adjusted debt $ 95.7 [ $ 107.9 ]
Equity**** $ 11.4 [ $ 11.7 ]
Adjustments for derivative accounting*** (0.4) [ (0.3) ]
Total adjusted equity $ 11.0 [ $ 11.4 ]
Financial statement leverage (to 1) 9.2 [ 10.2 ]
Managed leverage (to 1)***** 8.7 [ 9.5 ]

$359 $355 $380
$403 $422
0.32% 0.31% 0.32% 0.33% 0.33%
FORD CREDIT
WORLDWIDE CREDIT LOSS METRICS
Charge-Offs (Mils) Loss-to-Receivables Ratio (LTR)
Credit Loss Reserve (Mils) and Reserve as a Pct. of EOP Managed Receivables
$76$62 $50
$73$86 0.27%
0.22%0.17%
0.24% 0.27%
4Q 2014 1Q 2015 2Q 2015 3Q 2015 4Q 2015 4Q 2014 1Q 2015 2Q 2015 3Q 2015 4Q 2015
4Q 2014 1Q 2015 2Q 2015 3Q 2015 4Q 2015APPENDIX 9
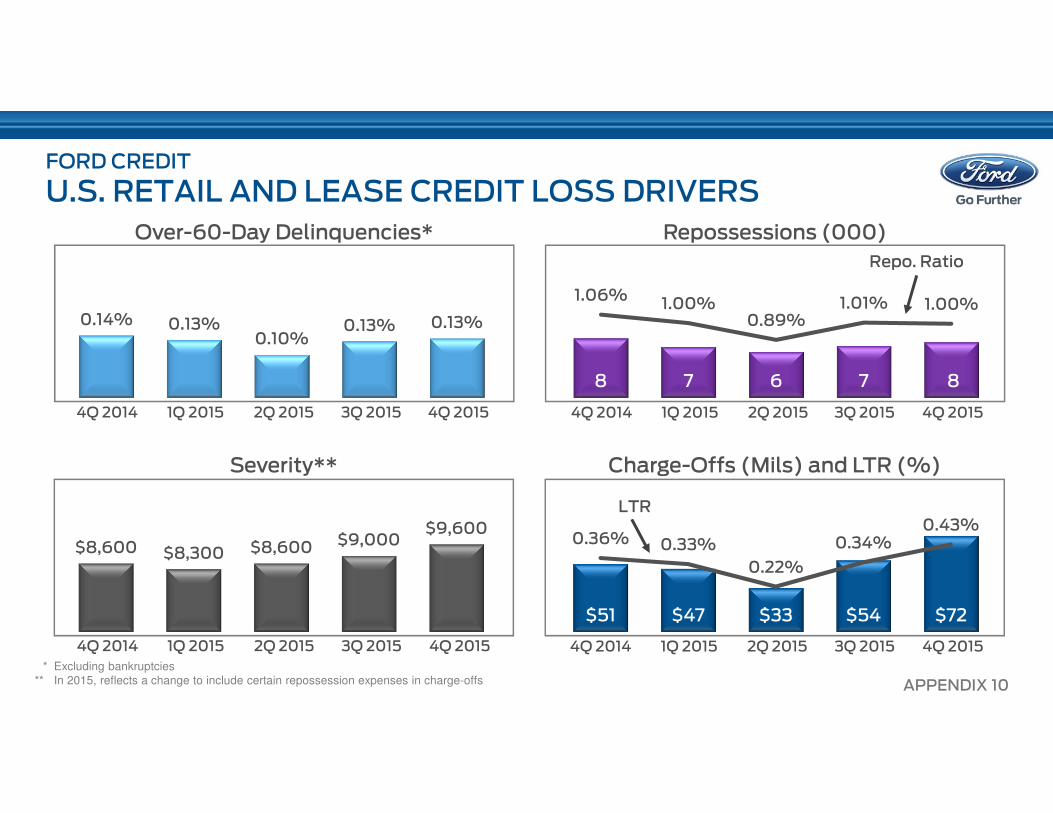
FORD CREDIT
U.S. RETAIL AND LEASE CREDIT LOSS DRIVERS
Over-60-Day Delinquencies* Repossessions (000)
0.14% 0.13%0.10%
0.13% 0.13%
8 7 6 7 8
1.06%1.00%
0.89%1.01% 1.00%
Severity** Charge-Offs (Mils) and LTR (%)
$8,600 $8,300 $8,600 $9,000$9,600
$51 $47 $33 $54 $72
0.36% 0.33%
0.22%
0.34%0.43%
Repo. Ratio
LTR
4Q 2014 1Q 2015 2Q 2015 3Q 2015 4Q 2015 4Q 2014 1Q 2015 2Q 2015 3Q 2015 4Q 2015
4Q 2014 1Q 2015 2Q 2015 3Q 2015 4Q 2015 4Q 2014 1Q 2015 2Q 2015 3Q 2015 4Q 2015
* Excluding bankruptcies** In 2015, reflects a change to include certain repossession expenses in charge-offs APPENDIX 10

FORD CREDIT
U.S. LEASE RESIDUAL PERFORMANCE
Lease Return Volume (000) Auction Values (At 4Q 2015 Mix)
77% 77% 70% 71% 79% $21.5 $22.0 $23.4 $24.5 $25.1
U.S. Return Rates Worldwide Net Investment in Operating Leases (Bils)
24-Month
36-Month
39-Month / Other
$18,690
$20,430 $20,540
$19,785
$18,980
$17,155
$18,375$18,550
$17,955$17,390
36-Month
24-Month
4Q 2014 1Q 2015 2Q 2015 3Q 2015 4Q 2015 4Q 2014 1Q 2015 2Q 2015 3Q 2015 4Q 2015
6 6 5 4 5
915 16 19
26
20
23 21 20
2035
4442 43
51
APPENDIX 11
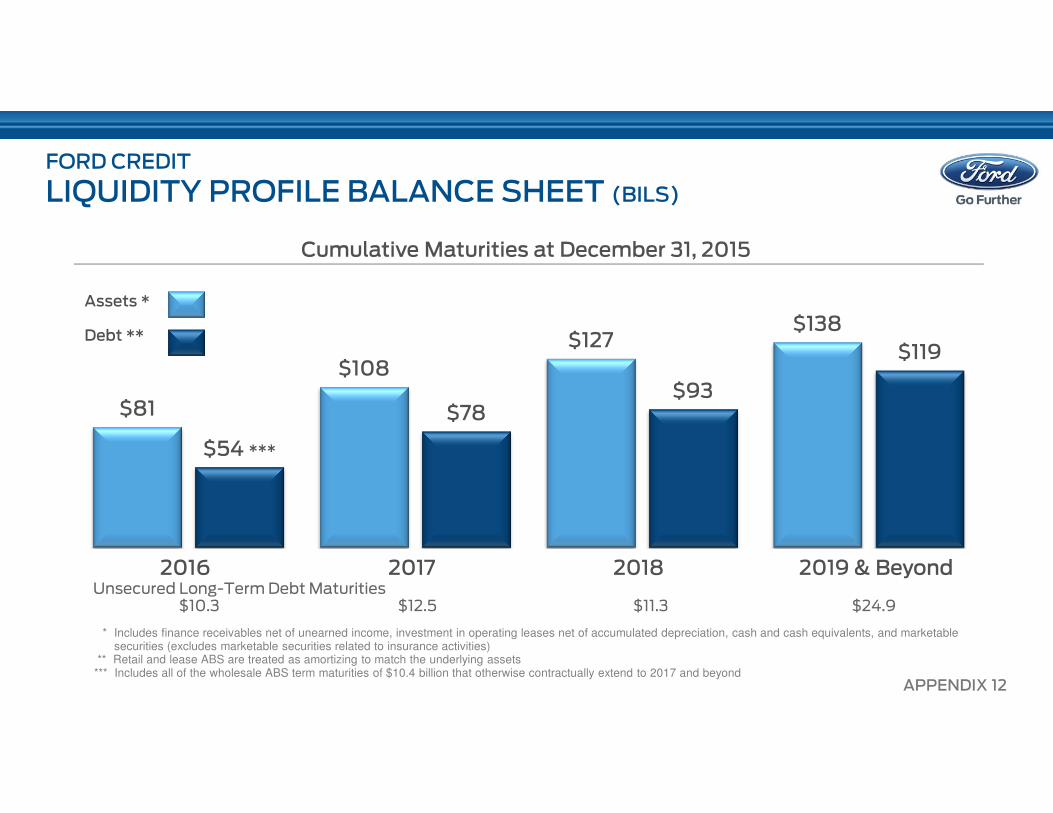
$81
$108
$127 $138
$54 ***
$78 $93
$119
FORD CREDIT
LIQUIDITY PROFILE BALANCE SHEET (BILS)
APPENDIX 12
2016 2017 2018 2019 & Beyond
* Includes finance receivables net of unearned income, investment in operating leases net of accumulated depreciation, cash and cash equivalents, and marketable securities (excludes marketable securities related to insurance activities)
** Retail and lease ABS are treated as amortizing to match the underlying assets*** Includes all of the wholesale ABS term maturities of $10.4 billion that otherwise contractually extend to 2017 and beyond
Cumulative Maturities at December 31, 2015
Assets *
Debt **
$10.3 $12.5 $11.3 $24.9Unsecured Long-Term Debt Maturities
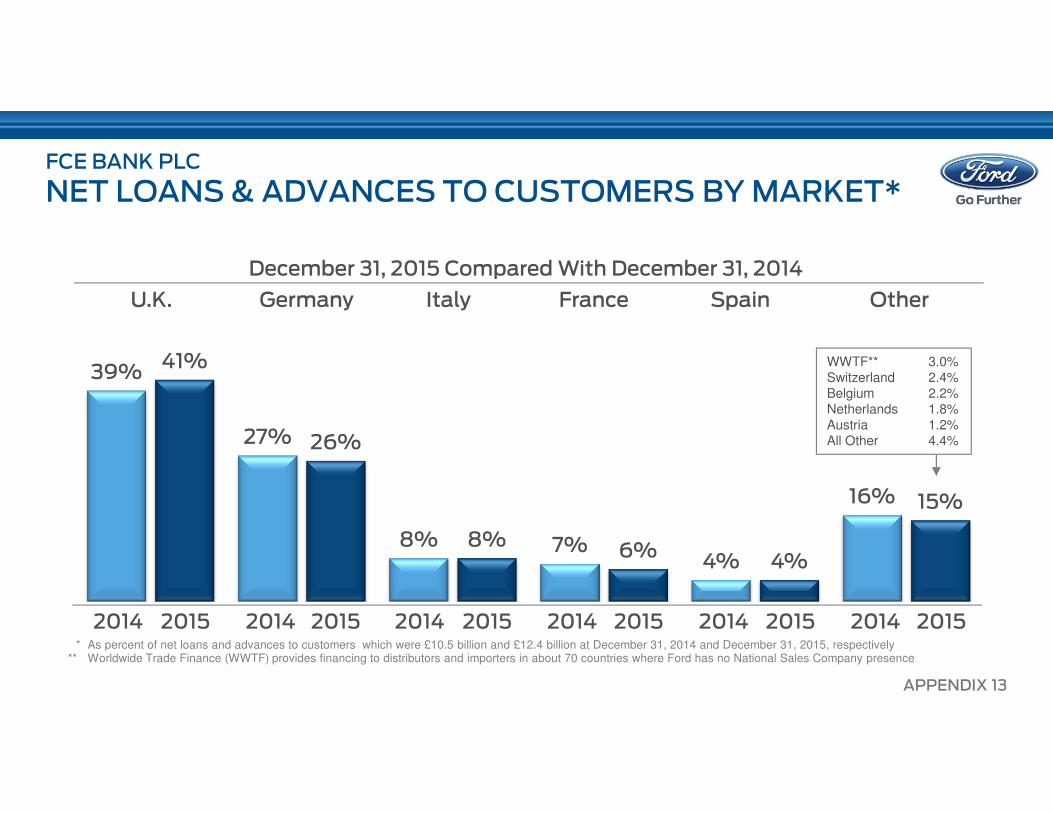
39%
27%
8% 7%4%
16%
41%
26%
8%6%
4%
15%
OtherItaly France SpainGermanyU.K.
20152014 20152014 20152014 20152014 20152014 20152014* As percent of net loans and advances to customers which were £10.5 billion and £12.4 billion at December 31, 2014 and December 31, 2015, respectively
** Worldwide Trade Finance (WWTF) provides financing to distributors and importers in about 70 countries where Ford has no National Sales Company presence
December 31, 2015 Compared With December 31, 2014
FCE BANK PLC
NET LOANS & ADVANCES TO CUSTOMERS BY MARKET*
WWTF** 3.0%Switzerland 2.4%Belgium 2.2%Netherlands 1.8%Austria 1.2%All Other 4.4%
APPENDIX 13
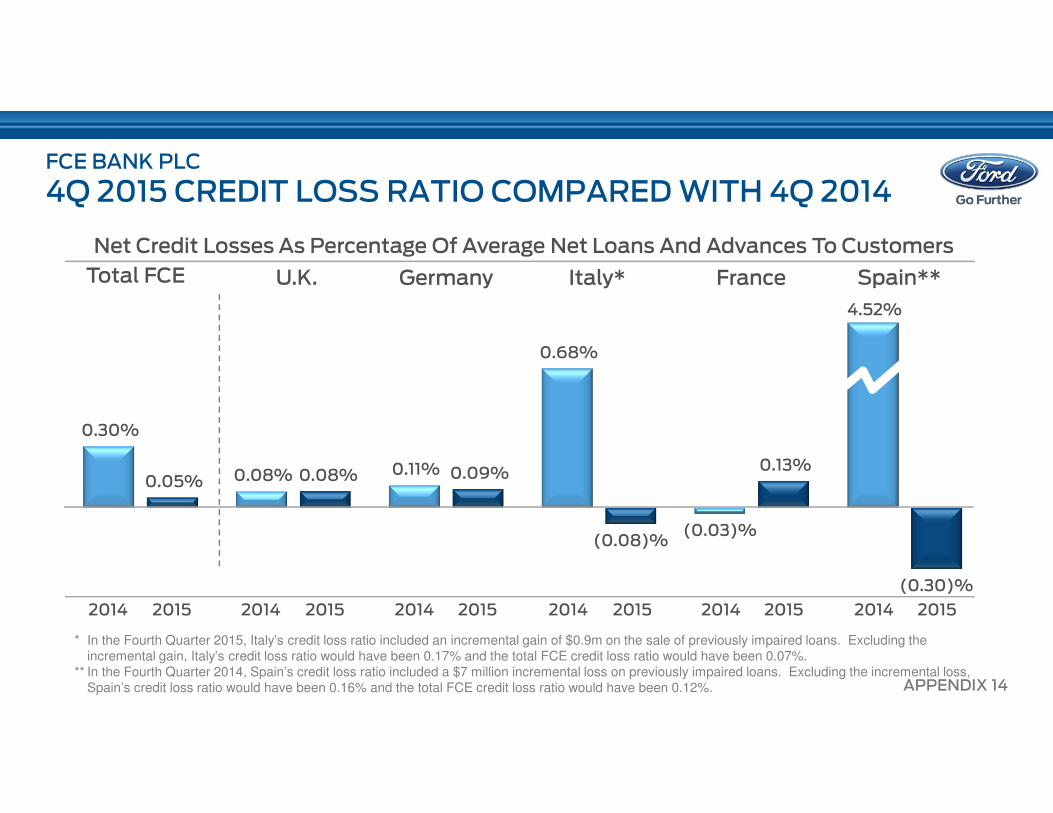
0.30%
0.08% 0.11%
0.68%
(0.03)%
4.52%
0.05% 0.08% 0.09%
(0.08)%
0.13%
(0.30)%
Net Credit Losses As Percentage Of Average Net Loans And Advances To Customers
FCE BANK PLC
4Q 2015 CREDIT LOSS RATIO COMPARED WITH 4Q 2014
Total FCE Italy* France Spain**GermanyU.K.
APPENDIX 14
20152014 20152014 20152014 20152014 20152014 20152014
* In the Fourth Quarter 2015, Italy’s credit loss ratio included an incremental gain of $0.9m on the sale of previously impaired loans. Excluding the incremental gain, Italy’s credit loss ratio would have been 0.17% and the total FCE credit loss ratio would have been 0.07%.
** In the Fourth Quarter 2014, Spain’s credit loss ratio included a $7 million incremental loss on previously impaired loans. Excluding the incremental loss,Spain’s credit loss ratio would have been 0.16% and the total FCE credit loss ratio would have been 0.12%.
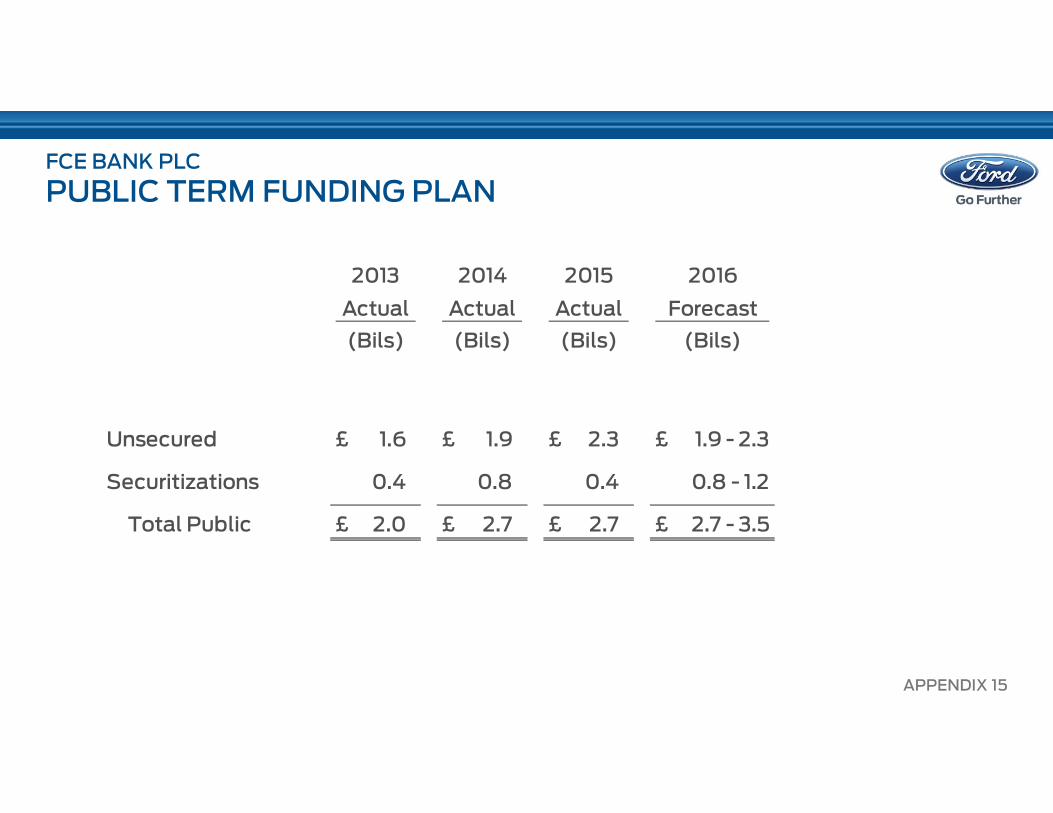
Unsecured £ 1.6 £ 1.9 £ 2.3 £ 1.9 - 2.3
Securitizations 0.4 0.8 0.4 0.8 - 1.2
Total Public £ 2.0 £ 2.7 £ 2.7 £ 2.7 - 3.5
2013
Actual
2016
Forecast
(Bils)(Bils)
2014
Actual
(Bils)
Actual
(Bils)
2015
FCE BANK PLC
PUBLIC TERM FUNDING PLAN
APPENDIX 15


