Page 1
Human Metabolic Phenotypes Diversity and its Association with Diet and Blood
Pressure
Elaine Holmes1*, Ruey Leng Loo1,2*, Jeremiah Stamler3, Magda Bictash1,2, Ivan K. S.
Yap1,2, Queenie Chan2, Tim Ebbels1, Maria De Iorio2, Ian J. Brown2, Kirill A. Veselkov1,
Martha L. Daviglus3, Hugo Kesteloot4, Hirotsugu Ueshima5, Lian Zhao6, Jeremy K.
Nicholson1 and Paul Elliott2
1Biomolecular Medicine, Division of Surgery, Oncology, Reproductive Biology and
Anaesthetics (SORA), Faculty of Medicine, Imperial College London, South Kensington
Campus, London SW7 2AZ, UK 2Department of Epidemiology and Public Health, Imperial College London, St Mary's
Campus, London, W2 1PG, UK 3Department of Preventive Medicine, Feinberg School of Medicine, Northwestern
University, Chicago, IL, 60611, USA 4Department of Public Health, Division of Epidemiology, Akademisch Ziekenhuis St
Rafael, Leuven B-3000, Belgium 5Department of Health Science, Shiga University of Medical Science, Otsu, Shiga 520-
2192, Japan 6 Department of Epidemiology, Fu Wai Hospital and Cardiovascular Institute, Chinese
Academy of Medical Sciences, Beijing 100037, PRC.
*CONTRIBUTED EQUALLY TO THE WORK
Joint corresponding authors:
email: [email protected] and [email protected]
SUPPLEMENTARY INFORMATION
doi: 10.1038/nature06882
www.nature.com/nature 1
Page 2
Supplementary Information INTERMAP exclusion criteria
Of 4,895 individuals initially surveyed, 215 were excluded as follows: 110 persons who
did not attend all 4 study visits, 7 individuals for whom the diet data were considered
unreliable, 37 persons for whom the calorie intake from any 24-hour dietary recall was
less than 500 kcal/d (2,100 kJ/d) or was greater than 5,000 kcal/d (21,000 kJ/d) for
women or greater than 8,000 kcal/d (33,600 kJ/d) for men, 37 individuals for whom 2
complete urine samples were unavailable, and 24 persons with other data that were
incomplete, missing, or indicating a protocol violation. Therefore, 4,680 participants
(2,359 men and 2,321 women) were included in INTERMAP. One urine specimen was
lost and the 1H NMR urinary spectra were unusable from one or both of the first and
second urine specimens for 49 participants, leaving a total of 4,630 available for the
metabonomic study (Supplementary Fig. 1a).
Sample Preparation for NMR spectroscopy
Urine samples were allowed to thaw at room temperature and centrifuged at 3000 rpm
for 5 minutes to remove any debris. An aliquot of urine (500 µL) was mixed with
phosphate buffer solution (250 µL of 0.2 M Na2HPO4/0.2M NaH2PO4, pH 7.4 ± 0.5) in
an Eppendorf to minimise variations in chemical shift values in the acquired 1H NMR
spectra due to pH differences. The resulting solution was left to stand for 10 min. The
buffered urine samples were then centrifuged at 6-8000 rpm for 5 min to remove any
particulates. Supernatant (750 µL) was removed to which sodium 3-trimethylsilyl-(2H4)-
1-propionate (TSP) in D2O (75 µL) (final concentration 0.1 mg/mL) was added. D2O
doi: 10.1038/nature06882 SUPPLEMENTARY INFORMATION
www.nature.com/nature 2
Page 3
provided a deuterium lock signal and TSP the chemical shift reference (δ 0.0). Each
sample (825 µL) was placed into a 96-well plate for analysis and the remaining sample
refrozen. Samples were mixed and the 96-well plate was left to stand for 10 minutes
before centrifuging at 4,000 rpm for 10 minutes thus removing any precipitate from the
solution.
1H NMR spectroscopic analysis of urine samples and spectral quantification of
selected metabolites
Conventional 1H NMR spectra of the urine samples were acquired using a Bruker
(Bruker Biospin, Rheinstetten, Germany) Avance 600 spectrometer operating at 600.29
MHz in flow-injection mode. Samples were automatically delivered to the spectrometer
using a Gilson 215 robot incorporated into the BEST (Bruker Efficient Sample Transfer)
system. The 1D 1H NMR spectra of urine were acquired using a standard one-
dimensional pulse sequence with water pre-saturation (NOSEYPR1D, recycle delay-
90°-t1-90°-tm-90°-acquisition; XWIN-NMR 3.5) during both the recycle delay (2 s) and
mixing time (tm, 150 ms). The 90° pulse length was adjusted to approximately10 µs and
t1 was set to 3 µs, providing an acquisition time of 2.73 s and a total pulse repetition
time of 4.88 s. For each sample, 64 free induction decays (FIDs) were collected into
32K data points using a spectral width of 20 ppm. The FIDs were multiplied by an
exponential weighting function corresponding to a line broadening of 0.3 Hz and data
were zero-filled to 64K data points prior to Fourier Transformation (FT). Four
metabolites (alanine, δ 1.48; formate, δ 8.45; hippurate, δ 7.87 and NMNA, δ 4.44) were
quantified via integration of signals relative to the creatinine CH2 signal (δ 4.06) using
externally standardised values for creatinine measured using the Jaffé reaction1. Mean
doi: 10.1038/nature06882 SUPPLEMENTARY INFORMATION
www.nature.com/nature 3
Page 4
T1 values were measured for each analyte and appropriate relaxation saturation factors
calculated and applied across the whole data set. Integrations were also corrected for
the minor suppression of the creatinine CH2 signal resulting from keto-enol mediated
partial deuteration (measured empirically from standard creatinine measurements in
D20/H20 solutions).
Technical errors and reliability estimates of quantified metabolites
Technical errors for the four quantified metabolites, alanine, formate, hippurate and N-
methylnicotinate, estimated from 8% split specimens, ranged from 11-12% for N-
methylnicotinate to 24-27% for hippurate (Supplementary Table 4). Reliability for mean
of the two 24 h urinary excretion values, estimated as percentage of the theoretical
univariate regression coefficient (Methods), was 78.0% for alanine, 70.2% formate,
67.3% hippurate, 72.0% N-methylnicotinate. Correlation analysis relating NMR and ion
exchange chromatography data for alanine, and NMR and gas chromatography mass
spectrometry data for hippurate, gave Spearmen-rs correlation coefficients of 0.93 and
0.91 respectively (Methods).
Descriptive characteristics of East Asian and western countries
East Asian countries are characterized by low Keys dietary lipid score2, 3, high dietary
salt, low dietary K+ and high dietary Na+/K+ ratio (China particularly); high prevalence of
smoking (for men), low average serum total, non-HDL and LDL cholesterol, high upward
slope of BP with age, high prevalence rates of adverse BP levels in middle and older
age (despite normal average body mass index)4; low CHD and high stroke death rates
doi: 10.1038/nature06882 SUPPLEMENTARY INFORMATION
www.nature.com/nature 4
Page 5
(markedly reduced in Japan in recent decades)5. In contrast, the UK and USA (like
other western countries) have high Keys dietary lipid score, high intakes of total,
saturated and trans fats and cholesterol; high average body mass index, high serum
total, non-HDL and LDL cholesterol; high CHD mortality rates (persisting in the recent
data despite substantial declines) with relatively low stroke death rates5.
Data on serum cholesterol were obtained from the MONICA6 and
INTERLIPID/INTERMAP studies7 (Supplementary Table 5). Data on mortality are
published in Zhou et al.6 and Rosamond et al.8 (Supplementary Table 6). We used the
extensive INTERMAP database to provide data on dietary intakes, 24 h urinary sodium
and potassium excretion, and body mass index for China, Japan, UK and USA
(Supplementary Figs. 8 and 9).
Definitions of multivariate model statistics R2 and Q2 R2 is defined as the proportion of variance in the data explained by the model. Q2 is
defined as the proportion of variance in the data predictable by the model under cross
validation. These quantities are derived in more detail below.
Each O-PLS-DA model regresses a set of X data (NMR spectra) against a response
variable Y (dummy class matrix). For each model, the Residual Error Sum of Squares in
the X space can be calculated as
2ˆ∑ −=i
iiXRESS xx
doi: 10.1038/nature06882 SUPPLEMENTARY INFORMATION
www.nature.com/nature 5
Page 6
where denotes the spectrum predicted by the model for sample i. The proportion of
explained variance in the X space, R2, is then calculated as
ˆ x i
RX2 =1−
RESSX
SSX
where SSX is the total sum of squares of the centred X data, 2∑ −=i
iXSS xx . An
analogous quantity can be calculated for the response Y RY2
2ˆ∑ −=i
iiY yyRESS , Y
YY SS
RESSR −= 12 .
When cross-validation is used to estimate the predictive quality of the model, each
spectrum or response may be predicted from the model built when it is left out, denoted
by x~ and y~ . Similar quantities as above may be calculated to estimate proportion of
variance predictable in cross-validation, Q2, based on the Predicted Residual Error Sum
of Squares (PRESS)
2~∑ −=i
iiXPRESS xx , X
XX SS
PRESSQ −= 12 ,
and
2~∑ −=i
iiY yyPRESS , Y
YY SS
PRESSQ −= 12 .
Q2 is therefore a measure of the robustness of a model to sub-sampling of the data and
was used to choose the number of components for each model. For further information
see Eriksson et al.8
doi: 10.1038/nature06882 SUPPLEMENTARY INFORMATION
www.nature.com/nature 6
Page 7
References 1. Jaffé, M. Über den Niederschlag welchen Pikrinsaure in normalen Harn erzeugt und
über eine neue Reaction des Kreatinins. Z. Physiol. Chem. 10,391-400 (1886).
2. Keys, A. & Parlin, R.W. Serum cholesterol response to changes in dietary lipids. Am.
J. Clin. Nutr. 19, 175-81 (1966).
3. Stamler, J.S. Population studies. In: Levy, R.I., Rifkind, B.M., Dennis, B.H., Ernst,
N.D., eds. Nutrition, lipids, and coronary heart diseases. New York, NY: Raven
Press, 25-88 (1979).
4. Intersalt Co-operative Research Group. Intersalt: an international study of electrolyte
excretion and blood pressure. Results for 24 hour urinary sodium and potassium
excretion. Br. Med. J. 297, 319-28 (1988).
5. Levi, F., Lucchini, F., Negri, E. & La Vecchia, C. Trends in mortality from
cardiovascular and cerebrovascular diseases in Europe and other areas of the
world. Heart 88, 119-124 (2002).
6. Zhou, B. F. et al. Nutrient intakes of middle-aged men and women in China, Japan,
United Kingdom, and United States in the late 1990s: The INTERMAP Study. J.
Hum. Hypertens. 17, 623-630 (2003).
7. Okuda, N. et al. Relation of long chain n-3 polyunsaturated fatty acid intake to serum
high density lipoprotein cholesterol among Japanese men in Japan and Japanese-
American men in Hawaii: The INTERLIPID Study. Atherosclerosis. 178, 371-379
(2005).
8. Rosamond, W. et al. Heart disease and stroke statistics – 2007 update: A report
from the American Heart Association Statistics Committee and Stroke Statistics
Subcommittee. Circulation 115, e69-e171 (2007).
doi: 10.1038/nature06882 SUPPLEMENTARY INFORMATION
www.nature.com/nature 7
Page 8
9. Eriksson, L., Johansson, E., Kettaneh-Wold, N. and Wold, S. (2001) Multi- and
Megavariate Data Analysis. Umetrics AB, Umea, Sweden.
doi: 10.1038/nature06882 SUPPLEMENTARY INFORMATION
www.nature.com/nature 8
Page 9
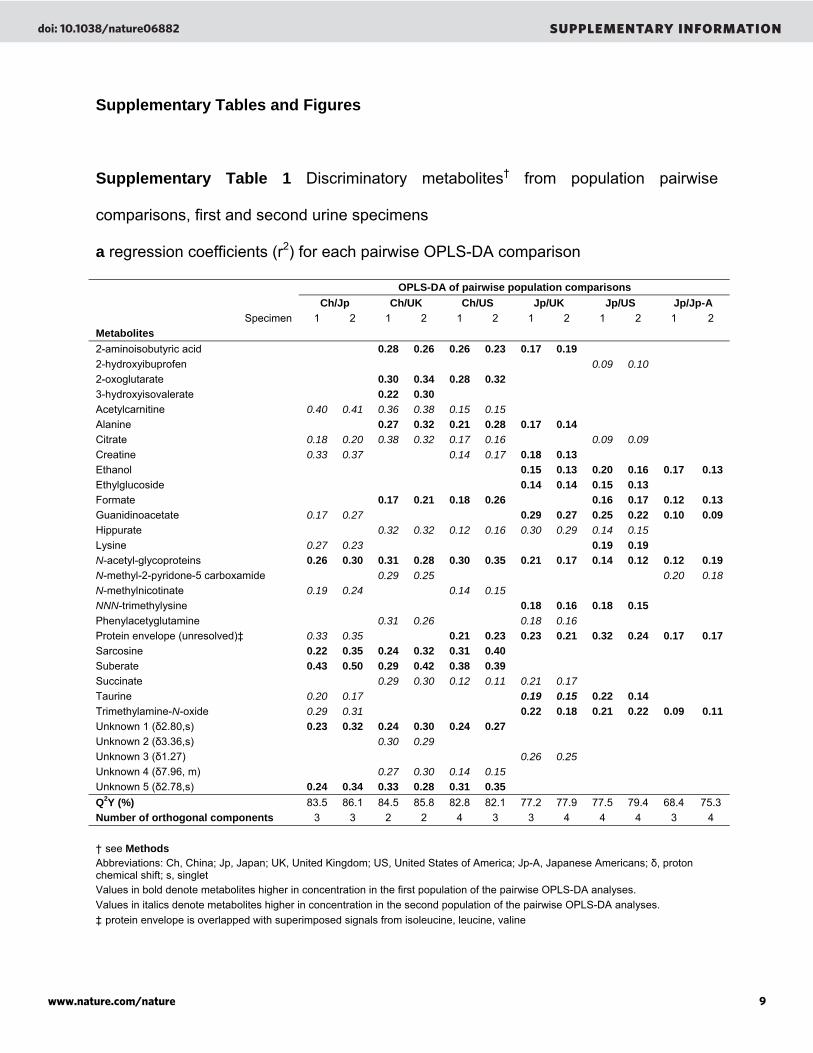
Supplementary Tables and Figures
Supplementary Table 1 Discriminatory metabolites† from population pairwise
comparisons, first and second urine specimens
a regression coefficients (r2) for each pairwise OPLS-DA comparison
OPLS-DA of pairwise population comparisons Ch/Jp Ch/UK Ch/US Jp/UK Jp/US Jp/Jp-A
Specimen 1 2 1 2 1 2 1 2 1 2 1 2 Metabolites 2-aminoisobutyric acid 0.28 0.26 0.26 0.23 0.17 0.19 2-hydroxyibuprofen 0.09 0.10 2-oxoglutarate 0.30 0.34 0.28 0.32 3-hydroxyisovalerate 0.22 0.30 Acetylcarnitine 0.40 0.41 0.36 0.38 0.15 0.15 Alanine 0.27 0.32 0.21 0.28 0.17 0.14 Citrate 0.18 0.20 0.38 0.32 0.17 0.16 0.09 0.09 Creatine 0.33 0.37 0.14 0.17 0.18 0.13 Ethanol 0.15 0.13 0.20 0.16 0.17 0.13 Ethylglucoside 0.14 0.14 0.15 0.13 Formate 0.17 0.21 0.18 0.26 0.16 0.17 0.12 0.13 Guanidinoacetate 0.17 0.27 0.29 0.27 0.25 0.22 0.10 0.09 Hippurate 0.32 0.32 0.12 0.16 0.30 0.29 0.14 0.15 Lysine 0.27 0.23 0.19 0.19 N-acetyl-glycoproteins 0.26 0.30 0.31 0.28 0.30 0.35 0.21 0.17 0.14 0.12 0.12 0.19 N-methyl-2-pyridone-5 carboxamide 0.29 0.25 0.20 0.18 N-methylnicotinate 0.19 0.24 0.14 0.15 NNN-trimethylysine 0.18 0.16 0.18 0.15 Phenylacetyglutamine 0.31 0.26 0.18 0.16 Protein envelope (unresolved)‡ 0.33 0.35 0.21 0.23 0.23 0.21 0.32 0.24 0.17 0.17 Sarcosine 0.22 0.35 0.24 0.32 0.31 0.40 Suberate 0.43 0.50 0.29 0.42 0.38 0.39 Succinate 0.29 0.30 0.12 0.11 0.21 0.17 Taurine 0.20 0.17 0.19 0.15 0.22 0.14 Trimethylamine-N-oxide 0.29 0.31 0.22 0.18 0.21 0.22 0.09 0.11 Unknown 1 (δ2.80,s) 0.23 0.32 0.24 0.30 0.24 0.27 Unknown 2 (δ3.36,s) 0.30 0.29 Unknown 3 (δ1.27) 0.26 0.25 Unknown 4 (δ7.96, m) 0.27 0.30 0.14 0.15 Unknown 5 (δ2.78,s) 0.24 0.34 0.33 0.28 0.31 0.35 Q2Y (%) 83.5 86.1 84.5 85.8 82.8 82.1 77.2 77.9 77.5 79.4 68.4 75.3 Number of orthogonal components 3 3 2 2 4 3 3 4 4 4 3 4 † see Methods Abbreviations: Ch, China; Jp, Japan; UK, United Kingdom; US, United States of America; Jp-A, Japanese Americans; δ, proton chemical shift; s, singlet Values in bold denote metabolites higher in concentration in the first population of the pairwise OPLS-DA analyses. Values in italics denote metabolites higher in concentration in the second population of the pairwise OPLS-DA analyses. ‡ protein envelope is overlapped with superimposed signals from isoleucine, leucine, valine
doi: 10.1038/nature06882 SUPPLEMENTARY INFORMATION
www.nature.com/nature 9
Page 10
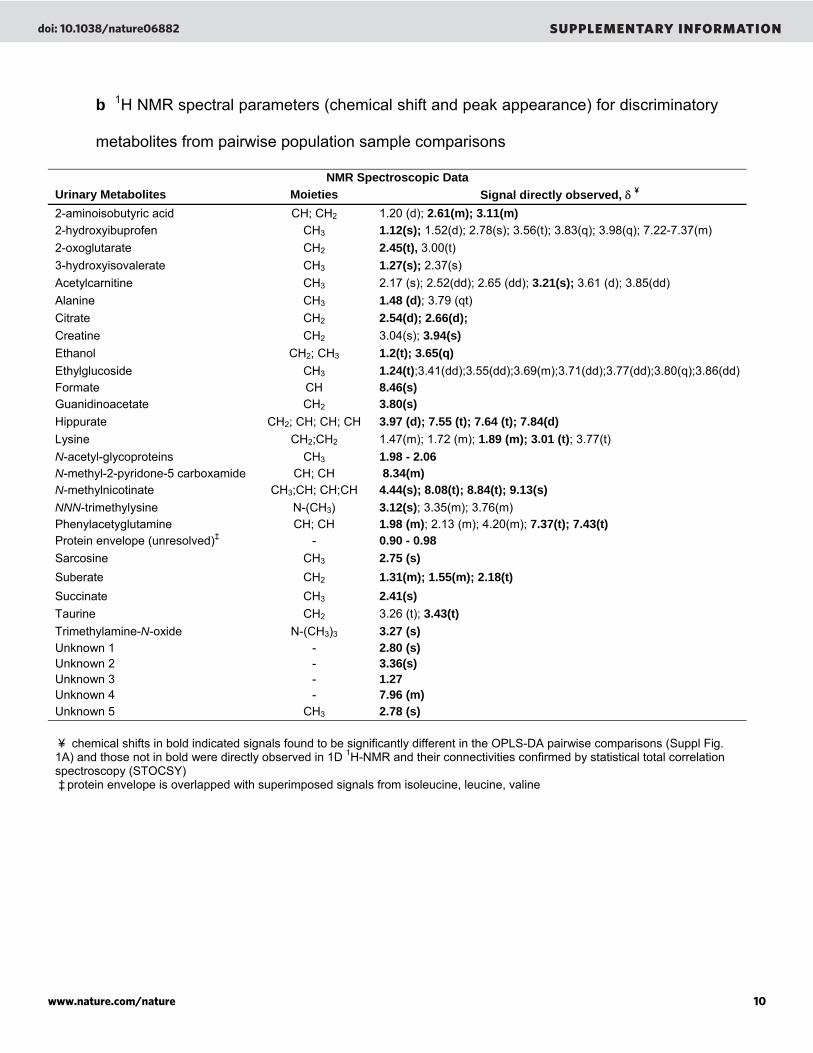
b 1H NMR spectral parameters (chemical shift and peak appearance) for discriminatory
metabolites from pairwise population sample comparisons
NMR Spectroscopic Data Urinary Metabolites Moieties Signal directly observed, δ ¥ 2-aminoisobutyric acid CH; CH2 1.20 (d); 2.61(m); 3.11(m) 2-hydroxyibuprofen CH3 1.12(s); 1.52(d); 2.78(s); 3.56(t); 3.83(q); 3.98(q); 7.22-7.37(m) 2-oxoglutarate CH2 2.45(t), 3.00(t) 3-hydroxyisovalerate CH3 1.27(s); 2.37(s) Acetylcarnitine CH3 2.17 (s); 2.52(dd); 2.65 (dd); 3.21(s); 3.61 (d); 3.85(dd) Alanine CH3 1.48 (d); 3.79 (qt) Citrate CH2 2.54(d); 2.66(d); Creatine CH2 3.04(s); 3.94(s) Ethanol CH2; CH3 1.2(t); 3.65(q) Ethylglucoside CH3 1.24(t);3.41(dd);3.55(dd);3.69(m);3.71(dd);3.77(dd);3.80(q);3.86(dd) Formate CH 8.46(s) Guanidinoacetate CH2 3.80(s) Hippurate CH2; CH; CH; CH 3.97 (d); 7.55 (t); 7.64 (t); 7.84(d) Lysine CH2;CH2 1.47(m); 1.72 (m); 1.89 (m); 3.01 (t); 3.77(t) N-acetyl-glycoproteins CH3 1.98 - 2.06 N-methyl-2-pyridone-5 carboxamide CH; CH 8.34(m) N-methylnicotinate CH3;CH; CH;CH 4.44(s); 8.08(t); 8.84(t); 9.13(s) NNN-trimethylysine N-(CH3) 3.12(s); 3.35(m); 3.76(m) Phenylacetyglutamine CH; CH 1.98 (m); 2.13 (m); 4.20(m); 7.37(t); 7.43(t) Protein envelope (unresolved)‡ - 0.90 - 0.98 Sarcosine CH3 2.75 (s) Suberate CH2 1.31(m); 1.55(m); 2.18(t) Succinate CH3 2.41(s) Taurine CH2 3.26 (t); 3.43(t) Trimethylamine-N-oxide N-(CH3)3 3.27 (s) Unknown 1 - 2.80 (s) Unknown 2 - 3.36(s) Unknown 3 - 1.27 Unknown 4 - 7.96 (m) Unknown 5 CH3 2.78 (s) ¥ chemical shifts in bold indicated signals found to be significantly different in the OPLS-DA pairwise comparisons (Suppl Fig. 1A) and those not in bold were directly observed in 1D 1H-NMR and their connectivities confirmed by statistical total correlation spectroscopy (STOCSY) ‡ protein envelope is overlapped with superimposed signals from isoleucine, leucine, valine
doi: 10.1038/nature06882 SUPPLEMENTARY INFORMATION
www.nature.com/nature 10
Page 11
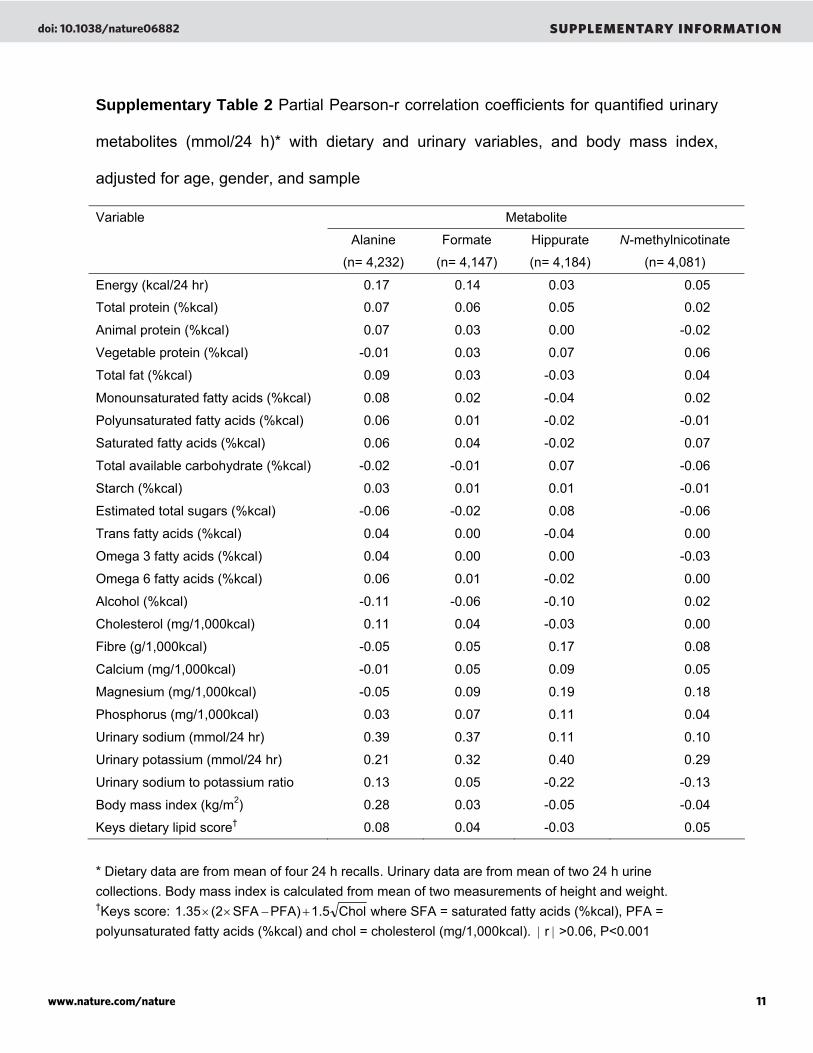
Supplementary Table 2 Partial Pearson-r correlation coefficients for quantified urinary
metabolites (mmol/24 h)* with dietary and urinary variables, and body mass index,
adjusted for age, gender, and sample
Variable Metabolite
Alanine Formate Hippurate N-methylnicotinate
(n= 4,232) (n= 4,147) (n= 4,184) (n= 4,081)
Energy (kcal/24 hr) 0.17 0.14 0.03 0.05
Total protein (%kcal) 0.07 0.06 0.05 0.02
Animal protein (%kcal) 0.07 0.03 0.00 -0.02
Vegetable protein (%kcal) -0.01 0.03 0.07 0.06
Total fat (%kcal) 0.09 0.03 -0.03 0.04
Monounsaturated fatty acids (%kcal) 0.08 0.02 -0.04 0.02
Polyunsaturated fatty acids (%kcal) 0.06 0.01 -0.02 -0.01
Saturated fatty acids (%kcal) 0.06 0.04 -0.02 0.07
Total available carbohydrate (%kcal) -0.02 -0.01 0.07 -0.06
Starch (%kcal) 0.03 0.01 0.01 -0.01
Estimated total sugars (%kcal) -0.06 -0.02 0.08 -0.06
Trans fatty acids (%kcal) 0.04 0.00 -0.04 0.00
Omega 3 fatty acids (%kcal) 0.04 0.00 0.00 -0.03
Omega 6 fatty acids (%kcal) 0.06 0.01 -0.02 0.00
Alcohol (%kcal) -0.11 -0.06 -0.10 0.02
Cholesterol (mg/1,000kcal) 0.11 0.04 -0.03 0.00
Fibre (g/1,000kcal) -0.05 0.05 0.17 0.08
Calcium (mg/1,000kcal) -0.01 0.05 0.09 0.05
Magnesium (mg/1,000kcal) -0.05 0.09 0.19 0.18
Phosphorus (mg/1,000kcal) 0.03 0.07 0.11 0.04
Urinary sodium (mmol/24 hr) 0.39 0.37 0.11 0.10
Urinary potassium (mmol/24 hr) 0.21 0.32 0.40 0.29
Urinary sodium to potassium ratio 0.13 0.05 -0.22 -0.13
Body mass index (kg/m2) 0.28 0.03 -0.05 -0.04
Keys dietary lipid score† 0.08 0.04 -0.03 0.05
* Dietary data are from mean of four 24 h recalls. Urinary data are from mean of two 24 h urine collections. Body mass index is calculated from mean of two measurements of height and weight. †Keys score: Chol1.5PFA)SFA(21.35 +−×× where SFA = saturated fatty acids (%kcal), PFA = polyunsaturated fatty acids (%kcal) and chol = cholesterol (mg/1,000kcal). | r | >0.06, P<0.001
doi: 10.1038/nature06882 SUPPLEMENTARY INFORMATION
www.nature.com/nature 11
Page 12
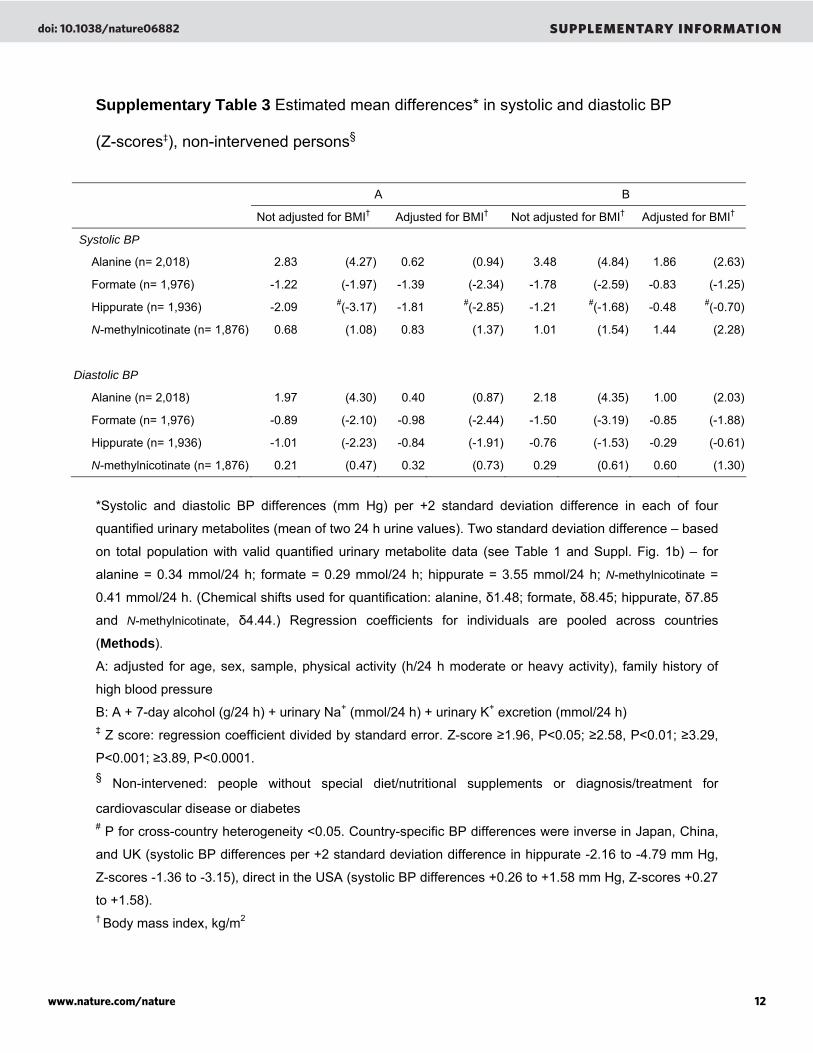
Supplementary Table 3 Estimated mean differences* in systolic and diastolic BP
(Z-scores‡), non-intervened persons§
A B
Not adjusted for BMI† Adjusted for BMI† Not adjusted for BMI† Adjusted for BMI†
Systolic BP
Alanine (n= 2,018) 2.83 (4.27) 0.62 (0.94) 3.48 (4.84) 1.86 (2.63)
Formate (n= 1,976) -1.22 (-1.97) -1.39 (-2.34) -1.78 (-2.59) -0.83 (-1.25)
Hippurate (n= 1,936) -2.09 #(-3.17) -1.81 #(-2.85) -1.21 #(-1.68) -0.48 #(-0.70)
N-methylnicotinate (n= 1,876) 0.68 (1.08) 0.83 (1.37) 1.01 (1.54) 1.44 (2.28)
Diastolic BP
Alanine (n= 2,018) 1.97 (4.30) 0.40 (0.87) 2.18 (4.35) 1.00 (2.03)
Formate (n= 1,976) -0.89 (-2.10) -0.98 (-2.44) -1.50 (-3.19) -0.85 (-1.88)
Hippurate (n= 1,936) -1.01 (-2.23) -0.84 (-1.91) -0.76 (-1.53) -0.29 (-0.61)
N-methylnicotinate (n= 1,876) 0.21 (0.47) 0.32 (0.73) 0.29 (0.61) 0.60 (1.30)
*Systolic and diastolic BP differences (mm Hg) per +2 standard deviation difference in each of four
quantified urinary metabolites (mean of two 24 h urine values). Two standard deviation difference – based
on total population with valid quantified urinary metabolite data (see Table 1 and Suppl. Fig. 1b) – for
alanine = 0.34 mmol/24 h; formate = 0.29 mmol/24 h; hippurate = 3.55 mmol/24 h; N-methylnicotinate =
0.41 mmol/24 h. (Chemical shifts used for quantification: alanine, δ1.48; formate, δ8.45; hippurate, δ7.85
and N-methylnicotinate, δ4.44.) Regression coefficients for individuals are pooled across countries
(Methods).
A: adjusted for age, sex, sample, physical activity (h/24 h moderate or heavy activity), family history of
high blood pressure
B: A + 7-day alcohol (g/24 h) + urinary Na+ (mmol/24 h) + urinary K+ excretion (mmol/24 h) ‡ Z score: regression coefficient divided by standard error. Z-score ≥1.96, P<0.05; ≥2.58, P<0.01; ≥3.29,
P<0.001; ≥3.89, P<0.0001. § Non-intervened: people without special diet/nutritional supplements or diagnosis/treatment for
cardiovascular disease or diabetes # P for cross-country heterogeneity <0.05. Country-specific BP differences were inverse in Japan, China,
and UK (systolic BP differences per +2 standard deviation difference in hippurate -2.16 to -4.79 mm Hg,
Z-scores -1.36 to -3.15), direct in the USA (systolic BP differences +0.26 to +1.58 mm Hg, Z-scores +0.27
to +1.58). † Body mass index, kg/m2
doi: 10.1038/nature06882 SUPPLEMENTARY INFORMATION
www.nature.com/nature 12
Page 13
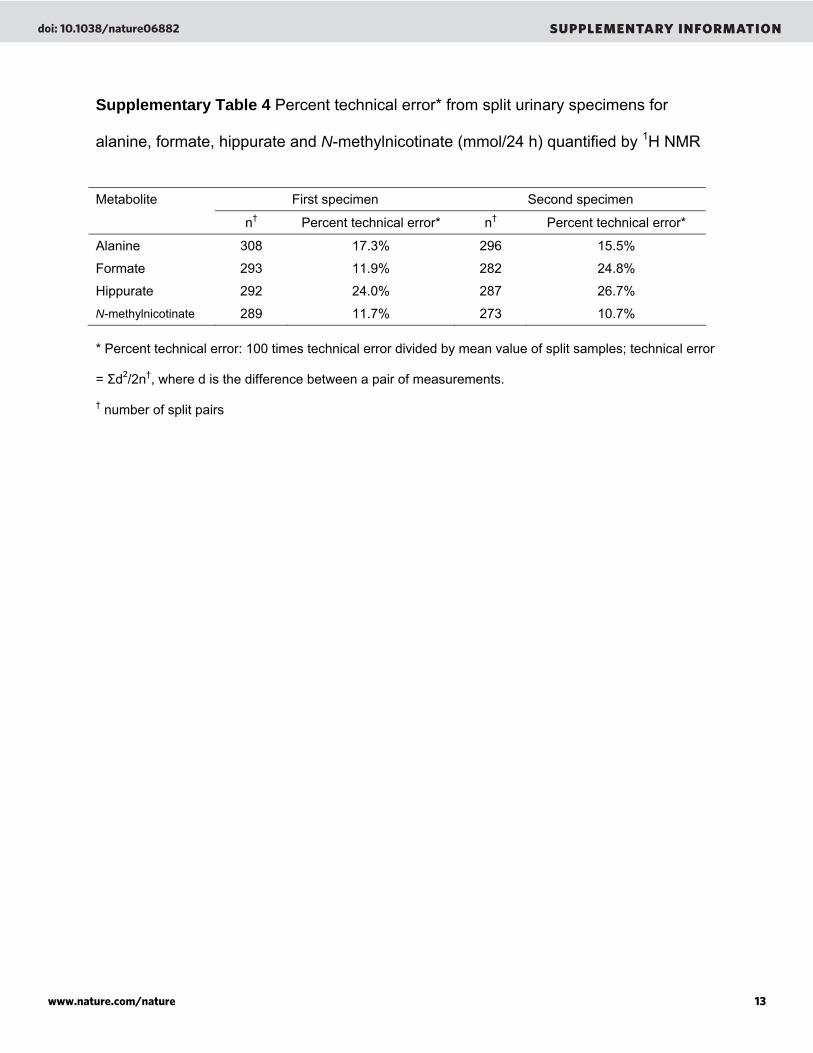
Supplementary Table 4 Percent technical error* from split urinary specimens for
alanine, formate, hippurate and N-methylnicotinate (mmol/24 h) quantified by 1H NMR
Metabolite First specimen Second specimen
n† Percent technical error* n† Percent technical error*
Alanine 308 17.3% 296 15.5%
Formate 293 11.9% 282 24.8%
Hippurate 292 24.0% 287 26.7%
N-methylnicotinate 289 11.7% 273 10.7% * Percent technical error: 100 times technical error divided by mean value of split samples; technical error
= Σd2/2n†, where d is the difference between a pair of measurements.
† number of split pairs
doi: 10.1038/nature06882 SUPPLEMENTARY INFORMATION
www.nature.com/nature 13
Page 14
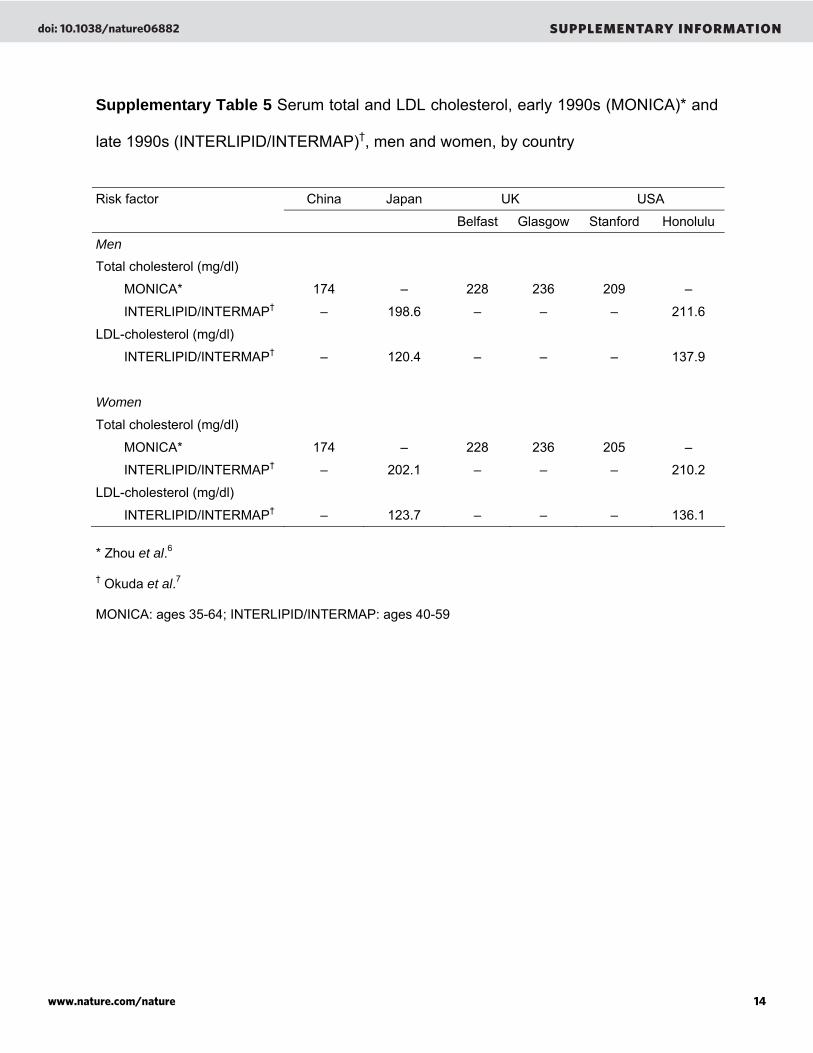
Supplementary Table 5 Serum total and LDL cholesterol, early 1990s (MONICA)* and
late 1990s (INTERLIPID/INTERMAP)†, men and women, by country
Risk factor China Japan UK USA
Belfast Glasgow Stanford Honolulu
Men
Total cholesterol (mg/dl)
MONICA* 174 – 228 236 209 –
INTERLIPID/INTERMAP† – 198.6 – – – 211.6
LDL-cholesterol (mg/dl)
INTERLIPID/INTERMAP† – 120.4 – – – 137.9
Women
Total cholesterol (mg/dl)
MONICA* 174 – 228 236 205 –
INTERLIPID/INTERMAP† – 202.1 – – – 210.2
LDL-cholesterol (mg/dl)
INTERLIPID/INTERMAP† – 123.7 – – – 136.1 * Zhou et al.6
† Okuda et al.7
MONICA: ages 35-64; INTERLIPID/INTERMAP: ages 40-59
doi: 10.1038/nature06882 SUPPLEMENTARY INFORMATION
www.nature.com/nature 14
Page 15
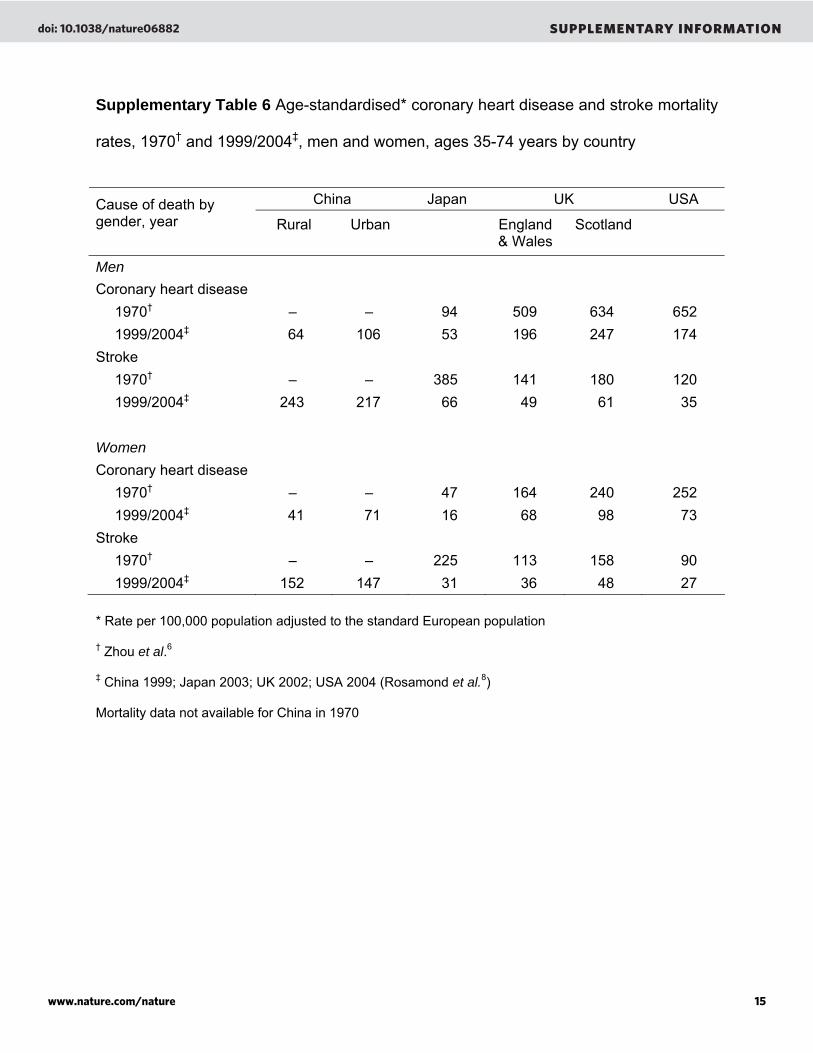
Supplementary Table 6 Age-standardised* coronary heart disease and stroke mortality
rates, 1970† and 1999/2004‡, men and women, ages 35-74 years by country
China Japan UK USA Cause of death by
gender, year
Rural
Urban England
& Wales Scotland
Men Coronary heart disease 1970† – – 94 509 634 652 1999/2004‡ 64 106 53 196 247 174 Stroke 1970† – – 385 141 180 120 1999/2004‡ 243 217 66 49 61 35 Women Coronary heart disease 1970† – – 47 164 240 252 1999/2004‡ 41 71 16 68 98 73 Stroke 1970† – – 225 113 158 90 1999/2004‡ 152 147 31 36 48 27 * Rate per 100,000 population adjusted to the standard European population
† Zhou et al.6
‡ China 1999; Japan 2003; UK 2002; USA 2004 (Rosamond et al.8)
Mortality data not available for China in 1970
doi: 10.1038/nature06882 SUPPLEMENTARY INFORMATION
www.nature.com/nature 15
Page 16
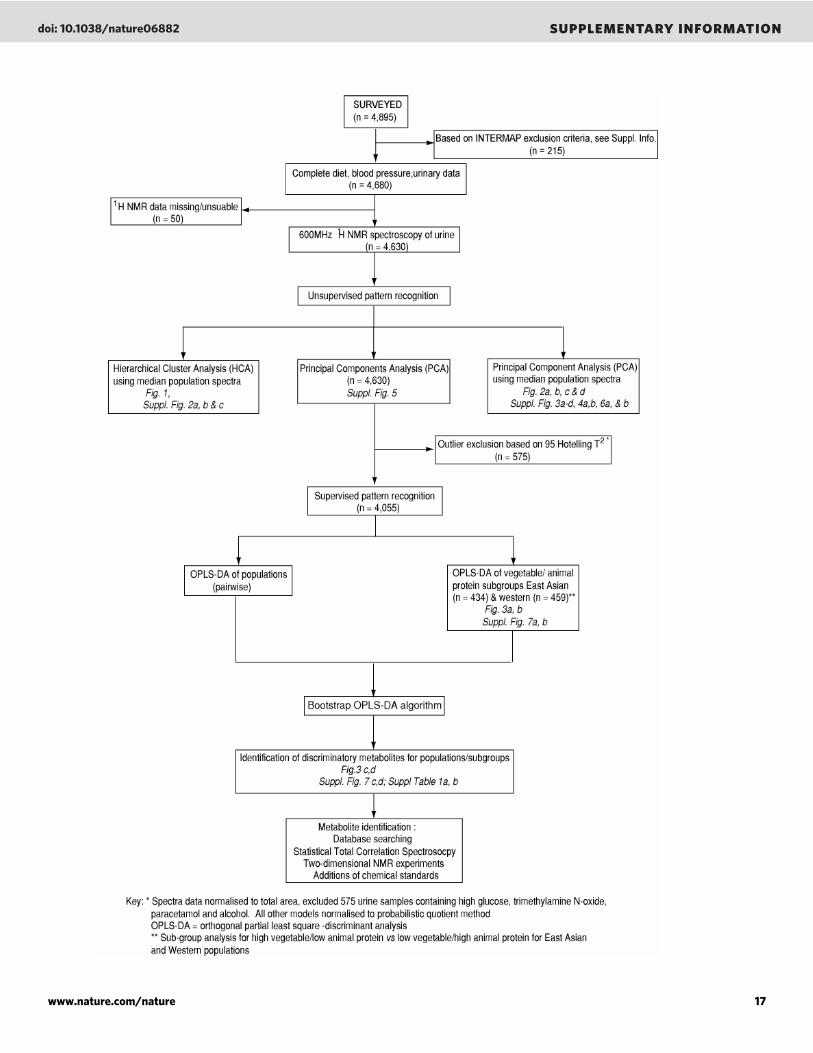
Supplementary Figure 1 Schematic of data analyses
a Participant numbers, exclusions, pattern recognition techniques and identification of
discriminatory metabolites
doi: 10.1038/nature06882 SUPPLEMENTARY INFORMATION
www.nature.com/nature 16
Page 17
doi: 10.1038/nature06882 SUPPLEMENTARY INFORMATION
www.nature.com/nature 17
Page 18
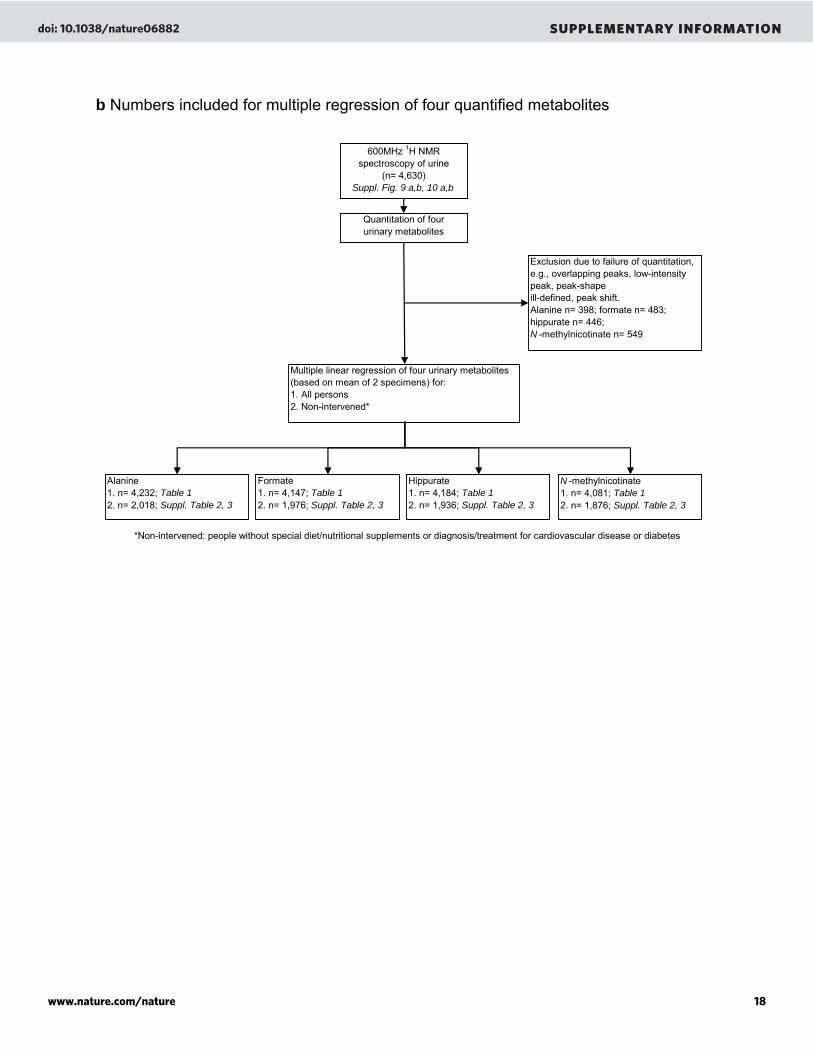
b Numbers included for multiple regression of four quantified metabolites
*Non-intervened: people without special diet/nutritional supplements or diagnosis/treatment for cardiovascular disease or diabetes
Quantitation of four urinary metabolites
Alanine1. n= 4,232; Table 12. n= 2,018; Suppl. Table 2, 3
600MHz 1H NMR spectroscopy of urine
(n= 4,630)Suppl. Fig. 9 a,b, 10 a,b
Exclusion due to failure of quantitation, e.g., overlapping peaks, low-intensity peak, peak-shape ill-defined, peak shift.Alanine n= 398; formate n= 483;hippurate n= 446; N -methylnicotinate n= 549
Formate1. n= 4,147; Table 12. n= 1,976; Suppl. Table 2, 3
Hippurate1. n= 4,184; Table 12. n= 1,936; Suppl. Table 2, 3
N -methylnicotinate1. n= 4,081; Table 12. n= 1,876; Suppl. Table 2, 3
Multiple linear regression of four urinary metabolites (based on mean of 2 specimens) for:1. All persons2. Non-intervened*
doi: 10.1038/nature06882 SUPPLEMENTARY INFORMATION
www.nature.com/nature 18
Page 19
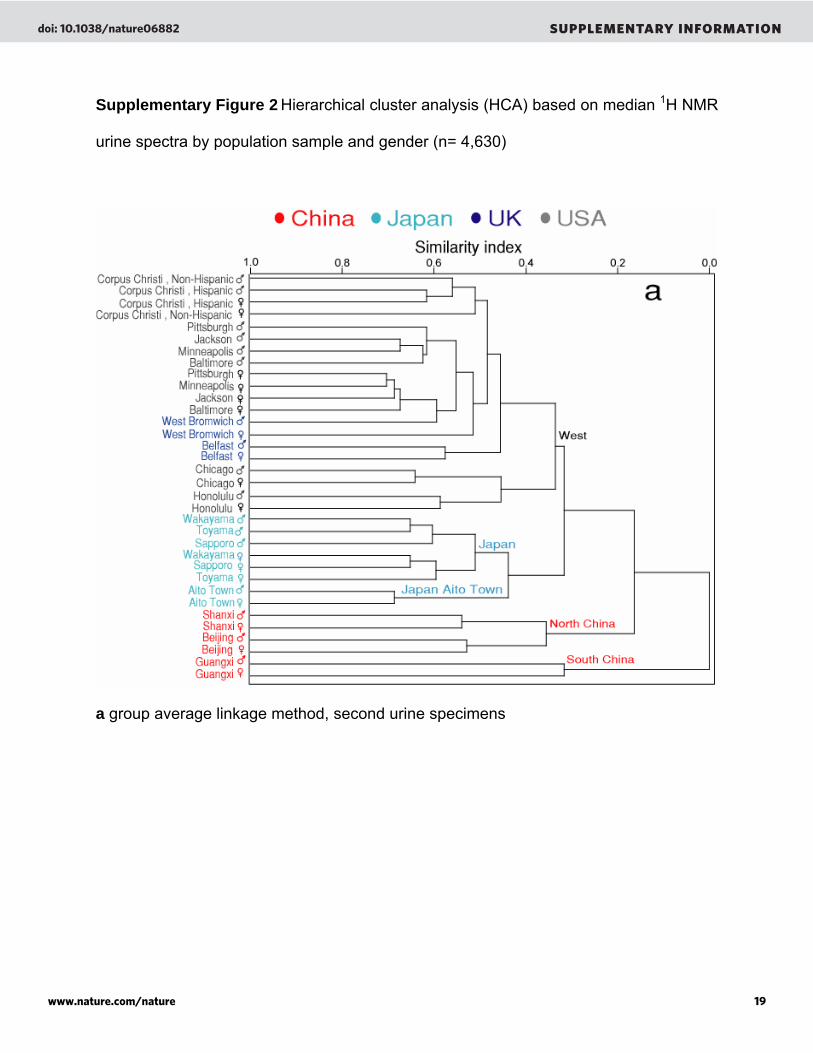
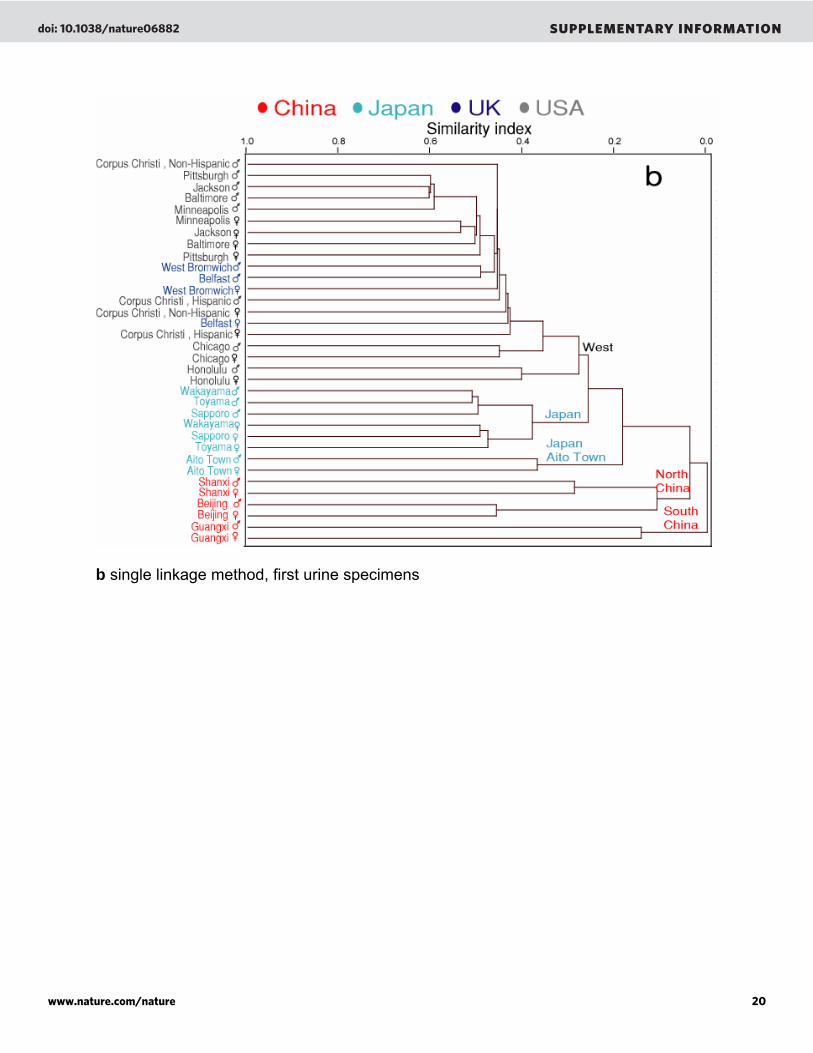
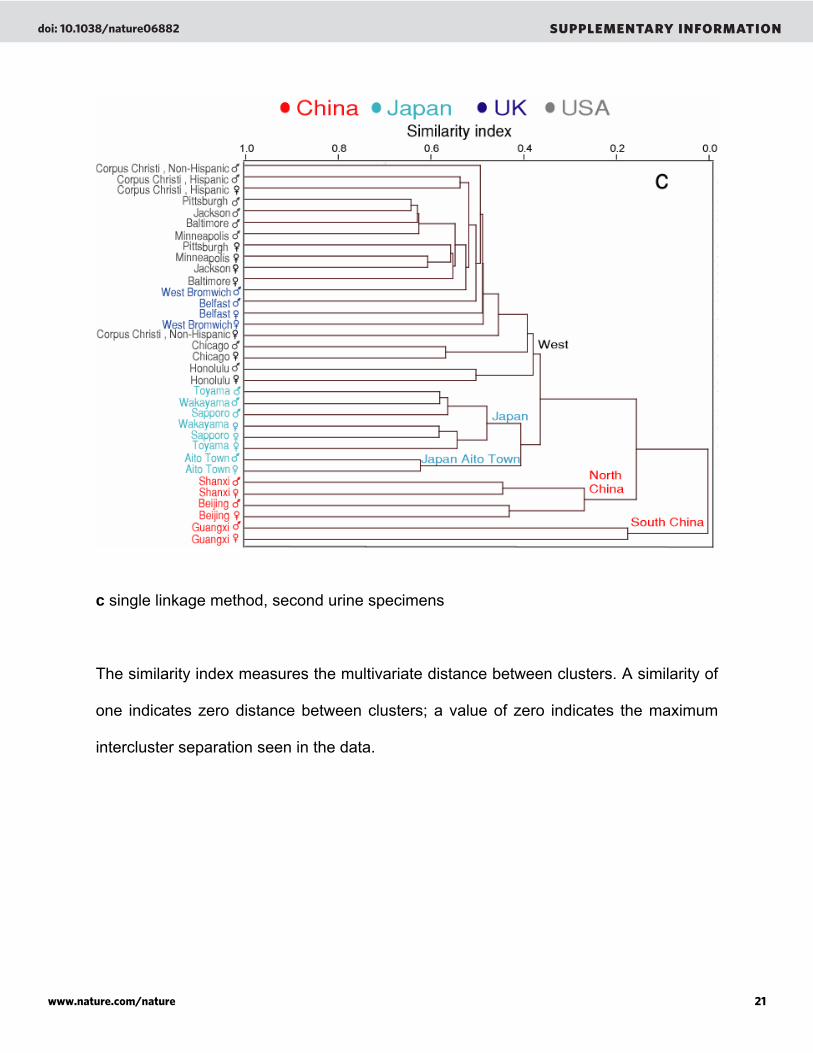
Supplementary Figure 2 Hierarchical cluster analysis (HCA) based on median 1H NMR
urine spectra by population sample and gender (n= 4,630)
a group average linkage method, second urine specimens
doi: 10.1038/nature06882 SUPPLEMENTARY INFORMATION
www.nature.com/nature 19
Page 20
b single linkage method, first urine specimens
doi: 10.1038/nature06882 SUPPLEMENTARY INFORMATION
www.nature.com/nature 20
Page 21
c single linkage method, second urine specimens
The similarity index measures the multivariate distance between clusters. A similarity of
one indicates zero distance between clusters; a value of zero indicates the maximum
intercluster separation seen in the data.
doi: 10.1038/nature06882 SUPPLEMENTARY INFORMATION
www.nature.com/nature 21
Page 22
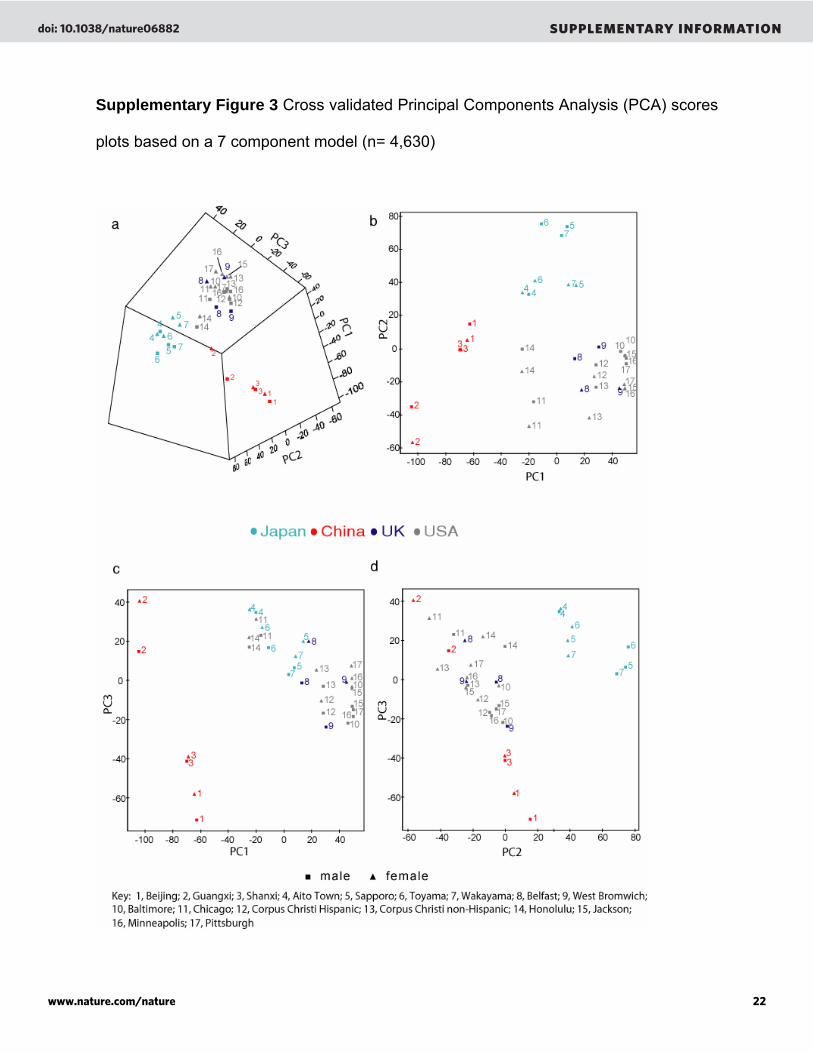
Supplementary Figure 3 Cross validated Principal Components Analysis (PCA) scores
plots based on a 7 component model (n= 4,630)
doi: 10.1038/nature06882 SUPPLEMENTARY INFORMATION
www.nature.com/nature 22
Page 23
a 3-dimensional plot for Principal Components (PC) 1-3; b PC2 vs PC1; c PC3 vs PC1;
d PC3 vs PC2
Median 1H NMR spectra of the second 24 h urine specimen stratified by country and by
gender; female ( ) and male ( ), R2X= 74.9% (percent variation in the NMR data
explained by the model); Q2X= 52.1% (percent variation in the NMR data predictable by
the model from cross validation). Data for the first three components available in an
Excel file in Supplementary Information.
doi: 10.1038/nature06882 SUPPLEMENTARY INFORMATION
www.nature.com/nature 23
Page 24
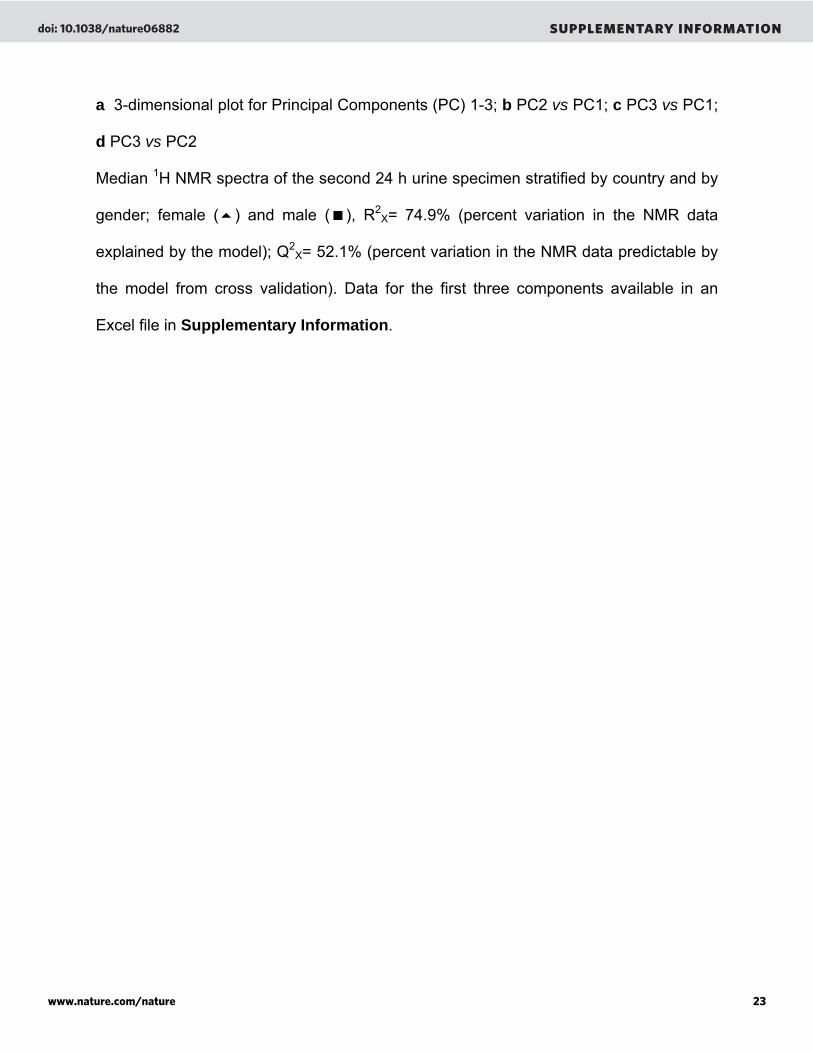
Supplementary Figure 4 Cross validated Principal Components Analysis (PCA) scores
plots based on median 1H NMR urine spectra stratified by country
doi: 10.1038/nature06882 SUPPLEMENTARY INFORMATION
www.nature.com/nature 24
Page 25
a first ( ) and second ( )24 h urine specimens (n= 4,630). R2X= 82.4% (percent
variation in the NMR data explained by the model); Q2X= 63.1% (percent variation in the
NMR data predictable by the model from cross validation), based on an 8 component
model. b first ( ) and second ( ) 24 h urine specimens (R2X= 70.2%, Q2
X= 48.8%,
based on a 6 component model), for normal weight†, non-diabetic participants (n=
2,063).
† Body mass index 18.50-24.99 kg/m2
doi: 10.1038/nature06882 SUPPLEMENTARY INFORMATION
www.nature.com/nature 25
Page 26
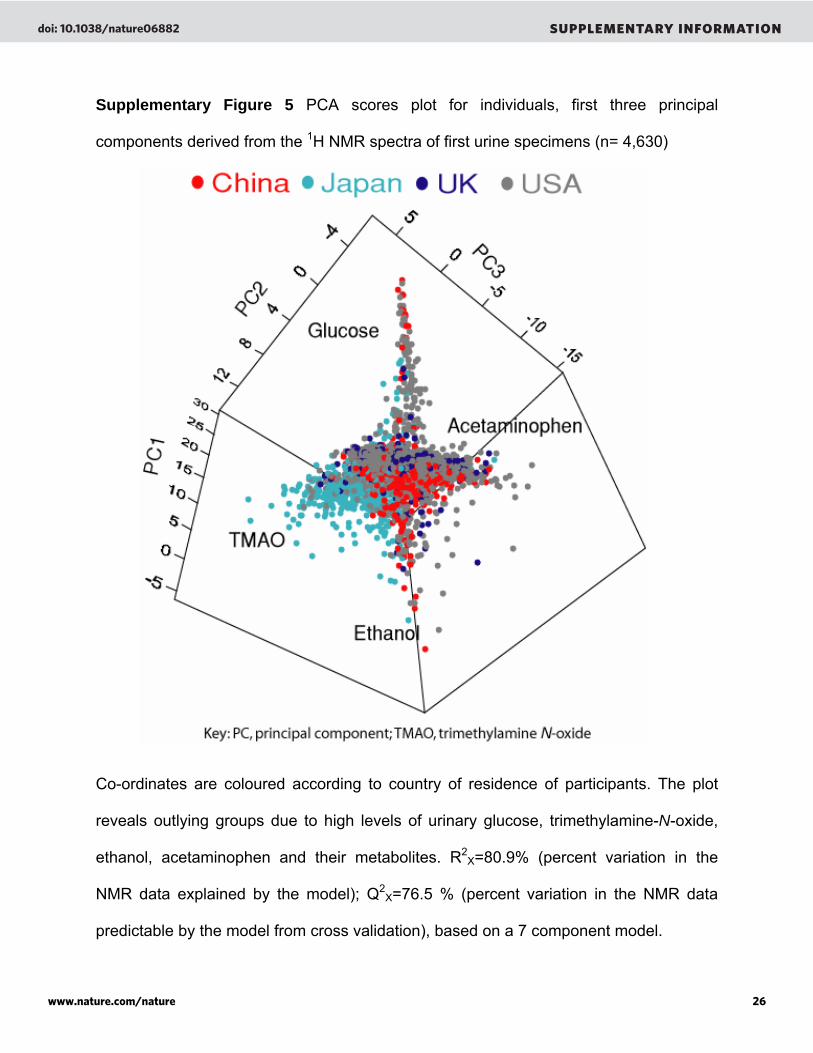
Supplementary Figure 5 PCA scores plot for individuals, first three principal
components derived from the 1H NMR spectra of first urine specimens (n= 4,630)
Co-ordinates are coloured according to country of residence of participants. The plot
reveals outlying groups due to high levels of urinary glucose, trimethylamine-N-oxide,
ethanol, acetaminophen and their metabolites. R2X=80.9% (percent variation in the
NMR data explained by the model); Q2X=76.5 % (percent variation in the NMR data
predictable by the model from cross validation), based on a 7 component model.
doi: 10.1038/nature06882 SUPPLEMENTARY INFORMATION
www.nature.com/nature 26
Page 27
Supplementary Figure 6 Cross validated Principal Components Analysis (PCA) scores
plots based on median 1H NMR urine spectra stratified by country after the removal of
outliers using 95% Hotellings T2 statistic
doi: 10.1038/nature06882 SUPPLEMENTARY INFORMATION
www.nature.com/nature 27
Page 28
doi: 10.1038/nature06882 SUPPLEMENTARY INFORMATION
www.nature.com/nature 28
Page 29
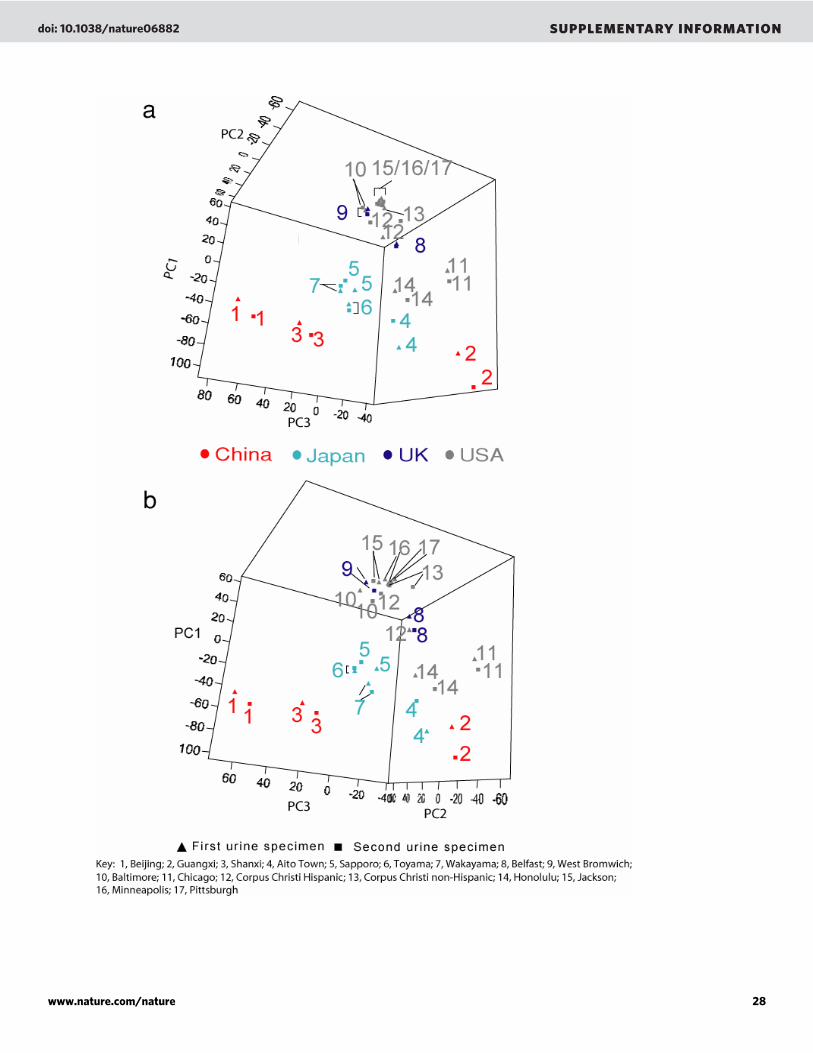
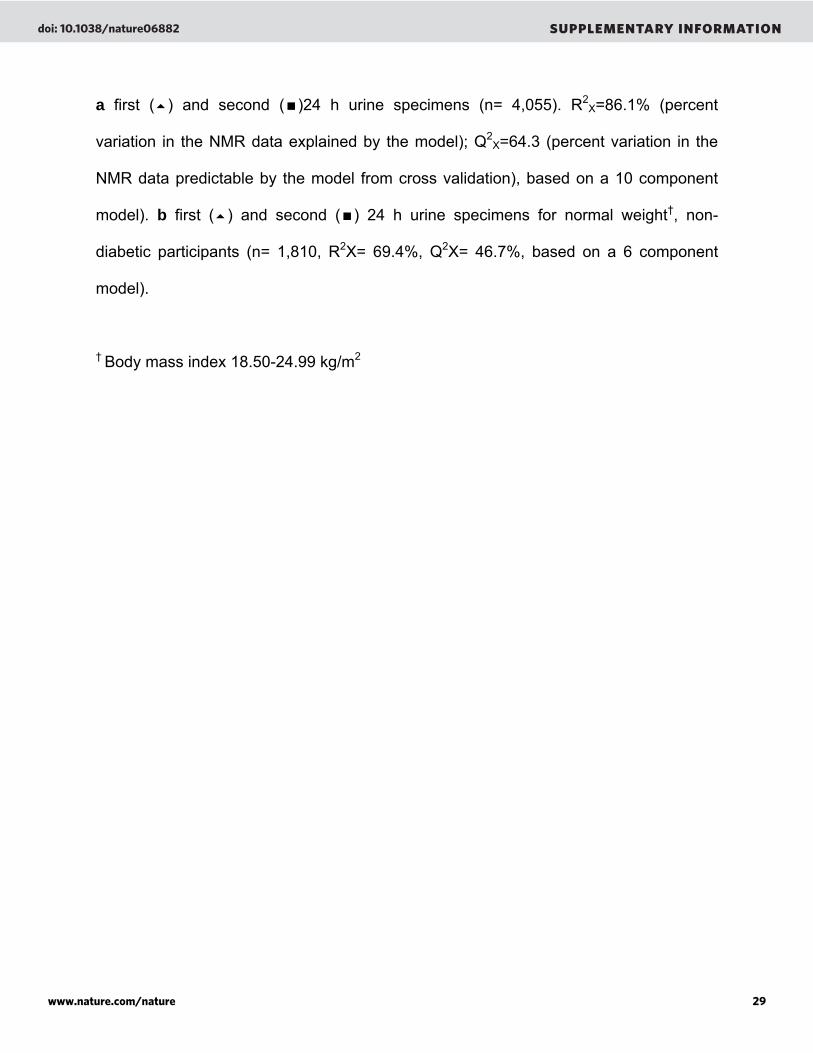
a first ( ) and second ( )24 h urine specimens (n= 4,055). R2X=86.1% (percent
variation in the NMR data explained by the model); Q2X=64.3 (percent variation in the
NMR data predictable by the model from cross validation), based on a 10 component
model). b first ( ) and second ( ) 24 h urine specimens for normal weight†, non-
diabetic participants (n= 1,810, R2X= 69.4%, Q2X= 46.7%, based on a 6 component
model).
† Body mass index 18.50-24.99 kg/m2
doi: 10.1038/nature06882 SUPPLEMENTARY INFORMATION
www.nature.com/nature 29
Page 30
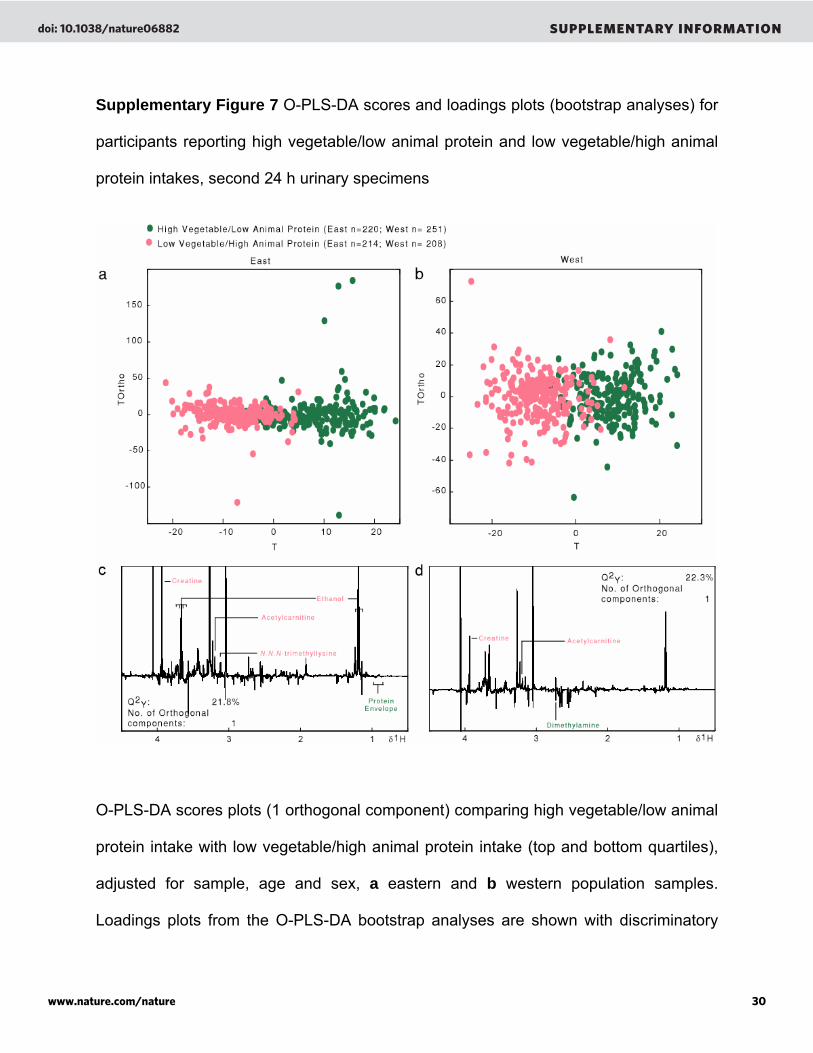
Supplementary Figure 7 O-PLS-DA scores and loadings plots (bootstrap analyses) for
participants reporting high vegetable/low animal protein and low vegetable/high animal
protein intakes, second 24 h urinary specimens
O-PLS-DA scores plots (1 orthogonal component) comparing high vegetable/low animal
protein intake with low vegetable/high animal protein intake (top and bottom quartiles),
adjusted for sample, age and sex, a eastern and b western population samples.
Loadings plots from the O-PLS-DA bootstrap analyses are shown with discriminatory
doi: 10.1038/nature06882 SUPPLEMENTARY INFORMATION
www.nature.com/nature 30
Page 31
metabolites labelled (see Methods for metabolite selection criteria) for c East Asian and
d western participants. Analyses are after removal of metabolic outliers using the 95%
Hotelling’s T2 statistic in the initial PCA. The plots show the number of participants, the
number of components used in each model and the Q2Y values (percent variation in the
protein subgroup assignment explained by the model, and predictable by the model
from cross validation).
doi: 10.1038/nature06882 SUPPLEMENTARY INFORMATION
www.nature.com/nature 31
Page 32
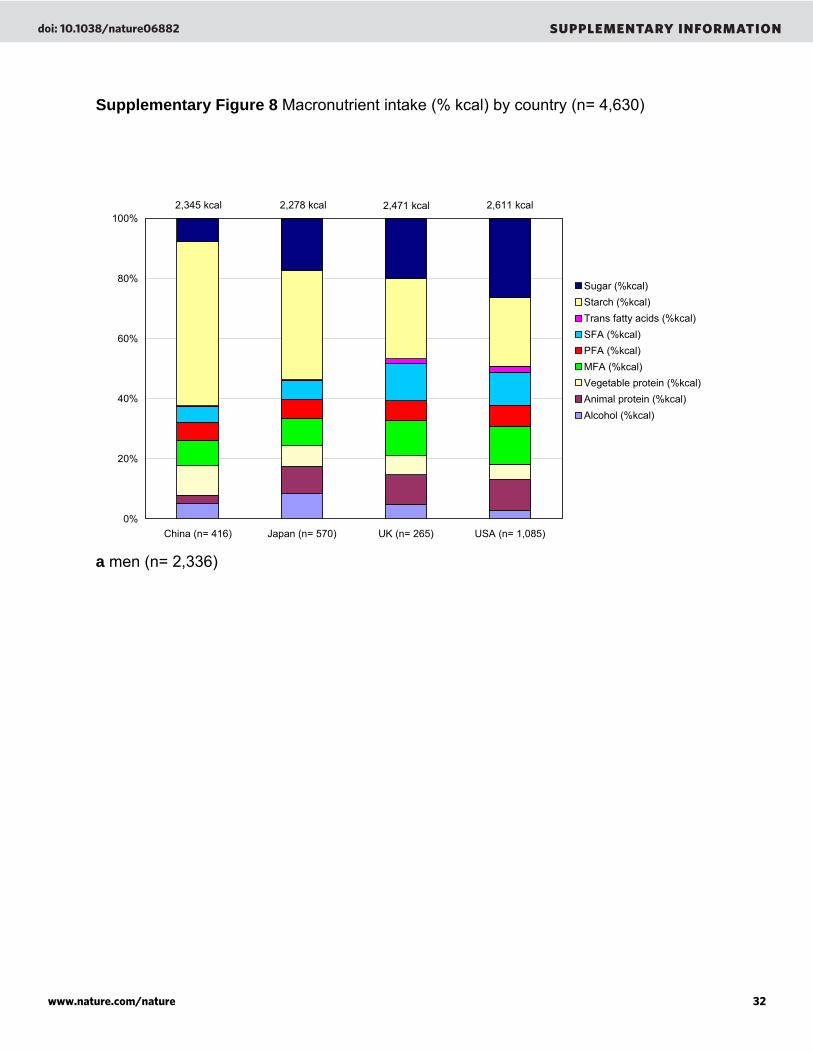
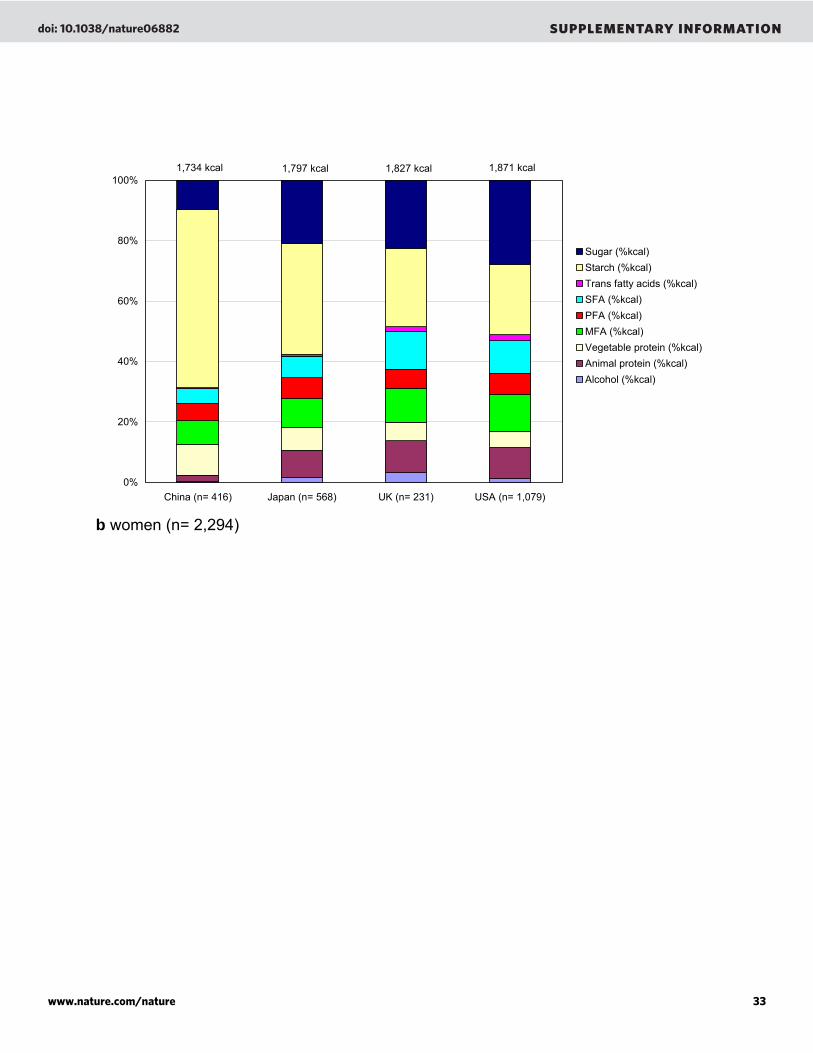
Supplementary Figure 8 Macronutrient intake (% kcal) by country (n= 4,630)
0%
20%
40%
60%
80%
100%
China (n= 416) Japan (n= 570) UK (n= 265) USA (n= 1,085)
Sugar (%kcal)Starch (%kcal)Trans fatty acids (%kcal)SFA (%kcal)PFA (%kcal)MFA (%kcal)Vegetable protein (%kcal)Animal protein (%kcal)Alcohol (%kcal)
2,278 kcal2,345 kcal 2,471 kcal 2,611 kcal
a men (n= 2,336)
doi: 10.1038/nature06882 SUPPLEMENTARY INFORMATION
www.nature.com/nature 32
Page 33
0%
20%
40%
60%
80%
100%
China (n= 416) Japan (n= 568) UK (n= 231) USA (n= 1,079)
Sugar (%kcal)Starch (%kcal)Trans fatty acids (%kcal)SFA (%kcal)PFA (%kcal)MFA (%kcal)Vegetable protein (%kcal)Animal protein (%kcal)Alcohol (%kcal)
1,797 kcal1,734 kcal 1,827 kcal 1,871 kcal
b women (n= 2,294)
doi: 10.1038/nature06882 SUPPLEMENTARY INFORMATION
www.nature.com/nature 33
Page 34
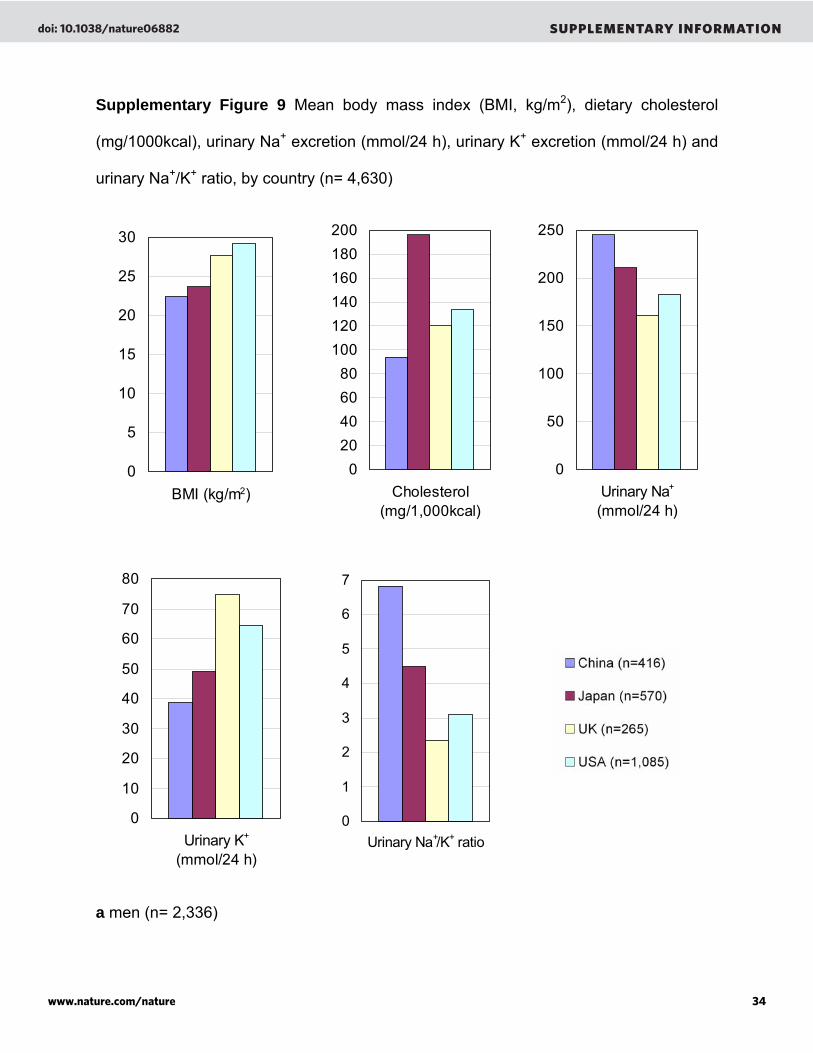
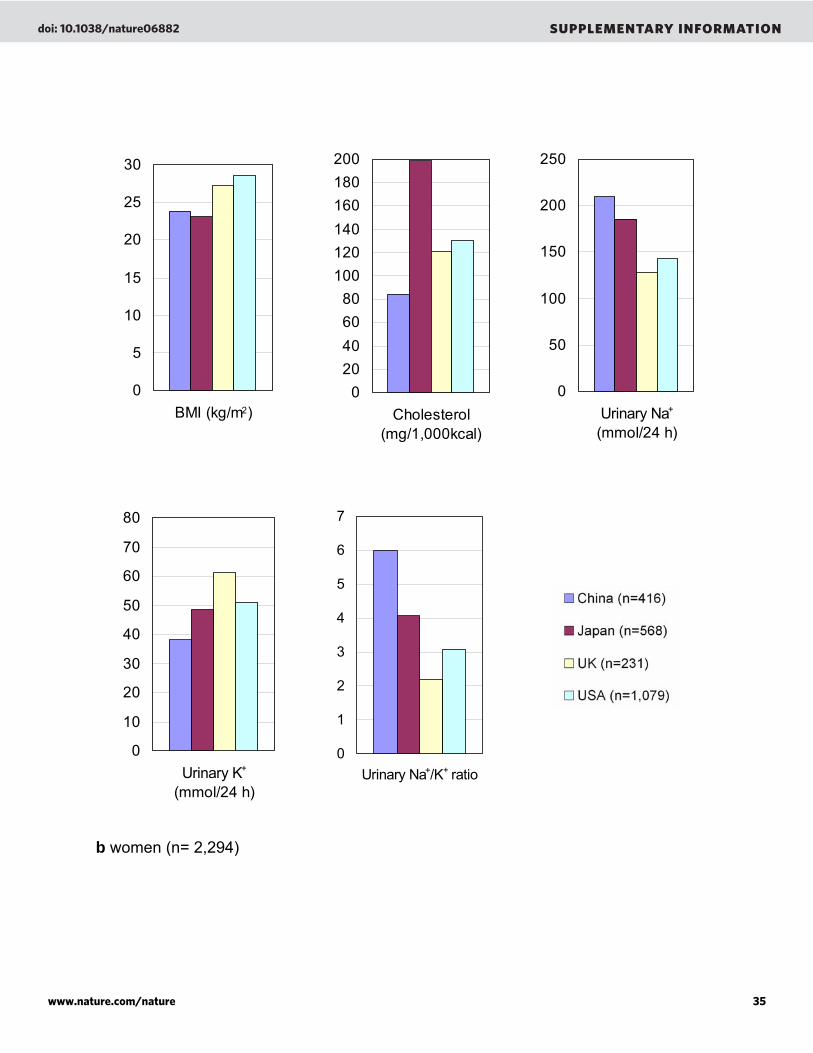
Supplementary Figure 9 Mean body mass index (BMI, kg/m2), dietary cholesterol
(mg/1000kcal), urinary Na+ excretion (mmol/24 h), urinary K+ excretion (mmol/24 h) and
urinary Na+/K+ ratio, by country (n= 4,630)
020406080
100120140160180200
Cholesterol(mg/1,000kcal)
0
50
100
150
200
250
Urinary Na (mmol/24 h)
+ 0
5
10
15
20
25
30
BMI (kg/m )2
0
10
20
30
40
50
60
70
80
Urinary K (mmol/24 h)
+ 0
1
2
3
4
5
6
7
Urinary Na /K ratio+ +
a men (n= 2,336)
doi: 10.1038/nature06882 SUPPLEMENTARY INFORMATION
www.nature.com/nature 34
Page 35
020406080
100120140160180200
Cholesterol(mg/1,000kcal)
0
50
100
150
200
250
Urinary Na (mmol/24 h)
+ 2
0
5
10
15
20
25
30
BMI (kg/m )
0
1
2
3
4
5
6
7
Urinary Na /K ratio+ +
0
10
20
30
40
50
60
70
80
Urinary K (mmol/24 h)
+
b women (n= 2,294)
doi: 10.1038/nature06882 SUPPLEMENTARY INFORMATION
www.nature.com/nature 35