This document describes how to use the Analysis ToolPak in Microsoft Excel to perform basic statistical procedures. Microsoft Excel is spreadsheet software that is used to store information in columns androws, which can then be organized and/or processed. In addition to the basic spreadsheet functions, the
Analysis ToolPak in Excel contains procedures such as ANOVA, correlations, descriptive statistics,histograms, percentiles, regression, and t-tests. This document describes how to get basic descriptivestatistics, perform an ANOVA, a t-test, and a linear regression.
The primary reason to use Excel for statistical data analysis is because it is so widely available. TheAnalysis Toolpak is an add-on that can be installed for free if you have the installation disk for Microsoft Office. It is also publicly available in the Meyer Library cluster and on designated computersin the Social Sciences Resource Center (SSRC) Reading Room cluster in the Bing Wing of GreenLibrary. To use any of the public computers on campus, you must have a SUNet ID (Stanford University Network Identifier). If you do not have a SUNet ID, visit the Web athttp://www.stanford.edu/services/sunetid for information on obtaining one.
Table of Contents
Getting Started with the Analysis ToolPak................................................................................. 1
What you should know before you begin................................................................................... 2
Descriptive Statistics ................................................................................................................. 3 Using the Pivot Table............................................................................................................................................... 3
For More Information and Assistance........................................................................................ 8 Documentation...................................................................................................................................................... 9 Consulting ............................................................................................................................................................. 9
Getting Started with the Analysis ToolPak
To statistically analyze your data in Excel, you need the Analysis ToolPak add-in to be installed inExcel. This was an option when you installed Excel, but you might not have selected it. If you didn'tinstall it, Excel will ask you for the installation CD-ROM, when you try to add the ToolPak.
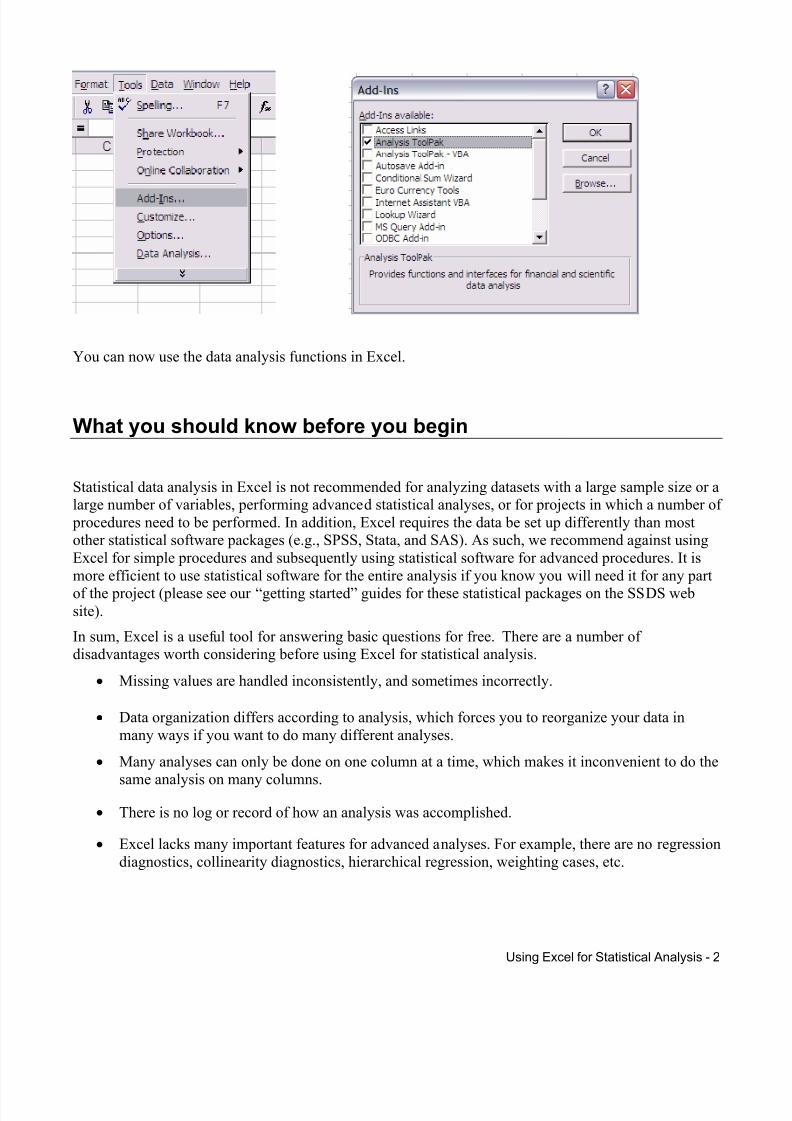
Choose Add-Ins from the Tools menu in Excel to see whether the Analysis ToolPak is installed andchecked (see graphic below).
You can now use the data analysis functions in Excel.
What you should know before you begin
Statistical data analysis in Excel is not recommended for analyzing datasets with a large sample size or alarge number of variables, performing advanced statistical analyses, or for projects in which a number of procedures need to be performed. In addition, Excel requires the data be set up differently than mostother statistical software packages (e.g., SPSS, Stata, and SAS). As such, we recommend against usingExcel for simple procedures and subsequently using statistical software for advanced procedures. It ismore efficient to use statistical software for the entire analysis if you know you will need it for any part
of the project (please see our “getting started” guides for these statistical packages on the SSDS website).
In sum, Excel is a useful tool for answering basic questions for free. There are a number of disadvantages worth considering before using Excel for statistical analysis.
• Missing values are handled inconsistently, and sometimes incorrectly.
• Data organization differs according to analysis, which forces you to reorganize your data inmany ways if you want to do many different analyses.
• Many analyses can only be done on one column at a time, which makes it inconvenient to do the
same analysis on many columns.
• There is no log or record of how an analysis was accomplished.
• Excel lacks many important features for advanced analyses. For example, there are no regressiondiagnostics, collinearity diagnostics, hierarchical regression, weighting cases, etc.
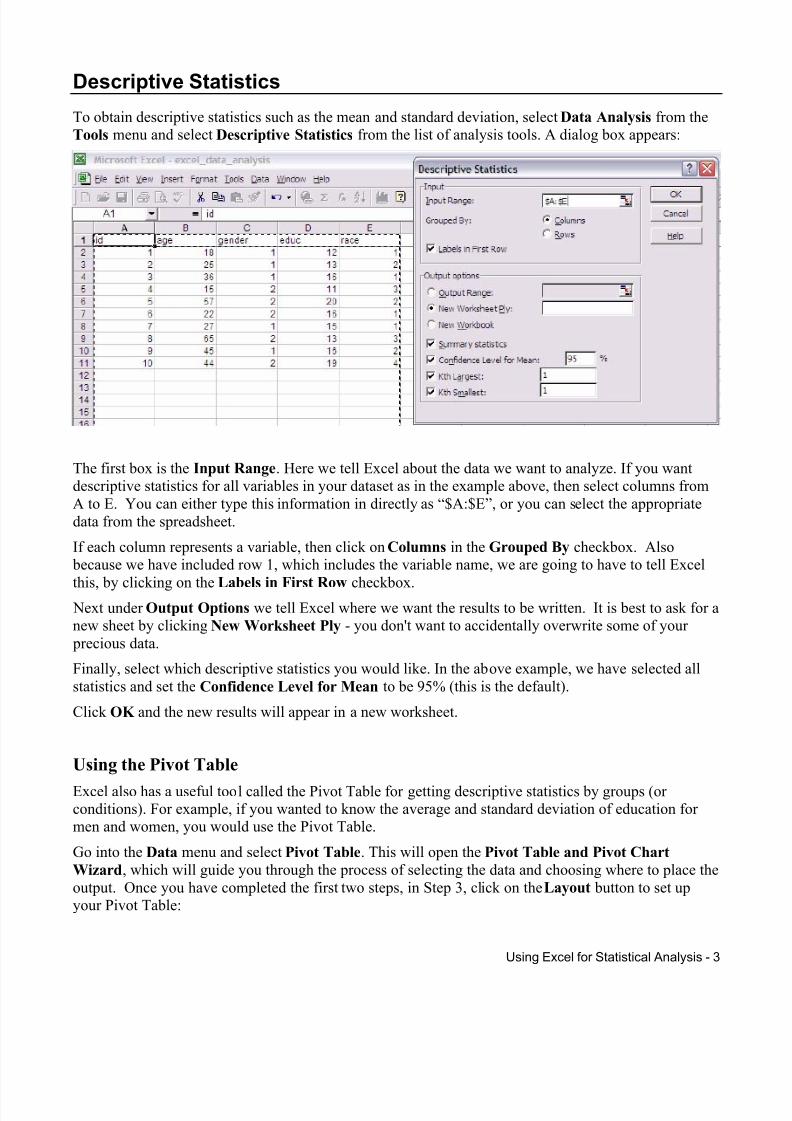
To obtain descriptive statistics such as the mean and standard deviation, select Data Analysis from theTools menu and select Descriptive Statistics from the list of analysis tools. A dialog box appears:
The first box is the Input Range. Here we tell Excel about the data we want to analyze. If you wantdescriptive statistics for all variables in your dataset as in the example above, then select columns fromA to E. You can either type this information in directly as “$A:$E”, or you can select the appropriatedata from the spreadsheet.
If each column represents a variable, then click on Columns in the Grouped By checkbox. Also because we have included row 1, which includes the variable name, we are going to have to tell Excel
this, by clicking on the Labels in First Row checkbox. Next under Output Options we tell Excel where we want the results to be written. It is best to ask for anew sheet by clicking New Worksheet Ply - you don't want to accidentally overwrite some of your precious data.
Finally, select which descriptive statistics you would like. In the above example, we have selected allstatistics and set the Confidence Level for Mean to be 95% (this is the default).
Click OK and the new results will appear in a new worksheet.
Using the Pivot Table
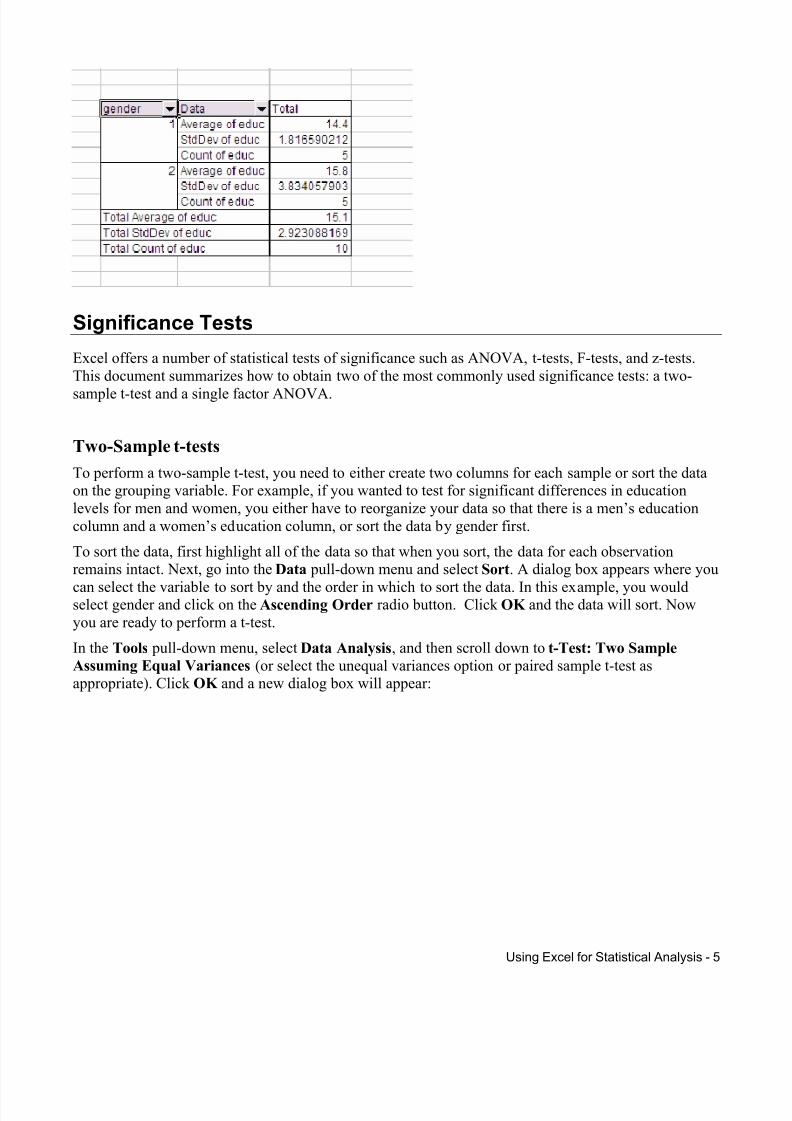
Excel also has a useful tool called the Pivot Table for getting descriptive statistics by groups (or conditions). For example, if you wanted to know the average and standard deviation of education for men and women, you would use the Pivot Table.
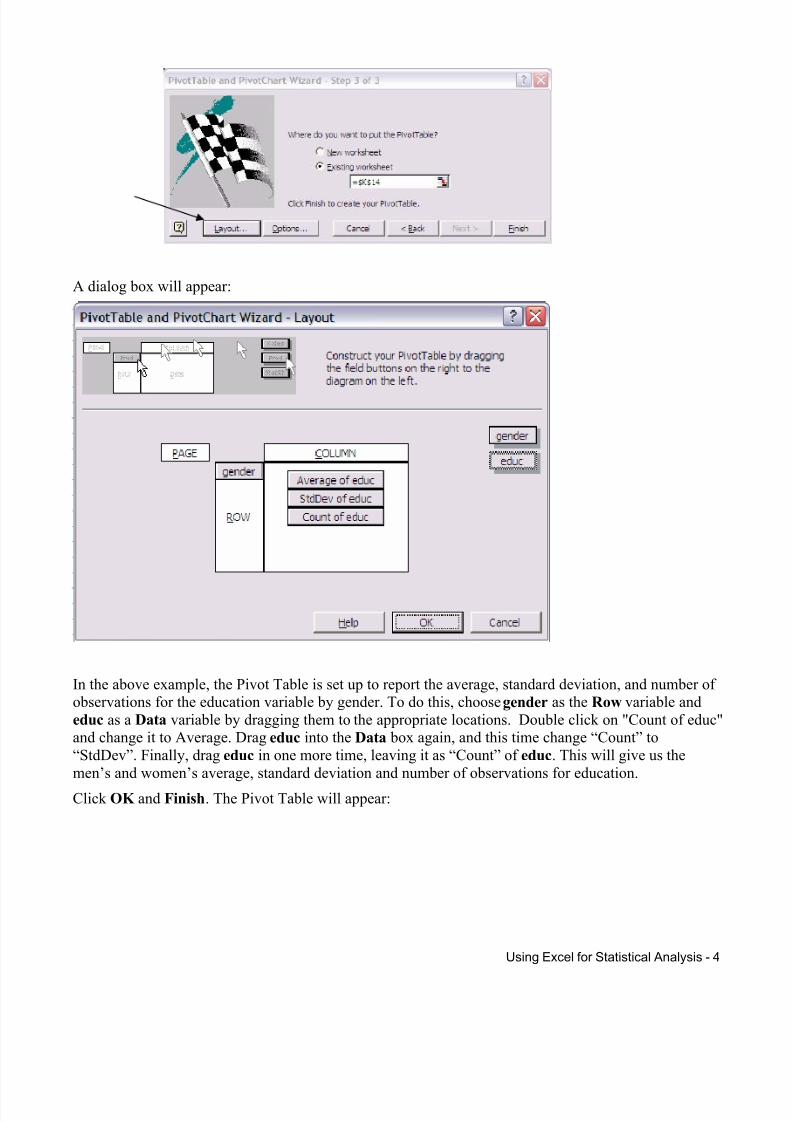
Go into the Data menu and select Pivot Table. This will open the Pivot Table and Pivot Chart
Wizard, which will guide you through the process of selecting the data and choosing where to place theoutput. Once you have completed the first two steps, in Step 3, click on the Layout button to set upyour Pivot Table:
In the above example, the Pivot Table is set up to report the average, standard deviation, and number of observations for the education variable by gender. To do this, choose gender as the Row variable andeduc as a Data variable by dragging them to the appropriate locations. Double click on "Count of educ"and change it to Average. Drag educ into the Data box again, and this time change “Count” to“StdDev”. Finally, drag educ in one more time, leaving it as “Count” of educ. This will give us themen’s and women’s average, standard deviation and number of observations for education.
Excel offers a number of statistical tests of significance such as ANOVA, t-tests, F-tests, and z-tests.This document summarizes how to obtain two of the most commonly used significance tests: a two-
sample t-test and a single factor ANOVA.
Two-Sample t-tests
To perform a two-sample t-test, you need to either create two columns for each sample or sort the dataon the grouping variable. For example, if you wanted to test for significant differences in educationlevels for men and women, you either have to reorganize your data so that there is a men’s educationcolumn and a women’s education column, or sort the data by gender first.
To sort the data, first highlight all of the data so that when you sort, the data for each observationremains intact. Next, go into the Data pull-down menu and select Sort. A dialog box appears where you
can select the variable to sort by and the order in which to sort the data. In this example, you wouldselect gender and click on the Ascending Order radio button. Click OK and the data will sort. Nowyou are ready to perform a t-test.
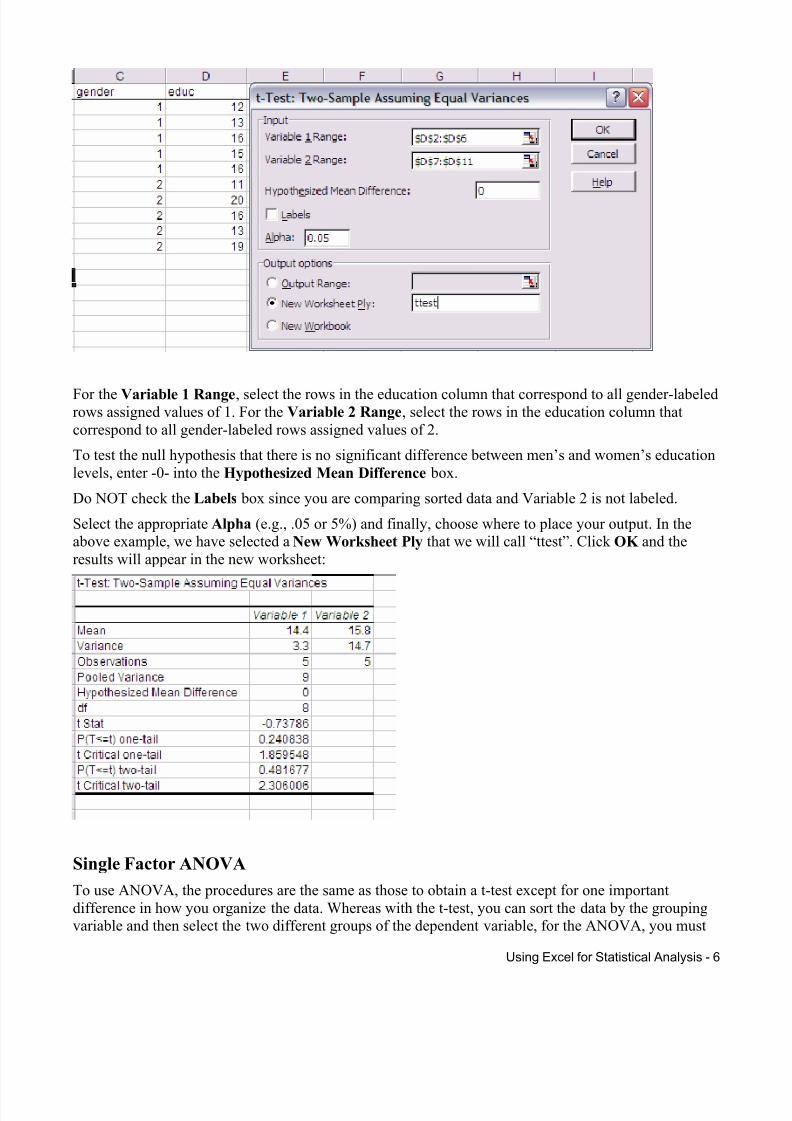
In the Tools pull-down menu, select Data Analysis, and then scroll down to t-Test: Two Sample
Assuming Equal Variances (or select the unequal variances option or paired sample t-test asappropriate). Click OK and a new dialog box will appear:
For the Variable 1 Range, select the rows in the education column that correspond to all gender-labeledrows assigned values of 1. For the Variable 2 Range, select the rows in the education column thatcorrespond to all gender-labeled rows assigned values of 2.
To test the null hypothesis that there is no significant difference between men’s and women’s educationlevels, enter -0- into the Hypothesized Mean Difference box.
Do NOT check the Labels box since you are comparing sorted data and Variable 2 is not labeled.
Select the appropriate Alpha (e.g., .05 or 5%) and finally, choose where to place your output. In theabove example, we have selected a New Worksheet Ply that we will call “ttest”. Click OK and theresults will appear in the new worksheet:
Single Factor ANOVA
To use ANOVA, the procedures are the same as those to obtain a t-test except for one importantdifference in how you organize the data. Whereas with the t-test, you can sort the data by the groupingvariable and then select the two different groups of the dependent variable, for the ANOVA, you must
create a separate column for each group. For example, if we want to use ANOVA to compare men’s andwomen’s education levels as with the previous t-test example, the dataset must contain a column withthe men’s education levels and a separate column with the women’s education levels. You would thenselect both columns as the input range.
Note that this type of data organization is different from how you would set up your data if you
were going to use a statistical software package such as SPSS, Stata or SAS.
Regression
While Excel can do the regression procedure, it does not report standardized coefficients, importantregression diagnostics or information about collinearity. For this reason, we recommend that users whoare doing anything more than exploratory research use a statistical software package such as SPSS,Stata, or SAS for regression analysis.
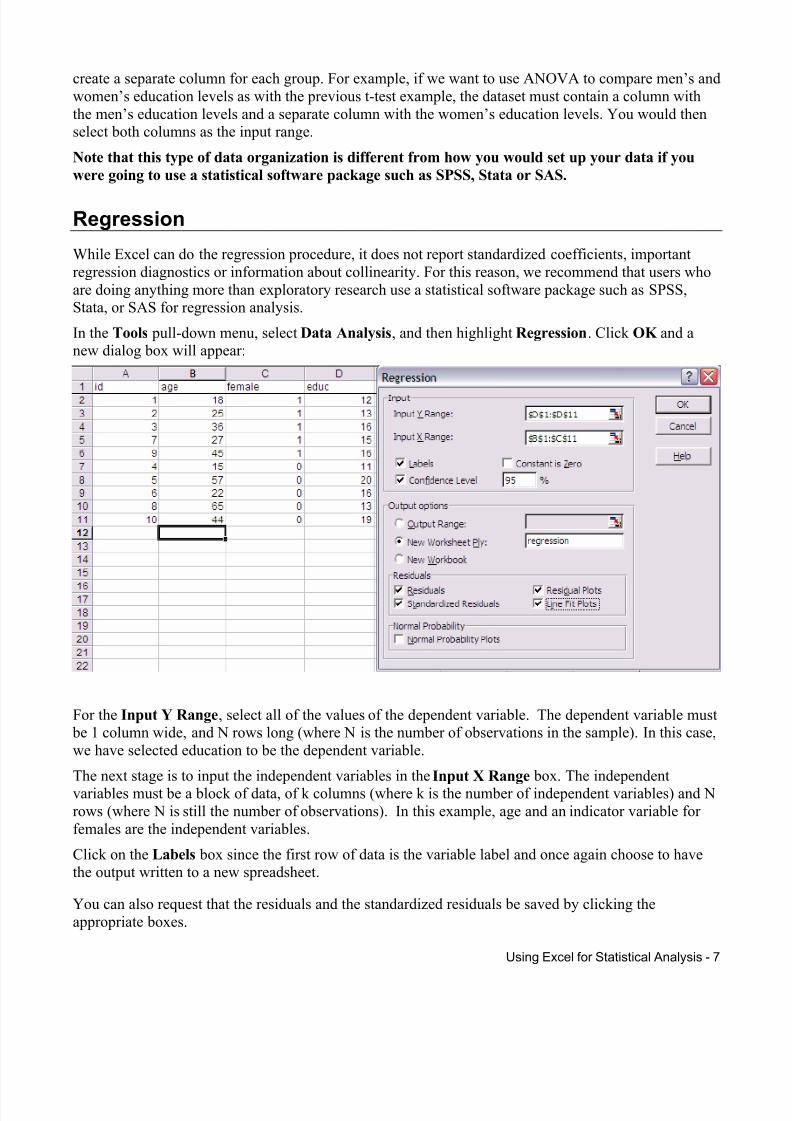
In the Tools pull-down menu, select Data Analysis, and then highlight Regression. Click OK and anew dialog box will appear:
For the Input Y Range, select all of the values of the dependent variable. The dependent variable must be 1 column wide, and N rows long (where N is the number of observations in the sample). In this case,we have selected education to be the dependent variable.
The next stage is to input the independent variables in the Input X Range box. The independentvariables must be a block of data, of k columns (where k is the number of independent variables) and Nrows (where N is still the number of observations). In this example, age and an indicator variable for females are the independent variables.
Click on the Labels box since the first row of data is the variable label and once again choose to havethe output written to a new spreadsheet.
You can also request that the residuals and the standardized residuals be saved by clicking theappropriate boxes.
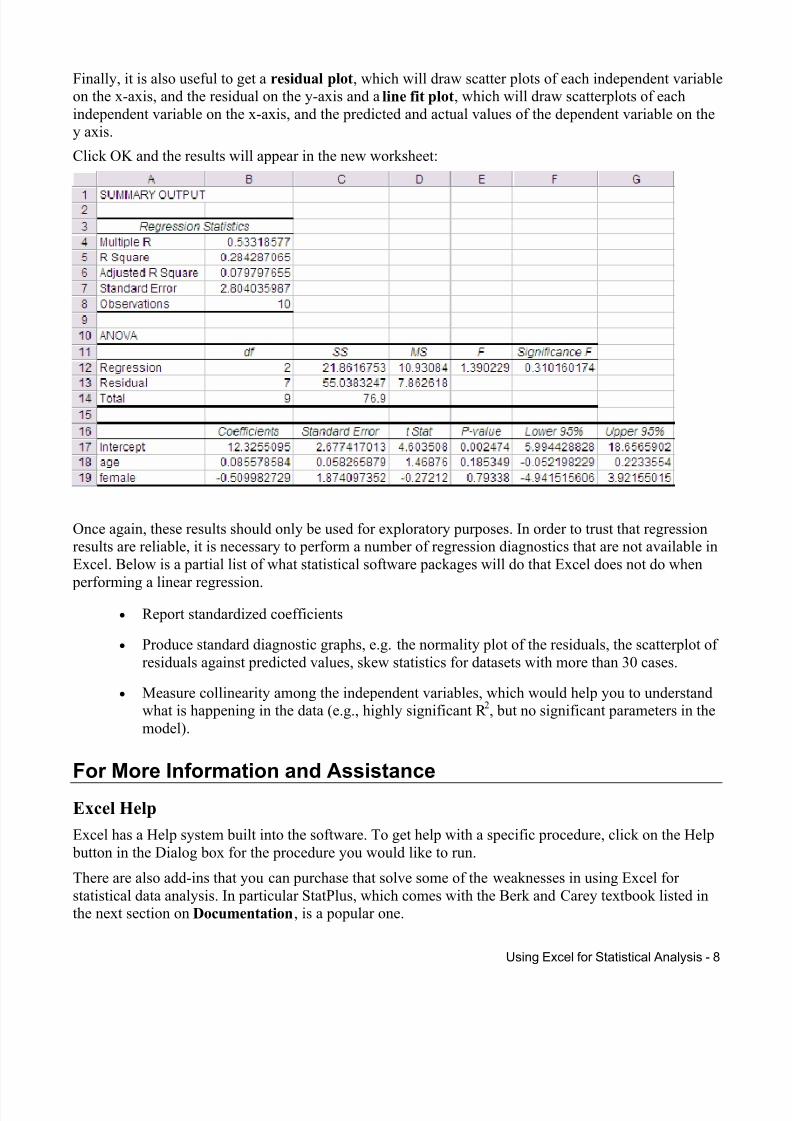
Finally, it is also useful to get a residual plot, which will draw scatter plots of each independent variableon the x-axis, and the residual on the y-axis and a line fit plot, which will draw scatterplots of eachindependent variable on the x-axis, and the predicted and actual values of the dependent variable on they axis.
Click OK and the results will appear in the new worksheet:
Once again, these results should only be used for exploratory purposes. In order to trust that regressionresults are reliable, it is necessary to perform a number of regression diagnostics that are not available inExcel. Below is a partial list of what statistical software packages will do that Excel does not do when
performing a linear regression.
• Report standardized coefficients
• Produce standard diagnostic graphs, e.g. the normality plot of the residuals, the scatterplot of residuals against predicted values, skew statistics for datasets with more than 30 cases.
• Measure collinearity among the independent variables, which would help you to understandwhat is happening in the data (e.g., highly significant R 2, but no significant parameters in themodel).
For More Information and Assistance
Excel Help
Excel has a Help system built into the software. To get help with a specific procedure, click on the Help button in the Dialog box for the procedure you would like to run.
There are also add-ins that you can purchase that solve some of the weaknesses in using Excel for statistical data analysis. In particular StatPlus, which comes with the Berk and Carey textbook listed inthe next section on Documentation, is a popular one.
Social Sciences Data and Software (SSDS) has a reference library of textbooks and software manualsabout qualitative and statistical analysis, located in the Velma Dining Room on the first floor of theGreen Library Bing Wing. Stop by to browse our collection or consult the SSDS website athttp://ssds.stanford.edu, where you can browse by title, subject and call number. The SSDS collectiondoes not circulate, but check the online catalog Socrates for copies in other locations.
The following books contain useful information about using the data analysis tools in Excel. You can purchase the books at the Stanford Bookstore and some manuals are also available to be checked outfrom Green Library.
Books
Berk, Kenneth and Patrick Carey. 2003. Data Analysis with Microsoft Excel : Updated for Office
XP (with StatPlus CD-ROM)
Middleton, Michael R. 2004. Data analysis using Microsoft Excel: updated for Office XP. Nelson, Steven L. 2002. Excel Data Analysis for Dummies.
Consulting
If you have questions about using the Analysis ToolPak in Excel, please contact the SSDS SoftwareConsultants via our web site at http://ssds.stanford.edu. The software consultants are available during theacademic year on a walk-in basis or by appointment. Please see our web site for our current walk-inhours.