ICES Advice on fishing opportunities, catch, and effort Baltic Sea Ecoregion Published 31 May 2016 ICES Advice 2016, Book 8 1 8.3.2 Salmon ( Salmo salar ) in subdivisions 22–31 (Baltic Sea, excluding Gulf of Finland) ICES stock advice ICES advises that new data (landings and surveys) available for this stock do not change the perception of the stock status. Therefore, the advice for this stock in 2017 is the same as the advice for 2016. The assessment was not updated in 2016, but some information on catches in 2015 is provided. ICES advises that when the maximum sustainable yield (MSY) approach is applied, total commercial sea catch in 2017 should not exceed 116 000 salmon. Applying the same catch proportions estimated to have occurred in 2014, this catch would be split as follows: 10% unwanted catch (previously referred to as discards) and 90% wanted catch (77% reported, 7% unreported, and 6% misreported). Setting a TAC under a discard ban needs to take account of wanted and unwanted catch. In setting the TAC, consideration should also be given to expected unreporting and misreporting levels in 2017. ICES advises that management of salmon fisheries should be based on the status of individual river stocks. Fisheries on mixed stocks that cannot target only river stocks with a healthy status, present particular threats to stocks that do not have a healthy status. Fisheries in open-sea areas or coastal waters are more likely to pose a threat to depleted stocks than fisheries in estuaries and rivers. Effort in these mixed-stock fisheries has been reduced to low levels and should not increase. Salmon stocks in the rivers Rickleån, Kågeälven, and Öreälven in the Gulf of Bothnia, Emån in southern Sweden, and in several rivers in the southeastern Main Basin are especially weak. These stocks need longer-term, stock-specific rebuilding measures, including fisheries restrictions in estuaries and rivers, habitat restoration, and removal of physical barriers. In order to maximize the potential recovery of these stocks, exploitation should not increase along their feeding and spawning migration routes at sea. The offshore fishery in the Main Basin catches all weak salmon stocks on their feeding migration. The coastal fishery catches weak stocks from northern rivers when the salmon pass the Åland Sea and the Gulf of Bothnia on their spawning migration. Stock development over time To evaluate the status of the wild stocks, ICES uses the smolt production relative to the potential smolt production capacity (PSPC) on a river-by-river basis. Based on the 29 rivers in subdivisions 22–31 assessed in the 2015 assessment, the probability that the smolt production has reached 50% of the PSPC in 2014 is above 70% for 12 rivers, between 30% and 70% for 10 rivers, and below 30% for 7 rivers (Table 8.3.2.9). The probability that the smolt production has reached 75% of PSPC in 2014 is above 70% for four of the 29 rivers. With a few exceptions, the rivers in the northern Baltic Sea area present a better status than the southern ones. The 2015 assessment indicates that the total wild smolt production has increased tenfold in assessment units (AUs) 1–2 since the Salmon Action Plan was adopted in 1997 (Figure 8.3.2.1). The smolt production in AUs 3 and 4 has remained at around the same level. The strong spawning runs in 2012, 2013, and 2014, will likely result in increased smolt production in the near future. Despite the overall increase in wild smolt production, the decline in post-smolt survival from the late 1980s until the mid-2000s (Figure 8.3.2.2) has impacted fishing possibilities. Some indications of improvement in post- smolt survival have been noticed in recent years. Smolt production in AU 5, assessed by expert judgement, has been low (Figure 8.3.2.1). However, based on recent parr density data, some increase may be expected in the near future. A range of problems in the freshwater environment play a significant role in explaining the poor status of stocks in the southern Baltic rivers. The harvest rate of salmon has decreased considerably since the beginning of the 1990s (Figure 8.3.2.1).
Transcript
ICES Advice on fishing opportunities, catch, and effort Baltic Sea Ecoregion Published 31 May 2016
ICES Advice 2016, Book 8 1
8.3.2 Salmon (Salmo salar) in subdivisions 22–31 (Baltic Sea, excluding Gulf of Finland) ICES stock advice ICES advises that new data (landings and surveys) available for this stock do not change the perception of the stock status. Therefore, the advice for this stock in 2017 is the same as the advice for 2016. The assessment was not updated in 2016, but some information on catches in 2015 is provided. ICES advises that when the maximum sustainable yield (MSY) approach is applied, total commercial sea catch in 2017 should not exceed 116 000 salmon. Applying the same catch proportions estimated to have occurred in 2014, this catch would be split as follows: 10% unwanted catch (previously referred to as discards) and 90% wanted catch (77% reported, 7% unreported, and 6% misreported). Setting a TAC under a discard ban needs to take account of wanted and unwanted catch. In setting the TAC, consideration should also be given to expected unreporting and misreporting levels in 2017. ICES advises that management of salmon fisheries should be based on the status of individual river stocks. Fisheries on mixed stocks that cannot target only river stocks with a healthy status, present particular threats to stocks that do not have a healthy status. Fisheries in open-sea areas or coastal waters are more likely to pose a threat to depleted stocks than fisheries in estuaries and rivers. Effort in these mixed-stock fisheries has been reduced to low levels and should not increase. Salmon stocks in the rivers Rickleån, Kågeälven, and Öreälven in the Gulf of Bothnia, Emån in southern Sweden, and in several rivers in the southeastern Main Basin are especially weak. These stocks need longer-term, stock-specific rebuilding measures, including fisheries restrictions in estuaries and rivers, habitat restoration, and removal of physical barriers. In order to maximize the potential recovery of these stocks, exploitation should not increase along their feeding and spawning migration routes at sea. The offshore fishery in the Main Basin catches all weak salmon stocks on their feeding migration. The coastal fishery catches weak stocks from northern rivers when the salmon pass the Åland Sea and the Gulf of Bothnia on their spawning migration. Stock development over time To evaluate the status of the wild stocks, ICES uses the smolt production relative to the potential smolt production capacity (PSPC) on a river-by-river basis. Based on the 29 rivers in subdivisions 22–31 assessed in the 2015 assessment, the probability that the smolt production has reached 50% of the PSPC in 2014 is above 70% for 12 rivers, between 30% and 70% for 10 rivers, and below 30% for 7 rivers (Table 8.3.2.9). The probability that the smolt production has reached 75% of PSPC in 2014 is above 70% for four of the 29 rivers. With a few exceptions, the rivers in the northern Baltic Sea area present a better status than the southern ones. The 2015 assessment indicates that the total wild smolt production has increased tenfold in assessment units (AUs) 1–2 since the Salmon Action Plan was adopted in 1997 (Figure 8.3.2.1). The smolt production in AUs 3 and 4 has remained at around the same level. The strong spawning runs in 2012, 2013, and 2014, will likely result in increased smolt production in the near future. Despite the overall increase in wild smolt production, the decline in post-smolt survival from the late 1980s until the mid-2000s (Figure 8.3.2.2) has impacted fishing possibilities. Some indications of improvement in post-smolt survival have been noticed in recent years. Smolt production in AU 5, assessed by expert judgement, has been low (Figure 8.3.2.1). However, based on recent parr density data, some increase may be expected in the near future. A range of problems in the freshwater environment play a significant role in explaining the poor status of stocks in the southern Baltic rivers. The harvest rate of salmon has decreased considerably since the beginning of the 1990s (Figure 8.3.2.1).
Published 31 May 2016 ICES Advice on fishing opportunities, catch, and effort
2 ICES Advice 2016, Book 8
Figure 8.3.2.1 Salmon in subdivisions 22–31. Top and middle rows: Smolt production (time-series) and PSPC (horizontal solid line) for AUs 1–4 (median estimate for the entire unit and 90% probability intervals). Bottom left: Smolt production relative to PSPC for AU 5 (median estimate across the wild rivers and 90% probability interval); values on the vertical axis denote percentages. Bottom right: harvest rates in offshore (by fishing season) and coastal (by calendar year) fisheries.
Catch options Because the new data (landings and surveys) available for this stock did not change the perception of the stock an updated stock assessment was not performed. As a result no additional catch options are provided for 2017. Five fishing scenarios were considered in the 2015 advice for 2016. Scenario 1 corresponded to the same total commercial catch at sea as the total advised by ICES for 2015 (116 000 salmon). Scenarios 2 and 3 represented a 20% increase and a 20% decrease in catch, respectively, compared with Scenario 1. Scenario 4 followed the EU Commission’s proposal for a multiannual plan for Baltic salmon (EU, 2011). Two options were presented under Scenario 4: (a) F = 0.1
Published 31 May 2016 ICES Advice on fishing opportunities, catch, and effort
ICES Advice 2016, Book 8 3
that covered the commercial catch at sea; (b) F = 0.1 that covered total (commercial and recreational) catch at sea. Both of these options (4a and 4b) are calculated based on the PFA estimates from the 2015 assessment (ICES, 2015; stock size at the beginning of 2016). Scenario 5 illustrated stock development under no fishing, neither at sea nor in rivers. The outlook table for 2017 (Table 8.3.2.1) splits the total commercial catch at sea into similar components as in previous years using the proportions estimated to have occurred in 2014: wanted catch reported (77%), wanted catch unreported (7%), wanted catch misreported (6%), and unwanted catch (10%; this is the catch that would be discarded if discarding was allowed). The 10% unwanted catch is the sum of 3% (undersized salmon) and 7% (seal-damaged salmon). Seal-damaged salmon is always dead, whereas a proportion of the undersized salmon would survive if it were discarded. All scenarios assume additional recreational catches at sea that constitute 14% of the total (commercial + recreational) sea catch, based on the available data for 2014, and a constant harvest rate on returning salmon in rivers. Table 8.3.2.1 Salmon in subdivisions 22–31. The catch options.
Scenario
Commercial catch (thousands of fish) at sea in subdvisions 22–31 in 2017
5 0 0 0 - All values in the table are in thousands of fish. * Spawners in 2017 are not available because the assessment was not updated. MSY approach Based on the 2015 assessment (ICES, 2015), figures 8.3.2.4a–b present the river-specific annual probabilities of meeting 75% of the PSPC under each scenario for the 15 wild rivers of AUs 1–4 included in the stock projections. Table 8.3.2.9 shows these probabilities for year 2021 (for stocks in AUs 1–3) or 2020 (for stocks in AU 4), which is approximately one full generation ahead from now. The results indicate relatively small differences between scenarios 1–4; only Scenario 5 (zero fishing) is clearly different. There are, however, differences between rivers, with some of them having a much lower probability of reaching 75% of the PSPC. Rivers Emån (southern Sweden) and Simojoki, Rickleån, and Öreälven (Gulf of Bothnia) have the lowest probabilities. However, Rickleån and Öreälven are showing positive trends under most scenarios. Figure 8.3.2.5a–b displays estimated smolt production in the past and projected future smolt production under Scenario 1. For all rivers except Emån and Mörrumsån, smolt production in 2020–2021 is expected to remain around current levels or to increase. Given that the perception about current stock status has not changed markedly over the last two years, Scenario 1, corresponding to the commercial catch at sea advised last year, is still considered to provide the upper limit for exploitation under the MSY approach. This corresponds to a total commercial sea catch not exceeding 116 000 salmon in 2017. Stock projections have not been conducted for Kågeälven (AU 2), Testeboån (AU 3), and stocks in AU 5. The majority of these stocks are regarded as weak and several have shown decreasing trends during the last decade. Mixed-stock fisheries pose a special problem in managing these stocks. Effort in these fisheries has been reduced to low levels and
Published 31 May 2016 ICES Advice on fishing opportunities, catch, and effort
4 ICES Advice 2016, Book 8
should not increase. The reasons for the low productivity of southern stocks is not entirely clear but may, at least partly, be caused by conditions in the freshwater environment (ICES, 2014, 2015). Special actions (not only fishery-related) for these stocks are required in addition to the TAC. Management plan According to the management plan proposed by the EC, fishing mortality should not exceed F = 0.1. The plan does not specify exactly how to interpret F = 0.1, or whether this value covers the total catch at sea or only the commercial part of this catch. Different fisheries occur at different points in time and space, and many fisheries catch only maturing salmon. Hence, any catch calculation based on F = 0.1 is only approximate. ICES calculated the 2016 catch option by calculating the abundance at sea on September 1st for 1-sea-winter (1SW) fish and on July 1st for multi-sea-winter (MSW) fish, accounting for natural mortality from the start of the year, and then applying the exploitation rate. Assuming that F = 0.1 covers only the commercial catch at sea (Scenario 4(a)), this corresponds to a total commercial catch at sea not exceeding 96 495 salmon in 2016. Assuming that F = 0.1 covers the total catch at sea (Scenario 4(b)), this corresponds to a total commercial catch at sea not exceeding 82 600 salmon in 2016. ICES has not evaluated the EC’s proposed management plan for consistency with the precautionary approach and MSY. Basis of the advice Table 8.3.2.2 Salmon in subdivisions 22–31. The basis of the advice.
Advice basis MSY approach using the 2015 assessment Management plan EC proposal (EU, 2011), not formally adopted.
Quality of the assessment The overall quality of the assessment for AU 1–4 stocks was considered to be good last year (ICES, 2015). The assessment was not updated in 2016. Issues relevant for the advice There is considerable uncertainty about the amount of salmon discarded and even greater uncertainty about the proportion that survives when discarded. Seal-damaged salmon are all dead, but there is also uncertainty on the amount of seal-damaged salmon. The values used in this advice represent the current available knowledge and are based on data from a variety of sources (such as logbooks, interviews with fishers, agreed sampling schemes with skippers, or Data Collection Framework (DCF) sampling data), but these data are generally sparse. Expert judgement has been applied when no data are available or to supplement the sparse data. Because of this uncertainty, current estimates of discards should be considered only as an order of magnitude and not as precise estimates. Recent efforts to re-establish self-sustaining salmon stocks in “potential” rivers, where salmon stocks have been extirpated in the past, present exceptional challenges to management. The numbers of spawners in the “potential” rivers are likely to be particularly low following initial re-introductions, and productivity is likely to be lower than average. The considerations presented in this advice for the existing weak salmon stocks (e.g. habitat restorations, fishery restrictions, etc.) also apply to re-established stocks. Salmon harvest rates are presently rather low compared to in the past. This implies that natural processes, mainly post-smolt and adult natural mortalities, will have a high relative impact on the resulting chances of reaching the management objective. The prevalence of the M74 syndrome decreased in the mid-1990s and remained at a low level until 2015, with the most recent data suggesting an increase in the last year (ICES, 2016a). The present advice has not taken into account this recent increase of M74. Exploitation in the Main Basin offshore fisheries affects possibilities for recovery of the Gulf of Finland salmon stocks as Gulf of Finland salmon is partly caught in the Main Basin. The future development in the longline fishery in the Main Basin is, thus, also important for the recovery rate of salmon stocks in the Gulf of Finland.
Published 31 May 2016 ICES Advice on fishing opportunities, catch, and effort
ICES Advice 2016, Book 8 5
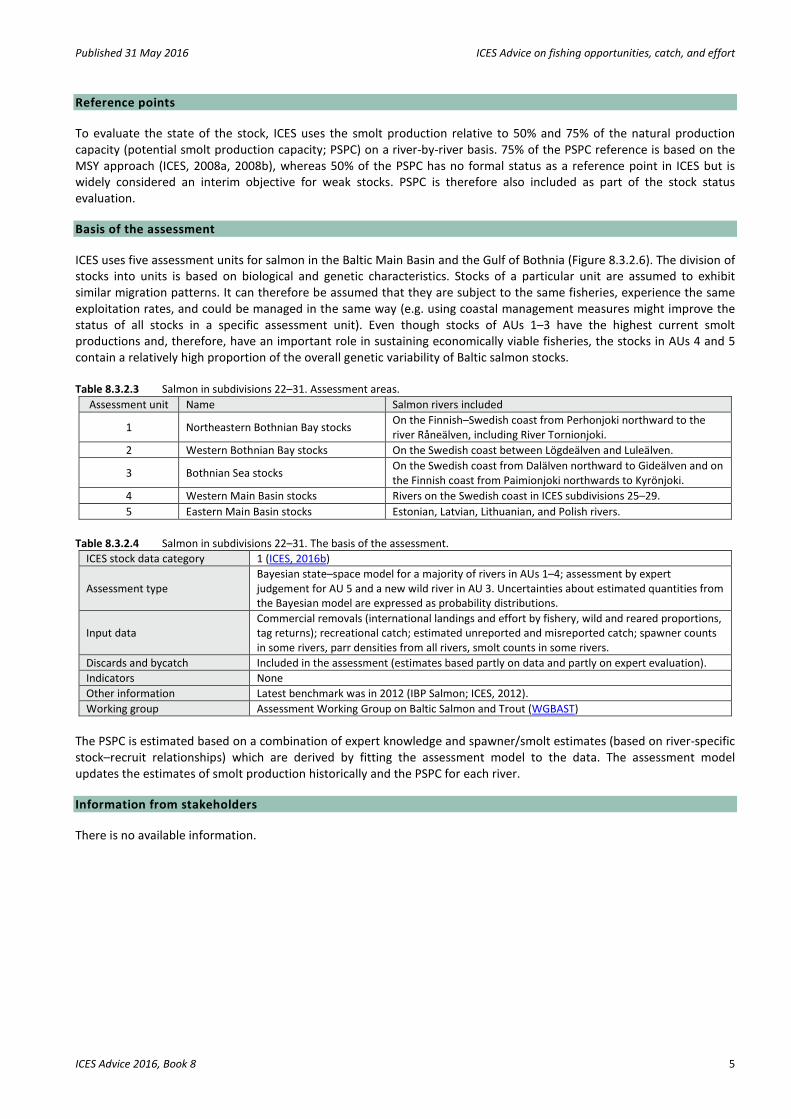
Reference points To evaluate the state of the stock, ICES uses the smolt production relative to 50% and 75% of the natural production capacity (potential smolt production capacity; PSPC) on a river-by-river basis. 75% of the PSPC reference is based on the MSY approach (ICES, 2008a, 2008b), whereas 50% of the PSPC has no formal status as a reference point in ICES but is widely considered an interim objective for weak stocks. PSPC is therefore also included as part of the stock status evaluation. Basis of the assessment ICES uses five assessment units for salmon in the Baltic Main Basin and the Gulf of Bothnia (Figure 8.3.2.6). The division of stocks into units is based on biological and genetic characteristics. Stocks of a particular unit are assumed to exhibit similar migration patterns. It can therefore be assumed that they are subject to the same fisheries, experience the same exploitation rates, and could be managed in the same way (e.g. using coastal management measures might improve the status of all stocks in a specific assessment unit). Even though stocks of AUs 1–3 have the highest current smolt productions and, therefore, have an important role in sustaining economically viable fisheries, the stocks in AUs 4 and 5 contain a relatively high proportion of the overall genetic variability of Baltic salmon stocks. Table 8.3.2.3 Salmon in subdivisions 22–31. Assessment areas.
Assessment unit Name Salmon rivers included
1 Northeastern Bothnian Bay stocks On the Finnish–Swedish coast from Perhonjoki northward to the river Råneälven, including River Tornionjoki.
2 Western Bothnian Bay stocks On the Swedish coast between Lögdeälven and Luleälven.
3 Bothnian Sea stocks On the Swedish coast from Dalälven northward to Gideälven and on the Finnish coast from Paimionjoki northwards to Kyrönjoki.
4 Western Main Basin stocks Rivers on the Swedish coast in ICES subdivisions 25–29. 5 Eastern Main Basin stocks Estonian, Latvian, Lithuanian, and Polish rivers.
Table 8.3.2.4 Salmon in subdivisions 22–31. The basis of the assessment.
ICES stock data category 1 (ICES, 2016b)
Assessment type Bayesian state–space model for a majority of rivers in AUs 1–4; assessment by expert judgement for AU 5 and a new wild river in AU 3. Uncertainties about estimated quantities from the Bayesian model are expressed as probability distributions.
Input data Commercial removals (international landings and effort by fishery, wild and reared proportions, tag returns); recreational catch; estimated unreported and misreported catch; spawner counts in some rivers, parr densities from all rivers, smolt counts in some rivers.
Discards and bycatch Included in the assessment (estimates based partly on data and partly on expert evaluation). Indicators None Other information Latest benchmark was in 2012 (IBP Salmon; ICES, 2012). Working group Assessment Working Group on Baltic Salmon and Trout (WGBAST)
The PSPC is estimated based on a combination of expert knowledge and spawner/smolt estimates (based on river-specific stock–recruit relationships) which are derived by fitting the assessment model to the data. The assessment model updates the estimates of smolt production historically and the PSPC for each river. Information from stakeholders There is no available information.
Published 31 May 2016 ICES Advice on fishing opportunities, catch, and effort
6 ICES Advice 2016, Book 8
History of the advice, catch, and management Table 8.3.2.5 Salmon in subdivisions 22–31 (Main Basin and Gulf of Bothnia). ICES advice for salmon, landings, total catches, and
agreed TACs; all numbers in thousands of fish. Landings and total catch figures for 2015 are preliminary.
Year ICES advice Predicted catch corresponding
to advice TAC Landings
^ at sea Catch^^ at sea
River catch
1987 No increase in effort - 729 957 11 1988 Reduce effort 543 716 13 1989 TAC 850 755 1001 18 1990 TAC 861 1179 28 1991 Lower TAC - 630 857 27 1992 TAC 688 619 845 26 1993 TAC 500 650 549 753 25 1994 TAC 500 600 454 630 21 1995 Catch as low as possible in offshore and coastal fisheries - 500 501 758 27 1996 Catch as low as possible in offshore and coastal fisheries - 450 486 753 44 1997 Catch as low as possible in offshore and coastal fisheries - 410 370 629 56 1998 Offshore and coastal fisheries should be closed - 410 369 575 37 1999 Same TAC and other management measures as in 1998 410 410 313 588 37 2000 Same TAC and other management measures as in 1999 410 450 363 689 35 2001 Same TAC and other management measures as in 2000 410 450 388 634 39 2002 Same TAC and other management measures as in 2001 410 450 362 590 36 2003 Same TAC and other management measures as in 2002 410 460 350 614 29 2004 Same TAC and other management measures as in 2003 410 460 410 828 32
2005 Current exploitation pressure will not impair the possibilities of reaching the management objective for the stronger stocks. - 460 293 504 39
2006
Current exploitation pressure will not impair the possibilities of reaching the management objective for the larger stocks. Long-term benefits for the smaller stocks are expected from a reduction of the fishing pressure, although it is uncertain whether this is sufficient to rebuild these stocks to the level indicated in the Salmon Action Plan.
- 460 196
304
24
2007 ICES recommends that catches should not increase. 324 429 182 296 30
2008 ICES recommends that catches should be decreased in all fisheries. - 364 136 171 58
2009 ICES recommends no increase in catches of any fisheries above the 2008 level for SDs 22–31. - 310 172 296 41
2010 TAC for SDs 22–31 133 294 141 258 23 2011 TAC for SDs 22–31 120 250 144 222 25 2012 TAC for SDs 22–31 54 123 128 170 63 2013 TAC for SDs 22–31 54 109 106 145 51
2014
TAC for SDs 22–31, corresponding to reported commercial sea landings assuming discards, unreporting, and misreporting as in 2012 (corresponding total commercial sea removals are given in brackets)
78 (116*) 107 110 134 55
2015
Total commercial sea catch for SDs 22–31 (estimates of the split of the catch in 2013 into: unwanted, wanted and reported, wanted and unreported, wanted and misreported, are given in brackets).
116 (11%, 68%, 10%, 11%) 96 97 161 64
2016
Total commercial sea catch for SDs 22–31 (estimates of the split of the catch in 2014 into: unwanted, wanted and reported, wanted and unreported, wanted and misreported, are given in brackets).
116 (10%, 77%, 7%, 6%) 96
2017
Total commercial sea catch for SDs 22–31 (estimates of the split of the catch in 2014 into: unwanted, wanted and reported, wanted and unreported, wanted and misreported, are given in brackets).
116 (10%, 77%, 7%, 6%)
^Total reported catches including recreational catches. ^^Estimated total catches including discards, mis- and unreporting. *Value corresponds to total commercial sea removals, including reported landings, unreporting, misreporting, and dead discards.
Published 31 May 2016 ICES Advice on fishing opportunities, catch, and effort
ICES Advice 2016, Book 8 7
History of catch and landings The salmon fishery has changed considerably since the beginning of the 1990s (tables 8.3.2.7 and 8.3.2.8, Figure 8.3.2.7). The very high exploitation rate in the offshore and coastal fisheries has decreased successively due to, e.g. (1) regulatory measures such as closed areas and changes in the opening time of fishery; additionally, reduced national quotas since 2012 have restricted salmon catch in some countries, (2) marketing restrictions on large salmon in certain countries due to high dioxin levels, and (3) increased seal damage to catches and gears. The driftnet ban in 2008 decreased offshore catches in 2008 to the lowest value recorded since 1972. However, changes in the application of dioxin regulations in 2009, increases in market price for salmon, and reduced opportunities for income in other fisheries resulted in an increase in offshore longline fishing from 2008 to 2010. Offshore exploitation has thereafter decreased and is now even lower than in 2008. Despite less restrictive dioxin regulations since 2009, these regulations are still suppressing some of the fisheries. Table 8.3.2.6 Salmon in subdivisions 22–31. Catch distribution in 2015.
Catch distribution Total removal (dead catch) (2015) was 943 t (including also non-commercial and river catches), where 91% were nominal landings (commercial and non-commercial in sea and in rivers), 4% estimated dead discards, and 5% estimated unreported and misreported landings.
Table 8.3.2.7 Salmon in subdivisions 22–31 (Main Basin and Gulf of Bothnia). Nominal landings of Baltic salmon in round fresh
weight and in numbers: landings from rivers, coast, and offshore; total; commercial (in numbers) from coast and offshore combined; agreed TAC for subdivisions 22–31.
*For comparison with TAC (includes only commercial catches, except for the years 1993–2000 when also recreational catches at sea are included). **Preliminary.
Published 31 May 2016 ICES Advice on fishing opportunities, catch, and effort
8 ICES Advice 2016, Book 8
Table 8.3.2.8 Salmon in subdivisions 22–31 (Main Basin and Gulf of Bothnia). The table shows total catches (from sea, coast, and river) of salmon, in numbers, in the whole Baltic (subdivisions 22–32), split into: nominal catches by country, discards (including seal-damaged salmon), and unreported catches (PI = probability interval = 90% since 2001 = 95% before then). Discards and unreported catches for the years 2001–2015 are estimated by a different method and different expert-elicited coefficient factors than for the years 1993–2000. Catch figures for 2015 are preliminary.
Year Country reported Discard Estimated misreported
catch**
Total unreported catches*** Total catches
Denmark Estonia Finland Germany Latvia Lithuania Poland Russia Sweden total median PI median 95% PI median PI
The data for 1993–1994 include subdivisions 24–32; the catches in subdivisions 22–23 are normally less than one tonnes. From 1995 data include subdivisions 22–32. Catches from the recreational fishery are included in reported catches for Finland, Sweden (all years), and Denmark (only since 1998). Other countries have no, or very low recreational catches. * In 1993 the Faroe Islands caught 3200 individuals, which is included in the total Danish catches. ** Corresponds only to Polish catch. *** Including also the estimated misreported catch.
ICES Advice on fishing opportunities, catch, and effort Published 31 May 2016
ICES Advice 2016, Book 8 9
Summary of the assessment Table 8.3.2.9 Salmon in subdivisions 22–31. Overview of the status of the Gulf of Bothnia and Main Basin stocks in terms of their
probability of having reached 50% and 75% of the potential smolt production capacity in 2014 from the 2015 assessment (ICES, 2015). The probability values are classified in four groups: Above 90%, between 70% and 90%, between 30% and 70%, and below 30%. For stocks in AUs 1–4 (except Testeboån) the results are based on the assessment conducted in 2015. Results for Testeboån and AU 5 stocks are based on expert judgement and no precise probabilities can be presented for these stocks.
Table 8.3.2.10 Salmon in subdivisions 22–31. River-specific probabilities of achieving 75% of the PSPC in 2021 or 2020 (depending on
the assessment unit) under the projection scenarios from the 2015 assessment (ICES, 2015). Probabilities greater than 0.70 are shaded green.
River Year of comparison Probability of meeting 75% of PSPC
and 70% Below 30% Probability Above 90%Between 70%
and 90%Between 30%
and 70% Below 30%
Tornionjoki 0.69 X 0.16 XSimojoki 0.78 X 0.23 XKalixälven 1.00 X 0.82 XRåneälven 0.73 X 0.34 X
Piteälven 1.00 X 0.96 XÅbyälven 0.90 X 0.61 XByskeälven 0.97 X 0.72 XKågeälven 0.31 X 0.17 XRickleån 0.00 X 0.00 XSävarån 0.83 X 0.51 XUme/Vindelälven 0.98 X 0.57 XÖreälven 0.37 X 0.15 XLögdeälven 0.76 X 0.44 X
Ljungan 0.74 X 0.46 XTesteboån n.a. X n.a. X
Emån 0.00 X 0.00 XMörrumsån 1.00 X 0.96 X
Pärnu n.a. X n.a. XSalaca n.a. X n.a. XVitrupe n.a. X n.a. XPeterupe n.a. X n.a. XGauja n.a. X n.a. XDaugava n.a. X n.a. XIrbe n.a. X n.a. XVenta n.a. X n.a. XSaka n.a. X n.a. XUzava n.a. X n.a. XBarta n.a. X n.a. XNemunas n.a. X n.a. X
Unit 3
Unit 5
Unit 4
Probability of reaching 50% of PSPC Probability of reaching 75% of PSPC
Unit 1
Unit 2
Published 31 May 2016 ICES Advice on fishing opportunities, catch, and effort
10 ICES Advice 2016, Book 8
Figure 8.3.2.2 Salmon in subdivisions 22–31 (Main Basin and Gulf of Bothnia) from the 2015 assessment (ICES, 2015). Post-smolt survival for wild and hatchery-reared salmon. Posterior probability distribution (median and 90% PI).
Figure 8.3.2.3 Salmon in subdivisions 22–31 from the 2015 assessment (ICES, 2015). Top panels: Annual abundances of 1-sea-winter salmon (1SW) available to the fisheries. Four months of adult natural mortality are taken into account (from 1 May until 1 September) to cover natural mortality during the fishing season after the post-smolt mortality phase. Bottom panels: Annual abundances of multi-sea-winter salmon (MSW) available to the fisheries. Six months of adult natural mortality are taken into account (from 1 January until 1 July) to cover natural mortality during the fishing season. The left panels are for wild salmon and the right panels for wild and reared salmon together. The predicted development in abundance following projection Scenario 1 is also indicated.
ICES Advice on fishing opportunities, catch, and effort Published 31 May 2016
ICES Advice 2016, Book 8 11
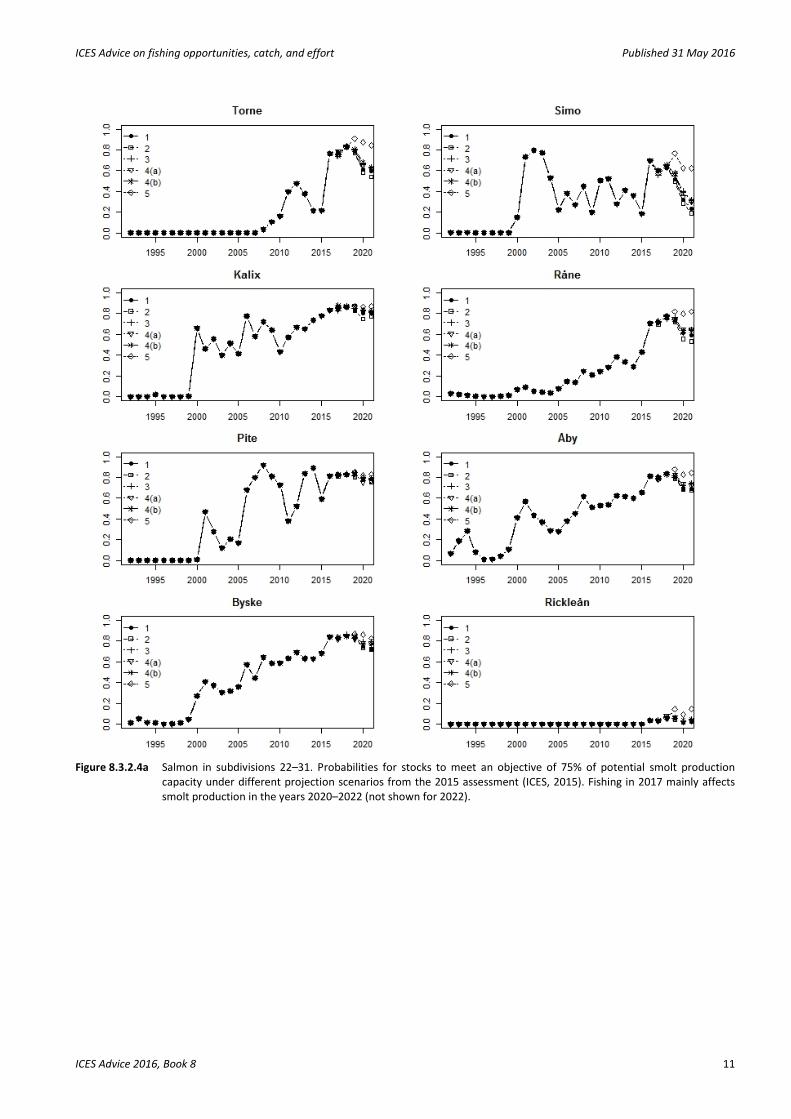
Figure 8.3.2.4a Salmon in subdivisions 22–31. Probabilities for stocks to meet an objective of 75% of potential smolt production capacity under different projection scenarios from the 2015 assessment (ICES, 2015). Fishing in 2017 mainly affects smolt production in the years 2020–2022 (not shown for 2022).
Published 31 May 2016 ICES Advice on fishing opportunities, catch, and effort
12 ICES Advice 2016, Book 8
Figure 8.3.2.4b Salmon in subdivisions 22–31. Probabilities for stocks to meet an objective of 75% of potential smolt production
capacity under different projection scenarios from the 2015 assessment (ICES, 2015). Fishing in 2017 mainly affects smolt production in the years 2020–2022 (not shown for 2022).
ICES Advice on fishing opportunities, catch, and effort Published 31 May 2016
ICES Advice 2016, Book 8 13
Figure 8.3.2.5a Salmon in subdivisions 22–31. Median values and 90% probability intervals for smolt abundances in different rivers in projection Scenario 1 from the 2015 assessment (ICES, 2015). Fishing in 2017 mainly affects smolt production in the years 2020–2022 (not shown for 2022).
Published 31 May 2016 ICES Advice on fishing opportunities, catch, and effort
14 ICES Advice 2016, Book 8
Figure 8.3.2.5b Salmon in subdivisions 22–31. Median values and 90% probability intervals for smolt abundances in different rivers in projection Scenario 1 from the 2015 assessment (ICES, 2015). Fishing in 2017 mainly affects smolt production in the years 2020–2022 (not shown for 2022).
ICES Advice on fishing opportunities, catch, and effort Published 31 May 2016
ICES Advice 2016, Book 8 15
Figure 8.3.2.6 Salmon in subdivisions 22–31. Grouping of salmon stocks in six assessment units in the Baltic Sea. The genetic variability between stocks of an assessment unit is smaller than the genetic variability between stocks of different units. In addition, the stocks of a particular unit exhibit similar migration patterns.
Latvia
Lithuania
Poland
Russia
Russia
Finland
Sweden
Germany
0 100 200 km
Åbyälven
Drawa
Odr
a
IijokiSimojoki
Tornionjoki
Oulujoki
Råneälven Byskeälven
Emån
Mörrumsån
Vistul
a
Neumunas, Minja
Saka Venta
Irbe
DaugavaGauja
Vasalemma
Keila
Kokemäenjoki
Gulf of Finland
BothnianSea
Baltic Main Basin
Dalälven
Skellefteälven Vindelälven
Umeälven Lögdeälven
Ångermanälven
Piteälven
Kalixälven Luleälven
Indalsälven
Ljungan
Ljusnan
Salaca
Estonia
NevaLuga
Narva
12
4
6
5
Assessment Units
3
Published 31 May 2016 ICES Advice on fishing opportunities, catch, and effort
16 ICES Advice 2016, Book 8
Figure 8.3.2.7 Salmon in subdivisions 22–31. Total removals (dead catch) in numbers in the years 1987–2014: river catches (mainly recreational, but including also some commercial fishing) and removals at sea (split into commercial and recreational nominal landings, unreported and misreported landings, and dead discards). Commercial sea catch also includes recreational sea catch in 1987–2000.
Sources and references EU. 2011. Proposal for a Regulation of the European Parliament and of the Council establishing a multiannual plan for the Baltic salmon stock and the fisheries exploiting that stock. COM/2011/0470 final – 2011/0206 (COD). http://eur-lex.europa.eu/legal-content/EN/TXT/?uri=CELEX:52011PC0470.
ICES. 2008a. Baltic Sea. Report of the ICES Advisory Committee, 2008. ICES Advice 2008, Book 8. 133 pp.
ICES. 2008b. Report of the Workshop on the Baltic Salmon Management Plan Request (WKBALSAL), 13–16 May 2008, ICES Headquarters, Copenhagen, Denmark. ICES CM 2008/ACOM:55. 61 pp.
ICES. 2012. Report of the Inter-Benchmark Protocol on Baltic Salmon (IBPSalmon). By correspondence 2012. ICES CM 2012/ACOM:41. 100 pp.
ICES. 2014. Report of the Baltic Salmon and Trout Assessment Working Group 2014 (WGBAST), 26 March–2 April 2014, Århus, Denmark. ICES CM 2014/ACOM:08. 347 pp.
ICES. 2015. Report of the Baltic Salmon and Trout Assessment Working Group 2015 (WGBAST), 23–31 March 2015, Rostock,Germany. ICES CM 2015/ACOM:08. 362 pp.
ICES. 2016a. Report of the Baltic Salmon and Trout Assessment Working Group (WGBAST), 30 March–06 April 2016, Klaipeda, Lithuania. ICES CM 2016/ACOM:09. 257 pp.
ICES 2016b. General context of ICES advice. In Report of the ICES Advisory Committee, 2016. ICES Advice 2016, Book 1, Section 1.2.