Page 1
University of Rhode Island University of Rhode Island
DigitalCommons@URI DigitalCommons@URI
Open Access Master's Theses
2000
A Comparison of Administration Procedures for the Rey-A Comparison of Administration Procedures for the Rey-
Osterrieth Complex Figure: Flow-Charts vs. Pen-Switching Osterrieth Complex Figure: Flow-Charts vs. Pen-Switching
Jessica Somerville University of Rhode Island
Follow this and additional works at: https://digitalcommons.uri.edu/theses
Recommended Citation Recommended Citation Somerville, Jessica, "A Comparison of Administration Procedures for the Rey-Osterrieth Complex Figure: Flow-Charts vs. Pen-Switching" (2000). Open Access Master's Theses. Paper 1600. https://digitalcommons.uri.edu/theses/1600
This Thesis is brought to you for free and open access by DigitalCommons@URI. It has been accepted for inclusion in Open Access Master's Theses by an authorized administrator of DigitalCommons@URI. For more information, please contact [email protected] .
Page 2
A COMP ARIS ON OF ADMINISTRATION PROCEDURES
FOR THE REY-OSTERRIETH COMPLEX FIGURE:
FLOW-CHARTS VS. PEN-SWITCHING
BY
JESSICA SOMERVILLE
A THESIS SUBMITTED IN PARTIAL FULFILLMENT OF THE
REQUIREMENTS FOR THE DEGREE OF
MASTER OF ARTS
IN
PSYCHOLOGY
THE UNIVERSITY OF RHODE ISLAND
2000
/!)(378 R L/
SCt;~~ 2CJ:D
Page 3
ABSTRACT
The Rey-Osterrieth Complex Figure (ROCF) is commonly used to assess
visuospatial skills, visuoconstruction, visual memory, and executive functioning. In order to
capture the sequential process used while drawing the figure, the order of pen strokes needs
to be recorded. Two traditional methods are used to record this information , the flow-chart
method and the pen-switching method. Although it has been suggested that pen-switching
may interfere with performance, to date, no research has been conducted to assess whether
ROCF performance significantly differs due to administration method . As part of routine
neuropsychological evaluation, 100 inpatients and outpatients were randomly assigned to
either administration method. The Boston Qualitative Scoring System (BQSS) was used to
qualitatively assess any differences between methods. Additionally , BQSS quantitative
summary scores and the 36-point scoring system were used. Results showed essentially no
differences between methods using either the BQSS or the 36-point system. Unexpectedly
however, the flow-chart group performed significantly worse than the pen-switching group
on Copy Cluster Placement , Copy Planning , and Copy Fragmentation . Flow-charts also
took significantly longer to score, though both procedures took the same amount of time to
administer. Contrary to expectation, pen-switching did not unduly distract patients or
negatively affect ROCF performance. In fact, pen-switching appears to be easier to
administer, score, and may possibly contribute to optimal patient performance .
II
Page 4
ACKNOWLEDGMENT
I would like to thank everyone who helped me complete this thesis. In particular, I would
like to thank Dr. Stern for providing me the opportunity to conduct this research in his
clinical practice, as well as for his time, insights, expertise , and encouragement.
Additionally , I would like to thank Drs. Tremont , Westervelt, and Javorsky for their help
with data collection , as well as Dr. Javorsky's tremendous help with scoring . I also want to
thank Drs. Valentino , Long, and Boulmetis for their time and input to the project. Finally,
many thanks to Dr. Berman for his guidance , support , and warmth, which I depend on
greatly .
Ill
Page 5
PREFACE
This master ' s thesis , prepared in standard form, is submitted in partial fulfillment of the
requirements for the MA degree in Psychology. It addresses an issue in the area of
neuropsychological assessment.
iv
Page 6
TABLE OF CONTENTS
ABSTRACT ..................... .......................................................... ............................... ii
ACKNOWLEDGEMENT ............................. ................................................... ......... iii
PREFACE ............ ..................................... .................................... .......................... ... iv
TABLE OF CONTENTS ····················· .......... .............................. .................. ........... V
LIST OF TABLES .................. ............................................................................. ...... vii
INTRODUCTION ........ .............. ............................................ ......................... .......... 1
The Rey-Osterrieth Complex Figure (ROCF) ................ ................................. l
Recording of pen strokes ...................... ..................... ............................. ......... 1
Flow-chart method ........... .......................... ................. .................... l
Pen-switching method ............................... ............................ ......... 1
Viewpoints from authors ofROCF scoring systems .................................. ..... 2
Executive dysfunction and pen-switching .................. ............. ........................ 4
Purpose of the Study .......... .......... ............................................................... .... 5
Study Hypotheses ........ ...................... ................................ ............ . 6
METHODS .................................... ............................................... ........ ..................... 7
Participants ....... ........................... ........................................... ........ ............. .... 7
Materials .................... ............. ............................. ............................................ 7
Boston Qualitative Scoring System (BQSS) ........... ................ ....... 7
Reliabi lity and validity of BQSS ...... ............ .................................. 8
Executive functioning and BQSS ....................... ....... ..................... 8
BQSS variables chosen for study ........................... ......... ............... 9
36-point scoring system .......... ................................ ........ ................ 10
V
Page 7
Procedures ................... .............................................. .................................... .. 10
RESULTS ................... ........................ ............... ................................ ........... ...... ....... 12
BQSS Scores Analyses .................. .............................. ............. ...................... 12
36-Point Score Analyses ........ .......... ................................. ........................ ...... 13
Administration and Scoring Times Analyses .................................. ................ 13
DISCUSSION ............... ......... ........................... .................................. .................. ..... 14
Major Findings ............. ................ .............................................. ............. ........ 14
Secondary Findings (Administration and Scoring Times) ......... ....... .............. 15
Explanation of Major Findings .......... ......................... ............. ....................... 16
Future Directions ................... ............ ............. .................................... ............. 17
Summary and Conclusions ....................................... ................ ............... ........ 17
APPENDIX A ........... .............. ............ ............... .................. ................................. ..... 24
APPENDIX B .......... ...................... ............. ............. ...................... ............................ 25
APPENDIX C .............. ......................... ............ .......................................................... 26
BIBLIOGRAPHY ............................... ....................... ..................... ........................... 27
vi
Page 8
LIST OF TABLES
Table 1: BQSS Qualitative Scores and Quantitative Summary Scores ....... ......... ..... 19
Table 2: Demographic Variables .......... .............................. ........................... ............ 21
Table 3: Group Differences on BQSS Scores and 36-Point Scores ............ ............. . 22
Table 4: Scoring Times Group Differences .................................. .......... ................ ... 23
vii
Page 9
INTRODUCTION
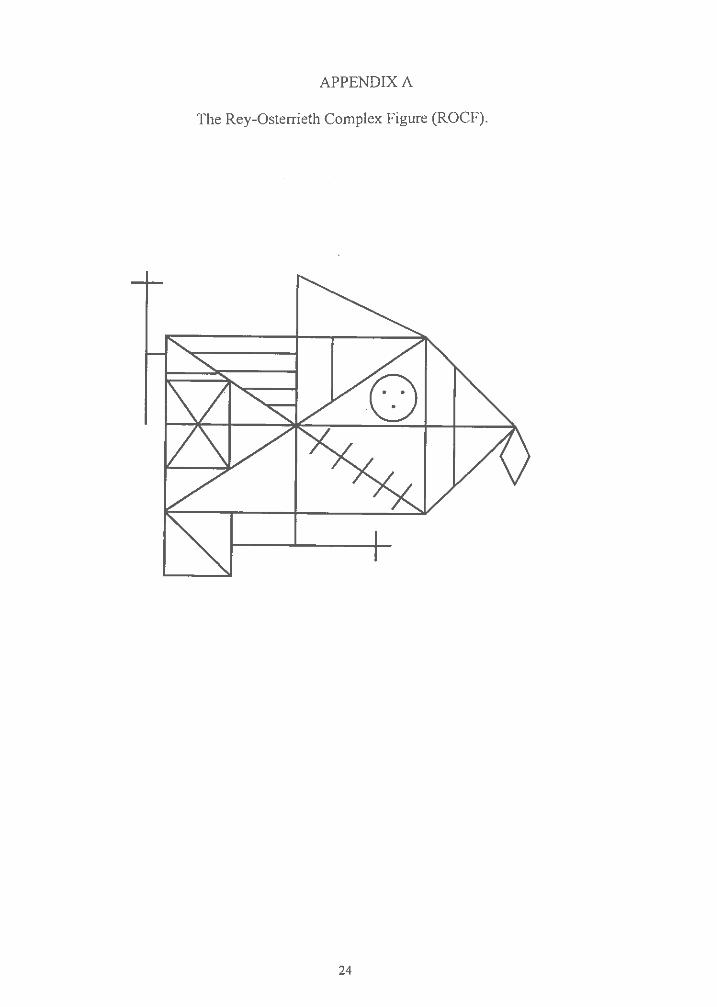
The Rey-Osterrieth Complex Figure (ROCF) (Rey, 1941; Osterrieth, 1944)
(Appendix A) is commonly used by neuropsychologists in both clinical and research
settings as a measure of visuoconstructional and visuospatial skills , as well as visual
memory (Knight & Kaplan, in press ; Knight , Kaplan , & Ireland , 1994). Additionally,
information regarding executive functioning (e.g. , planning, organization , perseveration)
can also be assessed by examining the process or strategy a subject employs while
copying and recalling the figure (Somerville, Tremont , & Stem , 1999; Stem & Prohaska ,
1996). Although many examiners do not record process information , having their
patients use just one black pen while drawing the figure , there has been a growing interest
in quantifying the qualitative aspects ofROCF performance (Troyer & Wishart , 1997).
In order to capture the sequential process used while drawing the figure , the order
of pen strokes needs to be recorded by the examiner. Two traditional methods are used to
record this information , the flow-chart method and the pen-switching method. The
stroke-by-stroke flow-chart method involves reproducing the subject' s drawing on a
separate sheet of paper as the subject draws the figure. The subject is given one pen
which is used to copy the entire figure without interruption. On the flow-chart, the
examiner orders each pen stroke with numbers and uses arrows to note the direction of
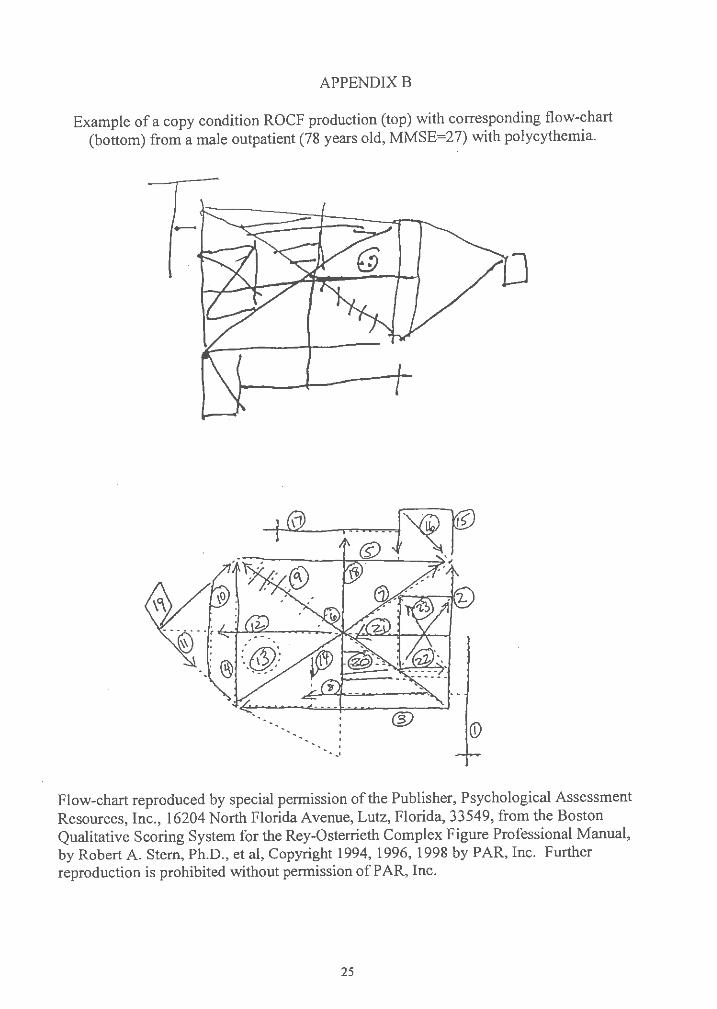
each line drawn (Lezak , 1995; Spreen & Strauss , 1998). An example of a flow-chart is
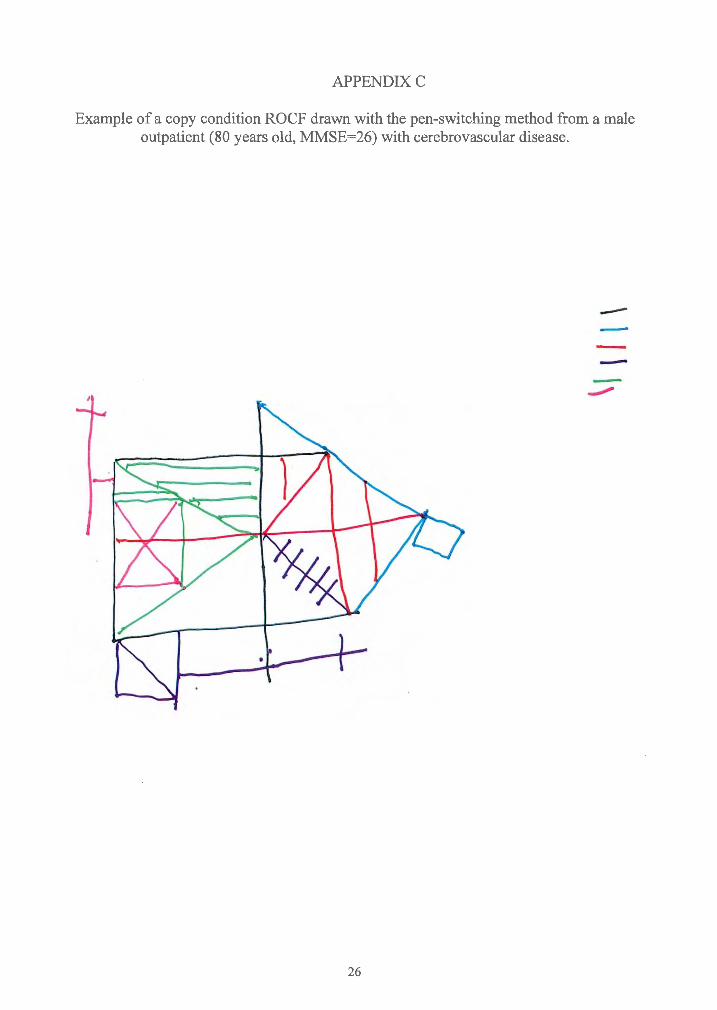
depicted in Appendix B. Alternatively , four to six different colored markers are typicall y
used with the pen-switching method. The pens are quickly switched with the subject at
certain intervals , usually when the subject completes a section of the drawing (Lezak,
1995), or at specified transition points , such as after the major configural elements are
Page 10
completed or when a fragmentation occurs ( e.g., Stern et al., 1999). Some approaches
recommend switching at regularly timed intervals, such as every 30 seconds (Bernstein &
Waber, 1996); however , this is not recommended with some scoring systems because it
provides little information regarding critical transition points that may occur within the
time interval (Stern et al., 1999). Appendix C demonstrates a ROCF drawn with the pen
switching method.
According to some authors (Bernstein & Waber, 1996; Meyers & Meyers, 1995;
Lezak, 1995; Stern et al., 1999), there appears to be advantages and disadvantages to both
administration systems (i.e., flow-chart, pen-switching) for the ROCF. For example,
Meyers and Meyers (1995) state in their manual for the Rey Osterrieth Complex Figure
Test and Recognition Trial, that there are several disadvantages to the pen-switching
method:
First, clinical experience suggests that some respondents, especially those with
moderate-to-severe brain dysfunction, are overly distracted by the requirement to
switch markers. The ability to switch markers easily may also be influenced by
impaired fine-motor control, depth perception, and so forth ... Switching markers
also takes additional administration time, making it problematic given the finding
that the time it takes to copy the stimulus figure discriminates between brain
injured patients and normal subjects (Meyers & Lange , 1994) (p. 7).
Stern and colleagues state similar advantages to the flow-chart method in their
scoring manual for the ROCF, the Boston Qualitative Scoring System (BQSS) (Stern et
al., 1999):
2
Page 11
... a flow chart may be more accurate and complete than colored markers in
depicting the order of pen strokes. Furthermore, the use of a flow-chart
eliminates the risk of any bias or distraction introduced by the examiner when
switching markers. The decision as to which method to use is, in part , based on
characteristics of the respondent, and in part, based on examiner preference. With
regard to respondent characteristics , colored markers should be avoided with
individuals who are either very easily distracted , who are susceptib le to "stimulus
pull" , or who display other clinical difficulties which could result in undo bias by
switch ing markers (p. 18).
However , unlike Meyers and Meyers , Stem and colleagues also suggest that pen
switching may have its own advantages , such as providing the scorer with "an immediate
and rich visual record of the order of pen strokes" and another is that "many examiners
find it more difficult to keep track of the production when they are drawing a flow-chart "
(Stem et al., 1999, p. 18). One method is not suggested over the other in the BQSS
approach , and instead, examiners are instructed to base their decision on characteristics of
the patients and their own preference.
The Developmental Scoring System for the Rey-Osterrieth Complex Figure (DSS)
(Berstein and Waber , 1996) specifically promotes the pen-switching method. The
authors state that this method allows an examiner to visua lly inspect and compare across
protocols , which can be clinically useful. It is also possible that this visua l record may
facilitate scoring, because a flow-chart needs to be "dissected" stroke -by-stroke in order
to examine the organi zation of the drawing. In contrast, they point out that the colors of a
3
Page 12
pen-switched administration allow the planning and fragmentation of a production to
"pop out" visually to the scorer, possibly making scoring easier and quicker.
The suggested ease of pen-switching administration, scoring, and interpretation
would only be useful if pen-switching does not distract the patient or otherwise affect the
patient's performance. Patients referred for neuropsychological examination may exhibit
deficits in various aspects of attention and/or executive functioning. Therefore, the
constant switching of colored pens may not only be distracting , but may also result in
"s timulus pull ," disinhibition, impulsivity , utilization behavior, and difficulties with
planning , organization , fragmentation, and response set maintenance and shifting (e.g. ,
Cummings, 1993; Gershberg & Shimamura, 1995; Kimberg , D'Es posito , & Farah, 1997;
Lhermitte, Pillon , & Serdaru, 1986; Matteson & Levin, 1990; Miller, 1992; Starkstein &
Robinson , 1997; Stern and Prohaska, 1996; Stuss & Benson, 1986; Varfaellie & Heilman ,
1987). For example, the interruption of pen-switching may exacerbate difficulties with
response set maintenance and shifting when patients direct attention to the drawing , to the
examiner handing the pen, to the pen, and then back to where they left off in the drawing
sequence. Also , the pen itself may "pull" some patients and take their attention away
from the task, getting them off-course. The interjection of new stimuli and demands
during the task may also exacerbate problems with disinhibition. It is, therefore, quite
possible that completing a ROCF while pen-switching requires more executive control
and intact attentional skills than completing one in which the patient is confined to one
pen and the task at hand. Consequently, the production may become more fragmented
and poorl y organized. A haphazard production typically violates the overall gestalt of the
figure and may result in lower accuracy scores due to the distortion that can result from
4
Page 13
misaligned elements and misplaced details (Stern & Prohaska, 1996). In addition, the use
of poor strateg y appears to negatively affect recall (Gershberg & Shimamura, 1995;
Lezak , 1995; Morris , Ahmed, Sued. & Toone, 1993; Ringe, Frol , Saine, & Cullum ,
1998), and, therefore , the distraction of pen-switching may , in turn , reduce recall as well.
The purpose of the current study was to examine whether the two traditional
ROCF administration procedures, the flow-chart method and the pen-switching method,
affect ROCF performance in a group of neurologically-impaired patients referred for
neuropsychological examination. To our knowledge, this question has never been
objectively examined. As stated above , it has been suggested by authors of ROCF
scoring systems that the pen-switching method may distract some patients and/or place
greater demands on executive abilities . If this were the case, it would be predicted that
patients receiving this method would produce more fragmented and poorly planned
productions that may also be less accurate . Moreover , it would also be predicted that
recall would be affected by reduced initial organization in the copy condition.
Performance s on the two methods were compared using the traditional 36-point scoring
approach (Lezak , 1995; Osterrieth, 1944), as well as with the BQSS. The BQSS was
used because it allows for both a qualitative and quantitative analysis of the ROCF
productions. In particular , scores developed to be sensitive to executive functioning were
chosen to demonstrate whether pen-switching exacerbates executive deficits , and whether
a production is inaccurate because of poor planning and fragmentation or because of
other factors (i.e., neatness). The Immediate Retention (IR) and Delayed Retention (DR)
Summary Score s of the BQSS, which quantitatively assess the amount of information lost
between conditions , were also examined.
5
Page 14
Therefore , the following study hypotheses were proposed:
1. Due to the proposed higher demand on executive functions, pen-switched ROCF
productions were hypothesized to be more fragmented, more poorly planned , and less
organized than the flow-chart production s. Additionally, they should be more
perseverative , less neat, more confabulated (in the delay conditions) , as well as more
expanded (both horizontally and vertically) than flow-chart productions. These
findings should be present in all three conditions of the ROCF (Copy, Immediate, and
Delay) , except the Confabulation score, which should only be reduced in the delay
conditions
2. The effects related to executive demands (Hypothesis # 1) were proposed to indirectl y
result in reduced accuracy and placement of the ROCF elements (Configurals ,
Clusters, Details) within the Copy condition. In addition, the delayed productions in
the pen-switching group should also be recalled in a less accurate and poorly placed
manner.
3. The poorer executive scores in the pen-switching group (Hypothesis #1) should also
indirectly affect the amount of information recalled, in both the Immediate and Delay
conditions. Therefore , Presence scores (for Configurals , Clusters , and Details) in the
recall conditions should be lower in the pen-switching group, as should the summary
scores: Immediate Presence and Accuracy (IPA), Delayed Presence and Accuracy
(DP A), Immediate Retention (IR), and Delayed Retention (DR) should also be lower
in the pen-switching group compared to the flow-chart group.
6
Page 15
METHOD
Participants
Participants included inpatient and outpatient neurologic and neuropsychiatric
patients referred for neuropsychological evaluation at the neuropsychology service of a
large urban academic medical center. Prior to the examination , subjects were randomly
assigned to one of two groups, the pen-switching group or the flow-chart group. It was
determined that a sample size of 50 per group would be necessary based on a medium
effect size, power of .80, and alpha set at .05 ( one-tailed) (Lipsey , 1990). A total of 100
patients (43 inpatients and 57 outpatients) were examined; 47 received the flow-chart
method and 53 received the pen-switching method. The two groups did not significantly
differ in sex, age, handedness , race, education, work status, occupational category , and
marital status (Table 2). The sample included a wide variety of diagnostic groups,
including, dementia (27%), traumatic brain injury (17%), stroke/cerebral vascular disease
(14%), psychiatric disorder (9%), multiple sclerosis (6%), brain neoplasm (4%), diabetes
(4%), cognitive disorder NOS (3%), epilepsy (3%), and other neurologic /medical
disorder (e.g., meningitis, hydrocephalus , anoxia) (13%) . Each diagnostic category was
equally represented in both groups, as was duration of illness.
Materia ls
The copy, immediate, and delay conditions of the ROCF (Rey, 1941; Osterrieth,
1944) were scores using the BQSS (Stem et al., 1999). A major advantage to using this
scoring system is its ability to assess several key qualitative features of the ROCF
production. It is also the most comprehensive qualitative scoring system available for the
ROCF, with 17 qualitative ratings per condition and 5 quantitative summary scores
7
Page 16
(Table 1). The BQSS has been normed on about 500 adults, aged 18-94. Interrater
reliability studies have demonstrated that the majority of scores have excellent reliabili ty
(Stern et al., 1994; Stern et al. , 1999). The BQSS also appears to have good discriminant
validity , as was demon strated with Attention Deficit Hyperactivity Disorder (ADHD) in
adults (Schreiber, Javorsky , Robinson, & Stern , in press) and children (Cahn , Marcotte,
Stern , Arruda, Akshoomoff, & Leshko, 1996) , and discriminating detoxified alcoholics
from controls (Dawson & Grant, 2000) and traumatic brain injured patients from normal
controls (Javorsky , Rosenbaum, & Stern , 1999). BQSS scores have also been shown to
discriminate effec tively between patients with Alzheimer's dementia and ischemic
vascular dementia (Javorsky & Stern , 1999) , and between Parkinson ' s dementia,
Alzheimer ' s dementia, ischemic vascu lar dementia, and controls (Freeman et al, in
press). The BQSS Summary Score, Copy Presence & Accuracy (CPA), also has
excellent convergent validity with the traditional 36-point summary score (Stern et al.,
1999).
In addition to measuring other qualitative features of visuoconstructive ski lls and
visual memory, four of the BQSS ' 17 scores (Planning, Fragmentation , Neatness, and
Perseveration) and the Organization summary score were developed to be sensitive to
executive dysfunction. Somerville et al. (1999) investigated the convergent validity
between the BQSS' exec utive functioning scores with scores of other standardi ze d
neurops ychological tests commonly believed to mea sure executive functioning . The
study found that the BQSS scores developed to be sensitive to executive functioning were
significantly related to performance on traditional executive measure s (e .g., Wisconsin
Card Sorting Task , Trail Making Test , Controlled Word Association Test, Similarities
8
Page 17
Subtest of the Weschler Adult Intelligence Scale), and that the strengths of the
relationships were quite similar to the relationships found among the traditional executive
tests. In addition , groups of patients with either intact, mild, or severe executive
dysfunction were differentiated using the Organization summary score .
The BQSS divides the ROCF into three hierarchically arranged elements (i.e.,
Configurals , Clusters , Details) (Stern et al., 1999) each of which are scored according to
their presence , accuracy (for Configura ls and Clusters), and placement (for Clusters and
Details). Scores range from a poor score of Oto a good score of 4. In addition, several
other scores are based on the entire production (e.g., fragmentation , planning , horizontal
expansion). The following BQSS scores represented the dependent variables under
investigation: Configural Accuracy, Cluster Accuracy, Cluster Placement , Detail
Placement, Fragmentation, Planning, Neatness , Perseveration , Confabulation , Horizontal
Expansion, and Vertical Expansion. In the recall conditions , Configural Presence ,
Cluster Presence , and Detail Presence were also examined . The first four variables were
chosen in order to examine whether pen-switching affects the accuracy and placement of
the ROCF elements. Previous research has suggested that Accuracy and Placement
scores are sensitive to executive dysfunction (Cahn et al., 1996; Silva, et al., 1995; Suhr
et al., 1995). The quantitative Summary Score, Copy Presence and Accuracy (CPA), was
analyzed in order to see if the combination of these scores (see Table 1) results in group
differences. The Planning, Fragmentation , and Perseveration variables (as well as the
Organization Summary Score) were also chosen because these scores appear to be valid
measures of executive dysfunct ion (Somerville et al., 1999). It has also been suggested
that executive impairment (particularly impulse control and disinhibition) can affect
9
Page 18
Neatness , Confabulation (in the delay conditions) (Stern et al., 1999), and Expansion
scores (Cahn et al., 1996), and therefore these scores were also included. The delayed
condition presence and accuracy summary scores (Immediate Presence and Accuracy ,
IPA; Delayed Presence and Accuracy , DPA) , were chosen to examine whether pen
switching impacts the amount of information (number of elements present) recalled.
Other BQSS variables were excluded from all analyses (e.g. , Rotation, Asymmetry)
because they were not apriori assumed to be affected by pen -switching. Additionally , the
quantitative summary scores, Immediate Retention (IR), and Delayed Retention (DR)
were also examined to assess the amount of information lost between conditions . Finally ,
the Organization summary score was chosen because it appears to be a valid overall
measure of executive dysfunction (Somerville, Tremont , & Stern, 1999). BQSS
summary scores are described in Table 1. In addition to the summary scores , the
qualitative Confabulation score was also assessed in the immediate and delayed
conditions.
In addition to the BQSS, the traditional 36-point scoring system was used. Each
production was scored using the specific criteria as outlined in Duley et al. (1993).
Procedures
Patients were randomly assigned to receive either the flow-chart or pen-switching
method prior to their neuropsychological evaluations. Evaluations were conducted by
either a licensed clinical neuropsychologist (G.T.) or one of two post-doctoral fellows in
clinical neuropsychology (D.J. , H.W.). As part of the routine clinical examination ,
information was gathered on each patient regarding recent events leading to the current
injury or illness, previous medical and psychiatric history, as well as educational, work ,
IO
Page 19
and social history. This information was gathered from the medical record, family
members , and when appropriate , from the patients themselves.
The BQSS professional manual provides detailed instructions for the
administration of the ROCF for both the flow-chart and pen-switching methods (Stem et
al., 1999). All clinicians received intensive training to standardize the assessment
protocol, as outlined in the BQSS manual. Patients assigned to the flow-chart method
were given one black felt-tipped marker to copy the figure, and the examiner reproduced
the patient's drawing on the BQSS response sheet (or on a plain paper when necessary ,
i.e., the figure was extremely distorted). Examiners used arrows to indicate the
directionality of a line drawn by the patient , and numbered each line to indicate the
sequence of pen strokes (see Figure 1). In the pen-switching condition, three to six
colored felt-tipped markers (i.e., black, blue, red, purple, green, pink) were used.
Directly before giving the instructions , the pens were uncapped and set beside the
stimulus . The pens were switched according to the guidelines suggested in the BQSS
manual ( e.g., after the first element is completed, when a Configura l Element is
fragmented), and the order of the pens were kept constant across subjects, and across
conditions (copy, immediate, and delay).
All subjects received a copy condition, immediate recall, and 20-30 minute
delayed recall. For both the flow-chart and pen-switching methods , administration times
for each condition were recorded from the beginning of the presentation of the blank
response form to the completion of the production. As part of routine neurop sychological
assessment, other neuropsychological tests were given within the 20-30 minute time
period that existed between the immediate and delayed recall conditions. In order to
11
Page 20
avoid confounding the visual memory recall for the delayed condition , visuospatial and
visuoconstructional tasks were not used as filler tasks. All ROCF productions were
scored using the BQSS and the 36-point scoring system by a single post-doctoral fellow
in clinical neuropsychology who has extensive scoring experience with both scoring
systems . The scorer was kept blind to the specific hypotheses of this research study in an
attempt to control bias in scoring.
RESULTS
BOSS Scores
In order to control for Type I error , a multivariate Hotelling's test was first
conducted for the copy condition. The BQSS variables of interest in the copy condition
(Configural Accuracy , Cluster Accuracy, Cluster Placement , Detail Placement ,
Fragmentation, Planning, Neatness , Perseveration , Horizontal Expansion, and Vertical
Expansion) were the dependent variables in the analysis , and the administration method
(i.e., pen-switching versus flow-chart) was the independent variable. Using a one-tailed
test with the a priori prediction that the flow-chart group would perform better on these
variables than the pen-switching group, there were no significant differences. However,
an exploratory two-tailed analysis revealed that the T2 test was significant, E(l 0,
87)=1.963, 2 < .05. Follow-up independenq -tests (Table 3) revealed that the pen
switching group scored significantly better than the flow-chart group on three BQSS
variables , Copy Cluster Placement , Copy Fragmentation , and Copy Planning . There
were no other significant between group differences.
Multivariate Hotelling's T2 tests for the Immediate and Delayed Conditions were
performed on the same variables as the Copy condition , plus the Presence scores
12
Page 21
(Configural , Cluster , and Detail) and the Confabu lation score, and neither test was
significant.
To assess whether pen-switching in the Copy condition would consequently
impact patients ' productions in the delayed conditions , IPA, DPA, IR, and DR summary
scores were assessed . These summary scores, along with the Organization summary
score, were analyzed using independent t-tests , and the Bonferroni procedure was used to
control for Type I error (Q <.05/5 = 12<.0l). None of the Summary variable s were
significantly different. However, examinat ion of the mean Summary scores indicated
that for each of these variables , the pen-switching group performed better than the flow
chart group.
In addition to the parametric analyses described above, nonparametric Mann
Whitney U tests were also performed of the nature of the BQSS qualitative scores (i.e.,
some assumptions of parametric tests may be violated). Result s of the Mann -Whitney U
tests were nearly identical to the parametric tests, in that there were no significant group
differences , after Bonferroni correction, and those variables that did approach
significan ce were in the opposite direction to apriori prediction (the pen-switching group
performe d better).
36-point Scores
Using independent t-tests, there were no significant differences, across all three
conditions , using the 36-point scoring system.
Administration and Scoring Times
In the Copy condition, administration times for both the pen-switching (M=240
seconds, SD=l 10 seconds) and flow-chart (M=262 seconds, SD=141 seconds) conditions
13
Page 22
were not significantly different. However , scoring times (using the BQSS), did differ
between the two groups. Flow-chart productions took significantly longer to score than
pen-switched productions in the copy and immediate conditions. In the delayed
condition, flow-charts also took longer to score than pen-switched productions, though
this difference only approached significance. Table 4 depicts the means and standard
deviations for the scoring times in all three conditions . There were no significant
differences in scoring time for the 36-point scoring system, as wou ld be expected as pen
stroke order is not assessed with this method.
DISCUSSION
It has been suggested by authors of some ROCF scoring systems (Meyers &
Meyers , 1995; Stem, 1999) that the pen-switching administration procedure may be
overly distracting to patients, and, therefore , may negatively affect ROCF performance.
Additionally , literature on executive functioning would suggest that the pen-switching
method is more executively demanding due to increased likelihood of distractibility ,
stimulus pull , disinhibition , utilization behavior , and response set maintenance difficulties
(e.g., Cummings , 1993; Gershberg & Shimamura , 1995; Miller, 1992; Stem & Prohaska ,
1996). These views suggest that the added demands of pen-switching could consequently
affect planning, organization , and fragmentation of the figure, as well as reduced
retention on delayed recalls. Results of the current investigation indicate that patients
who were interrupted by switching colored markers were no more likely to have poorly
planned, fragmented, and disorganized productions than patients who used only one pen.
Furthermore , the ROCF productions in the pen-switching condition were also no more
inaccurate , messy , perseverative , or expanded than in the flow-chart condition. Finally ,
14
Page 23
the degree of confabulation and the amount of information recalled and retained, both
immediatel y and over delay, was essentially equiva lent for the two administration
procedures. Quantitative summary scores (i.e., CPA, IP A, DPA) also demonstrated that
the presence and accuracy of elements within the figure did not differ across conditions.
When the figures were scored with the commonly used 36-point scoring system, again
the results confirmed that the overall amount and quality (i.e. , accuracy , placement) of
information copied and recalled were not affected by administration procedure.
A study by Meyers and Lange ( 1994) found that copy administration time
discriminated brain-injured patients from controls, and it was suggested in the Meyers
and Meyers ROCF scoring manual (1995) that pen-switching may confound this finding
by lengthenin g administration time. However, our study did not find any differences in
administration time between the two procedures. Therefore , switching pens did not
increase administration time, and should not affect interpretations based on length of time
to complete a production. Although a time difference was not found in administration
time , scoring time did differ between the two procedures when using the BQSS . In all
three conditions , it took significan tly more time to score a flow-chart production than a
pen-switched one (an average of approximate ly two minutes more in the Copy
condition). When scoring a flow-chart , the order and direction of pen-strokes is
examined sequent ially, thereby making qualitative scoring more laborious. The pen
switc hing method allows for a rich visual record of the strategy employed , includin g the
degree of fragmentation and disorganization (Bernstein & Waber , 1996; Stern, 1999).
This immediate visua l representation appears easier for a scorer to examine and make
scoring judgments , particularly with respect to keeping track of the order of pen-strokes
15
Page 24
(i.e. , planning) . Finally, as would be expected , scoring time did not differ using the 36-
point scoring system because qualitative information (e .g., order of pen strokes) is not
assessed using this system.
The results of the current investigation suggest that either the pen-switching
method or the flow -chart method can be used without significantly affecting ROCF
performance . Some authors have stated that their "clinica l experience" indicates that
pen-switching should be avoided because it is distracting , and it can be influenced by
certain neurologic conditions (e.g. , impaired fine-motor control, depth perception) (e.g.,
Meyers & Meyers , 1995). However, our study failed to support this claim . Rather, we
found that the pen-switching group tended to have higher scores than the flow-chart
group in the majority (71 %) of all qualitative scores assessed, including statistically
significant differences on Copy Cluster Placement , Copy Planning , and Copy
Fragmentation. In an attempt to explain this unexpected finding , we wanted to ensure
that the two groups were comparable with respect to degree of cognitive impairment. An
examination of Mini-Mental Status Examination (MMSE; Folstein, Folstein, & McHugh ,
1975) scores on a subset of patients who received the MMSE (N=41) revealed no group
differences (flow-chart [N=23], M=21.2, SD=6.9; pen -switching [N=18] , M=21.9 ,
SD=7 .5). Therefore, we can only specu late other possible explanations as to why colored
pens may actually facilitate a patient' s performance, instead of the assumed opposite. It
is pos sible that colored pens make the task more engaging for the patient, which could
enhance attention, concentration , and effort. Visualizing the production in an ordered
color sequence could also provide structure, thereb y promoting organization and
facilitating planning. However , given the administration procedure of pen-switching
16
Page 25
(e.g., switching after a fraginentation has occurred), this explanation is unlikely. Perhaps
it is also possible that the pen-switching verbal instructions may raise patients ' awareness
about the recording of the process of figure. Stating that "the colored markers are only
used so that I can remember how you're drawing the figure ... "(Stem et al., 1999, p. 11)
may result in patients actually paying closer attention to the way they are drawing.
The findings of the current study are based on a patient sample consisting of a
wide variety of neurologic and medical disorders, including patients with conditions
expected to result in executive and attentional impairments. Although these results are
well-suited for generalization purposes , they do not tell us if certain conditions, disorders ,
or cognitive deficits may be differentiall y affected by administration procedure. Because
pen- switching may particularly effect the performance in patients with significant
executive impairment , this study should be replicated on a sample of patients with known
frontal-systems dysfunction. Unfortunately, our data did not contain a large enough
subsample of frontal lesioned patients for an exploratory analysis to this question (i.e.,
insufficient power). Future research could also shed light on the surprising trend of pen
switching possibly enhanc ing ROCF performance.
The ROCF can provide useful information in multiple areas of
neurops ychologica l functioning (i.e., visuospatial skills, visuocons truction , visua l
memory , executive dysfunction) , and because of its utility, it remains a popular
neurop sycho logical instrument (Knight & Kaplan , in press). Due to today ' s fiscal and
time demand s, it is essential to be sensitive to efficiency in assessment, without
jeopardizing quality and comprehensi veness. Therefore , the present results suggest that
for most practical purposes , examiners may wish to use the pen-switching method rather
17
Page 26
than the flow-chart method because it is considered easier to administer (Stern et al.,
1999), as well as quicker to score, and it may possibly promote the best effort from
patients. It is important to note that flow-charts still remain useful when a detailed line
by-line representation of the figure is required (e.g., for some research purposes).
However , the results of this study suggests that an examiner should not feel it is
necessary to use flow-charts in order to obtain optimal performance from most patients.
18
Page 27
Table 1. Brief Descriptions of the BOSS Qualitative Scores and Quantitative Summary
Scores Used in the Present Study.
Presence (Configural, Cluster, and Detail) Measures ability to attend to and process specific elements in copy condition and to recall them in the immediate and delayed recall conditions.
Accuracy (Configural and Cluster) General assessment ofvisuoconstructional skill and visuoperceptual ability in the copy condition and adequacy of visual recall in the recall conditions.
Placement (Cluster and Detail) Measures spatial functioning , judgment of angles , and spatial orientation.
Fragmentation Measures integration of information (i.e., whether or not the individual elements are drawn as whole units).
Planning Measures overall planning ability based on the order in which elements are drawn , placement on the page, placement within the figure, and overall integrity of the production.
Neatness Rates how neatly the figure was drawn as evidenced by the number of wavy lines, gaps and overshoots, cross-outs, rounded corners, etc.
Vertical Expansion Size distortion measured by placing a scoring template over the drawing to determine the degree of vertical expansion.
Horizontal Expansion Size distortion measured by placing a scoring template over the drawing to determine the degr ee of horizontal expansion.
Perseveration Measure s the extent of recognizably inappropriate repetition. May take one of two forms: repetition of components within a cluster or replication of an element of the figure (Configural, Cluster, or Detail) .
Confabulation Rating of additions to the figure. May take one of two forms: an intrusion of a previous visuospatial task or a novel addition to the figure that is unrelated either to the original figure or to a previously administered visuospatial task.
19
Page 28
Table 1 (con't.)
Presence and Accuracy (Copy= CPA, Immediate= IPA, and Delayed= DPA) Unweighted arithmetic mean of Configural Presence, Accuracy, Cluster Presence, Cluster Accuracy , and Detail Presence. For the copy condition , it represents a global measure of visuoperceptual accuracy and overa ll visuoconstructional ability. For the recall conditions , it represents the amount and accuracy of information recalled.
Immediate Retention (IR) Measures the percent of information lost or gained from copy to immediate recall.
Delayed Retention (DR) Measures the percent of information lost or gained from immediate recall to delayed recall.
Organization Arithmetic sum of the copy condition Fragmentation and Planning scores, providing a more omnibus measure of organizational skills.
Note. Reproduced by special permission of the Publisher , Psychological Assessment Resources ,
Inc., 16204 North Florida Avenue , Lutz, Florida , 33549, from the Boston Qualitative Scoring
System for the Rey-Osterrieth Complex Figure Professional Manual , by Robert A. Stern, Ph.D.,
et al, Copyright 1994, 1996, 1998 by PAR, Inc. Further reproduction is prohibited without
permission of PAR, Inc.
20
Page 29
Table 2. Demographic Variab les for the Pen -Switching and Flow -Chart Groups.
Demographic
Age
Education
Gender
Handedness
Race
Flow-Chart
57.79 (20.70)
12.91 (3.41)
Means (SD)
Pen -Switching
55.02 (17.89)
13.78 (3.39)
Frequencies (N)
Ma le=23 Female =24
Right =40 Left=6 Ambidextrous= 1
Caucasian=44 African American= 1 Asia~=2 Other=0
21
Ma le=30 Female =23
Right =50 Left=0 Ambidextrous=3
Caucasian =49 African American = 1 Asian = l Other=2
Page 30
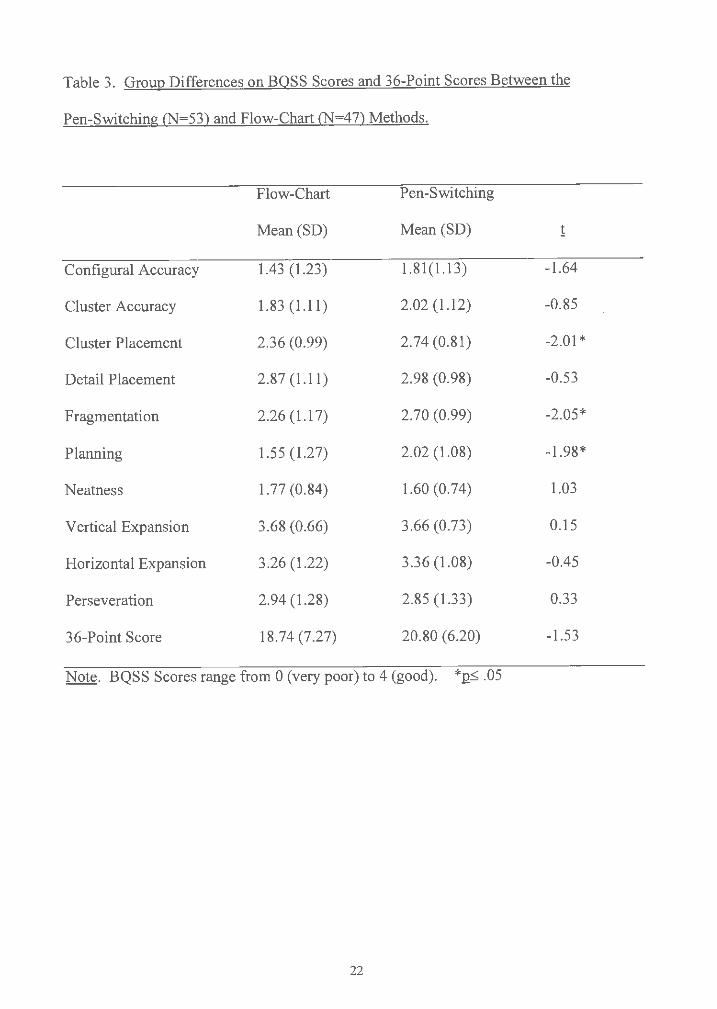
Table 3. Group Differences on BOSS Scores and 36-Point Scores Between the
Pen-Switching (N=53) and Flow-Chart (N=47) Methods.
Flow-Chart Pen-Switching
Mean (SD) Mean (SD) !
Configural Accuracy 1.43 (1.23) 1.81(1.13) . -1.64
Cluster Accuracy 1.83 (1.11) 2.02 (1.12) -0.85
Cluster Placement 2.36 (0.99) 2.74 (0.81) -2.01 *
Detail Placement 2.87 (1.11) 2.98 (0.98) -0.53
Fragme ntation 2.26 (1.17) 2.70 (0.99) -2.05*
Planning 1.55 (1.27) 2.02 (1.08) -1.98*
Neatness 1.77 (0.84) 1.60 (0.74) 1.03
Vertical Expansion 3.68 (0.66) 3.66 (0.73) 0.15
Horizontal Expansion 3.26 (1.22) 3.36 (1.08) -0.45
Perseveration 2.94 (1.28) 2.85 (1.33) 0.33
36-Point Score 18.74 (7.27) 20.80 (6.20) -1.53
Note . BQSS Scores range from O (very poor) to 4 (good). *:ps .05
22
Page 31
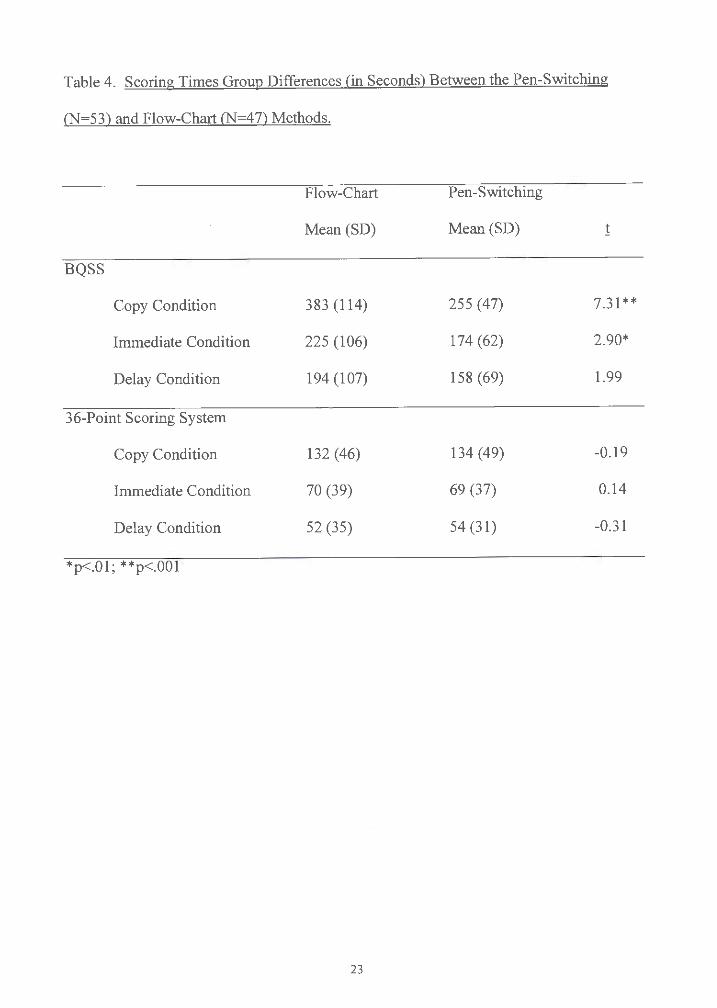
Table 4. Scoring Times Group Differences (in Seconds) Between the Pen-Switching
(N=53) and Flow-Chart (N=47) Methods.
Flow-Chart Pen-Switching
Mean (SD) Mean (SD) !
BQSS
Copy Condition 383 (114) 255 (47) 7.3 1 **
Immediat e Condition 225 (106) 174 (62) 2.90*
Delay Condition 194 (107) 158 (69) 1.99
36-Point Scoring System
Copy Condition 132 (46) 134 (49) -0.19
Immediate Condition 70 (39) 69 (37) 0.14
Delay Condition 52 (35) 54 (3 1) -0.31
*p<.01; **p<.001
23
Page 32
APPENDIX A
The Rey-Osterrieth Complex Figure (ROCF) .
24
Page 33
APPENDIX B
Example of a copy condition ROCF production (top) with corresponding flow-chart (bottom) from a male outpatient (78 years old, MMSE =27) with polycythemia.
Flow-chart reproduced by special permission of the Publisher , Psychological Assessment Resources, Inc., 16204 North Florida Avenue, Lutz, Florida, 33549, from the Boston Qualitative Scoring System for the Rey-Osterrieth Complex Figure Professional Manual, by Robert A. Stern, Ph.D., et al, Copyright 1994, 1996, 1998 by PAR , Inc. Further reproduction is prohibited without permission of PAR, Inc.
25
Page 34
APPENDIXC
Example of a copy condition ROCF drawn with the pen-switching method from a male outpatient (80 years old, MMSE=26) with cerebrovascular disease .
----
26
Page 35
BIBLIOGRAPHY
Bennett-Levy , J. (1984). Determinants of performance on the Rey-Osterrieth
Complex Figure Test: An analysis, and a new technique for single-case assessment.
British Journal of Clinical Psychology, 23, 109-119.
Bernstein , J.H. & Waber , D.P. (1996). Developmental Scoring System for the
Rey-Osterrieth Complex Figure. Odessa , FL: Psychological Assessment Resources, Inc.
Binder , L.M. (1982). Constructiona l strategies on Comp lex Figure drawings after
unilateral brain damage. Journal of Clinical Neuropsycho logy, 4, 51-58.
Cahn, D.A., Marcotte , A.C., Stem , R.A. , Arruda , J.A., Akshoomoff , N.A., &
Leshko , LC. (1996). The Boston qualitative scoring system for the Rey-Osterrieth
Comp lex Figure: A study of children with attention deficit hyperactivity disorder. The
Clinica l Neuropsycho logist, 10, 397-406.
Cherv insky, A.B., Mitrushina , M., & Satz, P. (1992). Comparison of four
methods of scoring the Rey-Osterrieth Complex Figure Drawing Test on four age groups
of normal elderly. Brain Dysfunction, 5, 267-287.
Chiulli , S.J ., Halland, K.Y., LaRue , A., & Garry, P.J. (1995). Impact of age on
drawing the Rey-Osterrieth figure. The Clinical N europsychologi st, 9, 219-224.
Cummings, J.L. (1993). Anatomic and behavioral aspects of frontal-subcortical
circuits. Annals of the New York Academy of Sciences. 769, 1-13.
Dawson , L.K., & Grant , I. (2000). Alcoholics' initial organizational and problem
solving skills predict learning and memory performance on the Rey-Osterrieth Complex
Figure . Journal of the International N europsychologica l Society. 6, 12-19.
27
Page 36
Duley, J.F. , Wilkins , J.W. , Hamby, S.L., Hopkins , D.G ., Burwell , R.D. , & Barry ,
N.S. (1993). Explicit scoring criteria for the Rey-Osterrieth and Taylo r Complex Figures.
The Clinical Neuropsychologist. 7, 29-38.
Freeman, R.Q. , Carew, T.G., Giovannetti , T. , Lamar , M., Cloud, B.S ., Resh , R. ,
Stern , R.A. , Kaplan , E ., & Libon , D.J. (in press) . Visuoconstruction al problems in
dementia: Contribution of executive systems dysfunction. Neuropsychology.
Folstein , M.F., Folstein , S.E., & McHugh, P .R. (1975). Mini-mental state.
Journal of Psychiatric Research, 12, 189-198.
Gershberg, F.B. , & Shimamura , AP. (1995). Impaired use of organizational
strategie s in free recall following frontal lobe damage. Neuropsychologia. 13, 1305-
1333.
Hamb y, S.L., Wilkin s, J.W. , & Barry, N.S. (1993). Organizationa l quality on the
Rey -Osterr ieth and Taylor Complex Figure tests: A new scoring system. Psychological
Assessme nt.~ , 27-33.
Javorsky , D., & Stern , R.A. (1999). Validity of the Boston Qualitati ve Scoring
System (BQSS ) for the Rey-Osterrieth Compl ex Figure in discriminatin g between
Alzheimer 's and vascular dementia [abstract]. Journal of the International
Ne urop sychologi cal Society, 5, 120 .
Javorsky , D.J ., Rosenbaum , J., & Stern, R.A. (1999). Utility of the Boston
Qualitative Scoring System (BQSS) for the Rey-Ost errieth Complex Figure in the
evaluati on of traumati c brain injury [abstract]. Archives of Clinica l Ne urop sychology ,
14, 789-79 0.
28
Page 37
Kimberg , D. Y., D'Esposito , M., & Farah, M.J. (1997). Frontal lobes : Cognitive
neuropsychological aspects. In Feinberg , T.E . & Farah, M.J. (Eds.) , Behavioral
neuro logy and neurop sychology (pp. 409-418 ). New York: McGra w-Hill
Knight , J. & Kaplan , E. (in press). Rey-Osterrieth Com plex Figure Handbook.
Odessa , Fl: Psychological Assessment Resourc es, Inc .
Knight , J., Kaplan , E., & Ireland , L. (1994). Survey findings of the Rey
Osterrieth Comp lex Figure use among INS membership [abstract]. Journal of the
Internat ional Neuro psychologi cal Society, 1, 355.
Lezak, M .D . (1995 ). Neuropsycho logical assessment (3rd ed.). New York:
Oxford Unive rsity Press.
Lipse y, M.W. (1990) . Design sensiti vity: Statistical power for experimental
research. New bury Park: Sage Publicati ons.
Lor ing, D.W. , Lee, G.P. , & Meador , K.J. (1988). Revi sing the Rey-Osterrieth:
Ratin g right hemi spher e recall. Archives of Clinical Neuro psychology, 3, 239-247.
Lhermitte, F., Pillon , B., & Serdaru , M. (1986). Human autonomy and frontal
lobe s. Part I : Imit ation and Utilization behavior: A Neurop sycholo gical Study of 75
Patients. Annals ofNeurology. 19, 326-334.
Matteson , A.J. & Lev in, J.S. (1990). Frontal lobe dysfunction followin g closed
head injury. The Journal of Nervo us and Menta l Disea se, 178, 282-29 1.
Meyers, J . & Lange , D. (1994). The complex figure: A recognition subtest. The
Clinical Ne urop svchologist, 8, 153-166.
Meyers , J.E . & Meyers, K.R . (1995). Rey Complex Figure Test and Recognition
Tria l. Ode ssa, FL: Psychological Assessment Resour ces, Inc.
29
Page 38
Miller , L.A. (1992). Impulsivity , risk-taking , and the ability to synthes ize
fragmented information after frontal lobectomy. Neuropsycho logia. 30, 69-79.
Morri s, R.G. , Ahmed , S., Syed, G.M., & Toone, B.K. (1993). Neural correlates
of planning ability: Frontal lobe activation during the Tower of London Test.
Neuropsychologia. 31, 1367-1378.
Osterrieth , P.A. (1944). Le test de copie d'une figure complexe. Archives de
Psychologie, 30, 206-356 .
Rapport , L.J., Dutra, R.L., Webster , J.S., Charter , R., & Morrill , B. (1995).
Hernispatial deficits on the Rey-Osterrieth Complex Figure drawing. The Clinical
Neuropsychologist, 9, 169-179.
Rey, A. (1941). L 'examin psychologique dans les cas d ' escephalopathie
traumatique. Archives de Psychologie, 28, 286-340.
Ringe , W.K., Fro!, A.B. , Saine, K.C., & Cullum, C.M. (1998). Organization and
its relationship with other measures of executive functioning in memory. Archives of
Clinical Neuropsychology,14 , 142.
Schreiber , H.E. , Javorsky , D.J. , Robinson , J., & Stem, R.A. (in press). Rey
Osterrieth Complex Figure performance in adults with attention deficit hyperactivity
disorder: A validation study of the Boston Qualitative Scoring System. The Clinical
Neuropsycho logist.
Shorr, J.S., Delis, D.C. , & Massman , P.J. (1992). Memory for the Rey-Osterrieth
Figure: Perceptual clustering, encoding, and storage. Neuropsycho logy. 6, 43-50.
Silva, S.G, Stem, R.A., Chaisson, N., Singer, E.A., Gaver, V., Watson , J.B. ,
Golden, R.N., & Evan , D.L. (1995). Evidence of mild visuoconstructive impairments in
30
Page 39
HIV infection using the Boston Qualitative Scoring System for the Rey-Osterrieth
Complex Figure [abstract]. Journal of the Internatio nal Neuro psychologica l Society,1,
138.
Somerville, J.A. , Tremont, G., and Stern, R.A. (1999). The Boston Qualitative
Scoring System (BQSS) for the Rey-Osterrieth Complex Figure as a measure of
executive functioning: A convergent validity study [abstract]. Journal of the
International Neuropsychological Society , 2, 118.
Spreen , 0. & Strauss , E. (1998). A compendium of neuropsychological tests:
Administration, norms, and commentary (2nd ed.) . New York: Oxford University Press.
Starkstein, S.E ., & Robinson, R.G. (1997). Mechanism of disinhibitio n after
brain lesions. The Journal of Nervous and Mental Disease, 185, 108-114.
Stern, R.A., Javorsky , D.J. , Singer, E.A. , Singer Harris , N.G ., Somerville, J.A. ,
Duke , L.M. , Thompson, J., & Kaplan , E. (1999). The Boston Qualitative Scoring System
for the Rey -Osterrieth Complex Figure. Odessa, FL: Psycho logical Assessment
Resources , Inc ..
Stern, R .A. & Prohaska, M.L. (1996). Neuropsychological evaluation of
executive functioning. In Dickstein L.L. , Riba, M.B. , Oldham , J.M. (Eds.) , Review of
Psychiatry. Vol.IS (pp. 243-266). Washington: American Psychiatric Press.
Stern , R.A. , Singer, E.A., Duke, L.M ., Singer , N.G. , Morey, C.E. , Daughtrey ,
E.W ., & Kaplan , E. (1994). The Boston Qualitative Scoring System for the Rey
Osterrieth Comp lex Figure: Description and interrater reliability. The Clinical
Neuropsycho logist. 8, 309-322.
31
Page 40
Stuss , D.T., & Benson, D.F. (1986) . The Frontal Lobes. New York: Raven
Press.
Troyer , A.K., & Wishart , H.A. (1997). A comparison of qualit ative scoring
system s of the Rey-Osterrieth Complex figure Test. The Clinical Neuropsycho logis t, 11,
38 1-390 .
V arfae llie, M. & Heilman, F .M. ( 1987) . Response preparation and response
inhibition after lesions of the medi al fronta l lobe. Archives of Neuro logy, 44, 1265-1271.
Visser , R .S.H.(1973). Manual of the Complex Figure Test. Lisse , Netherland s:
Swets & Zeitlinger.
32