+ All Categories
Home > Documents > A Computational Model to Study Urban Traffic Control - IJCTE · @mackenzie.br,...

A Computational Model to Study Urban Traffic Control - IJCTE · @mackenzie.br,...

Date post: 04-Jan-2019
Category:
Upload: phamanh
View: 215 times
Download: 0 times
Share this document with a friend
4
AbstractThe purpose of this paper is to develop a computational model to study vehicle flow on urban roads. The model presents a study undertaken at a two-way intersection where vehicle flow is controlled by traffic lights operating according to fixed intervals of times. This model is computationally simulated using Matlab/Simulink. Several simulations were processed and in practice the model proved to be stable and reliable. It is expected that the results will contribute to the creation of a stochastic predictive model to anticipate situations that lead to traffic jams. Index TermsSimulation model, traffic lights, traffic simulation. I. INTRODUCTION Computer simulation means running a computer program that will reproduce an abstract model of a given system, enabling these systems to be studied to assess their behavior relevant to the variations in the study environment. According to [1], the advantage of computer simulation is the ability to answer questions without disrupting the systems investigated. This paper presents a computational model to study urban traffic, aiming to optimize traffic flow and reduce traffic jams by reducing the average time vehicles remain stationary at traffic lights. II. METHODOLOGY This paper presents an exploratory study of traffic lights and their impact on urban traffic conditions. To do so, we conducted a bibliographic study to establish parameters allowing us to develop a computational model that accurately represented reality. Vehicle flow in urban traffic and the quality of service were studied by analyzing frequency of stops, speed of operation, travel time, traffic density and the operational costs of the vehicle. The computational model was developed and simulated using Matlab/Simulink, a tool projected for this type of study. So that the model accurately represented real-life demand for the system, information regarding traffic light cycles and other aspects were taken data published in the National Traffic Department Traffic Lights Manual - [2]. Additionally, the traffic light times were calculated using the Webster method, the algorithm of which is provided in [2]. Manuscript received November 10, 2013; revised January 2, 2014. The authors are with the Universidade Presbiteriana Mackenzie, Brasil (e-mail: {takato, raunheitte, rubens.camargo, aavallim}@mackenzie.br, [email protected]). III. COMPUTER SIMULATION AND SYSTEMS MODELING Modeling is the development of a model to represent a given phenomenon. A model is the representation of a real or imaginary system using a language. A Matlab environment application, Simulink, was used for the simulation in this paper, given that this tool provides an interactive environment based on block diagrams, designed specifically for modeling, simulation and analysis of continuous, discrete or hybrid dynamical systems [3]. According to [4], the models are classified as either „static‟ or „dynamic‟. Dynamic models are then sub-classified as „deterministic‟ and „random‟. The random models adopted in this paper are divided into discrete and continuous change, as shown in Fig. 1. Fig. 1. Classification of simulation models. Source: [4]. IV. URBAN TRAFFIC The degree of randomness intrinsic to real systems, scaled specifically to random occurrence of events in these systems, necessarily implies proportionate application of Monte Carlo method. The use of this technique consists in the artificial generation of data by employing a random number generator (RNG) and a frequency distribution of the target variable. The RNG is a computer program capable of generating independent and uniformly distributed random values between zero and one [1]. This study uses the terminology proposed by [5]. The term transit refers to the displacement of people or vehicles and traffic is applied when it refers to the study of these displacements. The concept „traffic jam‟ is related to the concepts of road capacity and service level. Road capacity represents the maximum number of vehicles that moving along a stretch of raid over a given period of time, in a specific set of conditions of composition of traffic demand and environment; service level is a measure of the quality of service provided to the road user. This quality of service can be analyzed according to frequency of stops, speed of operation, travel time, traffic density and operational costs of the vehicle. According to [5], service level is a parameter that reflects the conditions of flow, safety and comfort on any given space that is occupied. Takato Kurihara, Luis Tadeu Raunheitte, Rubens de Camargo, Arnaldo Rabello de Aguiar Vallim Filho, and Julio Petroni A Computational Model to Study Urban Traffic Control International Journal of Computer Theory and Engineering, Vol. 6, No. 5, October 2014 382 DOI: 10.7763/IJCTE.2014.V6.894
Transcript

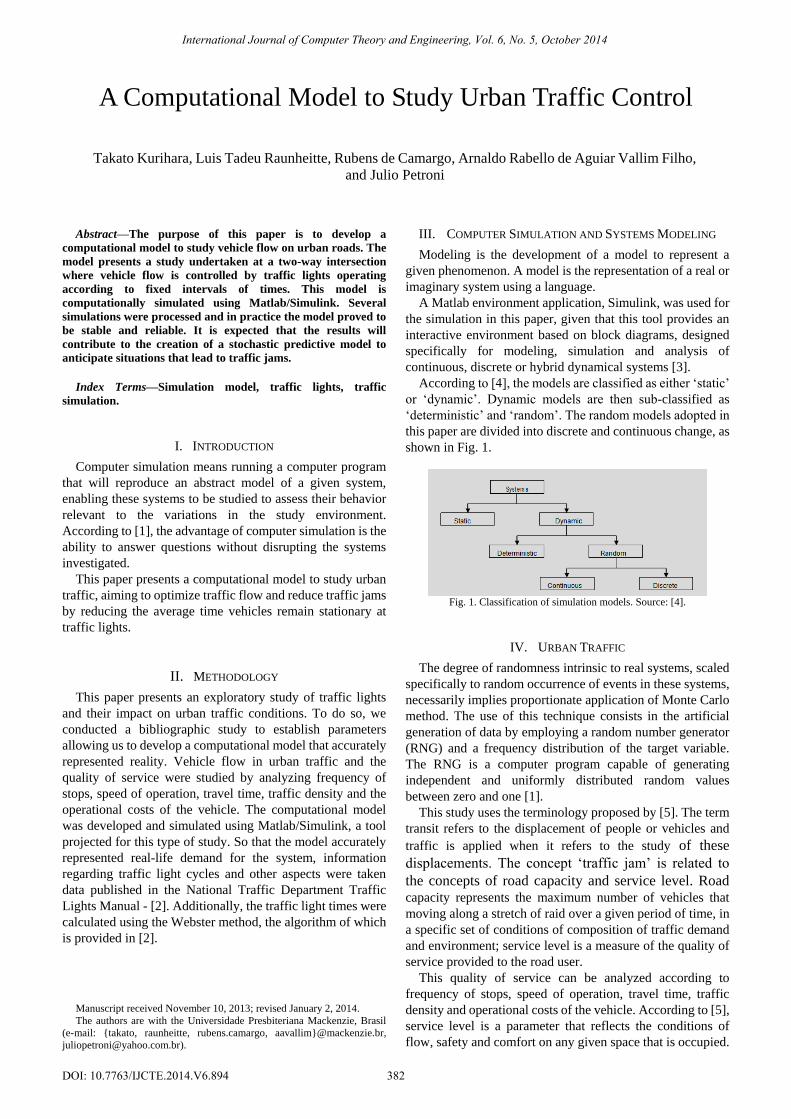
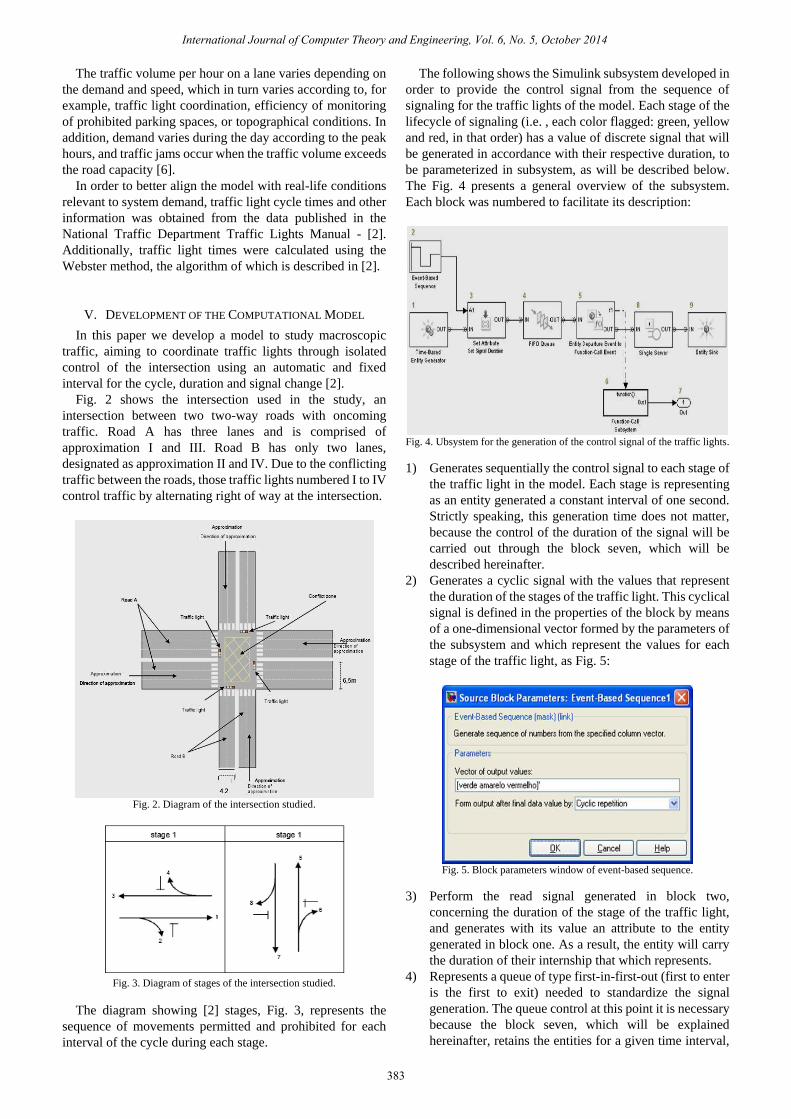
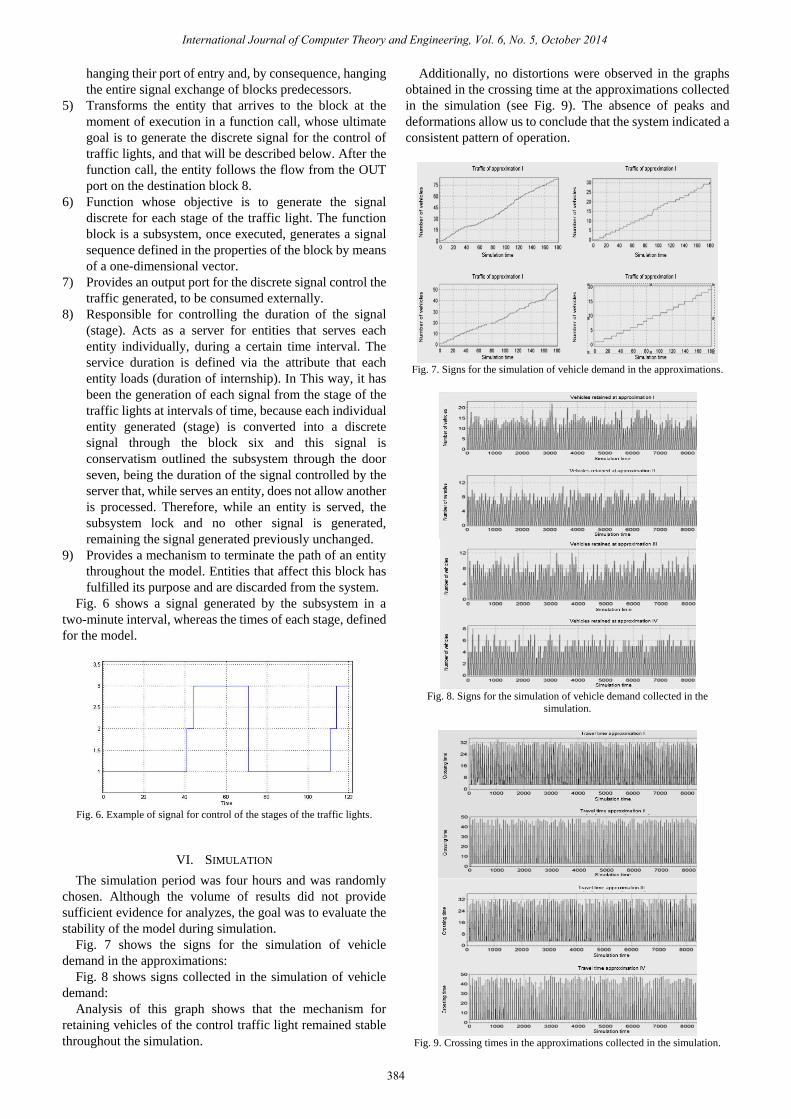
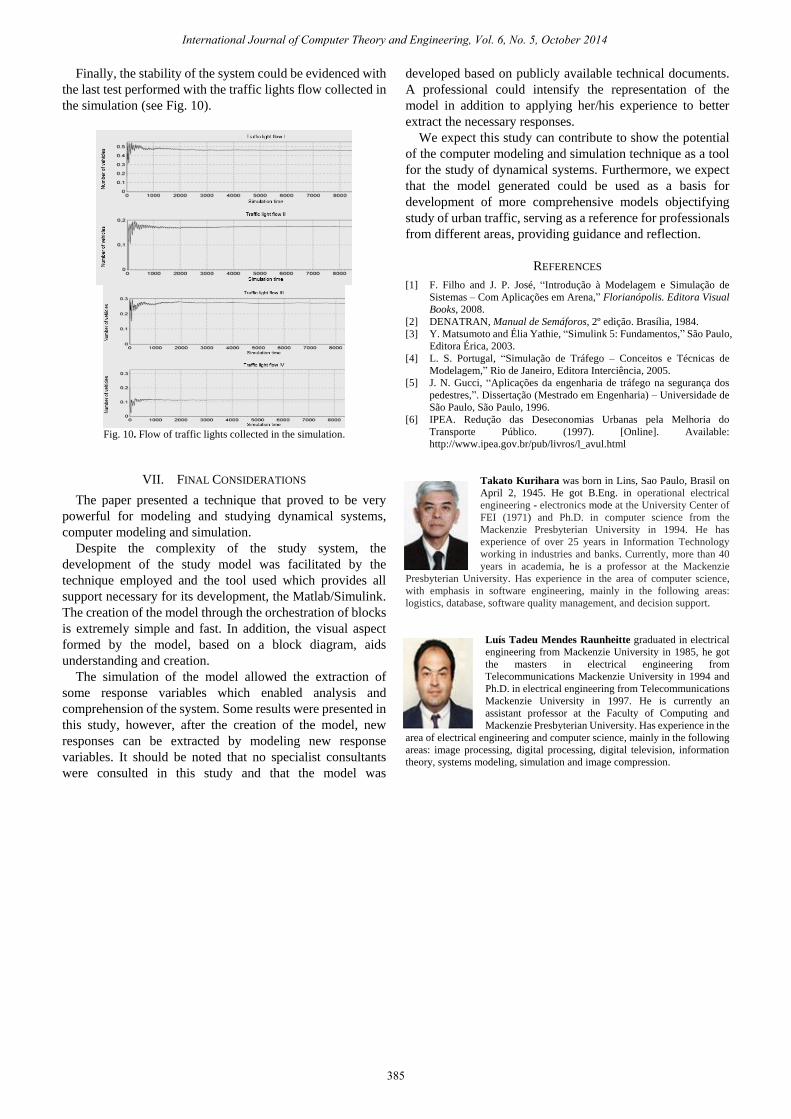
Abstract—The purpose of this paper is to develop a

computational model to study vehicle flow on urban roads. The

model presents a study undertaken at a two-way intersection

where vehicle flow is controlled by traffic lights operating

according to fixed intervals of times. This model is

computationally simulated using Matlab/Simulink. Several

simulations were processed and in practice the model proved to

be stable and reliable. It is expected that the results will

contribute to the creation of a stochastic predictive model to

anticipate situations that lead to traffic jams.

Index Terms—Simulation model, traffic lights, traffic

simulation.

I. INTRODUCTION

Computer simulation means running a computer program

that will reproduce an abstract model of a given system,

enabling these systems to be studied to assess their behavior

relevant to the variations in the study environment.

According to [1], the advantage of computer simulation is the

ability to answer questions without disrupting the systems

investigated.

This paper presents a computational model to study urban

traffic, aiming to optimize traffic flow and reduce traffic jams

by reducing the average time vehicles remain stationary at

traffic lights.

II. METHODOLOGY

This paper presents an exploratory study of traffic lights

and their impact on urban traffic conditions. To do so, we

conducted a bibliographic study to establish parameters

allowing us to develop a computational model that accurately

represented reality. Vehicle flow in urban traffic and the

quality of service were studied by analyzing frequency of

stops, speed of operation, travel time, traffic density and the

operational costs of the vehicle. The computational model

was developed and simulated using Matlab/Simulink, a tool

projected for this type of study. So that the model accurately

represented real-life demand for the system, information

regarding traffic light cycles and other aspects were taken

data published in the National Traffic Department Traffic

Lights Manual - [2]. Additionally, the traffic light times were

calculated using the Webster method, the algorithm of which

is provided in [2].

Manuscript received November 10, 2013; revised January 2, 2014.

The authors are with the Universidade Presbiteriana Mackenzie, Brasil

(e-mail: {takato, raunheitte, rubens.camargo, aavallim}@mackenzie.br,

[email protected]).

III. COMPUTER SIMULATION AND SYSTEMS MODELING

Modeling is the development of a model to represent a

given phenomenon. A model is the representation of a real or

imaginary system using a language.

A Matlab environment application, Simulink, was used for

the simulation in this paper, given that this tool provides an

interactive environment based on block diagrams, designed

specifically for modeling, simulation and analysis of

continuous, discrete or hybrid dynamical systems [3].

According to [4], the models are classified as either „static‟

or „dynamic‟. Dynamic models are then sub-classified as

„deterministic‟ and „random‟. The random models adopted in

this paper are divided into discrete and continuous change, as

shown in Fig. 1.

Fig. 1. Classification of simulation models. Source: [4].

IV. URBAN TRAFFIC

The degree of randomness intrinsic to real systems, scaled

specifically to random occurrence of events in these systems,

necessarily implies proportionate application of Monte Carlo

method. The use of this technique consists in the artificial

generation of data by employing a random number generator

(RNG) and a frequency distribution of the target variable.

The RNG is a computer program capable of generating

independent and uniformly distributed random values

between zero and one [1].

This study uses the terminology proposed by [5]. The term

transit refers to the displacement of people or vehicles and

traffic is applied when it refers to the study of these

displacements. The concept „traffic jam‟ is related to

the concepts of road capacity and service level. Road capacity represents the maximum number of vehicles that

moving along a stretch of raid over a given period of time, in

a specific set of conditions of composition of traffic demand

and environment; service level is a measure of the quality of

service provided to the road user.

This quality of service can be analyzed according to

frequency of stops, speed of operation, travel time, traffic

density and operational costs of the vehicle. According to [5],

service level is a parameter that reflects the conditions of

flow, safety and comfort on any given space that is occupied.

Takato Kurihara, Luis Tadeu Raunheitte, Rubens de Camargo, Arnaldo Rabello de Aguiar Vallim Filho,

and Julio Petroni

A Computational Model to Study Urban Traffic Control

International Journal of Computer Theory and Engineering, Vol. 6, No. 5, October 2014

382DOI: 10.7763/IJCTE.2014.V6.894

The traffic volume per hour on a lane varies depending on

the demand and speed, which in turn varies according to, for

example, traffic light coordination, efficiency of monitoring

of prohibited parking spaces, or topographical conditions. In

addition, demand varies during the day according to the peak

hours, and traffic jams occur when the traffic volume exceeds

the road capacity [6].

In order to better align the model with real-life conditions

relevant to system demand, traffic light cycle times and other

information was obtained from the data published in the

National Traffic Department Traffic Lights Manual - [2].

Additionally, traffic light times were calculated using the

Webster method, the algorithm of which is described in [2].

V. DEVELOPMENT OF THE COMPUTATIONAL MODEL

In this paper we develop a model to study macroscopic

traffic, aiming to coordinate traffic lights through isolated

control of the intersection using an automatic and fixed

interval for the cycle, duration and signal change [2].

Fig. 2 shows the intersection used in the study, an

intersection between two two-way roads with oncoming

traffic. Road A has three lanes and is comprised of

approximation I and III. Road B has only two lanes,

designated as approximation II and IV. Due to the conflicting

traffic between the roads, those traffic lights numbered I to IV

control traffic by alternating right of way at the intersection.

Fig. 2. Diagram of the intersection studied.

Fig. 3. Diagram of stages of the intersection studied.

The diagram showing [2] stages, Fig. 3, represents the

sequence of movements permitted and prohibited for each

interval of the cycle during each stage.

The following shows the Simulink subsystem developed in

order to provide the control signal from the sequence of

signaling for the traffic lights of the model. Each stage of the

lifecycle of signaling (i.e. , each color flagged: green, yellow

and red, in that order) has a value of discrete signal that will

be generated in accordance with their respective duration, to

be parameterized in subsystem, as will be described below.

The Fig. 4 presents a general overview of the subsystem.

Each block was numbered to facilitate its description:

Fig. 4. Ubsystem for the generation of the control signal of the traffic lights.

1) Generates sequentially the control signal to each stage of

the traffic light in the model. Each stage is representing

as an entity generated a constant interval of one second.

Strictly speaking, this generation time does not matter,

because the control of the duration of the signal will be

carried out through the block seven, which will be

described hereinafter.

2) Generates a cyclic signal with the values that represent

the duration of the stages of the traffic light. This cyclical

signal is defined in the properties of the block by means

of a one-dimensional vector formed by the parameters of

the subsystem and which represent the values for each

stage of the traffic light, as Fig. 5:

Fig. 5. Block parameters window of event-based sequence.

3) Perform the read signal generated in block two,

concerning the duration of the stage of the traffic light,

and generates with its value an attribute to the entity

generated in block one. As a result, the entity will carry

the duration of their internship that which represents.

4) Represents a queue of type first-in-first-out (first to enter

is the first to exit) needed to standardize the signal

generation. The queue control at this point it is necessary

because the block seven, which will be explained

hereinafter, retains the entities for a given time interval,

International Journal of Computer Theory and Engineering, Vol. 6, No. 5, October 2014

383

hanging their port of entry and, by consequence, hanging

the entire signal exchange of blocks predecessors.

5) Transforms the entity that arrives to the block at the

moment of execution in a function call, whose ultimate

goal is to generate the discrete signal for the control of

traffic lights, and that will be described below. After the

function call, the entity follows the flow from the OUT

port on the destination block 8.

6) Function whose objective is to generate the signal

discrete for each stage of the traffic light. The function

block is a subsystem, once executed, generates a signal

sequence defined in the properties of the block by means

of a one-dimensional vector.

7) Provides an output port for the discrete signal control the

traffic generated, to be consumed externally.

8) Responsible for controlling the duration of the signal

(stage). Acts as a server for entities that serves each

entity individually, during a certain time interval. The

service duration is defined via the attribute that each

entity loads (duration of internship). In This way, it has

been the generation of each signal from the stage of the

traffic lights at intervals of time, because each individual

entity generated (stage) is converted into a discrete

signal through the block six and this signal is

conservatism outlined the subsystem through the door

seven, being the duration of the signal controlled by the

server that, while serves an entity, does not allow another

is processed. Therefore, while an entity is served, the

subsystem lock and no other signal is generated,

remaining the signal generated previously unchanged.

9) Provides a mechanism to terminate the path of an entity

throughout the model. Entities that affect this block has

fulfilled its purpose and are discarded from the system.

Fig. 6 shows a signal generated by the subsystem in a

two-minute interval, whereas the times of each stage, defined

for the model.

Fig. 6. Example of signal for control of the stages of the traffic lights.

VI. SIMULATION

The simulation period was four hours and was randomly

chosen. Although the volume of results did not provide

sufficient evidence for analyzes, the goal was to evaluate the

stability of the model during simulation.

Fig. 7 shows the signs for the simulation of vehicle

demand in the approximations:

Fig. 8 shows signs collected in the simulation of vehicle

demand:

Analysis of this graph shows that the mechanism for

retaining vehicles of the control traffic light remained stable

throughout the simulation.

Additionally, no distortions were observed in the graphs

obtained in the crossing time at the approximations collected

in the simulation (see Fig. 9). The absence of peaks and

deformations allow us to conclude that the system indicated a

consistent pattern of operation.

Fig. 7. Signs for the simulation of vehicle demand in the approximations.

Fig. 8. Signs for the simulation of vehicle demand collected in the

simulation.

Fig. 9. Crossing times in the approximations collected in the simulation.

International Journal of Computer Theory and Engineering, Vol. 6, No. 5, October 2014

384

Finally, the stability of the system could be evidenced with

the last test performed with the traffic lights flow collected in

the simulation (see Fig. 10).

Fig. 10. Flow of traffic lights collected in the simulation.

VII. FINAL CONSIDERATIONS

The paper presented a technique that proved to be very

powerful for modeling and studying dynamical systems,

computer modeling and simulation.

Despite the complexity of the study system, the

development of the study model was facilitated by the

technique employed and the tool used which provides all

support necessary for its development, the Matlab/Simulink.

The creation of the model through the orchestration of blocks

is extremely simple and fast. In addition, the visual aspect

formed by the model, based on a block diagram, aids

understanding and creation.

The simulation of the model allowed the extraction of

some response variables which enabled analysis and

comprehension of the system. Some results were presented in

this study, however, after the creation of the model, new

responses can be extracted by modeling new response

variables. It should be noted that no specialist consultants

were consulted in this study and that the model was

developed based on publicly available technical documents.

A professional could intensify the representation of the

model in addition to applying her/his experience to better

extract the necessary responses.

We expect this study can contribute to show the potential

of the computer modeling and simulation technique as a tool

for the study of dynamical systems. Furthermore, we expect

that the model generated could be used as a basis for

development of more comprehensive models objectifying

study of urban traffic, serving as a reference for professionals

from different areas, providing guidance and reflection.

REFERENCES

[1] F. Filho and J. P. José, “Introdução à Modelagem e Simulação de

Sistemas – Com Aplicações em Arena,” Florianópolis. Editora Visual

Books, 2008.

[2] DENATRAN, Manual de Semáforos, 2º edição. Brasília, 1984.

[3] Y. Matsumoto and Élia Yathie, “Simulink 5: Fundamentos,” São Paulo,

Editora Érica, 2003.

[4] L. S. Portugal, “Simulação de Tráfego – Conceitos e Técnicas de

Modelagem,” Rio de Janeiro, Editora Interciência, 2005.

[5] J. N. Gucci, “Aplicações da engenharia de tráfego na segurança dos

pedestres,”. Dissertação (Mestrado em Engenharia) – Universidade de

São Paulo, São Paulo, 1996.

[6] IPEA. Redução das Deseconomias Urbanas pela Melhoria do

Transporte Público. (1997). [Online]. Available:

http://www.ipea.gov.br/pub/livros/l_avul.html

Takato Kurihara was born in Lins, Sao Paulo, Brasil on

April 2, 1945. He got B.Eng. in operational electrical

engineering - electronics mode at the University Center of

FEI (1971) and Ph.D. in computer science from the

Mackenzie Presbyterian University in 1994. He has

experience of over 25 years in Information Technology

working in industries and banks. Currently, more than 40

years in academia, he is a professor at the Mackenzie

Presbyterian University. Has experience in the area of computer science,

with emphasis in software engineering, mainly in the following areas:

logistics, database, software quality management, and decision support.

Luís Tadeu Mendes Raunheitte graduated in electrical

engineering from Mackenzie University in 1985, he got

the masters in electrical engineering from

Telecommunications Mackenzie University in 1994 and

Ph.D. in electrical engineering from Telecommunications

Mackenzie University in 1997. He is currently an

assistant professor at the Faculty of Computing and

Mackenzie Presbyterian University. Has experience in the

area of electrical engineering and computer science, mainly in the following

areas: image processing, digital processing, digital television, information

theory, systems modeling, simulation and image compression.

International Journal of Computer Theory and Engineering, Vol. 6, No. 5, October 2014

385


Recommended