KOÇ UNIVERSITY-TÜSİAD ECONOMIC RESEARCH FORUM WORKING PAPER SERIES A DYNAMIC EVALUATION OF CENTRAL BANK CREDIBILITY Cem Çakmaklı Selva Demiralp Working Paper No: 2015 October 2020 This Working Paper is issued under the supervision of the ERF Directorate. Any opinions expressed here are those of the author(s) and not those of the Koç University-TÜSİAD Economic Research Forum. It is circulated for discussion and comment purposes and has not been subject to review by referees. KOÇ UNIVERSITY-TÜSİAD ECONOMIC RESEARCH FORUM Rumelifeneri Yolu 34450 Sarıyer/Istanbul
Transcript
KOÇ UNIVERSITY-TÜSİAD ECONOMIC RESEARCH FORUM
WORKING PAPER SERIES
A DYNAMIC EVALUATION OF CENTRAL BANK
CREDIBILITY
Cem Çakmaklı
Selva Demiralp
Working Paper No: 2015
October 2020
This Working Paper is issued under the supervision of the ERF Directorate. Any opinions
expressed here are those of the author(s) and not those of the Koç University-TÜSİAD
Economic Research Forum. It is circulated for discussion and comment purposes and has not
been subject to review by referees.
KOÇ UNIVERSITY-TÜSİAD ECONOMIC RESEARCH FORUM
Rumelifeneri Yolu 34450 Sarıyer/Istanbul
A Dynamic Evaluation of Central Bank Credibility∗
Cem Cakmaklı †,1 and Selva Demiralp ‡,1
1Department of Economics, Koc University
October 1, 2020
Abstract
Central bank credibility is critical for the effectiveness of monetary policy. The measures of cred-ibility that are based on the changes in actual inflation rate do not perform very well in environ-ments of chronic inflation. We design an alternative measure that allows us to track the evolutionof credibility in an inflationary environment. Credibility is defined as the central bank’s abilityto lower inflation expectations towards its inflation target via current interest rate decisions. Weadopt a Bayesian set up to exploit this definition and document how credibility changes overtime. Our measure differs from the existing measures that are based on the deviation of infla-tion expectations from the inflation target. We show that the latter tests may be too blunt in theEM context and either overlook marginal improvements in credibility or incorrectly attribute thetemporary reductions in the inflation rate to improvements in credibility. Utilizing a time varyingparameters modeling structure, we show that the credibility of the Central Bank of the Republicof Turkey (CBRT) has declined significantly over time. Potential reasons for this deteriorationcould be the CBRT’s disappointing performance in hitting the inflation target and its exposure topolitical pressures. We apply our methodology to Brazil as well to highlight its advantages anddraw a comparison to the existing literature.
Keywords: Credibility, inflation expectations, Central Bank of the Republic of Turkey, Unob-served component models, TVP-VAR, Central Bank of BrazilJEL Codes: E52, E58, C32
∗This project was funded by the Scientific and Technological Research Council of Turkey (TUBITAK)’s 1001 Grant No:218K251.†e–mail: [email protected]‡Correspondence to: Koc University, Rumelifeneri Yolu, 34450 Sarıyer Istanbul Turkey, e–mail: [email protected]
1
1 Introduction
Effective implementation of monetary policy depends critically on the credibility of the central bank.
A credible central bank can convince the public that the long run inflation rate will be at the target
so that people anchor the target rate into their decision making process. In his speech at the Jackson
Hole meetings, Blinder (2012) defines credibility as follows:
”Credibility means believability and trust. You build it by matching deeds to words.
Promising and then delivering low inflation is one important aspect of central bank credibility. . . ”
Anti-inflation credibility allows a central bank to anchor inflation expectations, which is an essential
aspect of inflation targeting. Yellen (2006) notes that with a credible central bank ”the markets do
all the work of monetary policy” because market participants act based on correctly anticipated
actions of the central bank. On the flip side, weak credibility makes inflation targeting particularly
challenging because of the difficulty in managing inflation expectations.
Central bank credibility is typically harder to establish in EMs as a consequence of higher initial
inflation levels, weaker institutions, higher macroeconomic instability, and a larger vulnerability to
external shocks. In turn, low credibility makes it more challenging to anchor inflation expectations
and achieve the inflation target where the inflation rate and GDP growth are more volatile (Fraga
et al., 2003). A central bank with weak credibility faces higher inflationary expectations, leading to
lower employment and less expansionary policy (Faust and Svensson, 2001). Acquiring credibility
enables a better trade-off between inflation and output gap. As the credibility strengthens, infla-
tion expectations are formed based on the central bank’s inflation target rather than past inflation
dynamics. This way, price stability can be achieved mostly through expectations, necessitating less
changes in the policy instrument to control aggregate demand (Tronzano, 2005).
Despite the critical importance of credibility in achieving inflationary goals, the existing mea-
sures of credibility in the literature primarily focus on environments where price stability is already
achieved. Ironically, such measures do not quite capture the credibility dynamics in EMs where
credibility is most needed. In this paper, we develop an empirical framework to test the evolution
of credibility for EM central banks that suffer from chronic inflation. We apply our test to measure
the changes in central bank credibility in Turkey. Our results suggest that CBRT’s credibility has
2
gradually declined over the last decade.
Although our sample period ends shortly before COVID-19, our findings have important impli-
cations for the post-COVID world. In order to finance the economic costs of the pandemic, CBRT
engaged in Quantitative Easing (QE) along with advanced economy central banks. Different from
major central banks, however, EM central banks typically lack the institutional independence and
the associated credibility that are the pre-requisites for a successful QE program. A successful QE
needs to inject large sums of money without eroding the confidence in local currency that would
lead to depreciation and boost inflationary expectations. Confidence in the program can only be
achieved if the market is convinced that the money that is injected to the system will be drained
effectively once the economy normalizes. To that end, central banks need to assure the markets that
they will not fund the government indefinitely. Such effective communication is harder to achieve
for central banks with weaker credibility. These central banks need to put in extra effort to make up
for their weaker credibility and convince the public that QE will be abandoned properly once things
normalize. Our findings in this paper suggests that there is a challenging road ahead of CBRT given
the loose pre-conditions prior to QE. Thus, CBRT has to try harder than advanced economy cen-
tral banks to communicate a well targeted QE program and an exit strategy to prevent inflationary
pressures.
In the context of well anchored expectations, credibility is typically defined as the case in which
inflation expectations are insensitive to news releases and monetary policy actions (see e.g. Gurkaynak
et al. (2007), Demertzis et al. (2012) and the references therein). In an EM context with unanchored
expectations, however, this definition may be inadequate to capture credibility dynamics. In an in-
flationary environment, inflation expectations are typically formed based on changes in the actual
inflation rate. Thus, the aforementioned definition of credibility may not quite differentiate between
weak versus weaker credibility in this context.
An alternative definition of credibility focuses on the deviations of inflation expectations from
the target (see e.g. Bordo and Siklos (2014)). As noted, when inflation expectations are not well an-
chored, they tend to follow the changes in the actual inflation rate. Thus, even a temporary decline
in the actual inflation rate may cause a consequent decline in inflation expectations, incorrectly sig-
naling an improvement in central bank credibility. We argue that a mere decline in inflation expec-
3
tations that is triggered by a temporary decline in the actual inflation rate should not be interpreted
as an improvement in credibility.
Considering a similar definition, Svensson (1993) defines credibility as the case where market
participants expect future inflation to be within a specified range of the target. Using this definition,
the upper and the lower bounds of the inflation target are used to obtain target-consistent real bond
yields. These target-consistent yields are then compared to expected real interest rates to see if they
are consistent. One problem with this measure is that it does not allow for testing the degree of cred-
ibility and how it evolves over time. Furthermore, in the EM context, such a definition would not be
particularly helpful when there is chronic inflation. In Turkey for example, the average inflation rate
has been about 50 percent above the inflation target and the practice was predominantly in line with
weak credibility. Thus, other than documenting weak credibility, we would not be able to identify
how the path of weak credibility evolves over time.
In this paper, we develop a measure of credibility based on Goodfriend (1993). In the inflation-
ary environment of 1979-1982 in the US, Goodfriend defined credibility as a decline in the long term
interest rates. Consistent with this framework, we define credibility as the central bank’s ability to
lower long term interest rates through its policy actions in an environment of chronically high in-
flation. Long term interest rates serve as a proxy for inflation expectations at the daily frequency.
This definition is also consistent with the concept of marginal credibility, described by Cukierman
and Meltzer (1986) as the monetary authority’s ability to influence market expectations through
monetary policy announcements. In this paper, we develop a time varying framework allowing for
changes in the response of the long-rate to policy shifts. We do that by reformulating the econo-
metric framework, measuring this response to allow for time variation in key parameters using a
state space modeling structure. We document changes in the credibility of a central bank using this
definition. In this set up, we distinguish between a decline in inflation expectations that is due to
temporary fluctuations in the actual inflation rate versus a decline in inflation expectations that is
due to monetary policy decisions. We only consider the latter to be a sign of credibility.
If inflation expectations are anchored at the target, then the definition of credibility is symmet-
ric: changes in the policy rate should not lead to a change in inflation expectations, consistent with
a credible central bank. If inflation expectations are not anchored and there is chronic inflation
4
however, then, a decline in inflation expectations following a monetary policy action is a sign of
credibility, while an increase in inflation expectations shows lack of credibility, indicating the pres-
ence of an asymmetry. We incorporate this asymmetry in our empirical analysis and investigate
the changes in CBRT’s ability to lower inflation expectations through its interest rate decisions over
time. Our results suggest that the CBRT’s ability to lower inflation expectations via its policy actions
has declined over time, suggesting a deterioration in credibility. Although academic research on
CBRT’s credibility is rare, our findings are in line with the commentaries in financial news networks
especially with respect to the recent decline in credibility. 1
After illustrating changes in the credibility of CBRT over time, we compare our benchmark mea-
sure with the alternatives mentioned above. When inflation expectations are anchored, these def-
initions yield similar results. In an EM environment, however, we illustrate that the alternative
measures might exhibit volatility due to fluctuations in the actual inflation rate which are not picked
up by our measure of credibility. In the last section of the paper, we apply our methodology to Brazil
to illustrate the generalized use of our methodology to any EM economy that suffers from chronic
inflation. Our results indicate that, credibility of Central Bank of Brazil (BCB) has been stronger
before the Great Financial Crisis and weakened afterwards.
2 History of Inflation Targeting in Turkey and Implications for Credibil-
ity
After a transitory period of implicit inflation targeting during 2001-2004, CBRT switched to pre-
announced policy dates in 2005 and then adopted explicit inflation targeting (IT) at the beginning of
2006. Figure 1 shows the inflation rate (the black line) and the inflation target (blue bars) since 2002.
[Insert Figure 1 about here]
It is observed that while CBRT made important progress in lowering the inflation rate to single digit
numbers prior to 2005, the inflation rate has typically been above the inflation target during the
period after 2006.
The past performance of a central bank in an inflation targeting regime is one of the key deter-
minants of its future credibility. If the central bank has weak credibility and cannot anchor long
run inflation expectations, then agents update their beliefs about the central bank’s inflation target
based on past inflation and the process becomes self-fulfilling (Davis, 2012). The short history of
IT in many EM economies challenge the anchoring of inflation expectations to an inflation target in
these countries (See e.g. De Pooter et al. (2014)). Turkey, whose ten year experience with inflation
targeting has been rather rough, feels that challenge deeply. Thus, it provides a suitable case for us
to test the evolution of credibility over the course of its inflation targeting experience.
In this paper, we argue that the mere ”gap” between the inflation rate and the target may be a
misleading measure to draw inference about credibility. In particular, credibility might be weaker
than what is suggested by the gap if inflation rate declines due to factors that are not directly con-
trolled by the central bank. That being said, the gap is still an informative statistic about illustrating
the past performance of the central bank so long as it is not taken at the face value. A preliminary
look at Figure 1 suggests that while CBRT had a good start in establishing its credibility within the
inflation targeting framework, this reputation has weakened in the post-2006 period of explicit in-
flation targeting. During that time, the inflation rate exceeded the target in 9 out of 12 years and
the inflation rate followed an upwards trend. We hypothesize that the observed deterioration in the
performance of CBRT and the consequent widening of the gap may have weakened its anti-inflation
credibility over time. There could be several reasons behind the disappointing IT performance of
CBRT. One factor is the unfortunate onset of the 2007-2009 global financial crisis shortly after the
CBRT’s switch to explicit IT. In the presence of a global recession and the abundant liquidity that
was injected by the advanced economies, emerging market central banks found it more difficult
to implement tight monetary policy that interfered with financial stability due to excessive capital
inflows (Alper et al., 2018). In this environment, one might expect a deterioration in the IT perfor-
mance. Nevertheless, CBRT did relatively poorly compared to other emerging market economies
during that time, which suggests that global factors alone cannot explain the poor performance of
Turkey with respect to IT ( Table 1).
6
[Insert Table 1 about here]
A second factor which is related to the post-crisis environment is the noticeable increase in the po-
litical pressures over the central bank by the then prime minister Erdogan (who was later elected as
the president as of 2014), explicitly inviting the central bank to lower interest rates. In the context
of the US and the Euro area, Demiralp et al. (2019) found that political commentaries do influence
market expectations and bond rates to the extent that market participants expect the central bank to
respond to political pressures. Demiralp and Demiralp (2019) illustrate that political commentaries
that ask for lower interest rates decrease the probability of a rate hike by the CBRT.
In an economy where inflation is a chronic problem, political pressures over the central bank to
ease monetary policy may further weaken the credibility of the central bank. This is because such
pressures may limit the ability of the central bank in implementing a more aggressive policy to fight
inflation. Hence, political pressures may contribute to the widening of the gap between the actual
inflation rate and the target rate by (i) pressuring the CBRT to implement easy monetary policy and
(ii) by damaging the reputation of the central bank as an independent institution that is capable of
achieving its goals. In the latter case, even if the central bank does not give into political pressures,
the public may incorrectly believe that central bank’s decisions are influenced by such pressures and
diverted from the optimal path that would be followed in the absence of such pressures.
In his 2010 speech, Bernanke (2010) highlights these views:
“Undue political influence on monetary policy decisions can also impair the inflation-fighting credibility of
the central bank, resulting in higher average inflation and, consequently, a less-productive economy. Central
banks regularly commit to maintain low inflation in the longer term; if such a promise is viewed as credible
by the public, then it will tend to be self-fulfilling, as inflation expectations will be low and households and
firms will temper their demands for higher wages and prices. However, a central bank subject to short-term
political influences would likely not be credible when it promised low inflation, as the public would recognize
the risk that monetary policymakers could be pressured to pursue short-run expansionary policies that would
be inconsistent with long-run price stability. When the central bank is not credible, the public will expect
high inflation and, accordingly, demand more-rapid increases in nominal wages and in prices. Thus, lack of
independence of the central bank can lead to higher inflation and inflation expectations in the longer run, with
no offsetting benefits in terms of greater output or employment.”
7
In this paper, we argue that the disappointing IT performance of the CBRT as well as the mount-
ing political pressures may have led to a decline in the credibility of the CBRT. In an environment
of chronic inflation, CBRT’s primary goal, as defined by law, is to reduce the inflation rate.2 Hence,
a decline in inflation expectations following a policy move is consistent with credibility, while the
failure to control and lower inflation expectations suggests weak credibility.
3 Theoretical Framework
In testing the credibility of the central bank through its control over the long end of the yield curve,
our starting point is the well familiar expectations hypothesis. Accordingly, the long term rate is
the average expected level of the policy rate over the relevant horizon and a term premium. The
term premium includes the real interest rate risk as well as the inflation risk. When the central bank
changes the short term policy rate, the long term rate adjusts based on changes in policy expectations
as well as changes in the term premium. Assuming that the real interest rate risk does not depend
on monetary policy, one can interpret the changes in long term interest rates as mostly attributable
to revisions in the expected policy path and changes in inflation expectations.
Consider an easing by the central bank. If the rate cut is perceived to be relatively early in
an easing cycle such that there are a series of anticipated future policy cuts, the overall weight of
expected rate cuts could pull the long term rate downwards. If a rate cut comes later in the cycle,
then the expected policy path may not have as much of an impact on the long term rate.
Turning to the inflation expectations component, if the central bank is perceived to be relatively
credible, then the upward adjustment of inflation expectations following a rate cut would be limited
and there may be a net decline in the long rate. If the markets do not view the central bank to be
credible, however, an accommodative policy move might trigger inflationary expectations and a rate
cut might be associated with a limited decline or even a tightening in the long rate. The net impact
of a rate cut would thus be indeterminate and depend on the degree of credibility in managing
inflation expectations.
2The central bank law (law no: 1211) was revised on April 25, 2001 to set price stability as the primary goal of CBRT.
8
On a similar vein, at the beginning of an aggressive tightening cycle, anticipated future rate hikes
push the long term rate upwards. If the central bank is credible and the tightenings are perceived
to be a successful fight against inflation, then the downwards revision in inflation expectations may
outweigh the policy expectations channel. If the central bank is not viewed to be credible and the rate
hikes are perceived to be too little and too late, then the downward revision in inflation expectations
would be limited which could result in an increase in the long rate.
The above discussion suggests that a policy move at the beginning of a policy cycle have a higher
likelihood of moving the long term rate in the same direction. Rate changes at later stages of a cycle
may not have the same impact on policy path revisions because they have less of a weight over the
duration of longer term securities. Meanwhile, the net effect of a policy change depends on how the
central bank action influences inflation expectations. Thus, in modelling the central bank’s control
on inflation expectations, the policy action as well as the relative timing of the interest rate decision
within a policy cycle are important.
In the context of a regression model, this framework can be expressed as follows:
∆iLTt = β∆iPolicy
t + γZt + εt (1)
where ∆iLTt is the change in the long term interest rate as of time t, ∆iPolicy
t is the change in the policy
rate, and Zt is a vector of remaining variables including control variables that may affect the long
rate on day t. In our set up, this vector includes changes in the shorter term interest rates, the order
of the rate change in a policy cycle,3 risk premia, inflation release surprises, and the changes in the
US 10-year yield.
When the central bank cuts its policy rate, its goal is to convince the public that the dovish move
is consistent with reaching the inflation target in the long run. Market response, on the other hand,
depends on the credibility of the central bank. A decline in the long rate, in response to a rate cut
could partly reflect a decline in inflation expectations and partly reflect expected future easings.
If the long rate declines after we control for near term policy expectations (which is captured by
the short term interest rate and the order of the rate change), this reflects the downwards revisions
3This variable is constructed such that it is set to 1 at the beginning of each easing or tightening cycle and increaseswith each consecutive change such that it reflects the order of each rate change in a given cycle.
9
in inflation expectations thanks to the credibility of the central bank. The corresponding effect is
captured by the partial correlation coefficient β in equation (1). The size of the coefficient estimate
measures the extend of credibility.
The implications of this discussion on the sign of β after a rate cut is as follows:
β < 0 β = 0 β > 0•
Credibility decreases Credibility increases
The definition of credibility is asymmetric between a rate cut and a rate hike. Following a rate
hike, expected future hikes would move the long term rate upwards while a potentially downwards
revision in inflation expectations moves the long rate downwards. Once again, we are interested
in the response of long rates after we filter out the effects of the expected policy path. If the long
rate declines, keeping near term policy expectations constant, this is consistent with credibility, and
captured by β. In contrast, if the markets assess the rate hike to be ”too little, too late” and revise
up their inflation expectations, this would be a sign of no credibility which limits the decline in the
long rate. Indeed, Romer and Romer (2000) argue that long term rates typically increase following
a rate hike due to asymmetric information about the Federal Reserve’s inflation forecasts that are
unknown to the public. Because rate hikes signal information about the central bank’s inflation
forecasts, market participants revise up their inflation expectations as well.
The corresponding implications for β after a rate hike are:
β < 0 β = 0 β > 0•
Credibility increases Credibility decreases
Figure 2 provides examples for yield curve shifts that illustrate potentially ”credible” and ”not
so credible” central bank actions. In the figure, changes in the yield curve on the days around policy
actions are plotted. The horizontal axis shows the alternative maturities in years.
[Insert Figure 2 about here]
The top panel in Figure 2 illustrates the days around the rate cut on February 23, 2016. Naturally,
there is more volatility on the days around policy meetings. Nevertheless, when we compare the
10
yield curve changes on the day before and the day after the rate cut, we note that the short end
of the yield curve shifts down while the long end of the yield curve shifts up. This suggests that
expected future rate cuts dominate the short end of the yield curve while upwards revisions in
inflation expectations dominate the maturities longer than three years.
The middle panel shows the yield curve changes around the rate hike on March 16, 2017. We
observe that the short end of the yield curve shifts up while the long end of the yield curve shifts
down, consistent with a decline in inflation expectations in the long run. This is in line with the
perception of a credible policy action. Meanwhile, the bottom panel shows another rate hike on
December 13, 2017. This time we observe that the entire yield curve shifts up suggesting weak
credibility. While these individual episodes may suggest strong or weak credibility on each date,
our primary goal in this paper is to detect a statistically significant pattern in the average credibility
over time.
These priors regarding the definition of credibility are related to the New Fisherian hypothesis.
The New Fisherian proposition argues that following long periods during which rate hikes are as-
sociated with high inflation (as in the late 1970s in the US), an increase in the policy rate may lead to
a further increase in inflation expectations and long term interest rates. The argument is symmetric
such that in the post-crisis environment with a long period of less than desirable inflation rates and
the associated rate cuts, the public revised down its inflation expectations in response to further rate
cuts by major central banks such as the Federal Reserve, ECB, or the BoJ (Cochrane, 2016). Both of
these episodes refer to a decline in the credibility of the corresponding central bank in achieving its
inflation target such that inflation expectations get unanchored and float with changes in the policy
rates. This positive correlation between policy changes and inflation expectations is consistent with
our definition of weak credibility. While our paper does not focus on deflationary periods, it is pos-
sible to develop an analogous framework for periods of chronic deflation, which may be a particular
concern in the post-COVID world. In that case, an increase in inflation expectations following a pol-
icy action would be a sign of credibility, while a decrease in inflation expectations following a policy
move would reflect weak credibility.
11
4 Previous Literature
The literature on central bank credibility goes back to seminal studies by Kydland and Prescott
(1977), or Barro and Gordon (1983) where it is noted that rule based monetary policy with long
term commitments has a favorable impact on credibility. Clear communication by the central bank
increases the predictability of its actions, which helps with the formation of expectations that are
consistent with central bank policies and helps with inflation targeting.
The majority of the studies that focus on the effects of monetary policy on financial markets
focus on advanced economies with well established inflation anchors (see e.g. Lange et al. (2003);
Gurkaynak et al. (2005), in addition to above mentioned references). Better anchoring of inflation
expectations contributes to the muted response of long term rates (e.g. Cook and Hahn (1989);
Kuttner (2001); Demiralp and Jorda (2004)). The weak response of longer term yields to the policy
action suggests that the policy move does not cause substantive revisions in the expected policy
path over a longer horizon (Demiralp, 2008). Kuttner (2001) explains the muted response with the
”timing hypothesis”. When the markets are surprised about a current policy move, it is possible that
the market timed the policy change incorrectly but nevertheless accurately anticipated the change
sometime in the near future. Thus the advancement or postponement of anticipated rate changes
have smaller impact on longer term rates. Castelnuovo et al. (2003) show that in countries with
well anchored expectations, the correlation between short term and long term inflation expectations
decline.
An overwhelming majority of the literature that analyzed central bank credibility directly focus
on the gap between inflation expectations and the target as a measure for credibility. In his seminal
work Svensson (1993) developed the ”simplest test of inflation-target credibility”, where credibility
is established when market participants expect the future inflation to be within a specified range of
the target. Amisano and Tronzano (2010) consider an extension of framework proposed by Svens-
son (1993) to obtain a time-varying estimate about the degree of monetary policy credibility for the
early years of the ECB. They find that the ECB’s monetary policy strategy was rather successful in
establishing credibility. Focusing on the early years of ECB, Goldberg and Klein (2011) note that
central bank actions are significant in determining the financial market’s perceptions about central
12
bank credibility which is reflected in asset prices. Mariscal et al. (2011) find that while the Bank of
England’s credibility was stable until the start of the economic crisis in 2007, it deteriorated after-
wards. They measure credibility as the deviations of inflation expectations from the target following
Svensson (1993). Demir and Yigit (2008) show that the accuracy and frequency of target changes
affect how much attention the public pays to these announcements in the context of UK and New
Zealand. Bomfim and Rudebusch (2000) methodology is consistent with Svensson (1993)’s defini-
tion as well, which is based on the weight attached by the private sector to the inflation target in
the formation of inflation expectations. Cecchetti et al. (2002) develop an index based on the gap
between inflation expectations and the target. Altug and Cakmaklı (2016) consider a similar index
measuring the monthly deviation of inflation expectations from the target. They construct inflation
expectations by blending the predictions of an econometric model together with survey based ex-
pectations. Demertzis et al. (2012) focus on the relationship between inflation expectations and the
realized inflation rate. They define credibility as the detachment of inflation expectations from the
current inflation rate.
As we noted in the introduction, we have reservations about such measures in an EM context
with volatile inflation. To the extend that inflation expectations are anchored, they are not affected
from the fluctuations in the actual inflation rate or any related news release. In this framework,
deviations of inflation expectations from the headline inflation imply a strength in credibility. Such
a description may not be very informative in environments of chronic inflation where inflation ex-
pectations and the actual inflation are closely connected. Thus the test results would fail to identify
the nuances in weak credibility over time. While the sensitivity of inflation expectations to changes
in the actual inflation is a sign of credibility, the mere widening or the narrowing of this gap do not
necessarily indicate any improvement or deterioration in credibility because monthly inflationary
shocks can be independent of monetary policy. We come back to this issue in Section 5.1.2
5 Empirical Analysis
CBRT implements an interest rate corridor. Until May 2010, the policy rate was set to the lower
bound of the interest rate corridor. Following the announcement in April 2010, the CBRT started
13
using all three rates of the corridor with potential asymmetry. In the post-crisis environment, the
reaction of many emerging market economies to surging capital inflows was to keep policy rates at
low levels in order to avoid excessive appreciation of domestic currencies. At the same time, they
engaged in macro prudential tightening to curb the rapid credit growth.
In the period after 2010, CBRT reduced the lower bound of the corridor to stabilize capital flows
during periods of high risk appetite. Meanwhile they raised the reserve requirements to offset the
effects of low interest rates on its inflation target. When the global risk appetite declined, this time
they increased the upper bound of the corridor and allowed the interbank rate to settle close to the
upper bound (see Kara (2013)). Starting in January 2017, the CBRT used the late liquidity window
rate as its policy rate.4
The framework that we develop to test the credibility of the central bank necessitates a differen-
tiation of the easing and tightening cycles. This is because the interpretation of the sign of the partial
correlation coefficient between the policy rate and the long term rate is asymmetric, depending on
whether the policy change is a rate hike or a rate cut. Prior to May 2010, it is rather straightforward
to categorize the policy cycles by tracking changes in the lower bound, which was the announced
policy rate. After May 2010, the CBRT started using all three rates of the interest rate corridor (the
upper band, lower band and the weekly repo rate) as active policy tools. During that time, we track
changes in the band values as well as changes in the weighted average funding rate that is deter-
mined by the CBRT to detect policy cycles.5 Table 2 shows the twelve policy cycles that we detected
during our sample period.
[Insert Table 2 about here]
Our sample starts in June 2005, determined by the availability of the 10-year swap rate, and
extends through February 2020. Despite the inflation rate that has been persistently above its target,
the CBRT has been rather hesitant with rate hikes and generous with rate cuts during that time,
with 56 rate cuts and only 18 rate hikes. The vast majority of rate cuts may signal the CBRT’s bias
towards policy easings which explains its poor performance in achieving the inflation target. In the
4Typically this window is only available between 4:00 pm to 6:00 pm and it charges a penalty rate for those banks whohave not met their liquidity needs during business hours.
5The only exception is the policy meeting in August 2011 because the CBRT simultaneously increased the lower boundand decreased the repo rate at this date. We exclude this observation from our analysis.
14
last section where we apply our methodology to Brazil, we confirm a similar bias in Brazil as well,
with 36 rate cuts and 28 rate hikes. Nevertheless, the bias is far more pronounced in the case of
Turkey.
The shaded areas in Figure 3 illustrate the seven easing cycles that we have identified for our
sample period.
[Insert Figure 3 about here]
5.1 Univariate Analysis
5.1.1 The Time Varying Regression Model
In the univariate analysis, we look at the response of the long term rates to monetary policy actions
via equation (1). If the credibility of the central bank is stable over time, one can estimate equation
equation (1) on the days of policy changes (see e.g. Kuttner (2001); Demiralp and Jorda (2004)). Once
we incorporate changes in the credibility, however, we depart from the existing studies and allow
the model parameters to change over time.
Because policy meetings are not necessarily arranged on a regular time schedule and there is not
necessarily a rate change at each policy meeting, the time series of the policy rate changes are not
observed in fixed intervals. Nevertheless, by ordering the policy changes over time, we allow the
parameters to change following a random walk process.
∆iLTt = βt∆iPolicy
t + γZt + εt
βt = βt−1 + ηt
(2)
where εt and ηt are error terms that follow standard bivariate Normal distribution. Zt includes
six-month government bond rate, the order of the policy rate change, USD/TL exchange rate, 5-
year CDS rate, US 10-year Treasury Bond rate,6 and inflation surprises that are calculated from
Bloomberg surveys.
Equation (2) implies that, a priori, we do not expect a change in the response of the long rate, but
6US 10 year yield enters with one lag to account for the time gap.
15
this could change smoothly over time depending on the shocks to credibility. The model specified in
equation (2) can easily be cast into the state space form because it is a special case of the unobserved
components model. We further proceed with Bayesian inference in order to take the uncertainty in
the unobserved components and the parameters jointly into account. This is crucial in our analysis
given the limited number of observations, which aggravates the uncertainties on the parameters as
well as the unobserved components. In order to let the data speak, we use noninformative priors
together with a Gaussian likelihood function. We employ the Gibbs sampler for drawing a sample
from the joint posterior of the model parameters and unobserved components. Because the state
space model is linear and Gaussian, the inference on the unobserved components is carried out
using a Kalman filter coupled with a simulation smoother.7
The dependent variable in equation (2) is the 10-year USD/TL swap rate (iLTt ).8 In most emerging
markets with underdeveloped government bond markets, the swap market is more complete than
the government bond market, and is thus used as the long term rate. Another reason for using the
swap rate is that the data goes back to 2005 while 10-year government bond rate data only starts in
2010.
Our goal is to investigate the response of the long term rate to monetary policy actions. Thus,
equation (2) is estimated for a sample of policy easings and policy tightenings separately. As noted
in the earlier literature, on the day of a policy action, financial markets only respond to the unantic-
ipated component of the policy action because the response to the anticipated component already
takes place in the days prior to the action. Carpenter and Demiralp (2006) document evidence that
anticipated changes in the policy rate are reflected in the interbank market rates in the days before a
policy action. Lange et al. (2003) present evidence of adjustment in broader financial markets prior
to policy actions. Hence, if we limit our analysis to the day of the policy action and find a limited re-
sponse, we would inevitably neglect the response to the anticipated policy and reach the potentially
improper conclusion that CBRT cannot control the long rate. Thus, to capture the full response of
long rates to monetary policy, we need to focus on the period before the policy action as well.
7We do not provide the estimation details because inference of the linear Gaussian unobserved components model hasbecome a common practice, but we refer to Carter and Kohn (1994) and Durbin and Koopman (2012) for specific detailsand a textbook exposition.
8The rate on a 10 year swap is the fixed rate that the borrower demands in return for the uncertainty of having to paythe floating rate over ten years. For example, if a Turkish company borrows USD, it makes interest payments based on3-month Libor rate. In exchange, it lends TL for which it charges the fixed rate which is the 10-year interest rate on TL.
16
In order to capture anticipated policy actions before a rate change (∆iPolicyt ), we look at the change
in the one month forward implied yield in the 25 business day period prior to a policy action on day
t.9 Implied forward rate reflects the average expected policy changes for the next 30 days. Policy
meetings of the CBRT are scheduled approximately four weeks apart, which supports the use of
implied forward rates to capture expectations about the upcoming policy meeting.10
[Insert Figure 4 about here]
The left panel of Figure 4 shows the estimation results for the easing cycles detected in Table 2. We
include the 95% (and 90%) Highest Posterior Density Interval (HPDI) covering the posterior mean
of the response parameter, βt. Recall that a decline in credibility is associated with a decline in the
size of βt while an improvement in credibility is associated with an increase in βt. We note that there
is a significant decline in the size of βt over the course of our sample. Following a 1 percentage point
rate cut, long term rates declined over 1 percent at the beginning of our sample. This value gradually
declined to zero by the time we reached the end of our sample, consistent with a deterioration in
credibility. We argue that the persistence of the widening gap between the target and the inflation
rate as illustrated in Figure 1) is one of the main factors contributing to the erosion in credibility
that we detected (see Gulsen and Kara, Forthcoming). Related to this point, as shown in Figure 1 in
Demiralp and Demiralp (2019), political pressures over the CBRT increased significantly over this
time period further weakening credibility as noted by Bernanke (2007). Two additional factors may
have contributed to the insignificant response of long term rates besides weaker credibility: First, as
we noted earlier, CBRT implemented an asymmetric corridor policy after 2010 where the effective
rate was occasionally allowed to fluctuate within the corridor in the absence of a change in the
official policy rate. CBRT implemented this policy deliberately to limit speculative capital inflows at
a time when the risk appetite was high. To the extent that market participants perceived this policy
to be less transparent about the long term goals of monetary policy, long term response could be
limited. Second, the insignificant results during the latest easing cycle could be at least partially due
9Implied yields are annualized interest rates for the given currency and tenor, derived from the covered interest rateparity theorem. They are derived from the prevailing spot and forward rates for the Turkish Lira versus the US Dollar forthe 30-day period, along with the US interest rate for the same period.
10There is not a futures market for the interbank market in Turkey to allow us to extract market expectations of a policymove a la Kuttner (2001). Similarly, OIS instrument is only available for the 2007-2013 period but for maturities longerthan one year, which rules out their use as a proxy for short term policy expectations.
17
to the restrictions imposed on capital flows which reduced the sensitivity of interest rates to policy
moves. 11 That being said, the figure clearly reflects that the gradual decline in credibility is not
limited to the most recent easing cycle after July 2018.
The right panel of Figure 4 shows the corresponding figure for rate hikes. In this case, a dete-
rioration in credibility is associated with an increase in the size of βt which should become more
positive as the credibility declines. In fact, the figure is highly consistent with this expectation. In
the beginning of our sample, a 1 percentage point anticipated rate hike is associated with an almost
one-to-one decline in long rates, which gradually diminishes over the course of the sample and ap-
proaches zero. That is, CBRT’s ability to lower long term interest rates with rate hikes declines over
time, consistent with the erosion in its credibility. Overall, the univariate analysis suggests strong
evidence that there is a gradual decline in the credibility of the central bank, as the political pressures
have increased and the CBRT’s poor performance in inflation targeting has become more evident.
The analysis in this section allowed for the response variable’s coefficient to change over time
while the coefficients of the control variables remained constant. As a robustness check, we estimate
the model with time varying coefficients on the control variables as well. The results are qualitatively
similar albeit with wider High Posterior Density Intervals (HPDI). This is because allowing for all
coefficients to change over time reduces the precision of the estimation substantially, particularly in
the presence of a limited number of observations.
5.1.2 Alternative Definitions of Credibility
As we noted in the introduction, there are alternative definitions of credibility, most of which are
defined in environments where inflation expectations are well-anchored. In this section, we consider
some of these alternative measures, adopt them to the EM framework and illustrate that they may
yield inconclusive results regarding the evolution of credibility.
It is common to define anchored expectations as delinking inflation expectations from the actual
inflation rate. Bernanke (2007) defines the case of anchored expectations as the framework in which
the public shows little reaction to an inflation spell that is higher than long run expectations. If
11We would like to thank Hakan Kara for bringing these points to our attention.
18
the public responds to short spells of inflation, however, expectations are not anchored, which is
a sign for weak credibility. Various researches used this framework to test credibility or anchored
expectations (see e.g. Levin et al. (2004); Demertzis et al. (2012), among others). In this section, we
consider this alternative definition of credibility that focuses on the relationship between changes in
the actual inflation rate and inflation expectations such that:
∆iLTt = δ1,t∆πtDummy− + δ2,t∆πtDummy+ + εt
δ1,t = δ1,t−1 + η1,t
δ2,t = δ2,t−1 + η2,t
(3)
where ∆πt shows the three month moving average change in the inflation rate during the period
prior to the monetary policy action, Dummy− is a dummy variable that captures declines in the av-
erage inflation rate, and Dummy+ a dummy variable that captures increases in the average inflation
rate.
Inflation expectations are not affected from the fluctuations in the actual inflation rate if they are
well anchored. Using long term interest rates as a measure of inflation expectations, this implies
that δ1 = δ2 = 0 in our set up. If inflation expectations are not anchored, however, then inflation
expectations adjust with changes in the inflation rate so that δ1 > 0 and δ2 > 0. Thus, a strong test for
credibility would necessitate δ1 and δ2 to converge to zero over time, which would reflect a gradual
anchoring of inflation expectations. If credibility remains weak, however, it is harder to identify the
dynamic changes in credibility if δ1 and δ2 remain positive and hover in the positive territory. If
inflation expectations are not well anchored, it necessitates a sea change for inflation expectations to
become unresponsive to actual inflation. Until then, any gradual improvement in credibility would
remain undetected with this blunt definition. Thus, the test results would fail to identify changes in
credibility, other than suggesting overall weak credibility.
Figure 5 shows the estimation results.
[Insert Figure 5 about here]
We note that both δ1 and δ2 remain positive throughout our sample period, reflecting weak cred-
ibility. Furthermore, we do not observe a convergence of δ2 towards zero to indicate any improve-
19
ments in credibility. The strong disinflationary period in 2004 is somewhat reflected in the right
panel where inflation expectations seem to be more responsive to the reductions in the inflation rate
earlier in the sample compared to the later periods. Overall, these results suggest that in an environ-
ment of unanchored expectations, inflation expectations are highly responsive to the actual inflation
rate, and this rough metric is not suitable to identify any incremental changes in credibility.
A popular measure of credibility that is closely related to the previous one focuses on the de-
viations of inflation expectations from the target. However, the previous analysis illustrated that
in an environment of unanchored expectations, inflation expectations move with changes in the ac-
tual inflation rate. Hence a temporary decline in the inflation rate might push inflation expectations
towards the target and inaccurately suggest improved credibility.
In order to demonstrate this claim, we illustrate the index developed by Altug and Cakmaklı
(2016) for our sample period. Altug and Cakmaklı (2016) develop a monthly metric of central bank
performance based on the deviation of model and survey implied measures of inflation expecta-
tions from the target inflation. Specifically, they utilize an unobserved component specification to
explicitly model the trend, cyclical, and seasonal components of inflation for Turkey and Brazil. Us-
ing this model, a monthly measure of inflation expectations is obtained. They align model based
predictions of inflation with those from surveys in a statistically coherent way. This allows them
to construct a monthly measure of inflation expectations despite the fact that surveys only gather
inflation expectations over the next month or the next year. They further incorporate target inflation
into the unobserved components framework to measure the monthly discrepancy between inflation
expectations and the target inflation in a time varying fashion (see Altug and Cakmaklı (2016) for
further details on model structure).
Figure 6 shows the estimated gap between the target and inflation expectations.
[Insert Figure 6 about here]
As the index becomes negative, inflation expectations exceed the target. Thus, as the index gets less
negative, it reflects a convergence of inflation expectations to the target and hence an improvement
in credibility. Using this metric, we note that the CBRT started with weak credibility in the period
after 2001 crisis. This period corresponds to the early years of the new central banking regime
20
where the CBRT was granted independence. Credibility improves in the years that follow until
2006-2008. Recall from Figure 1 that the target is reduced to 4 percent during that time. As the actual
inflation rate remains significantly above the target, however, credibility weakens. After a brief
improvement until 2010, credibility follows a downwards trend afterwards. The overall pattern in
CBRT’s credibility that is detected by this measure is consistent with Levieuge et al. (2018), who
develop a similar index based on the gap between inflation expectations and the target.
An interesting pattern emerges through the end of the sample. The index suggests an improve-
ment in credibility unlike our benchmark results. The underlying reason for the improvement in
inflation expectations is the decline in the inflation rate after the sharp increase in 2018 due to the
exchange rate crisis. Thus, the improvement in inflation expectations is due to a normalization in the
actual inflation rate, rather than a more hawkish monetary policy stance that is adopted to establish
credibility. To the contrary, CBRT cut the policy rate rather aggressively throughout 2019.
Overall, our analysis in this section suggests that measures of credibility that focus on the sensi-
tivity of inflation expectations to the actual inflation rate may be misleading regarding the evolution
of credibility in an EM context. When inflation expectations are not anchored, they move with the
monthly fluctuations in the inflation rate that are not directly controlled by the central bank.
Where does this discussion take us? Before we move on to multivariate analysis, we go over the
alternative definitions of credibility that we consider in this paper to wrap up this section.
Monetary Policy Inflation Expectations
Inflation
(1)
(2b)(2a)
The first channel (1) describes our baseline specification where monetary policy actions are di-
rectly associated with revisions in inflation expectations through long term interest rates. The second
channel describes the alternative where monetary policy actions cause changes in the inflation rate
(2a), and changes in the inflation rate cause corresponding adjustments in inflation expectations (2b).
In an environment of well anchored expectations, current monetary policy decisions do not have
21
any impact on long term inflation expectations. Ironically, when there is no credibility and unan-
chored expectations, monetary policy is once again ineffective in influencing inflation expectations.
Hence, link (1) should be non-existent in the case of perfect credibility or no credibility. When there
is perfect credibility, (2b) is nonexistent as well. While the two channels tend to work in harmony
when expectations are well anchored, they may not perform in synch in the case of weak or no
anchor. When there is imperfect anchoring, inflation expectations respond to interest rate deci-
sions consistent with improvements in credibility (as we have documented in the previous section).
Meanwhile, they mostly move one to one with the actual inflation rate regardless of marginal im-
provements in credibility until price stability is achieved and inflation expectations are anchored
(Erceg and Levin, 2003; Blanchflower and MacCoille, 2009). (2a) is harder to identify because the
actual inflation rate can change due to external shocks in addition to monetary policy actions. Fur-
thermore, because the inflation rate is measured at the monthly frequency, it is not straightforward
to capture how it changes after a monetary policy action. Turning to the second leg, in principle, (2b)
should weaken with improvements in credibility. Nevertheless, the evidence in the previous section
reflects that this channel is less sensitive to marginal improvements in credibility and more prone to
external shocks to inflation that are not directly controlled by the central bank. In this regard, the
second channel works as more of a litmus test reflecting whether or not expectations are anchored
rather than capturing gradual changes in credibility. Thus, the measures in the literature based on
the second channel do not adequately address the graduate adjustments with respect to credibility.
Instead, our measure that directly measures the impact of monetary policy decisions on inflation
expectations works better in such environments.
5.2 Multivariate Analysis to Measure Changes in Credibility
Armed with evidence that our measure of credibility performs better when expectations are unan-
chored, in this section, we complement our analysis with a Time Varying Parameters Vector Au-
toRegression analysis (TVP-VAR). While the univariate analysis has the advantage of focusing on
the short-term response to anticipated policy prior to the policy action, the VAR analysis allows us
to investigate the long-term response to unanticipated policy after the rate decision. Furthermore,
the VAR allows us to account for contemporaneous and dynamic interactions among the variables
22
in the system unlike the regression analysis using a single equation.
In our analysis, we assume a recursive scheme by employing Cholesky decomposition to the
reduced form to obtain structural shocks and the resulting Impulse Response Functions (IRFs). As
in the previous section, we allow time variation in model parameters to allow for asymmetric effects
with varying amplitudes. Let yt be the vector of monthly observations in month t. The TVP-VAR
model is defined as follows:
yt = c + B1,tyt−1 + · · ·+ Bp,tyt−p + ut ut ∼ N(0, Ωt)
βt = βt−1 + vt vt ∼ N(0, Q)
log(σt) = log(σt−1) + ηt ηt ∼ N(0, S)
αt = αt−1 + ψt ψt ∼ N(0, W)
(4)
where βt is a vector that is formed by stacking all the elements of B1,t, . . . , Bp,t in a single vector. We
decompose Ωt further as A−1t ΣtΣ′t A−1
t′. αt is a vector that is formed by stacking all the non-zero
elements of At in a single vector. Finally, σt is a vector that is formed by stacking all the diagonal
elements of Σt in a single vector. Similar to the previous section, we follow Bayesian inference for
the estimation of the model parameters and related IRFs using the practice followed by Primiceri
(2005).
The VAR system includes six endogenous variables in the following Cholesky ordering: Indus-
trial Production Index (IP), inflation rate, five-year CDS risk premia, USD/TL exchange rate, in-
terbank repo rate, and the 10-year USD/TL swap rate. The IP series is seasonally adjusted and in
logarithm form. We use the detrended data using the HP filter for computing the trend. We use
the interbank repo rate as the policy rate.12 Our structural identification scheme relies on the as-
sumptions that, at the monthly frequency, the CBRT can respond to macroeconomic and financial
market variables contemporaneously. Changes in the policy rate in turn affect longer term rates
immediately.
Figure 7 shows the response of long term interest rates to an unanticipated rate cut.
12Binici et al. (2019) show that in the period after 2011 when the CBRT used multiple policy rates, interbank rate is themost relevant rate for the monetary transmission mechanism. For the period before 2011 the interbank rate was settled atthe lower bound through CBRT’s liquidity policies.
23
[Insert Figure 7 about here]
For illustration purposes, we show three graphs that are approximately at the beginning, middle,
and the end of our sample which show the evolution of the responses over time. The panel on the
left shows that in the beginning of our sample, a rate cut is associated with further declines in the
long rate, consistent with a credible central bank. As we move to the middle panel, we observe
that the significance of the negative relationship decreases. By the time we reach September 2016,
the CBRT is no longer able to lower longer term rates when it cuts its policy rate, consistent with a
decline in credibility. These results are consistent with our findings in the univariate analysis.
Figure 8 shows the impulse response functions associated with a rate hike.
[Insert Figure 8 about here]
This time, credibility necessitates a negative response of the long rate following a rate hike. At
the beginning of our sample, we do observe a brief decline in the long rate following a rate hike.
Nevertheless, this negative response disappears by 2011 and does not get reestablished until the
end of our sample. While the results for tightenings are also consistent with a decline in credibility,
the findings are not as strong as the case of rate cuts, likely due to a fewer number of observations.
As a robustness check, we consider alternative VAR orderings. Starting from our default order-
ing, which was: IP, Inflation rate, CDS, Exchange rate, overnight repo rate, and the 10-year swap
rate, one can speculate that exchange rate changes affect the risk premium in a contemporaneous
fashion rather than the other way around. As we change the ordering of CDS and exchange rate,
however, we obtain very similar results, indicating that our results are not sensitive to the ordering
of the variables (not shown).
6 Application of the Methodology to Brazil
In this section, we apply our methodology to another EM to reinforce the performance of our proce-
dure in those environments where inflation expectations are not well anchored.
Brazil adopted inflation targeting in July 1999 with an 8 percent inflation target which was gradu-
24
ally decreased to 4 percent in two years. As of 2020, the target stands at 4 percent, which is projected
to decline to 3.5 percent by 2022. 6 shows the inflation rate against the inflation target. The early IT
experience in Brazil was choppy, with a combination of external and domestic shocks such as the
domestic energy crisis in Brazil, the Argentina crisis, and the confidence crisis related to the presi-
dential election in 2002 that put upwards pressure on the inflation rate. The inflation performance
improved during the disinflationary era, in the aftermath of the Great Financial Crisis (GFC), with
the actual inflation rate converging to international benchmarks. While the inflation rate generally
remained over the target until 2017, there was a significant spike in 2015. After 2017, the global disin-
flationary period led to an undershoot of the target. Similar to Turkey’s experience, inflation targets
were only met when international financial conditions were favorable such that the exchange rate
helped the Brazilian Central Bank (BCB)’s efforts to keep inflation under control. Unlike CBRT’s ex-
perience, however, Brazil shared the disinflationary wave with the rest of the world after GFC while
Turkey was not able to benefit from that low inflation environment.
Figure 10 shows the policy rate (Selic rate) along with the easing cycles that we identified based
on the reductions in the Selic rate.
[Insert Figure 10 about here]
In the sample period after 2005, there are 36 rate cuts and 28 rate hikes. Similar to Turkey, BCB has
a tendency to ease more eagerly although the bias is far more pronounced in the case of Turkey.
Furthermore, the aggressive easings in the post-2017 period are easier to justify in the Brazilian case
given that they undershot inflation during that time.
Figure 11 shows the estimation results of equation (2) for Brazil.
[Insert Figure 11 about here]
We use the 10-year USD swap rate for the long rate and 1-year USD swap rate for the short rate. The
rest of the control variables are analogous to their counterparts for Turkey.
Focusing on the easings, we observe that the coefficient estimates are negative and significant
during the easing cycle in 2006, which gradually become insignificant later in the sample. Recall
from Figure 6 that the inflation rate was below the target in 2006 and 2007. Thus, the increase in
25
inflation expectations in response to a rate cut is consistent with credibility during that time. In the
subsequent years, however, rate cuts are implemented in an environment where the inflation rate
remained higher than the target. During that time, our results suggest that monetary policy was
not able to lower inflation expectations, suggesting weak credibility. Weak credibility prevails in
the post-2017 period as well. During this period of undershooting, BCB cannot increase inflation
expectations to the target rate despite its aggressive rate cuts. This finding is supported in the TVP-
VAR analysis as well ((14).
Turning to tightenings, we observe that the tightening cycle in 2008, which came at a time when
inflation rate was not significantly above the target was well received by market participants as a
hawkish move and lowered inflation expectations. Nevertheless, credibility declines later in the
sample period, as inflation diverges further away from the target. TVP-VAR results are consistent
with univariate analysis where BCB cannot control the long term rate with its tightening cycles in
the period after 2008 (15).
Figure 12 shows the estimation results of equation (3) for Brazil.
[Insert Figure 12 about here]
Similar to Turkey’s experience, we note that the coefficient associated with changes in the inflation
rate is positive and the inflation expectations respond to fluctuations in the actual inflation rate in a
symmetric way, confirming general weak credibility.
Figure 13 shows the estimation results using the inflation index.
[Insert Figure 13 about here]
Using this measure, we observe that BCB’s credibility was generally stable in the period after 2005.
During periods when the BCB overshot inflation, the index remains below zero. When BCB under-
shot inflation, the index remains above zero. The negative deviations are not as large as the Turkish
case, reflecting BCB’s better performance in providing an upper limit for the inflation rate. Never-
theless, the index measure is more pessimistic compared to our benchmark measure that suggested
that BCB was successful in increasing inflation expectations through its rate cuts during 2006-2007
easing cycle. Because the inflation rate remain below the target during 2006-2007, the index detects
26
poor credibility during that time. In contrast, our benchmark measure suggests that even though
the inflation rate remained below the target, BCB was able to control inflation expectations with its
rate cuts.
How do these findings compare to the literature? Evidence of credibility at the beginning of our
sample is in harmony with the earlier studies. Carvalho and Minella (2009) find that credibility was
strong for the sample that goes through the end of 2008 because BCB’s target played a role in the
formation of inflation expectations.
The general trend that we detect with our benchmark methodology is consistent with Montes
et al. (2016). Following Svensonn’s definition, they estimate the index developed by de Mendonca
(2007). They find that credibility follows a declining trend in the period after 2008. de Freitas Val
et al. (2017) exploit Svensson’s definition of credibility as well and find that credibility of BCB de-
clined in the second half of 2008 during GFC and remained stable from 2009 to mid-2015. The
decline in credibility in the second half of 2015 was followed by a recovery after mid-2016. Similarly,
Montes et al. (2016) find a temporary improvement in credibility in the first half of 2015 that is not
maintained afterwards.
The decline in credibility that is detected in these papers is related to the poor inflation perfor-
mance of BCB, particularly in 2015 that is triggered by the depreciation in local currency. These find-
ings are consistent with Figures 12 and 13 that focus on the responsiveness of inflation expectations
to actual inflation. Our benchmark findings differ from these studies during 2006-2007. Further-
more, we do not detect an improvement in credibility early in 2015 that is followed by a deterioration
afterwards because our methodology is not reliant on the changes in the inflation rate.
7 Conclusions
Central Bank credibility is a critical concept in modern central banking. It is acknowledged by
many central bankers that monetary policy works essentially through guiding inflation expectations
towards the target, which heavily depends on credibility. The literature on central bank credibility
focuses on measures that are primarily developed for environments where inflation expectations
are anchored. Such measures perform well in detecting deviations from that anchor. We illustrate
27
that measures that focus on the ”gap” between inflation expectations and the target do not work
very well in environments were inflation expectations are not well anchored. As an alternative, we
develop a new measure of credibility by adopting Goodfriend’s definition in a Bayesian framework
to capture the evolution of credibility over time.
We apply our measure to Turkey to show that credibility declined gradually as the CBRT’s per-
formance deteriorated and political pressures escalated. The measures based on the ”gap” overlook
this deterioration in the post-2019 period when the inflation rate normalized after the exchange rate
crisis. Such measures yield the conclusion that the gap narrowed and that credibility improved at a
time where it was actually acknowledged in the local and the foreign media that central bank cred-
ibility was on the loose. By developing a measure that is not directly related to external inflation
shocks that cannot be controlled by the central bank, we offer a credibility measure that is more
reliable in an EM context with a volatile inflation environment. Furthermore, our measure allows us
to estimate the effects of monetary policy on expectations. Hence, it is a complementary measure to
the ”gap” based measures even in the context of advanced economies where inflation expectations
are well anchored.
Our findings of poor credibility is particularly important in the post COVID-19 world where
emerging market central banks joined their advanced economy counterparts in implementing ag-
gressive QE policies (see Cakmaklı et al. (2020)). The performance of individual central banks in
their post-QE experience will depend on their credibility among other factors. Our results in this
paper suggests that Turkey is caught with the pandemic at a bad time in terms of weak central bank
credibility. Thus, QE in Turkey requires particularly clear communication about the QE program
and a well defined the exit strategy in order to offset inflationary risks. While Brazil did not im-
plement QE during COVID-19 crisis, our findings suggest that BCB also faces challenges regarding
its ability to increase inflation expectations back to the target in the global low growth environment
after COVID-19.
28
References
Alper K, Binici M, Demiralp S, Kara H, Ozlu P. 2018. Reserve requirements, liquidity risk, and banklending behavior. Journal of Money, Credit and Banking 50: 817–827.
Altug S, Cakmaklı C. 2016. Forecasting inflation using survey expectations and target inflation:Evidence for brazil and turkey. International Journal of Forecasting 32: 138–153.
Amisano G, Tronzano M. 2010. Assessing european central bank’s credibility during the first yearsof the eurosystem: A bayesian empirical investigation. The Manchester School 78: 437–459.
Barro RJ, Gordon DB. 1983. Rules, discretion and reputation in a model of monetary policy. Journalof monetary economics 12: 101–121.
Bernanke B. 2007. Inflation expectations and inflation forecasting. Remarks given at the MonetaryEconomics Workshop of the NBER Summer Institute, Cambridge Mass., July 10.
Bernanke B. 2010. Central bank independence, transparency, and accountability. At the Institute forMonetary and Economic Studies International Conference, Bank of Japan, Tokyo, Japan.
Binici M, Kara H, Ozlu P. 2019. Monetary transmission with multiple policy rates: evidence fromturkey. Applied Economics 51: 1869–1893.
Blanchflower DG, MacCoille C. 2009. The formation of inflation expectations: an empirical analysisfor the uk. Technical Report 15388, National Bureau of Economic Research.
Blinder AS. 2012. Central bank independence and credibility during and after a crisis. TechnicalReport 229, Griswold Center for Economic Policy Studies.
Bomfim AN, Rudebusch GD. 2000. Opportunistic and deliberate disinflation under imperfect cred-ibility. Journal of Money, Credit and Banking : 707–721.
Bordo M, Siklos P. 2014. Central bank credibility, reputation and inflation targeting in historicalperspective. Working Paper 20693, National Bureau of Economic Research.
Carpenter SB, Demiralp S. 2006. Anticipation of monetary policy and open market operations. In-ternational Journal of Central Banking .
Carter CK, Kohn R. 1994. On gibbs sampling for state space models. Biometrika 81: 541–553.
Carvalho FAd, Minella A. 2009. Market Forecasts in Brazil: performance and determinants. WorkingPapers Series 185, Central Bank of Brazil, Research Department.
Castelnuovo E, Rodriguez-Palenzuela D, Nicoletti Altimari S. 2003. Definition of price stability,range and point inflation targets: the anchoring of long-term inflation expectations. WorkingPaper Series 273, European Central Bank.
Cakmaklı C, Demiralp S, Kalemli-Ozcan c, Yesiltas S, Yıldırım MA. 2020. Covid-19 and emergingmarkets: An epidemiological model with international production networks and capital flows.Working Paper 27191, National Bureau of Economic Research.
Cecchetti SG, Krause S, et al. 2002. Central bank structure, policy efficiency, and macroeconomicperformance: exploring empirical relationships. Review-Federal Reserve Bank of Saint Louis 84: 47–60.
Cook T, Hahn T. 1989. The effect of changes in the federal funds rate target on market interest ratesin the 1970s. Journal of Monetary Economics 24: 331–351.
Cukierman A, Meltzer AH. 1986. A theory of ambiguity, credibility, and inflation under discretionand asymmetric information. Econometrica 54: 1099–1128.
Davis JS. 2012. Re-establishing credibility: the behavior of inflation expectations in the post-volckerunited states. Technical Report 117, Federal Reserve Bank of Dallas Globalization and MonetaryPolicy Institute.
de Freitas Val F, Gaglianone WP, Klotzle MC, Pinto ACF. 2017. Estimating the Credibility of BrazilianMonetary Policy using Forward Measures and a State-Space Model. Working Papers Series 463,Central Bank of Brazil, Research Department.
de Mendonca H. 2007. Towards credibility from inflation targeting: the brazilian experience. appliedEconomics 39: 2599–2615.
De Pooter M, Robitaille P, Walker I, Zdinak M. 2014. Are Long-Term Inflation Expectations WellAnchored in Brazil, Chile, and Mexico? International Journal of Central Banking 10: 337–400.
Demertzis M, Marcellino M, Viegi N. 2012. A credibility proxy: Tracking us monetary developments.The BE Journal of Macroeconomics 12.
Demir B, Yigit TM. 2008. Announcements and credibility under inflation targeting. Economics Letters100: 249–253.
Demiralp S. 2008. Monetary policy surprises and the expectations hypothesis at the short end of theyield curve. Economics Letters 101: 1–3.
Demiralp S, Demiralp S. 2019. Erosion of central bank independence in turkey. Turkish Studies 20:49–68.
Demiralp S, Jorda O. 2004. The response of term rates to fed announcements. Journal of Money, Creditand Banking : 387–405.
Demiralp S, King S, Scotti C. 2019. Does anyone listen when politicians talk? the effect of politicalcommentaries on policy rate decisions and expectations. Journal of International Money and Finance95: 95–111.
Durbin J, Koopman SJ. 2012. Time series analysis by state space methods. Oxford university press.
Erceg CJ, Levin AT. 2003. Imperfect credibility and inflation persistence. Journal of monetary economics50: 915–944.
Faust J, Svensson LEO. 2001. Transparency and credibility: Monetary policy with unobservablegoals. International Economic Review 42: 369–397.
Fraga A, Goldfajn I, Minella A. 2003. Inflation targeting in emerging market economies. WorkingPaper 10019, National Bureau of Economic Research.
Goldberg LS, Klein MW. 2011. Evolving perceptions of central bank credibility: The european centralbank experience. In NBER International Seminar on Macroeconomics, volume 7. JSTOR, 153–182.
Goodfriend M. 1993. Interest rate policy and the inflation scare problem: 1979-1992. FRB RichmondEconomic Quarterly 79: 1–23.
Gulsen E, Kara H. Forthcoming. Policy performance and the behavior of inflation expectations.International Journal of Central Banking .
Gurkaynak RS, Levin AT, Marder AN, Swanson ET. 2007. Inflation targeting and the anchoring ofinflation expectations in the western hemisphere. Technical Report 11, Banco Central de Chile.
Gurkaynak RS, Sack B, Swanson E. 2005. The sensitivity of long-term interest rates to economicnews: Evidence and implications for macroeconomic models. American economic review 95: 425–436.
Kara H. 2013. Monetary policy after the global crisis. Atlantic Economic Journal 41: 51–71.
Kuttner KN. 2001. Monetary policy surprises and interest rates: Evidence from the fed funds futuresmarket. Journal of monetary economics 47: 523–544.
Kydland FE, Prescott EC. 1977. Rules rather than discretion: The inconsistency of optimal plans.Journal of political economy 85: 473–491.
Lange J, Sack B, Whitesell W. 2003. Anticipations of monetary policy in financial markets. Journal ofMoney, Credit and Banking : 889–909.
Levieuge G, Lucotte Y, Ringuede S. 2018. Central bank credibility and the expectations channel:Evidence based on a new credibility index. Review of World Economics 154: 493–535.
Levin AT, Natalucci FM, Piger JM, et al. 2004. The macroeconomic effects of inflation targeting.Review-Federal Reserve Bank of Saint Louis 86: 51–8.
Mariscal IBF, Wong W, Howells P. 2011. Measuring the PolicymakeraTMs Credibility: The Bankof England in a˜niceaTM and a˜not-so-niceaTM times. Working Papers 20111110, Department ofAccounting, Economics and Finance, Bristol Business School, University of the West of England,Bristol.
Montes G, de Oliveira AJ, Nicolay R. 2016. Fiscal credibility and central bank credibility: How dowe build them? empirical evidence from brazil. Unpublished manuscript.
Primiceri GE. 2005. Time varying structural vector autoregressions and monetary policy. The Reviewof Economic Studies 72: 821–852.
Romer CD, Romer DH. 2000. Federal reserve information and the behavior of interest rates. AmericanEconomic Review 90: 429–457.
Sims CA, Zha T. 1999. Error bands for impulse responses. Econometrica 67: 1113–1155.
Svensson LE. 1993. The simplest test of inflation target credibility. Working Paper 4604, NationalBureau of Economic Research.
Tronzano M. 2005. Inflation targeting and credibility: a note on the recent empirical literature. Econo-mia Internazionale/International Economics 58: 489–506.
31
Yellen J. 2006. Enhancing fed credibility. Luncheon Keynote Speech to the Annual WashingtonPolicy Conference Sponsored by the National Association for Business Economics (NABE).
32
Tables and Figures
Table 1: Average inflation rate in emerging markets over 2010-2018
1. Slovakia 1.32. Poland 1.53. Czech Republic 1.54. Thailand 1.75. Hungary 2.36. Romania 2.47. Peru 3.08. Chile 3.09. Colombia 3.710. Mexico 3.811. Dominican Republic 3.912. Serbia 4.813. South Africa 5.214. Brazil 6.115. Russia 7.316. Turkey 8.0
Table 2: Policy changes
Period Cycle Source of identification1. Jan 2005-May 2006 Easing Begins with the decrease in the lower band
2. Jun 2006-Aug 2007 Tightening Begins with the increase in the lower band
3. Sep 2007-Apr 2008 Easing Begins with the decrease in the lower band
4. May 2008-Oct 2008 Tightening Begins with the increase in the lower band
5. Nov 2008-Sep 2011 Easing
This cycle could potentially end in July 2011 because thelower band increased in August 2011. However, averagefunding rate (AFR) did not increase until October 2011when the upper band was increased. So we choose theend date to be September 2011.
6. Oct 2011-May 2012 Tightening Begins with the increase in the upper band.
7. Jun 2012-May 2013 Easing Begins with the cut in the upper band/
8. Jun 2013-Apr 2014 Tightening AFR starts increasing in June 2013.
9. May 2014- May 2015 Easing Begins with the cut in weekly repo rate.
10. Jun 2015-Feb 2016 Tightening Begins with the rise in AFR even though the official policyrates remained constant.
11. Mar 2016-Oct 2016 Easing Begins with the cut in upper band.
12. Nov 2016-Jul 2019 Tightening Begins with the increase in the weekly repo rate.
13. Jul 2018- Feb 2020 Easing Begins with the decrease in the weekly repo rate.
33
Figure 1: Realized and target inflation rate for Turkey
Note: The blue bars show the inflation target, the solid line shows the realized inflation rate.
34
Figure 2: Yield curve after rate changes
Rate Cut (Not Credible)(2/23/2016)
Rate Hike (Credible)(3/16/2017)
Rate Hike (Not Credible)(12/13/2017)
Note: The graphs display the sovereign bond yields for a given maturity in terms of years given in the x−axis. Colorshould be used in print.
35
Figure 3: Interest rate corridor and the policy cycles
Note: The graph displays several policy rates set by the Central Bank of the Turkish Republic. The shaded areas indicatethe easing cycles.
Figure 4: Responsiveness of the long rate to policy changes
Policy easings Policy tightenings
Note: The graphs display the evolution of the response of the long rate to policy changes, βt in equation (2). The left paneldisplays these in case of rate cuts (in total 56 cuts), the right panel displays these in case of rate hikes (in total 18 hikes).The light grey areas indicate the 95% Highest (Posterior) Density Intervals (HPDI) while the additional dark grey areaindicate the 90% HPDI.
Figure 5: Responsiveness of the inflation expectations to changes in inflation
Increase in inflation Decrease in inflation
Note: The graphs display the evolution of the response of the inflation expectations to changes in inflation. The light greyareas indicate the 95% Highest (Posterior) Density Intervals (HPDI).
36
Figure 6: Estimated deviations of inflation expectations from the target inflation
Note: The graph displays the estimate of discrepancy between inflation expectations and target inflation as measuredusing the methodology developed in Altug and Cakmaklı (2016) for Turkey.
Figure 7: Response of long term rate to a rate cut (-1 unit shock)
September 2005 August 2011 September 2016
Note: The graphs display the responses of 10 year swap rate to an impulse in overnight repo rate up to 36 months. Wedisplay the median response together with 68 percent HPDIs. See Sims and Zha (1999) for details.
Figure 8: Response of long term rate to a rate hike (+1 unit shock)
July 2006 November 2011 September 2018
Note: The graphs display the responses of 10 year swap rate to an impulse in overnight repo rate up to 36 months. Wedisplay the median response together with 68 percent HPDIs. See Sims and Zha (1999) for details.
37
Figure 9: Realized and target inflation rate for Brazil
Note: The blue bars show the inflation target, the solid line shows the realized inflation rate.
Figure 10: Interest rate corridor and the policy cycles
Note: The graph displays the policy rate (SELIC) set by the Central Bank of Brazil. The shaded areas correspond to easingcycles.
38
Figure 11: Responsiveness of the long rate to policy changes for Brazil
Policy easings Policy tightenings
Note: The graphs display the evolution of the response of the long rate to policy changes, βt in equation (2). The left paneldisplays these in case of rate cuts (in total 36 cuts), the right panel displays these in case of rate hikes (in total 28 hikes).The light grey areas indicate the 95% Highest (Posterior) Density Intervals (HPDI) while the additional dark grey areaindicate the 90% HPDI.
Figure 12: Responsiveness of the inflation expectations to changes in inflation
Increase in inflation Decrease in inflation
Note: The graphs display the evolution of the response of the inflation expectations to changes in inflation. The light greyareas indicate the 95% Highest (Posterior) Density Intervals (HPDI).
Figure 13: Estimated deviations of inflation expectations from the target inflation
Note: The graph displays the estimate of discrepancy between inflation expectations and target inflation as measuredusing the methodology developed in Altug and Cakmaklı (2016) for Brazil.
39
Figure 14: Response of long term rate to a rate cut (-1 unit shock)
September 2009 September 2011 October 2016
Note: The graphs display the responses of 10 year swap rate to an impulse in overnight repo rate up to 36 months. Wedisplay the median response together with 68 percent HPDIs. See Sims and Zha (1999) for details.
Figure 15: Response of long term rate to a rate hike (+1 unit shock)
September 2008 January 2011 February 2016
Note: The graphs display the responses of 10 year swap rate to an impulse in overnight repo rate up to 36 months. Wedisplay the median response together with 68 percent HPDIs. See Sims and Zha (1999) for details.


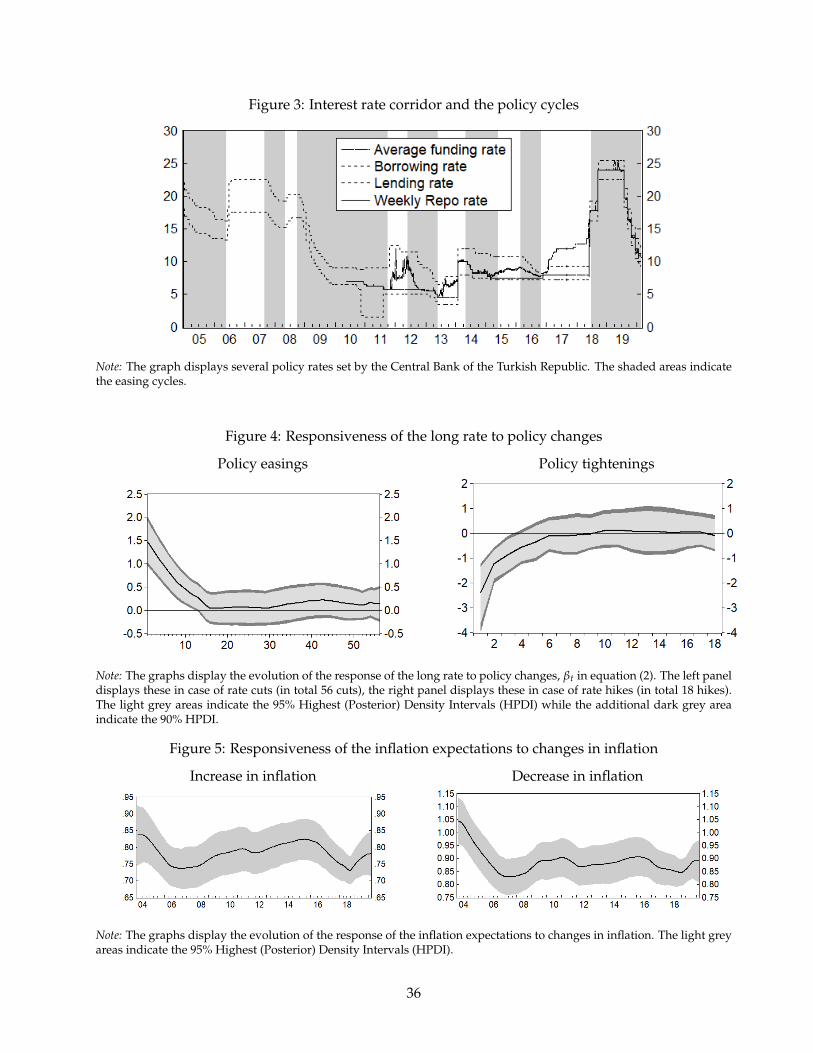


![A note on central bank transparency and credibility in Poland · the co-authors of the article on central bank transparency and credibility in Poland [Łyziak et al. (2007)], for](https://static.documents.pub/doc/80x56/5c94a1bf09d3f26e588d14f2/a-note-on-central-bank-transparency-and-credibility-in-the-co-authors-of-the.jpg)


