16
A Field Chromatographic Method for Determination of Uranium in Soils and Rocks GEOLOGICAL SURVEY BULLETIN 1036-L
A Field Chromatographic Method for Determination of Uranium in Soils and Rocks
GEOLOGICAL SURVEY BULLETIN 1036-L
A Field Chromatographic Method for Determination of Uranium in Soils and Rocks By CHARLES. E. THOMPSON and I-I. W. LAKIN
A CONTRIBUTION TO GEOCHEMISTRY
GEOLOGICAL SURVEY BULLE'T'IN 1036-L
A rapid and inexpensive field method for determination of trace qu·antities of uranium in soils and rocks.
UNITED STATES GOVERNMENT PRINT! NG OFFICE, WASHINGTON : 1957
UNITED STATES DEPARTMENT OF THE INTERIOR
FRED A. SEATON, Secretary
GEOLOGICAL SURVEY
Thomas B. Nolan, Director
For sale by the Superintendent of Documents, U. S. Government Printing Office Washlngton 25, D. C. - Price 15¢ (paper cover)
CONTENTS
Page Abstract__________________________________________________________ 209 Introduction______________________________________________________ 209 Reagents and apparatus____________________________________________ 210 Procedure________________________________________________________ 211
Preparation of sample solution.__________________________________ 211 Prepn,ration of solvent mixture__________________________________ 212 Preparation of chromatograms__________________________________ 212 Preparation of standards_ _ _ _ _ _ _ _ _ _ _ _ _ _ _ _ _ _ _ _ _ _ _ _ _ _ _ _ _ _ _ _ _ _ _ _ _ _ _ 213 Estimation of uranium_________________________________________ 213
D~cus~on________________________________________________________ 213 Effectiveness of s:unple solution_________________________________ 213 lnterferi ng ions____________ _ _ _ _ _ _ _ _ _ _ _ _ _ _ _ _ _ _ _ _ _ _ _ _ _ _ _ _ _ _ _ _ _ _ _ _ 214 Optimum drying of sample aliquots on the paper__________________ 215 Solvent mixture used for separation of uranium ________ . _ _ _ _ _ _ _ _ _ _ 216
H.esuUs___________________________________________________________ 217 Literature cited___________________________________________________ 220
ILLUSTRATIONS
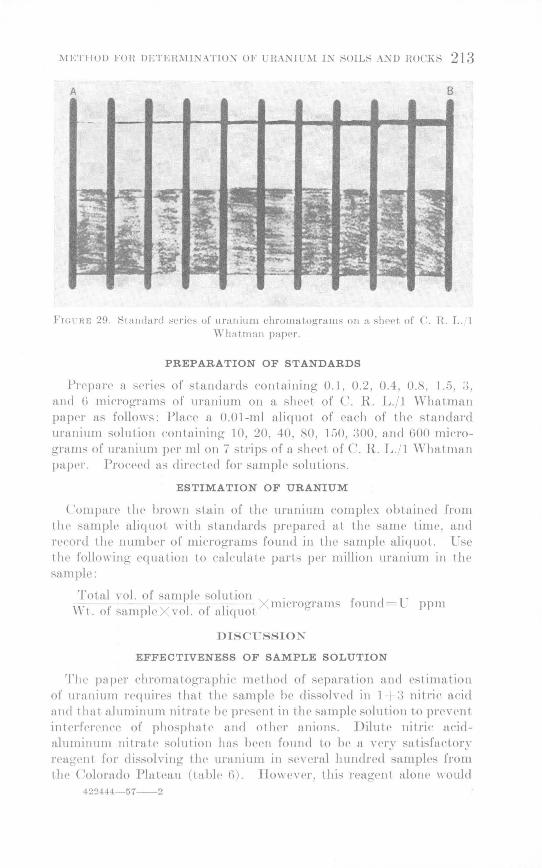
}i'IOURl~ 29. Standard series of uranium chromatograms on a sheet of C. IL L./1 What.man paper____________________________ 213
30. Variation of standard deviation with umuium content_______ 217
TABLES
TABr.,E -1. The effect OIL interfering ions by the addition of Al(N03) 3 to nitric acid_____________________________________________ 214
2. Comparison of estimation of uranium in phosphate rocks by chromatographic and fluorimetric methods_________________ 215
3. Comparison of quality of chromatograms obtained on a 0.05-ml aliquot at 73° F after various periods of drying____________ 216
4. Mean and standard deviation of duplicate uranium determina-tions__________________________________________________ 218
5. Comparison of uranium in crystalline rocks by chromatographic and fluorimetric estimation methods _____ ~-_______________ · 218
6. Comparison of uranium in sedimentary rocks by chromato-graphic and fluorlmetric methods of estimation_____________ 219
III
A CONTRIBUTION TO GEOCHEMISTRY
A FIELD CHROMATOGRAPHIC METHOD FOR DETERMINATION OF URANIUM IN SOILS AND ROCKS
By 0HAHLl!:S E. THOMPSON and H. vV. l.u\KIN
ABSTRAC'J.'
A simple and mpid field method for the ~emiquantita.tive determination of urn,nium in soils and rocks was needed to supplement the Geiger and scintillation counter techniques now used extensively in prospecting for uranium. In the proposed method n.n aliquot of a nitric acid-aluminum nitrate solution of the sample is plficed 011 n, specinJ paper, n.nd the uranium is separated from the other sn,mplc constituents by the upward flow of a solvent mixture through the paper.
The suggested procedttre is n.pplicn.ble to samples contn.ining 4 to 1,200 ppm of uranium, and with a slight modificatiou it can be used for samples containing larger amounts.
By moans of tho propo~ed method relatively unskilled workers can use inexpensive n,nd easily obtn,inablo reagent:'3 and equipment to determine uranium in the field in at least 60 samples of soils and sedimentary rocks ground to 100 mesh during an eight hour day.
INTltODUC'".rJON
Although the first use of chr01natographic techniques was in the separation of organic compounds, the development of partition cluomatography using efficient ion-exchange resins and methods of filter paper chr01natography has Inade chromatographic techniques very useful in inorganic research and analysis. ~1any of these procedures have been c01npiled by Pollard and ~t[c0Inie (1953) and Smith (1953). It is possible to separate closely related elements such as tantalun1 and niobium; cht·o1natographic methods have been developed for the separation and quantitative estin1ation of these elmnents.
The requirements for paper cht·on1atographic techniques are: (1) a solution of the ions to be separated, (2) a strip of paper OL' colun1n of cellulose to support the solution aliquot; the filter paper strips are used for 1nicro mnoun ts; the cohunn of cellulose for n1acro amounts, (3) a solvent to effect the separation of ions in the paper, and (4) a color-producing reagent to indicate the position and relative mnounts of the ions separated.
209
210 CONTRIBUTIONS TO GEOCHEMISTRY
The possibilities of rapid and inexpensive chromatographic methods useful in geochemical prospecting were explored by Hunt, North, and Wells (1955). l\1ost chromatographic techniques are time consuming and the- necessary apparatus is bulky. However, these authors described rapid methods requiring little apparatus for the detennination of uranium, lead, copper, cobalt, and nickel in soils and rocks.
The method described herein is an improvement of the Hunt, North, and Wells paper chromatographic procedure for uranium. The interference of chloride, fluoride, sulfate, and phosphate ions has been greatly reduced, and serious difficulties clue to variation of the salt content of the sample solutim1 I-lave been eliminated. Also, standard conditions for drying the paper have been established which permits the use of the method in any climate.
The authors are grateful for the assistance given them by L. B. Riley in the statistical study of the results obtained by the n1ethod.
REAGENTS AND APPARATUS
All reagents used are of analytical grade. Nitric acid, concentrated. Nitric acid-aluminum nitrate solution. To 1 part concentrated nitric acid and
3 parts water, add aluminum nitrate until a few crystals remain undissolved two hours after the last addition.
Standard uranium solution, 0.1 percent. Dissolve 0.295 gram of U 30s in 65 ml of concentrated nitric acid, transfer the solution to a 250-ml volumetric flask, add 100 ml of water, add aluminum nitrate until a few crystals remain undissolved and dilute to volume with water.
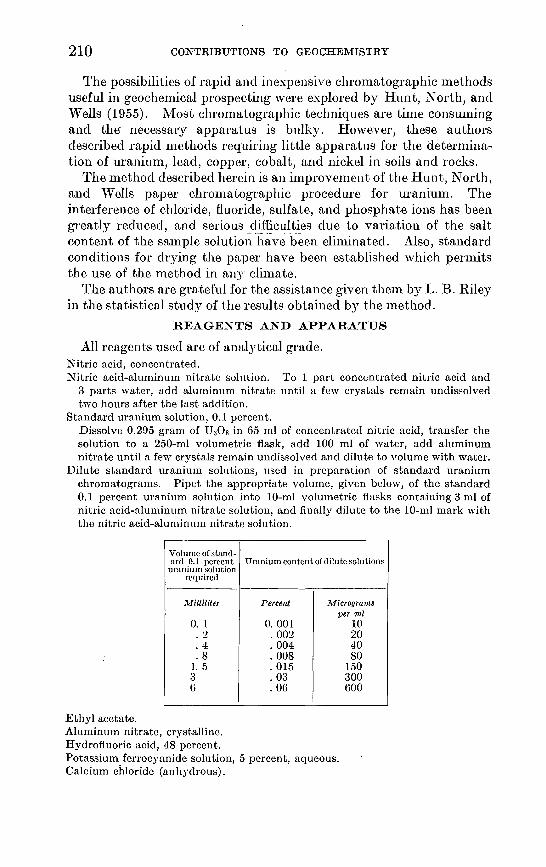
Dilute standard uranium solutions, used in preparation of standard uranium chromatograms. Pipet the appropriate volume, given below, of the standard 0.1 percent uranium solution into 10-ml volumetric flasks containing 3 ml of nitric acid-aluminum nitrate solution, and finally dilute to the 10-ml mark with the nitric acid-aluminum nitrate solution.
Volume of stand-arcl 0.1 percent
uranium solution required
Milliliter
0. 1 .2 .4 .8
I. 5 3 6
Ethyl acetate. Aluminum nitrate, crystalline. Hydrofluoric acid, 48 percent.
Uranium content of dilute solutions
Percent Micrograms JJer ml
0. 001 10 . 002 20 . 004 40 . 008 80 . 015 150 . 03 300 . 06 600
Potassium ferrocyanide solution, 5 percent, aqueous. Calcium chloride (anhydrous).
ME'l'HOD FOH DE1'ERMINATION OF UHANIUM IN SOILS AND ROCKS 211
WhaLman C.R.L./1 chromatographic p·aper. Culture tubes, Hi x 125 mm, borosilicate glass. Test tube rack, capacity 40 tubes. Cylinders, graduated, 50 ml and 10 ml. Balance, sensitivity 2 mg. Beakers, 600 ml. Dishes, platinum, 50 ml. Dishes, porcelain, 50 ml. Stirring rod, plastic. \Vatch glasses, 125-mm diameter. Indicator spray bottle or atomizer. Flasks, volumetric, 250 and 10 ml. Pipets, serological, 0.1 and 1 ml, graduated. Pipets, volumetric, 1 and 2 ml. Pipets, micro, 0.01 and 0.05 ml. 1
Stove, gasoline, portable Water bath Desiceator, inside diameter 150 mm.
PROCEDURE PREPARATION OF SAMPLE SOLUTION
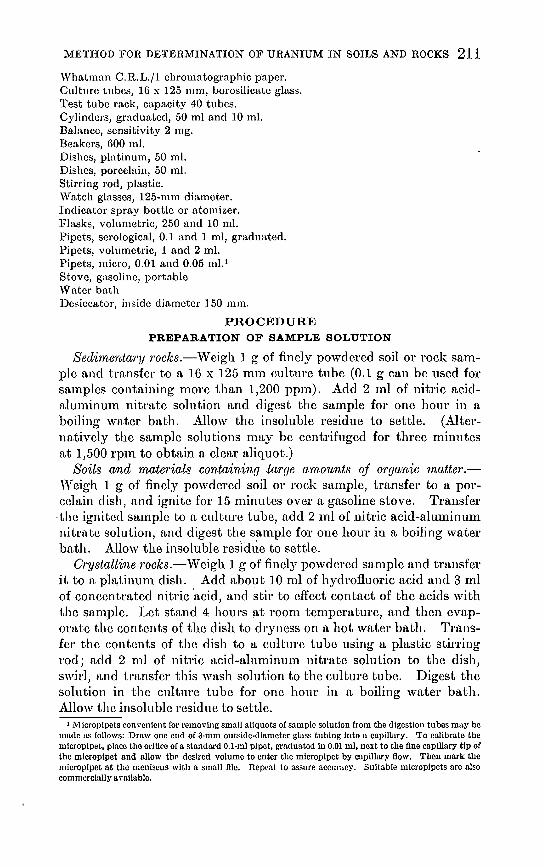
Sedimentm·y 1'ocks.-Weigh 1 g of finely powdered soil or rock sainple and transfer to a 16 x 125 mn1 culture tube (0.1 g can be used for smnples containing more than 1,200 ppn1). Add 2 ml of nitric acidnlmninmn nitrate solution and digest the sample for one hour in a boiling water bath. Allow the insoluble residue to settle. (Alternatively the sainple solutions n1ay be centrifuged for three minutes at 1,500 rp1n to obtain a clear aliquot.)
Soils and materials containing .large amounts of organic matter.'Veigh 1 g of finely powdered soil or rock sample, transfer to a porcelain dish, and ignite for 15 minutes over a gasoline stove. 1'ransfer ·the ignited san1ple to a culture tube, add 2 ml of nitric acid-aluminum 11itrate solution, and digest the sample for one hour in a boiling water bath. Allow the insoluble res!dtie to settle.
Crystalline rocks.-vVeigh 1 g of finely powdered sample and transfer it to ft. pla.Limun dish. Add about 10 ml of hydrofluoric acid and 3 ml of concentrated nitric 'acid, and ~tir to effect contact of the acids with tbe snn1ple. Let stand 4 hours ~t roon1 temperature, and then evaporate the contents of the dish to dryness on a hot water bath. Transfer the contents of the dish to a culture tube using a plastic stirring rod; add 2 ml of nitric acid-aluminun1 nitrate solution to the dish, swirl, and transfer this wash solution to the culture tube. Digest the solution in the culture tube for one hour in a boiling water bath. Allow the insoluble residue to settle.
I M ici'Opipcts convenient for removing small aliquots of sample solution from the digestion tubes may be made us follows: Draw one end of 3-mm outside-diameter glass tubing into a capillary. To calibrate the micropipet, place the orifice of a standard 0.1-ml pipet, graduated in O.Ql ml, next to the fine capillary tip of the micropipet and allow thP desired volume to enter the micropipet by capillary flow. Then mark the micropipet at the meniscus with a small file. Repeat to assure accuracy. Suitable micropipets are also commercially available,
212 CON'l'RIBUTIONS TO- GEOCHEMISTRY
PREPARATION OF SOLVENT MIXTURE
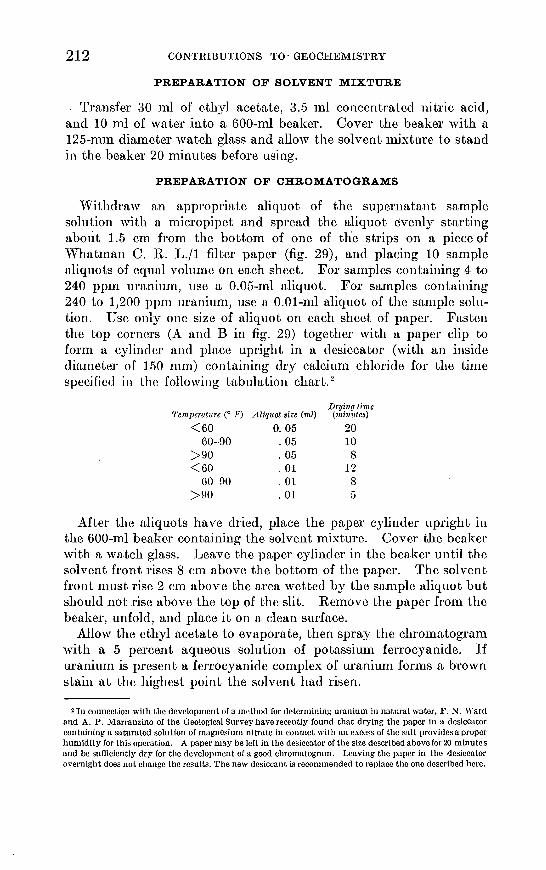
. Transfer 30 n1l of ethyl acetate, 3.5 ml concentrated nitric acid, and 10 ml of water into a 600-ml beaker. Cover the beaker with a 125-mm diameter watch glass and allow the solvent mixture to stand in the beaker 20 minutes before using.
PREPARATION OF CHROMATOGRAMS
Withdraw an appropriate aliquot of the supernatant sample solution with a micropipet and spread the aliquot evenly starting abotit 1.5 cn1 frmn the bottom of one of the strips on a piece of vVhatman C. R. L./1 filter paper (fig. 29), and placing 10 sample aliquots of equal volume on each sheet. For sa1nples containing 4 to 240 ppm uranium, use a 0.05-ml aliquot. For samples containing 240 to 1,200 ppn1 uranium, use a 0.01-ml aliquot of the san1ple solution. Use only. one size of aliquot on each sheet of paper. Fasten the top corners (A and B in fig. 29) together with a paper clip to form a cylinder and place upright in a desiccator (with an inside diameter of 150 mm) containing dry calciun1 chloride for the time specified in tliC following tabulation chart. 2
Drying time 'Temperature (0 Ji') Aliqnot size (rnl) (minutes)
<60 0. 05 20 60-90 . 05 10
>90 . 05 8 <60 . 01 12
60-90 . Ol 8 >90 . 01 5
After the aliquots have dried, place the paper cylinder upright in the 600-ml beaker containing the solvent mixture. Cover the beaker with a watch glass. Leave the paper cylinder in the beaker until the solvent front rises 8 em above the bottom of the paper. The solvent front must rise 2 em above the area wetted by the sample aliquot but should not rise above the top of the slit. Remove the paper from the beaker, unfold, and place it on a clean surface.
Allow the ethyl ac_etate to evaporate, then spray the chromatogran1 with a 5 percent aqueous solution of potassium ferrocyanide. If uranium is present a ferrocyanide complex of uranium forms a brown stain at the highest point the solvent had risen.
2 In connection with the development of a method for determining uranium in natural water, F. N. Ward and A. P. Marranzino of the Geological Survey have recently found that drying the paper in a desiccator containing a saturated solution of magnesium nitrate in contact with an excess of the salt provides a proper humidity for this operation. A paper may be left in the desiccator of the size described above for 20 minutes and be sufficiently dry for the development of a good chromatogram. Leaving the paper in the desiccator overnight does not change the results. The new desiccant is recommended to replace the one described here.
~lETHOD FOH DETER~IIXATIOX OF rRAi\TC~l IX :-;OILS AXD ROCI\S 213
A B
Fu~ t H E 2fl. Standard ~<·rif'~ of uranium chromatop:rams on a siH'd of C. H . L ./1 \Yhatrnan paprr
PREPARATION OF STANDARDS
Pn.'p<ll'<' n serips of stnndanls containing 0.1, 0.2, 0.4, 0.8, 1.6. ;L and G mierognuns of unlllium on a shel't of C. R. L. /1 \Yhalm<lll pnper ns follo,,·s: Plnrt• a 0.01-ml aliquot of rnth of the standard uranium solution containing 10, 20, 40, RO, 1<30, :~00, and GOO micrograms of uranium per ml on 7 strips of a sheet of C. R. L. / 1 \Vhntmnn pnpPr . Proc<'<'d as din•dcd for sample solutions.
ESTIMATION OF URANIUM
( 'omp<U'<' the brown stain of tlw uranium complex obtained from the sampll' aliquot ·with standards prepared ut the snnw time, and l'l'COl'd tht• llUJnbt•r of micrograms found in the snmplt' aliquot. 'Cse tlw following NJuntion to <"t~l<'ulnt<• parts JWr million uranium in tlH• nmplc :
Total Yol. of sample solution J . T • /' llll('l'()OTHll1S "t. of sampk X vol. of nhquot o
found - l T ppm
DIHCT"SHIOX
EFFECTIVENESS OF SAMPLE SOLUTION
'l'hl' pnJH'l' chroma tographie met bod of st•parn tion and estimation of uranium n'quirrs that tlw sampl<' be dissolvrd in 1 + :~ nitric acid and thnt nltuninum nitl'nte be JH'Psent in tlH• sample solution to prevrnt int<•rf('l'(' JH'e of phosphatr and othrr anions. Dilut(• nitric Hcidaluminum nitrut(• solution has hePn found to he a very satisfactory reagent for di~solving thr urnnium in several hundred sampl('S from th e Colorndo Platen11 (tahlr G). Jlowever, this reagent alon<' would
4:.!2 t 44-57--2
214 CON'l'RIBUTIONS TO GEOCHEMISTRY
not extract all of the uranium in a number of igneous rock samples (table 5). Fusion witR. fluxes such as potassium bisulfate, potassium hydroxide, sodium hydroxide,~r.)ithium,J_l;tyQ.roxide and potassium nitrate, sodium carbonate, sodium carbonate and potassium nitrate, ammonium fluoride, or combinati~~is of !these proved cumbersome or otherwise unsatisfactory. The m~~·t sati~factory attack on this type of sample was the hydrofluoric-ni'thc aeid digestion.
'· ~~
INTERFERING, ~ON~ ~}.>
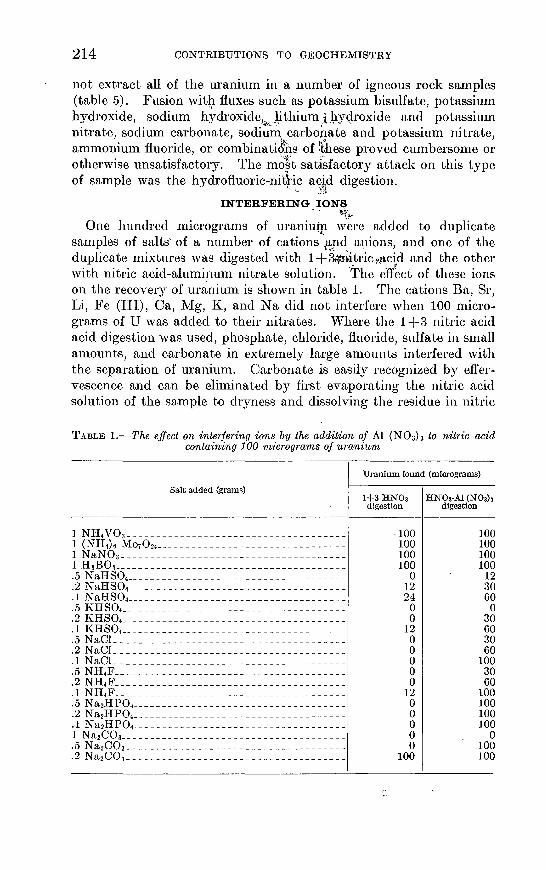
One hunch·ed micrograms of uraniu:(p. were added to duplicate samples of salts· of a number of cations ·~pel apions, and one of the duplicate mixtures was digested with 1 +3o;J.~itric~.j1cicl and the other with nitric acid-aluminum nitrate solution. 'The etf~ct of these ions on the recovery of ur~nium is shown in table 1. The cations Ba, Sr, Li, Fe (III), Ca, l\1g, K, and N a did not interfere when 100 micrograms of U was added to their nitrates. Where the 1 +3 nitric acid acid digestion was used, phosphate, chloride, fluoride, sulfate in sn1all amounts, and carbonate in extremely large amounts interfered with the separation of uranium. Carbonate is easily recognized by effervescence and can be eliminated by first evaporating the nitric acid solution of the sample to dryness and dissolving the residue in nitric
TABLE 1.-The effect on interfering ions by the addition of Al (N03) 3 to nitric acid containing 100 micrograms of uranium
Salt added (gram'>)
1 NH4 VOa _____ --------------------------------1 (NH4)6 Mo1024--------------------------------1 NaN03--------------------------------------1 H3BOa---- _----------------------------------.5 N aHS04-- ________ ---------------------------.2 N aHS04-- _____ ------------------------------. 1 N aH S 0 4 ___ - _ - _ - - - - - - - - - - - - - - - - - - - - - - - - - - - - - -
.5 KHS04-- _______ -----------------------------
.2 KHS04-- ______ ------------------------------
.1 KHS04-- ______ ------------------------------.5 NaCl ______________________________________ _
.2 NaCl ______________________________________ _
.1 NaCl ______________________________________ _
.5 NH4F ______________________________________ _
.2 NH4F ______________________________________ _
.1 NH4F ______________________________________ _
.5 N a2HP04 _____________ -----------------------
.2 Na2HP04 __________ - -------------------------
.1 N a2HP04. ___ --------------------------------1 N a2C03-- __ ---------------------------------. 5 N a2C03- - _ - - - - ----- - -- ------- -- - - -- - - -- - ---.2 Na2C03-------------------------------------
Uranium found (micrograms)
1+3 HNOa HNOa·Al (NOah digestion digestion
-100 100 100 100 100 100 100 100
0 12 12 30 24 60 0 0 0 30
12 60 0 30 0 60 0 100 0 30 0 60
12 100 0 100 0 100 0 100 0 0 0 100
100 100
ME'l'HOD FOH. DETERMINA'l'ION OF URANIUM IN SOILS AND ROCKS 215
ucid. However, with the Al (N03)3 present it was not necessary to take to dryness and redissolve. The interference of phosphate is eli1ninated, and interference of the other anions is reduced substantially by the· use of the nitric acid-alumimun nitrate solution for digestion of the sample.
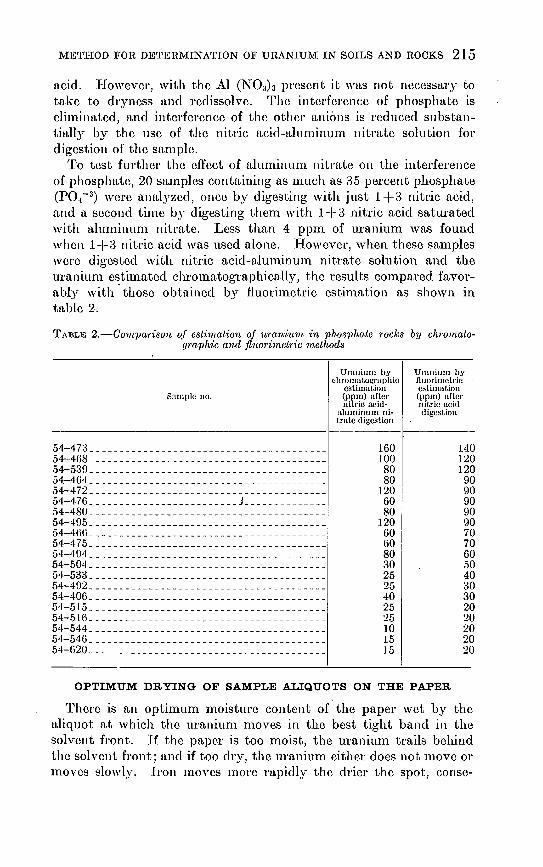
To test further the effect of almnimun nitrate on the interference of phosphate, 20 smnples containing as much as 35 percent phosphate (P04- 3) were analyzed, once by digesting with just 1 +3 nitric acid, and a second ti1ne by digesting them with 1 +3 nitric acid saturated with aluminmn nitrate. Less than 4 ppn1 of uranium was found when 1+3 nitric acid was used alone. However, when these san1ples were digested with nitric acid-ahunitnun nitrate solution and the uranimn estin1ated chromatographically, the results compared favorably with. those obtained by fluorimetric estimation as shown in table 2.
TABLE 2.-Comparison of estimation of umni'l.on in phosphctte 1·ocks by chromato(Jmpldc and jluorimetric methods
Uranium by chromatographic
estimation Sample no. (ppm) after
nitric acidaluminum nitrate dige~tion
54-4i:3________________________________________ 160 54-46S________________________________________ 100 54-5:39________________________________________ so 54-464________________________________________ so 54-472________________________________________ 120 54-47() _________________________ j______________ 60 54-4SO________________________________________ so 54-4~)5_-------- ------------------------------- 120 54-46()________________________________________ 60 54-475________________________________________ 60 54-494________________________________________ so 54-504________________________________________ 30 54-533________________________________________ 25 54-492________________________________________ 25 54-40()________________________________________ 40 54-515________________________________________ 25 54-516________________________________________ 25 54-544________________________________________ 10 54-54()________________________________________ 15 54-620________________________________________ 15
Uranium by fiuorimetric estimation (ppm) after nitric acid digestion
140 120 120 90 90 90 90 90 70 70 60 50 40 30 30 20 20 20 20 20
OPTIMUM DRYING OF SAMPLE ALIQUOTS ON THE PAPER
1'here is an optilnmn moisture content of the paper wet by the aliquot at which the uranimn n1oves in the best tight band in the solvent front. If the paper is too moist, the uraniun1 trails behind the solvent front; and if too dry, the uranimn either does not n1ove or 1noves slowly. Jron Inoves n1ore rapidly the drier the spot, conse-
216 CONTRIBUTIONS TO GEOCHEMISTRY
quently excessive drying after addition of the aliquoL to the paper results in the uranium being concealed in the wide blue band of the iron ferrocyanide complex.
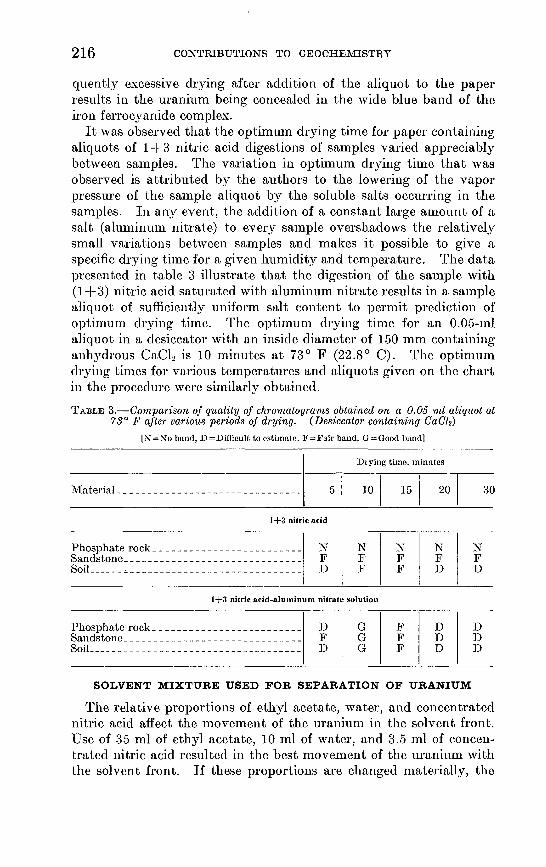
It was observed that the optimum drying time for paper containing aliquots of 1 +3 nitric acid digestions of samples varied appreciably between samples. 'fhe variation in optimum drying time that was observed is attributed by the authors to the lowering of the vapor pressure of the sample aliquot by the soluble salts occurring in the samples. In any event, the addition of a constant large mnount of a salt (aluminum nitrate) to every sample overshadows the relatively small variations between samples and makes it possible to give a specific drying ti1ne for a given humidity and temperature. The data presented in table 3 illustrate that the digestion of the sample with (1 +3) nitric acid saturated with aluminum nitrate results in a sa1nple aliquot of sufficiently uniform salt content to permit prediction of optimum drying time. The optimum drying time for an 0.05-ml aliquot in a desiccator with an inside diameter of 150 mm containing anhydrous OaOlz is 10 minutes at 73° F (22.8° 0). The optimun1 drying times for various temperatures and aliquots given on the chart in the procedure were similarly obtained.
TABLE 3.-Comparison of q1wlity of chromatogmms obtained on a 0.05 ml aliquot at 73° F after various periods of drying. (Desiccator containing CaCl2)
[N =No band, D=Difficult to estimate, F=Fair band, G=Good band]
Material ______________________________ _
1 +3 nitric acid
Phosphate rock_ _ _ _ _ _ _ _ _ _ _ _ _ _ _ _ _ _ _ _ _ _ _ _ _ N Sandstone______________________________ F Soil ______ .:._____________________________ ])
D1 ying time, minntes
5 1 10 1 15 1 20
N F F
N F F
N F D
1+3 nitric acid-aluminum nitrate solution
Phosphate rock_________________________ D Sandstone______________________________ F SoiL___ _ _ _ _ _ _ _ _ _ _ _ _ _ _ _ _ _ _ _ _ _ _ _ _ _ _ _ _ _ _ _ _ D
G G G
F F F
D D D
SOLVENT MIXTURE USED FOR SEPARATION OF URANIUM
N F D
D D D
30
The relative proportions of ethyl acetate, water, and concentrated nitric acid affect the movement of the uranium in the solvent front. Use of 35 ml of ethyl acetate, 10 ml of water, and 3.5 ml of concentrated nitric acid resulted in the best movement of the uranium with the solvent front. If these proportions are changed n1aterially, the
ME'l'HOD FOH DE'L'EHMlNA'l'ION OF UHANlUM IN SOILS AND ROCKS 217
um.nimn is Hot concentrated in the solvent front but is spread along the length of the strip. It has been found that this solvent mixture, because of changes in composition, is satisfactory for a maxi1nun1 of about three hours only or for five sheets of paper, whichever is first.
RESUL~rs
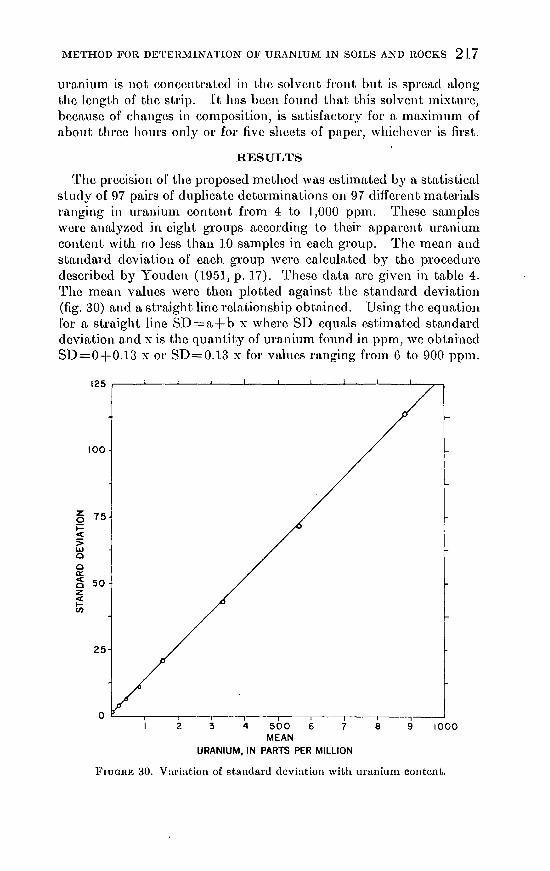
The precision of the proposed method was csti1nated by a statistical study of 97 pairs of duplicate determinations on 97 different materials ranging in uraniun1 content frOin 4 to 1,000 pp1n. 1'hcsc samples were analyzed in eight groups according to their apparent uranium content with no less than 10 samples in each group. The n1ean and standard deviation of each group were calculated by the procedure described by Youdcn (1951, p. 17). These data arc given in table 4. The n1ean values were then plotted against the standard deviation (fig. 30) and a straight line relationship obtained. Using the equation for a straight line SD=a+ b x where SD equals estimated standard deviation and xis the quantity of uraniun1 found in ppm, we obtained SD=O+O.l3 x or SD=0.13 x for values ranging frOin 6 to 900 ppm.
z 75 0 i= < > LLI 0 0 a: < 50 0 z <( ..... en
25
2 3 4 500 6 7 8 9 1000 MEAN
URANIUM, IN PARTS PER MILLION
FruGRE 30. Variation of standard deviation with uranium content.
218 CONTRIBUTIONS TO GEOCHEMISTRY
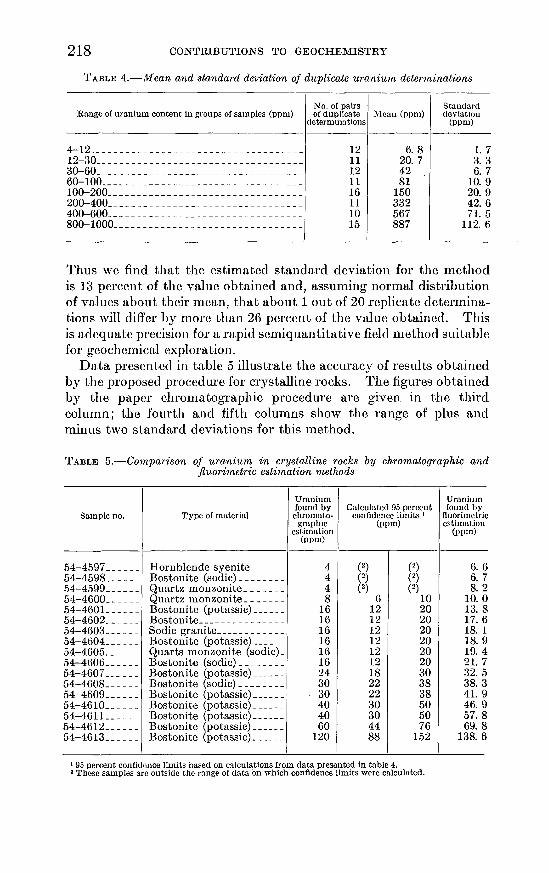
TABLE 4.-1l1ean and standard deviation of d'uplicate uranium determinations
Range of uranium content in groups of samples (ppm)
4-12 ___________________________________ _ 12-30 __________________________________ _ 30-60 __________________________________ _ 60-100 _________________________________ _ 100-200 ________________________________ _ 200-400 ________________________________ _ 40Q-600 ________________________________ _ 800-1000 _______________________________ _
No. of pairs of duplicate
determmations
12 11 12 11 16 11 10 15
Mean (ppm)
6. 8 20. 7 42 81
150 332 567 887
Standard deviatiOn
(ppm)
1.7 3. 3 6. 7
10.9 20. 9 42.6 71. 5
112. 6
Thus we find that the estimated standard deviation for the method is 13 percent of the value obtained and, assuming normal distribution of values about their mean, that about 1 out of 20 replicate determinations will differ by more than 26 percent of the value obtained. This is adequate precision for a rapid semiquantitative field method suitable for geochemical exploration.
Data presented in table 5 illustrate the accuracy of results obta.ined by the proposed procedure for crystalline rocks. The figures obtained by the paper chron1atographic procedure a.re given in the third column; the fourth and fifth columns show the range of plus and minus two standard deviations for this method.
TABLE 5.--Comparison of uranium in crystalline rocks by chromatographic and jluorimetric estimation methods
Uranium Uranium found by Calculated 95 percent found by
Sample no. Type of material chroma to- confidence limits 1 fluorimetric grapbtc (ppm) estimation
estimation (ppm) (ppm)
-
54-4597 ______ Hornblende syenite ______ 4 (2) (2) 6. 6 54-4598 ______ Bostonite (sodic) ________ 4 (2) (2) 6. 7 54-4599 ______ Quartz monzonite _______ 4 (2) (2) 8. 2 54-4600 ______ Quartz monzonite _______ 8 6 10 10. 0 54-4601 ______ Bostonite (potassic) ______ 16 12 20 13. 8 54-4602 ______ Bostonite _______________ 16 12 20 17. 6 54-4603 ______ Sodic granite ____________ 16 12 20 18. 1 54-4604 ______ Bostonite (potassic) ______ 16 12 20 18. 9 54-4605 ______ Quarts monzonite (sodic)_ 16 12 20 19. 4 54-4606 ______ Bostonite (sodic) ________ 16 12 20 21. 7 54-4607 ______ Bostonite (potassic) ______ 24 18 30 32.5 54-4608 ______ Bostonite (sodic) ________ 30 22 38 38. 3 54-4609 ______ Bostonite (potassic) ______ 30 22 38 41. 9 54-4610 ______ Bostonite (potassic) ______ 40 30 50 46. 9 54-461 L _____ Bostonite (potassic) ______ 40 30 50 57.8 54-4612 ______ Bostonite (potassic) ______ 60 44 76 69.8 54-4613 ______ Bostonite (potassic) ______ 120 88 152 138. 6
t 95 percent confidence limits based on calcul~tions from data presented in table 4. 2 These samples are outside the range of data on which confidence limits were calculated.
ME'l'HOD FOR DETERMINATION OF URANIUM IN SOILS AND ROCKS 219
The fluorin1ctric results (last colmnn). are consistently higher than those obtained by the proposed procedure. The low values given by the paper chromatographic procedure arc probably due to incomplete solution of the san1ple as the proposed attack of the sample with hydro'fluoric and nitric acid fails to decompose many refractory minerals such as zircon. However, the results by the paper chroInatographic procedure increase in the same order as the results obtained by c01nplcte solution.
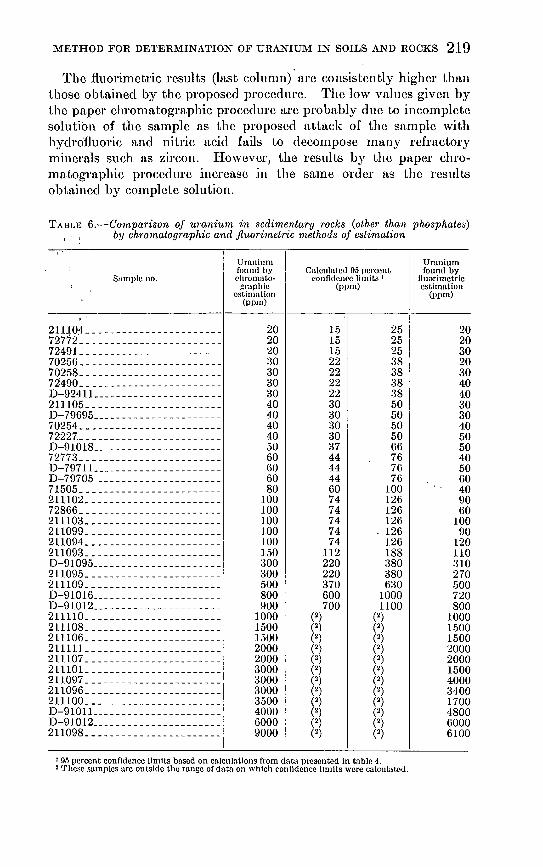
TABr ... l<J 6.-Comparison of urani'u,m in sedimentary rocks (other than phosphates) by chromatogmphic a'nd jl'llori1netric methods of estimation
,,.
Sample no.
"'
211~0~-----------------------72772 _______________________ _
72491~-----------------------70256 _______________________ _ 70258 _______________________ _ 72490 _______________________ _ D-92411 _____________________ _
211105-----------------------])-79695 _____________________ _ 70254 _______________________ _ 72227 _______________________ _ J)-91018 _____________________ _ 72773 _______________________ _ 1)-79711 _____________________ _
])-79705 ---------------------71505 _______________________ _ 211102 ______________________ _ 72866 _______________________ _ 211103 ______________________ _ 2L1099 ______________________ _ 2L1094 ______________________ _ 211093 ______________________ _ J)-91095 _____________________ _ 211095 ______________________ _ 2L1109 ______________________ _ ])-91016 _____________________ _ ])-91012 _____________________ _ 211110 ______________________ _ 2L1108 ______________________ _ 2L1106 ______________________ _ 211111 ______________________ _ 211107 ______________________ _ 2L1101 ______________________ _ 211097 ______________________ _ 211096 ______________________ _ 211100 ______________________ _ ])-91011 _____________________ _ ])-91012 _____________________ _ 211098 ______________________ _
Uranium found by chromato-
graphic estimation
(ppm)
20 20 20 30 30 30 30 40 40 40 40 50 60 60 60 80
100 100 100 100 JOO 150 300 300 500 800 900
1000 1500 1500 2000 2000 3000 3000 3000 3500 4000 6000 9000
Calculated 95 percent confidenre limits I
(ppm)
(~) (~) (2) (2) (2) (2) (2) (2) (2) (2) (2) (2)
15 15 15 22 22 22 22 30 30 30 30 37 44 44 44 60 74 74 74 74 74
112 220 220 370 600 700
25 25 25 38 38 38 38 50 50 50 50 66 76 76 76
100 126 126 126 126 126 188 380 380 630
1000 1100
(2) (2) (2) (2) (2) (2) (2) (2) (2) (2) (~) (2)
• 95 percent confidence limits based on calcul:ltions from data presented in table 4. 2 'l'hcsc samples arc outside the range of data on which confidence limits were calculated.
Uranium found by
fluorimetric estimation
(ppm)
20 20 30 20 30 40 40 30 30 40 50 50 40 50 60 40 90 60
100 90
120 110 310 270 500 720 800
1000 1500 1500 2000 2000 1500 4000 3400 1700 4800 6000 6100
220 CON:l'RIBUTIONS TQ GEOCHEMISTRY
Thirty-nine smnplcs of sedimentary rocks low in phosphate were run independently by the fluoromctric and chromatographic Incthods (table 6). The upper and lower value for the 95 percent level of precision for the paper chron1atographic method are given in the third and fourth columns and only two of the fluormnctric values arc substantially outside of these ranges. Assuming that the :fluormnctric values arc correct, the accuracy of the proposed Incthocl for sedimentary rocks is approximately the same as the precision of the method.
'I'he Inethod is fast and simple enough to enable a relatively unskilled worker to determine the uranium content in 60 or n1ore samples in the field in an 8-hour day. In this laboratory a chemist has determined uranium content chromatographically in as Inany as 120 san1plcs in an 8-hour day. The method permits the estimation of as little as 4 parts per million of uranium and as much as 1,200 ppm without n1odification. Larger uranium contents can be determined by simple modifications.
LITERATURE CITED
Hunt, E. C., North, F. A., and Wells, R. A., 1955, Application of paper chromatographic methods of analysis to geochemical prospecting: The Analyst, v. 80, p. 179-194.
Pollard, F. H., and McOmie, J. F. W., 1953, Chromatographic methods of inorganic analysis, New York, Academic Press, Inc., 192 p.
Smith, Orsino C., 1953, Inorganic chromatography, New York, D. Van Nostrand Co., Inc., 134 p.
Youden, vV. G., 1951, Statistical methods for chemists, New York, John Wiley and Sons, Inc., 126 p.
U, S. GOVERNMENT PRINTING OFFICE 1957


