Page 1
1
A large pumped storage scheme for seasonal reliability of national
power supply?
Earl Bardsley (University of Waikato)Bryan Leyland (LCL Ltd)Sarah Bear (URS Ltd)
Acknowledgements
We thank Contact Energy Ltd and Meridian Energy Ltd for kind provision of generating and discharge data and financial support.
Page 2
2
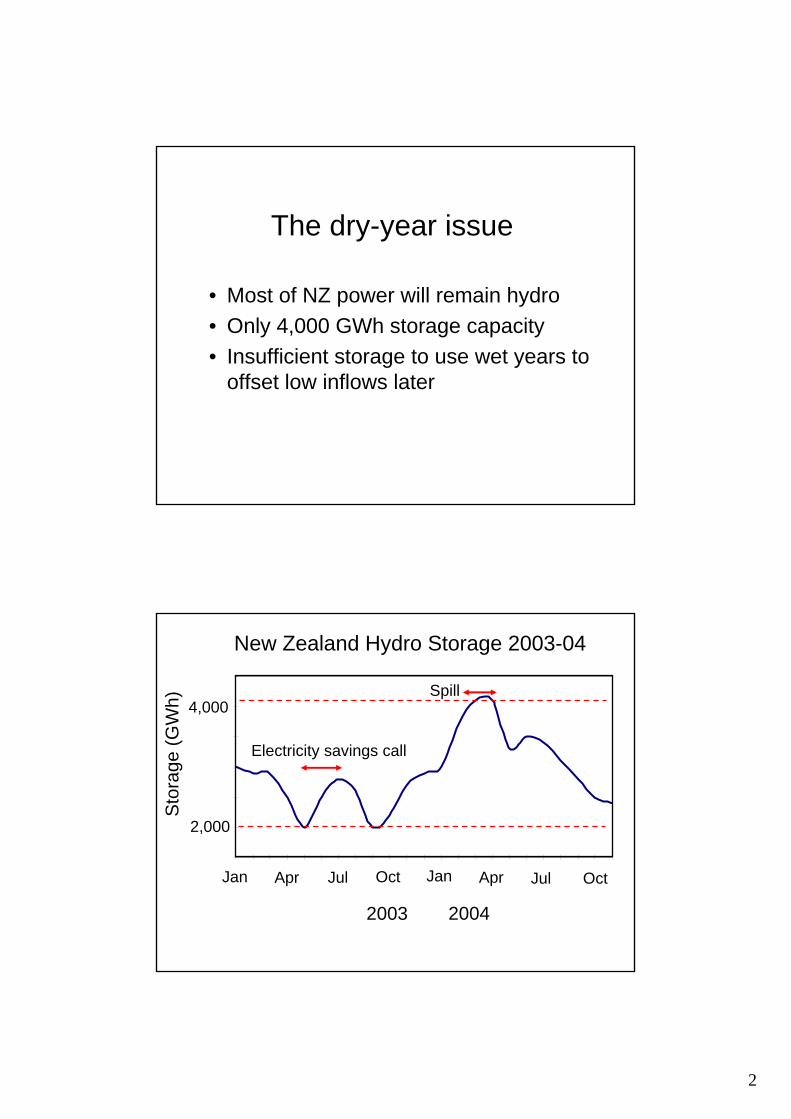
The dry-year issue
• Most of NZ power will remain hydro• Only 4,000 GWh storage capacity• Insufficient storage to use wet years to
offset low inflows later
1500
2000
2500
3000
3500
4000
4500
Jan Apr Jul Oct Jan Apr Jul Oct
GW
h
Electricity savings call
Spill
Jan Apr Jul Oct Jan Apr Jul Oct
2003 2004
4,000
2,000
Sto
rage
(GW
h)
New Zealand Hydro Storage 2003-04
Page 3
3
Stand-by coal-fired stations?
• Expensive to maintain• No guarantee of new gas finds
Increase storage capacity?
• Capacity increase of about 10,000 GWh• Not possible with existing lakes• Pumped storage as an alternative?
Page 4
4
Conventional pumped storage
• Load-following for thermal stations• Frequency control and voltage support
(Small water volumes shifted between upper and lower reservoirs)
Turlough Hill Pumped Storage Scheme, Ireland
Page 5
5
The Saurdal seasonal pumped storage scheme (Norway) : A model for New Zealand?
10.5 kmTunnel length
82 km2Upper Reservoir area
125 metresReservoir level range
7,760 GWhEnergy storage
New ZealandLocation of Onslow-Manorburn basin (Central Otago)
Alexandra
Roxburgh
Lake Roxburgh
ManorburnReservoir
Lake Onslow
Roxburgh Dam
Clutha River N
Page 6
6
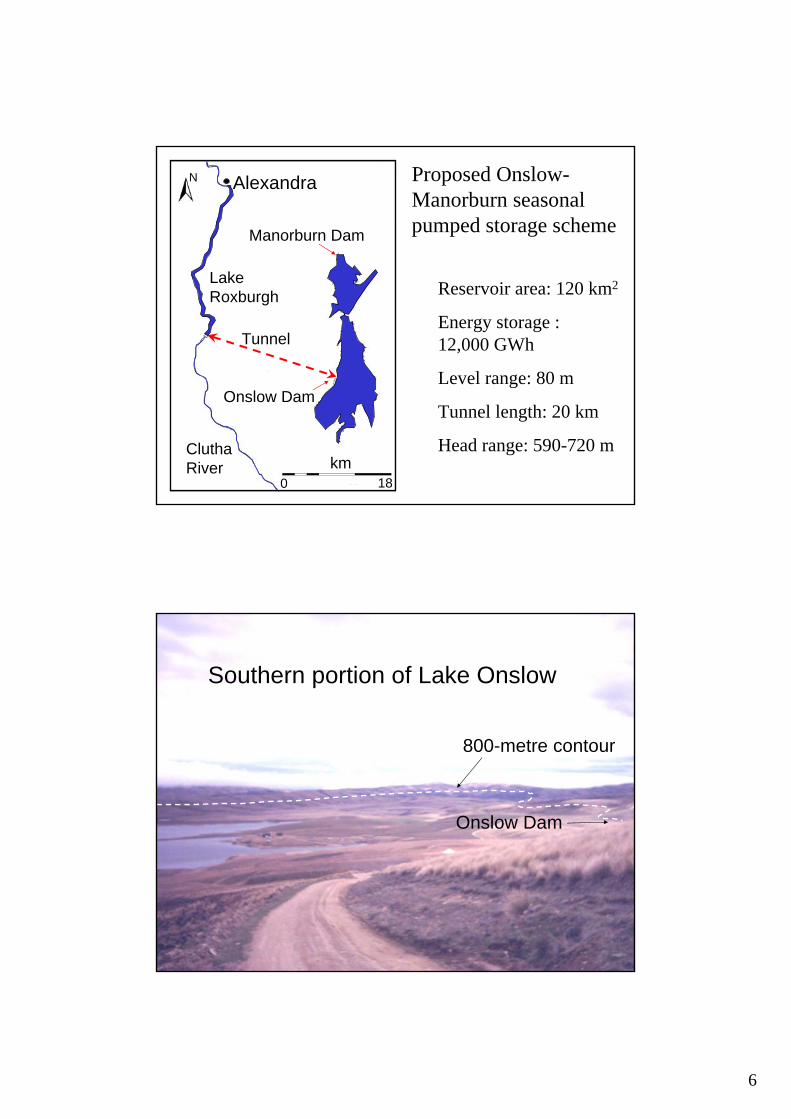
Onslow Dam
Clutha River
Lake Roxburgh
N
km0 6 12 18
Tunnel
Reservoir area: 120 km2
Energy storage :12,000 GWh
Level range: 80 m
Tunnel length: 20 km
Head range: 590-720 m
Proposed Onslow-Manorburn seasonal pumped storage scheme
Alexandra
Manorburn Dam
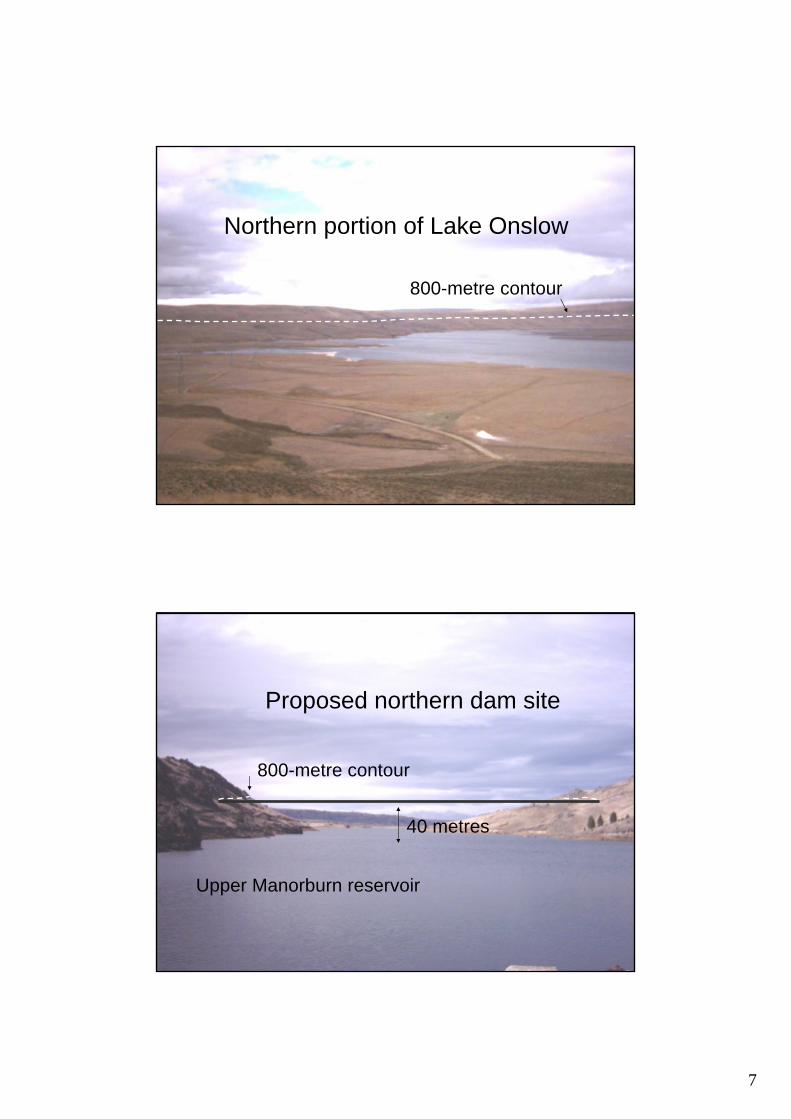
Southern portion of Lake Onslow
800-metre contour
Onslow Dam
Page 7
7
Northern portion of Lake Onslow
800-metre contour
40 metres
Proposed northern dam site
800-metre contour
Upper Manorburn reservoir
Page 8
8
Simulation
• As if scheme was in operation 1990-2003
• Seek to smooth Clutha + Waitaki power yield through dry periods
• Move existing hydro lakes toward mid-range levels (spill reduction)
Pumped Storage Discharge or Pumping Rates at Roxburgh Dam (m3s-1)
-200-150
-100-50
050
100
150200
1990 1991 1992 1993 1994 1995 1996 1997 1998 1999 2000 2001 2002 2003
Dis
char
ge o
r Pum
ping
Pumped storage daily water uptake or release to Clutha River (1990-2003)
0
+150
-150
Release (m3 s-1)
Pumping (m3 s-1)
1990 20031997
Page 9
9
Pumped Storage Discharge or Pumping Rates at Roxburgh Dam (m3s-1)
-200
-150-100
-500
50100
150200
1992 1993
Dis
char
ge o
r Pum
ping
Pumped storage daily water uptake or release to Clutha River (1992 dry year)
Pumping (m3 s-1)
+150
-150
0
Release (m3 s-1)
Jan July Dec
Pumped storage daily power generated or used for pumping (1990-2003)
Mean: - 84 MW
Pumped Storage Power Inputs and Outputs (MW)
-1500
-1000
-500
0
500
1000
1500
1990 1991 1992 1993 1994 1995 1996 1997 1998 1999 2000 2001 2002 2003
Pow
er (M
W)
+1000
-1000
0
Pow
er (M
W)
1990 1997 2003
Generating
Pumping
Page 10
10
Clutha + Waitaki Power Schemes: Power Output (1990-2003)
0
500
1000
1500
2000
2500
1990 1991 1992 1993 1994 1995 1996 1997 1998 1999 2000 2001 2002 2003
Pow
er (M
W)
Example Simulation of Pumped Storage Smoothing (case of Constant Power Output)
0
500
1000
1500
2000
2500
1990 1991 1992 1993 1994 1995 1996 1997 1998 1999 2000 2001 2002 2003
Pow
er (M
W)
Mean: 1269 MW
Mean:1262 MW
Actual
Simulated
0
2000
Pow
er (M
W)
1990 20030
2000
Pow
er (M
W)
Simulation result: Clutha + Waitaki power yield maintained (1990 – 2003)
1000
1000
1997
Recorded
1990 1992 1994 1996 1998 2000 20020
2000
4000
6000
8000
10000
12000
14000
Time (years)
Pow
er (G
Wh)
Actual65 %75 %85%
Cum
ulat
ive
Ene
rgy
(GW
h)
Actual Waitaki + Cluthaspill losses
Simulated losses with pumped storage
Cumulative energy gain from alternative lake operating mode (1990-2003)
12,000
8,000
4,000
1990 1994 1998 2000
Page 11
11
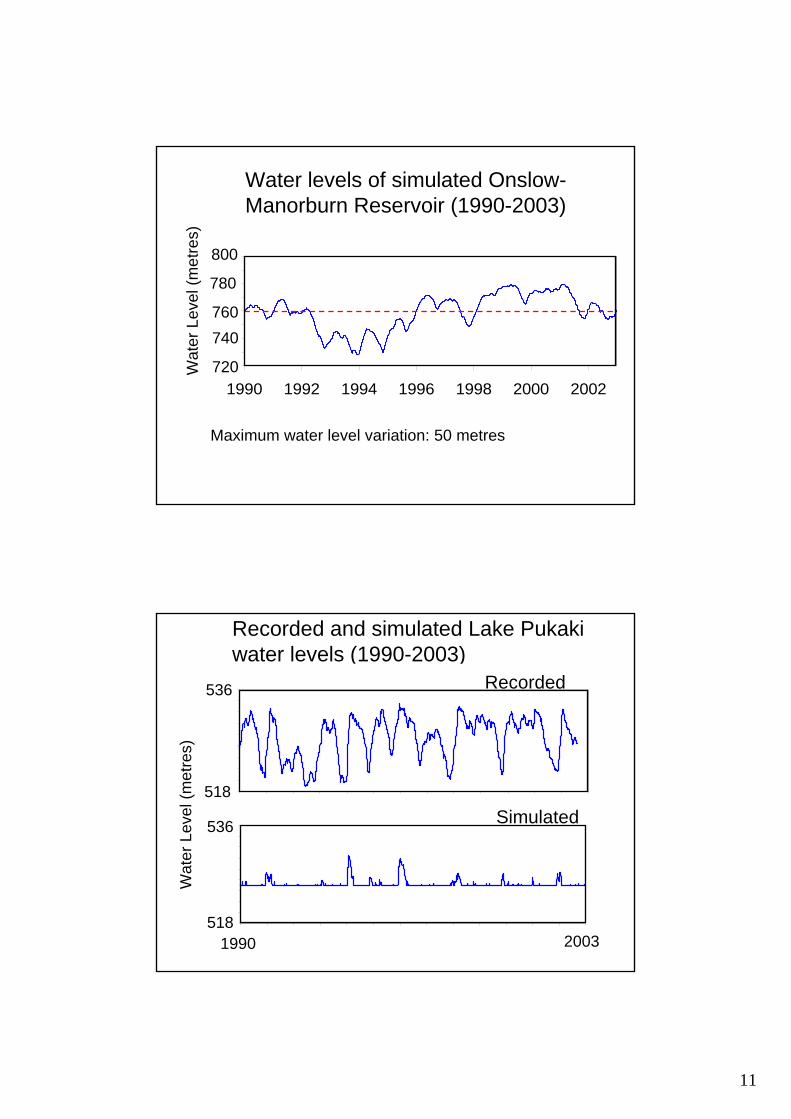
Water levels of simulated Onslow-Manorburn Reservoir (1990-2003)
Water Levels of Simulated Onslow-Manorburn Pumped Storage Reservoir
720
730
740
750
760
770
780
790
800
1990 1992 1994 1996 1998 2000 2002
800
740
780
760
720Wat
er L
evel
(met
res)
Maximum water level variation: 50 metres
Lake Pukaki Water Levels as Simulated with Pumped Storage (1990-2003)
518520522524526528530532534536
1990 1991 1992 1993 1994 1995 1996 1997 1998 1999 2000 2001 2002 2003
Lake
Lev
el (m
etre
s)
Recorded Lake Pukaki Water Levels 1990-2003
518
520
522
524
526528
530
532
534
536
1990 1991 1992 1993 1994 1995 1996 1997 1998 1999 2000 2001 2002 2003
Lake
Lev
el (m
etre
s)
Recorded and simulated Lake Pukakiwater levels (1990-2003)
518
536
518
536
Wat
er L
evel
(met
res)
1990 2003
Recorded
Simulated
Page 12
12
Lake Rotoaira (0.5 metre operating range)
Lake Moawhango, 15 metres operating range
Page 13
13
• Spinning reserve and frequency-keeping
• Supporting wind energy and small hydro
• Some reduction in Lower Clutha flood peaks
• Water supply for Dunedin city
Related Benefits of the Onslow-ManorburnScheme:
Onslow-Manorburn pumped storage: Conclusions
• Energy-neutral
• Could buffer hydro power output through future climatic variations
• Reduced hydro lake seasonal fluctuations
• But would it fit into the market?