Page 1
Int. J. Electrochem. Sci., 16 (2021) Article ID: 210463, doi: 10.20964/2021.04.21
International Journal of
ELECTROCHEMICAL SCIENCE
www.electrochemsci.org
A Novel Approach for Internal Short Circuit Prediction of
Lithium-Ion Batteries by Random Forest
Bin Xiao1, Bing Xiao2.*
1 College of Information Science and Technology, Zhongkai University of Agriculture and
Engineering, Guangzhou 510225, China 2 College of Automation Science and Engineering, South China University of Technology, Guangzhou
510641, China *E-mail: [email protected]
Received: 4 November 2020 / Accepted: 9 January 2021 / Published: 28 February 2021
Internal short circuit (ISC) prediction is a critical challenge for battery failure detection (BFD). Accurate
ISC prediction can effectively reduce the risk of battery thermal runaway (BTR) and ensure the safe use
of lithium-ion batteries (LiB). The battery ISC is difficult to detect in early stages, and it takes a long
time to determine the battery ISC via detection of the battery self-discharge phenomenon. Therefore, to
achieve a simple and easy-to-use method for rapid measurement, a model for battery ISC prediction
realized by the random forest classifier (RFC) is proposed in this paper. According to the relaxation
behavior of LiB, sample data of ordinary batteries and batteries in the ISC state are collected by the
hybrid pulse power characteristic (HPPC) test. The MATLAB curve fitting tool is used to fit the voltage
relaxation curve in the sample data to obtain the parameters of the equivalent circuit model (ECM), and
these parameters are used in the construction of the sample feature. Gray relational analysis (GRA) is
used to select the features of the sample data, and the hyperparameters of the RFC model are obtained
by a grid search (GS) with “Out-of-Bag” (OoB) errors. Through experimental analysis, the effectiveness
and accuracy of the proposed method are verified, which is not only beneficial for BFD but also, increases
the reliability of battery use.
Keyword: Lithium-ion batteries; Internal short circuit; Random forest classifier; Equivalent circuit
model; Gray relational analysis; Grid search
1. INTRODUCTION
Battery ISC is deemed to be one of the main reasons for triggering the thermal runaway of electric
vehicles (EVs) [1, 2]. The early stage of the ISC last for a long time, the battery does not have the obvious
characteristics of abnormal self-discharge, and the safety risk is low. As soon as the battery ISC enters the
later stage, it will have the usual obvious characteristics, the battery terminal voltage will decrease
Page 2
Int. J. Electrochem. Sci., 16 (2021) Article ID: 210463
2
obviously, and the temperature of the battery will rise sharply. Because there will be heat accumulation in
the process of battery ISC, it will trigger the battery heat abuse chain reaction in a short time, leading to
the battery heat being out of control. Even if ISC only happens to the battery, it is likely to cause a series
of accidents and even large LiB fires [3]. Since the time interval between the later stage of battery ISC and
the thermal runaway of the battery is very short, there is almost no safety and time allowance for the
prediction of the later stage of ISC to take corresponding measures. In contrast, there will be a sufficient
safety and time margin if battery ISC is detected in the early stage to take corresponding countermeasures
to solve the battery ISC problem ahead of time.
1.1. Review of prediction approaches
For the ISC prediction of battery packs, Ouyang et al. [4] developed a detection method based on
parameter identification of the battery difference model (CDM). Through the analysis of the battery ECM,
they found an abnormal open-circuit voltage (OCV) and resistance of the ISC battery. Experimental results
show that the OCV difference of the ISC battery will increase gradually. However, under constant current
conditions, the method may not be able to effectively determine OCV differences. X Feng et al. [5] studied
battery ISC using a three-dimensional (3-D) electrochemical thermal coupling model. The short circuit
resistance of the battery may produce too much heat, and excessive heat generated by ISC batteries was
modeled. Experimental results show that the state of charging (SoC) of the ISC battery is abnormal [2].
Through internal and external experiments on LiB, R Zhao et al. [6] adopted an improved electrochemical
thermal model (ETM) to predict the temperature change of the battery. Z Chen et al. [7] proposed a fault
diagnosis method based on the online model. Although progress has been made in these studies, there is a
heavy computational burden to identify model parameters in engineering applications.
Several experimental methods have been used for battery ISC prediction. Nail penetration is a
common method of determining battery health [8, 9]. Christopher D.Rahn devised a nail made up of
sensors, used to gather experimental data with battery ISC [10]. Wang Hsin Wang designed an improved
kneading torsion test method by increasing the torque on battery ISC [11]. Extrusion testing is another
method and is the use of round rods or hard plates to press batteries to monitor ISC [12, 13]. The cell
diaphragm may be broken by shear stress during crushing tests, or experiments may lead to contact
between positive and negative components. The methods for nail penetration and crushing are easy to test,
but it's difficult to control the progress of ISC experiments, mainly because the contact area and the short
layer are difficult to control. As a key ISC parameter, the short circuit resistance of the battery is largely
determined by the contact area [14]. To conquer this challenge, Premanand Ramadass used a hole
compression way to trigger a battery ISC [15]. Donal P.Finegan [16] used PCM material instead of pores
on the battery partition. When the battery is heated to a specific temperature, the wax will melt, which
causes the battery cathode material and negative electrode material to come into contact. Although these
experimental methods are easy to implement, they are hard to hold. In addition, putting metal particles into
a battery or reassembling the battery may affect battery performance.
Battery ISC can cause the battery temperature to rise. Chen et al. construct an electrothermal
coupling model to further research the temperature distribution of ISC batteries [17]. Feng et al. designed
Page 3
Int. J. Electrochem. Sci., 16 (2021) Article ID: 210463
3
an electrothermal coupling model to reveal the corresponding relationship between the temperature and
ISC state of LiBs [18]. Zhang et al. studied the relationship between battery ISC and mechanical abuse to
analyze the corresponding battery temperature rise [19]. The results show that the temperature distribution
of the battery pack is uneven. As a result, temperature-dependent prediction methods can be influenced by
battery thermal management or the battery ISC external environment.
The battery ISC reaction mechanism is complex and difficult to obtain. Additionally, there are
some other battery ISC prediction methods. Through the use of X-ray technology, Sun et al. observed
lithium dendrite growth and deformation of the battery diaphragm during the ISC process [20]. Rui Guo,
et al. also used X-ray technology to study the process of battery thermal runaway and ISC triggers to
improve the safety of battery design [21]. Guo et al. studied the whole battery ISC process by
overdischarging the battery SoC to -100% [22]. Xiangdong Kong, et al. have established a pseudo two-
dimensional model of a micro ISCr battery [23] , revealing the battery drain phenomenon and the change
of battery parameters when micro ISCr occurs in the battery, and also found that the electrical conductivity
of the separator is the key parameter describing ISCr. Furthermore, through simulation and experiments,
it is found that the impedance of the micro ISCr battery is different from that of the normal battery.
Dongsheng Ren, et al. study on the relationship between battery ISC and thermal runaway [24]. Lishuo
Liu, et al. comparative study of battery ISC alternative triggering methods [25].
Chemical reactions, heat accumulation, temperature increases and so on accompany battery ISCs.
Therefore, a model-based battery ISC prediction method needs to establish a battery thermal model,
electrochemical model, and ISC model [4-7]. However, in engineering applications, such methods usually
require a heavy computational burden to identify the model parameters. ISC states in batteries are triggered
by experimental techniques, such as nail penetration, extrusion testing, and reassembly of the battery.
Experimental methods for ISC prediction of these batteries [8-16], which are usually easy to operate but
difficult to control and reproduce, may bring about serious safety incidents, such as thermal runaway. There
are two main factors that challenge temperature-based methods [17-19]: the temperature distribution on
the surface of the battery is uneven, and the surface temperature of the battery is easily affected by the
environment. Although some progress has been made in existing research on ISC prediction, there is still
a lack of simple and effective methods for the early prediction of battery ISC. At the early stage of battery
ISC, the short circuit current is small, the short circuit scale is relatively small, and the Joule effect heat
from the short circuit current is also very small. In addition to the heat dissipation design of the battery,
there is little heat dissipation in the early stage of the ISC. Moreover, the battery SoC or OCV changes
relatively slowly due to the low short circuit current. Hence, it is difficult to detect ISC at an early stage by
thermal or conventional voltage methods, and developing a simple and effective fast prediction method
for battery ISC is a meaningful and challenging task.
1.2. Contribution and organization
To overcome such challenges, a model implemented by RFC is proposed for LiB ISC prediction.
The contributions made in this research are as follows.
Page 4
Int. J. Electrochem. Sci., 16 (2021) Article ID: 210463
4
(1) A novel method for LiB ISC prediction is proposed. The RFC model only needs a few short-
term data samples and can work efficiently for rapid measurement, which does not depend on a thermal-
electrical coupled model, heavy computational burden, or time-consuming parameter identification.
(2) Based on the relaxation behavior of LiBs, the data samples of the normal battery and battery
with the ISC state are acquired by a group of current pulses that last only several minutes. This method
for short-term feature acquisition is easy to implement in engineering applications.
The following sections of this article are organized as follows. In Section 2, prior research related
to battery ISC is introduced. Section 3 introduces the feature structure and the modeling method of battery
ISC prediction. The results and analysis of the battery ISC prediction are introduced in Section 4. Section
5 gives a discussion of battery ISC prediction, and section 6 serves as a conclusion.
2. PRIOR RESEARCH OF BATTERY ISC
2.1. An Introduction of battery ISC
While the positive and negative electrodes inside the battery are switched on, ISC will occur. There
are usually four types of ISCs according to the structure of the LiB [26]: aluminum-copper (Al-Cu), copper
cathode material (Ca-Cu), aluminum anode material (Al-An) and cathode material (Ca-An). Battery ISCs
are caused by three main reasons: mechanical abuse, thermal abuse and electrical abuse.
Initial stage Middle stage Final stage
The process
is restricted
Affected by
heat dissipation
Unstoppable
development
Vol
tage
Tem
pera
ture
Time
Figure 1. The battery ISC evolution process
The evolution of the battery ISC state includes early, intermediate and final stages [27], as shown
in Fig. 1. When the ISC resistance is high in the early stage of ISC, the battery discharge will cause the
voltage to decrease slowly. At low exothermic power, the heat generated inside the battery can escape, so
the battery temperature will not change significantly. The intermediate stage is the transition stage of the
battery ISC. During the final stage of the ISC state, the ISC resistance is small, the current is large, and the
battery voltage drops rapidly. The exothermic power of the battery is very large, which will produce a large
amount of heat, and the temperature of the battery will rise. Based on the failure temperature of the battery
partition, the battery diaphragm will break. As a result, with a large short circuit area between the positive
and negative electrodes of the battery, the battery terminal voltage will be reduced to 0 V. In the meantime,
Page 5
Int. J. Electrochem. Sci., 16 (2021) Article ID: 210463
5
the high temperature will trigger the thermal runaway chain reaction, which will release a lot of heat in a
short time, and ultimately trigger the thermal runaway of the battery [28].
2.2. The relaxation characteristics of lithium-ion batteries
During battery testing, charging and discharging the battery will touch off the distribution of
electrons and ions in the electrode to be unbalanced. This phenomenon is called battery polarization [29].
Because of this phenomenon, the electrode potential deviates from the equilibrium potential. Generally,
there are three main types of battery polarization [30]. First, because of the resistance of the electrodes,
electrolytes, and partitions, the voltage will drop, which is the ohmic polarization of the battery. Second,
charge transfer is associated with the lithium ions of the battery and is known as battery activation
polarization. Finally, concentration polarization is determined by the lithium-ion in solid-phase diffusion.
CC-CV chargeCC-CV discharge
Relaxation
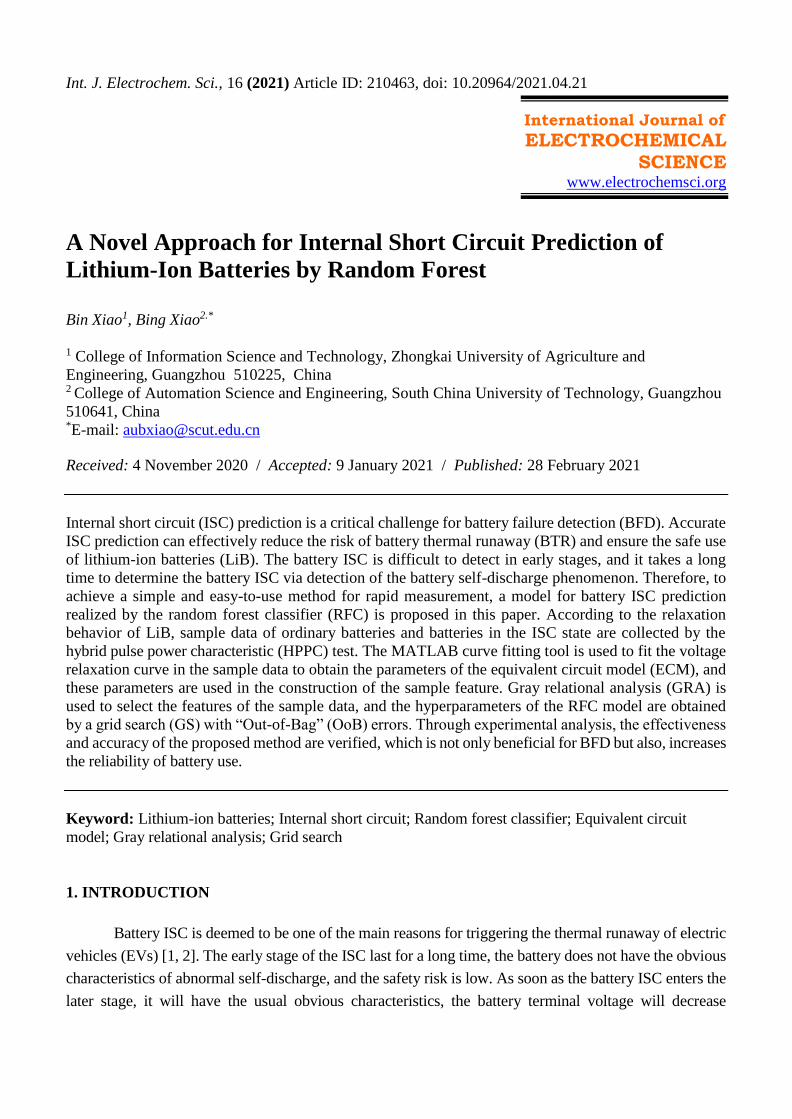
Figure 2. The relaxation process of the battery during testing
When the battery stops charging and discharging, the battery voltage is still unstable during the
relaxation time, as shown in Fig. 2, which can be regarded as the depolarization process of the battery.
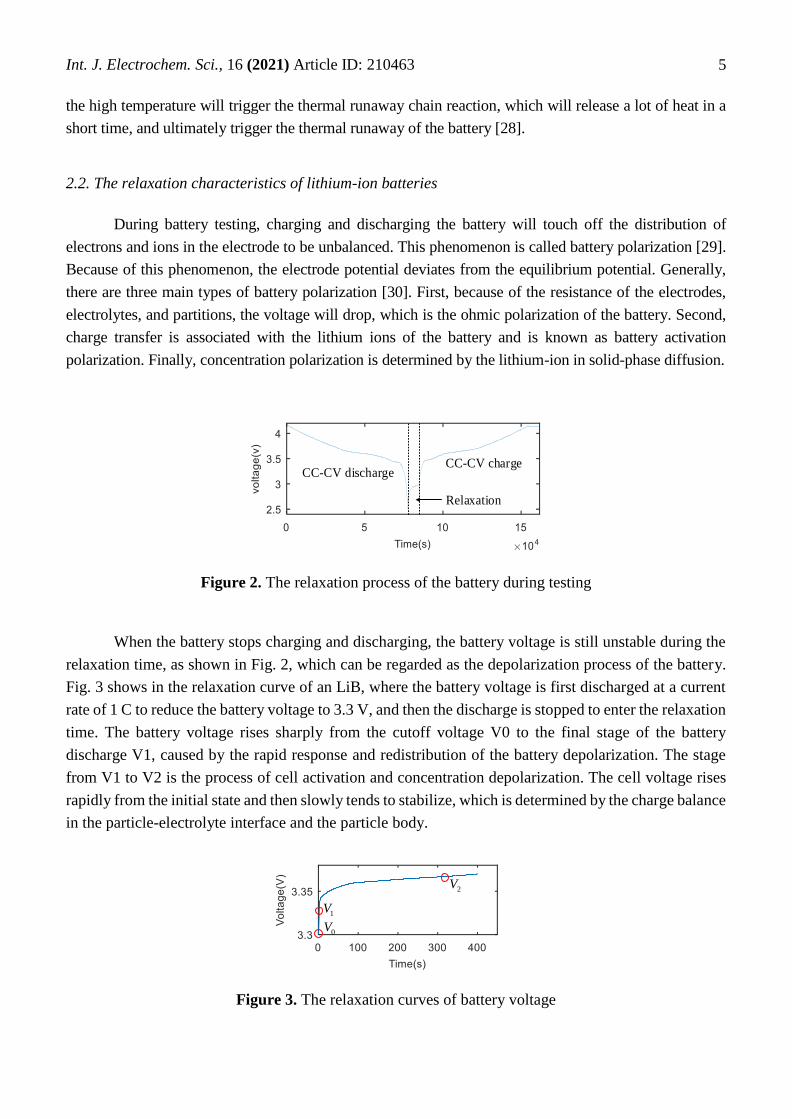
Fig. 3 shows in the relaxation curve of an LiB, where the battery voltage is first discharged at a current
rate of 1 C to reduce the battery voltage to 3.3 V, and then the discharge is stopped to enter the relaxation
time. The battery voltage rises sharply from the cutoff voltage V0 to the final stage of the battery
discharge V1, caused by the rapid response and redistribution of the battery depolarization. The stage
from V1 to V2 is the process of cell activation and concentration depolarization. The cell voltage rises
rapidly from the initial state and then slowly tends to stabilize, which is determined by the charge balance
in the particle-electrolyte interface and the particle body.
2V
1V
0V
Figure 3. The relaxation curves of battery voltage
Page 6
Int. J. Electrochem. Sci., 16 (2021) Article ID: 210463
6
2.3. Problem formulation of battery ISC
The voltage response of the battery test will be normal when ISC does not occur. However, when
battery ISC occurs, the characteristics of lithium-ion migration inside the battery will change, which will
affect the polarization phenomenon of the battery, thus affecting the battery voltage response process.
Hence, the battery ISC problem can be transformed into a two-class problem to address. Emphasis is placed
on selecting appropriate models and providing data samples to ensure accurate battery ISC prediction.
Therefore, the data set for model training can be represented as follows:
{ , } X Y (1)
where 1 2{ , ,..., } nX x x x and 1 2{ , ,..., } nY y y y are the input sample data and output results,
respectively. Here, 1 2 3 4 5[ ( ), ( ), ( ), ( ), ( )]kx F k F k F k F k F k and {1, 1} ky , where 1( )F k , 2( )F k , 3( )F k ,
4( )F k , 5( )F k are the sample features of the battery test, 1 and -1 are sample labels indicating whether the
battery is exhibiting ISC or not.
2.4. The parameter identification of battery ECM
In general, the battery dynamic behavior can be described by an ECM composed of several
resistance and capacitance (RC) combinations, as shown in Fig. 4, which is a second-order RC battery
ECM.
+-
1R2R
0R
1C 2C
1U 2U
tU( )ocvU soc ( )I t
Figure 4. A second-order battery ECM
The battery ECM is composed of three parts: ocvU , the ohmic resistance ( 0R ), and two RC
equivalent circuits for polarization. The parameters 0U , 1U , 2U , and tU are the ohmic overpotential,
diffusion overpotential, charge transfer overpotential, and battery terminal voltage, respectively.
I
t
(a) Current pulse
V
t
(b) Response voltage
A
B C
D E
Figure 5. The impulse discharge response of an LiB
Page 7
Int. J. Electrochem. Sci., 16 (2021) Article ID: 210463
7
According to Kirchhoff’s law, the circuit equation can be written as:
1 1
1 1 1
2 2
2 2 2
1 2 0
1 1
1 1
t ocv
U U IR C C
U U IR C C
U U U U IR
(2)
According to the second-order battery ECM and Fig. 5, the formula for calculating 0R is as
follows:
0
| | D CU U
RI
(3)
According to Fig. 5, in the stage from A to C, the RC circuit is in the zero state response, and the
voltage in this area can be obtained by: 1 2/ /
0 1 2( ) ( ) (1 ) (1 ) t t
t ocvU t U t IR IR e IR e (4)
where 1 1 1 RC , 2 2 2 R C .
In the stage from C to E, the RC circuit is in the zero input state, and the battery voltage during the
process of D to E is:
1 2
1 2
/ /
10 20
( ) ( ) ( ) ( )
( )
t ocv
t t
ocv
U t U t U t U t
U t U e U e (5)
where 10U , and 20U are the initial values of the battery transient voltage.
By the MATLAB curve fitting tool, the coefficients of the above formula can be obtained, and the
parameters of the battery model can be obtained as follows:
101
UR
I, 20
2 U
RI
, 11
10
IC
U, 2
2
20
IC
U (6)
3. MODELING AND METHODOLOGY
3.1. Feature construction
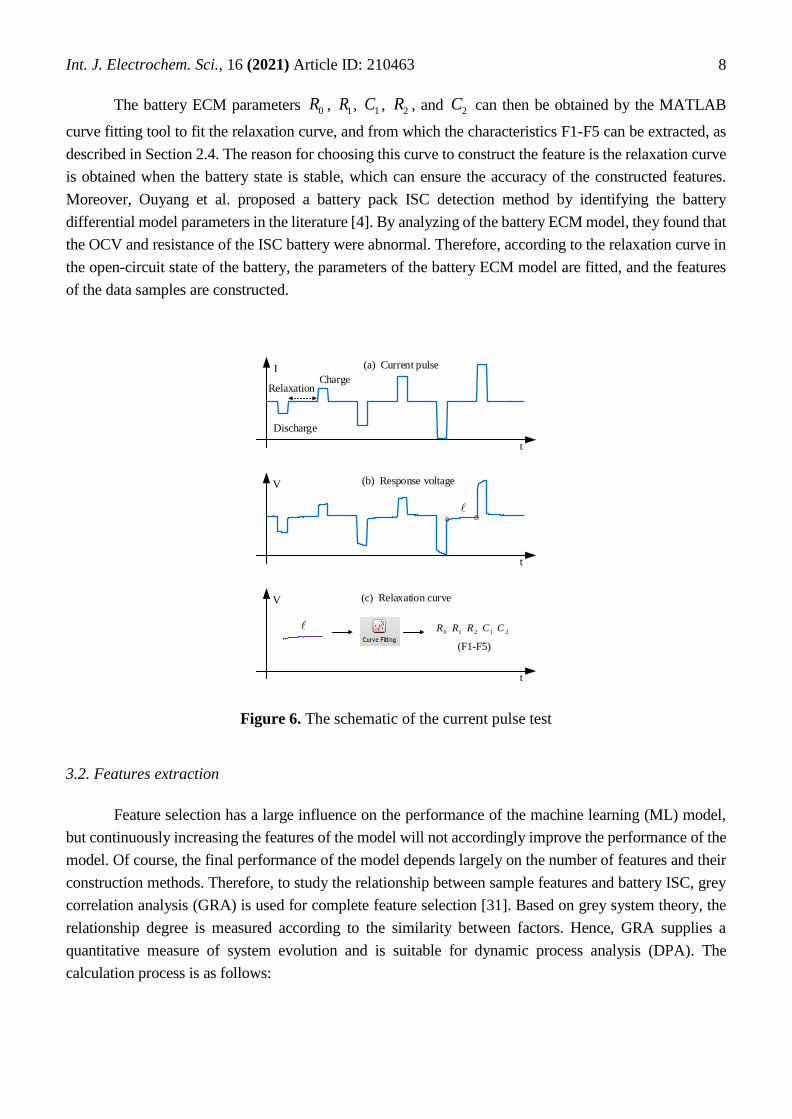
According to the polarization phenomenon, the voltage relaxation curve can be obtained during the
battery test. Hence, the response voltage data (including charging and discharging data) collected using
HPPC test methods are used to construct the features. The test result is shown in Fig. 6. Fig. 6(a) is the
current pulse, Fig. 6(b) is the voltage response, and Fig. 6(c) is the voltage relaxation curve.
The hybrid pulse current was discharged at a current rate of 1 C and charged at a current rate of 1
C during the battery HPPC test, followed by current rates of 2 C and 3 C, respectively. The duration of the
current pulse in Fig. 6(a) is 10 s, the relaxation time is 30 s, and the amplitudes are 1 C, 2 C and 3 C.
Moreover, there is a relaxation time after each pulse charge and discharge. The battery response voltage
diagram in Fig. 6(b) can be obtained by HPPC in the battery pulse test, and the voltage relaxation curve
diagram in Fig. 6(c) can then be acquired from the charge and discharge response voltage.
Page 8
Int. J. Electrochem. Sci., 16 (2021) Article ID: 210463
8
The battery ECM parameters 0R , 1R , 1C , 2R , and 2C can then be obtained by the MATLAB
curve fitting tool to fit the relaxation curve, and from which the characteristics F1-F5 can be extracted, as
described in Section 2.4. The reason for choosing this curve to construct the feature is the relaxation curve
is obtained when the battery state is stable, which can ensure the accuracy of the constructed features.
Moreover, Ouyang et al. proposed a battery pack ISC detection method by identifying the battery
differential model parameters in the literature [4]. By analyzing of the battery ECM model, they found that
the OCV and resistance of the ISC battery were abnormal. Therefore, according to the relaxation curve in
the open-circuit state of the battery, the parameters of the battery ECM model are fitted, and the features
of the data samples are constructed.
Discharge
ChargeRelaxation
I
t
(a) Current pulse
V
t
(b) Response voltage
l
V
t
(c) Relaxation curve
(F1-F5)
l1C1R 2R 2C0R
Figure 6. The schematic of the current pulse test
3.2. Features extraction
Feature selection has a large influence on the performance of the machine learning (ML) model,
but continuously increasing the features of the model will not accordingly improve the performance of the
model. Of course, the final performance of the model depends largely on the number of features and their
construction methods. Therefore, to study the relationship between sample features and battery ISC, grey
correlation analysis (GRA) is used for complete feature selection [31]. Based on grey system theory, the
relationship degree is measured according to the similarity between factors. Hence, GRA supplies a
quantitative measure of system evolution and is suitable for dynamic process analysis (DPA). The
calculation process is as follows:
Page 9
Int. J. Electrochem. Sci., 16 (2021) Article ID: 210463
9
(1): The reference sequence { ( ) | 1,2,..., } Y y k k n is constructed, where ( ) ( )y k ISC k , the
comparative sequence { ( )}i iX x k , here i iX F ;
(2): The data is preprocessed;
(3): The relational coefficients are calculated:
min max | ( ) ( ) | max max | ( ) ( ) |( )
| ( ) ( ) | max max | ( ) ( ) |
i ii k i k
i
i ii k
y k x k y k x kk
y k x k y k x k (7)
where is the identification coefficient, (0,1)
(4): The relational grade r is calculated:
1( ( ))
n
i iir mean k (8)
Redundant items may exist in the selected sample features, but the features obtained after the
correlation grade calculation will not affect the final battery ISC prediction results. The relationship
between the obtained sample features and the battery ISC according to the calculation steps of the above
GRA is shown in Table 1. When the value of the relation grade is equal to 1.0, the relationship degree is
the largest. Therefore, there is a high correlation between the extracted sample features and battery ISC,
which indicates that feature selection can ensure that the RFC model can accurately predict battery ISC
state.
Table 1. The relational between features Fi and SoH
Feature F1 F2 F3 F4 F5
Grades 0.8255 0.8032 0.7962 0.8238 0.8216
3.3. ISC prediction by RFC
Breiman proposed the random forest (RF) algorithm in 2001[32]. The RF model generates a large
number of decision trees (DTs) that pose as regression or classification tools, and the output of the RF is
the mean of the output of all of the DTs. In a nonparametric model, DTs are still named classification and
regression trees (CARTs), which is a statistical model developed by Breiman et al. [33]. Each DT
constituted by a decision node and a leaf node. The decision node evaluates the sample of each input
through the test function and then passes it to variety branches according to the sample characteristics. In
the process of learning, the DT grows based on the sample data.
Let X be an input vector with m features, and Y be an output scalar. Then, the training set
including n observations can be revealed as follows:
1 1 2 2{( , ), ( , ),...( , )}, , m
n n nS x y x y x y X R Y R (9)
In the process of model training, the input data fed to the model are split at each node, so the
parameters of the split function need to be optimized to fit the data set nS . In the first step, the decision
tree should be optimally split, where the splitting process will start from the root node, each node obtains
new input data, and then this step is repeated until the terminal leaf is hit. Finally, when the maximum
Page 10
Int. J. Electrochem. Sci., 16 (2021) Article ID: 210463
10
number of levels is reached, the growth of the tree should be stopped, and a estimation function ˆ( , )nh X S
is realized based on the data set nS .
The random forest classifier (RFC) is an extension of CART technology. Each tree in the RF will
randomly grow a subset of estimators, and the RF will construct multiple unrelated DT during the training
process. The RF uses the basic classifier ( , )kh X with an L-tree structure, where k is a set of
autocephaly and uniformly distributed random vectors. The RFC model is an integrated method that
combines all generated DTs through bagging or bootstrap aggregation algorithms (BAAs). This technique
is able to use with lots of regression methods to reduce the variance associated with predictions. The
process of RF randomly collecting samples is called the boot procedure, which is acquired by randomly
selecting n observation values from the data set nS and replacing them, and the probability of each
observation value being selected is 1/ n . To construct a set 1
1ˆ ( , )
nh X S ,…, ˆ ( , )q
q nh X S of q prediction
trees, the definition is as shown in the following formula, and a bagging algorithm is used to select multiple
bootstrap samples 1( ,..., ) q
n nS S .
ˆˆ ( , ) i
i i nY h X S (10)
where 1,...,i q . The integration generates q outputs corresponding to each tree, and the
aggregation is carried out by averaging the outputs of all of the DTs. Therefore, the output estimated
value Y can be gained by the following formula:
1 1
1 ˆˆ ˆsgn( ( , )) 1,2,...,
k k l
l ni iY Y h X S l q
k (11)
where Y is the output of the l - th tree, 1,2,...,l q . The skeleton of the RFC model for ISC
prediction is shown in the figure below.
Bootstrap
samples
Prediction Y1
Output
Extracted features Sn
...
...
...Bootstrap
samples
Bootstrap
samples
Tree1 Tree2 Tree q
Prediction Y2 Prediction Yq
1
nS q
nS2
nS
Y
Figure 7. Schematic diagram of the RFC model for battery ISC prediction
Page 11
Int. J. Electrochem. Sci., 16 (2021) Article ID: 210463
11
3.4. Hyperparameter optimization of RFC model
Ensemble learning is currently a very popular class of machine learning (ML) methods that
conforms the modeling results of whole models by construct several models on datasets. RF is composed
of randomly generated DT and is a representative integration algorithm. By integrating multiple weak
classifiers, the overall model has higher accuracy and better generalization performance. A distinctive
advantage of the RF is the using of “out-of-bag” (OoB) data to estimate the generalization error. In the
construction of DTs, random back extraction is used.
The OoB is a data set that is not adopted in the model training for the current tree. This ensemble
estimation of generalization error proposes the precision of the DT classification and at the same time helps
to quantify the significance of the sample features. The OoB estimation calculates the classification of each
sample by the DT when it is an OoB sample. The majority vote is used as the classification result of the
data sample. The ratio of the number of misclassifications to the whole number of samples is introduced
as the OoB misclassification rate of the RF. The RF generalization error of an unbiased estimate is able to
evaluate internally, in other words, the error of an unbiased estimate can be established during the
generation process.
The basic theory of the GS method is to divide the grid over a specific range, and use the value of
the optimal number of DTs and the number of leaves of the RF tree to traverse all points in the network.
Combined with the OoB error method, the accuracy of the model classification can be verified by the
training set under this parameter value. Finally, the most accurate parameters are determined as the best
model parameters.
4. ANALYSIS OF EXPERIMENTAL
This section introduces the experimental analysis, which includes data description and collection,
training and testing of the RFC model, verification and results of the RFC model.
4.1. Data description
Figure 8. The experimental setup of the test platform
The experimental platform for battery testing and data acquisition is shown in Fig. 8. The test
platform consists of an LiB, temperature control box, battery test system and user test computer. After
Page 12
Int. J. Electrochem. Sci., 16 (2021) Article ID: 210463
12
the battery is placed in the temperature control box, the battery test system is connected by the
temperature control box, and the battery test system is connected with the power supply and PC. Finally,
the computer obtains the test data to complete the battery test experiment. The 18650 LiB used in the
experiment has a cycle life between 1000 and 1500 cycles. Other relevant parameters of the battery are
listed in Table 2.
For normal battery samples, the battery aging test and HPPC test are as described in section 3. The
battery sample data collection process is as follows: after the battery aging test, the battery sample data are
collected using the HPPC test at 5%, 10%, 15%, 20%, and 25% depth of discharge (DoD). In the test
experiment, the sampling time was set to 1 second, a total of 12 batteries were tested, and a total of 60 data
samples were collected for model training. For batteries in the ISC state, a total of 5 battery samples were
tested. The data were collected 12 times, each time according to the HPPC method. A total of 60 samples
of batteries in the ISC state were collected. In the data sample, three random samplings (20/each time)
were performed, and 3 test sets were constructed for model verification.
Table 2. Cell parameters
Brand name Battery
weight
Nominal
capacity
Nominal
voltage
Charge/discharge
cutoff voltage
Sanyo 45 g 2.4 Ah 3.7 V 4.2 V/3.0 V
4.2. Model training
The experiment was performed in Windows 8.0 by MATLAB 2015 and MATLAB TreeBagger
[34]. In order to prevent multiple dimensions of raw sample data from affecting model training, data
preprocessing must be performed to dispel this effect, and then improve the convergence rate during model
training. In this paper, the minimum-maximum normalization method is used, as shown below.
' ( ) / ( ) x x xx x min max min (12)
where x and 'x are the raw data value and scaled data value, respectively, and xmax and xmin
are the maximum and minimum values of the sample, respectively.
The adaptive assessment plays an essential role. In this paper, the OoB error method on the number
of optimal DTs is used to evaluate the performance of RFC models. The RFC model is trained by using
different numbers of DTs according to the GS principle, and the corresponding OoB error is obtained.
According to the convergence of the OoB error, an optimal number of decision trees are finally selected.
The OoB error analysis and convergence diagram of model training is shown in Fig.9.
Page 13
Int. J. Electrochem. Sci., 16 (2021) Article ID: 210463
13
Figure 9. OoB error of RFC model training
According to the above OoB error analysis diagram, it can be concluded that when the number of
DTs is near 100, 110, and 120, the training error of the model is the smallest, reaching 0.08. When the
number of DTs increases, the accuracy of the model is improved accordingly. However, after more than
100, the OoB error changes very little, and the performance of the model does not improve with the
increase in the number of DTs. On the other hand, when the number of DTs increases, the computational
overhead is increased. Therefore, the number of DTs selected in this paper is 100. The OoB error can be
used as an unbiased estimate of the generalization error of the RFC model, and its results are equivalent to
k-fold cross validation (CV). Therefore, the use of the RFC model to predict the battery ISC without CV
can ensure that the model has good generalization.
4.3. Performance metrics
To evaluate the prediction performance of the RFC model for battery ISC, three performance
metrics are introduced in this paper: prediction precision, recall rate and f-score. The prediction precision
is a measure of the accuracy of the identification model to judge the unknown sample as positive. The
recall rate is a measure of the accuracy of all positive samples in the data set. Generally, it is difficult to
take into account both high precision and high recall rate, so the f-score is adopted to evaluate the precision
and recall rate synthetically. The specific definitions of each metric are shown below.
TPprecision
TP FP (13)
TPrecall
TP FN (14)
2- (1 )
precision recallf score
precision recall (15)
where TP is the number of true positive samples, FP is the number of false-positive samples, TN
is the number of true negative samples, and FN is the number of false-negative samples. Parameter
is used to control the weight of the precision and recall rate. In general, the value is equal to 1.0, and the
importance of the two metrics is the same.
Page 14
Int. J. Electrochem. Sci., 16 (2021) Article ID: 210463
14
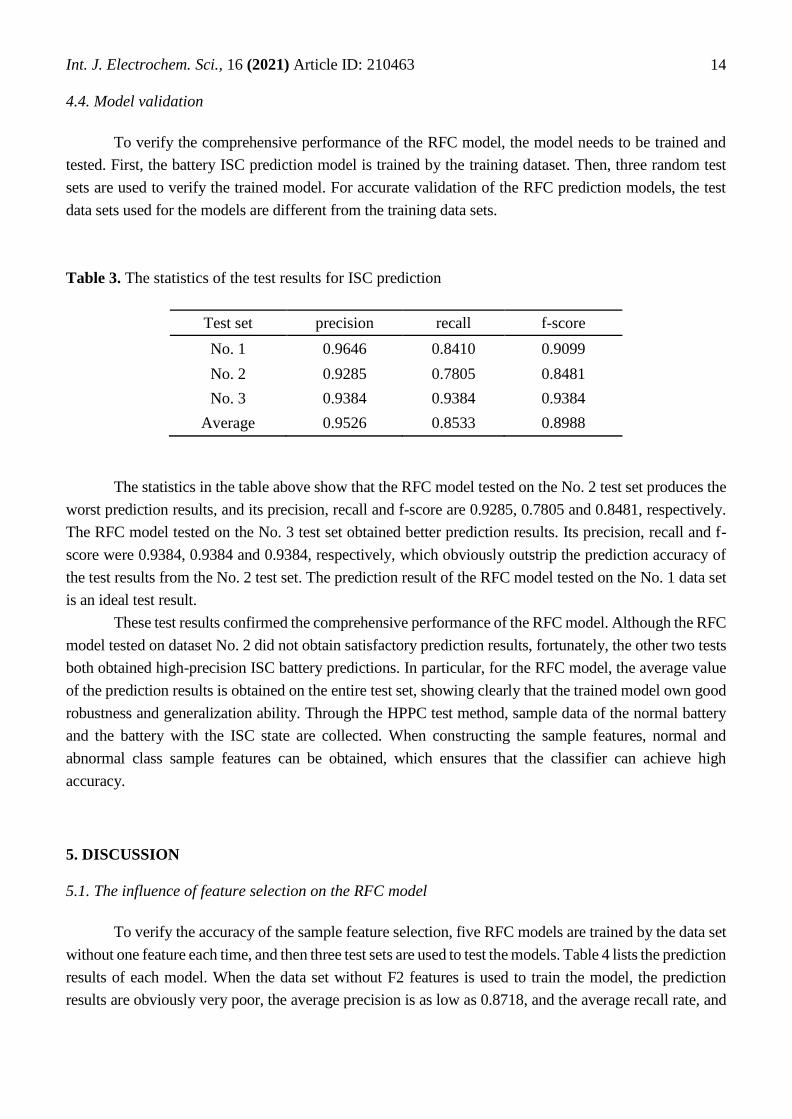
4.4. Model validation
To verify the comprehensive performance of the RFC model, the model needs to be trained and
tested. First, the battery ISC prediction model is trained by the training dataset. Then, three random test
sets are used to verify the trained model. For accurate validation of the RFC prediction models, the test
data sets used for the models are different from the training data sets.
Table 3. The statistics of the test results for ISC prediction
Test set precision recall f-score
No. 1 0.9646 0.8410 0.9099
No. 2 0.9285 0.7805 0.8481
No. 3 0.9384 0.9384 0.9384
Average 0.9526 0.8533 0.8988
The statistics in the table above show that the RFC model tested on the No. 2 test set produces the
worst prediction results, and its precision, recall and f-score are 0.9285, 0.7805 and 0.8481, respectively.
The RFC model tested on the No. 3 test set obtained better prediction results. Its precision, recall and f-
score were 0.9384, 0.9384 and 0.9384, respectively, which obviously outstrip the prediction accuracy of
the test results from the No. 2 test set. The prediction result of the RFC model tested on the No. 1 data set
is an ideal test result.
These test results confirmed the comprehensive performance of the RFC model. Although the RFC
model tested on dataset No. 2 did not obtain satisfactory prediction results, fortunately, the other two tests
both obtained high-precision ISC battery predictions. In particular, for the RFC model, the average value
of the prediction results is obtained on the entire test set, showing clearly that the trained model own good
robustness and generalization ability. Through the HPPC test method, sample data of the normal battery
and the battery with the ISC state are collected. When constructing the sample features, normal and
abnormal class sample features can be obtained, which ensures that the classifier can achieve high
accuracy.
5. DISCUSSION
5.1. The influence of feature selection on the RFC model
To verify the accuracy of the sample feature selection, five RFC models are trained by the data set
without one feature each time, and then three test sets are used to test the models. Table 4 lists the prediction
results of each model. When the data set without F2 features is used to train the model, the prediction
results are obviously very poor, the average precision is as low as 0.8718, and the average recall rate, and
Page 15
Int. J. Electrochem. Sci., 16 (2021) Article ID: 210463
15
f-core are 0.9070 and 0.8864, respectively. Moreover, when using a dataset without F3 features to train the
model, it will also produce unsatisfactory prediction results. The average values of its ISC prediction
precision, recall rate and f-core are 0.9122, 0.8776 and 0.8944, respectively. The remaining three models,
that is, the models not trained with F1, F4 and F5 features, produced relatively better prediction results
compared with other models, but they were also inferior to the models trained with all five input variables.
In short, all of the selected input variables will have an impact on the battery ISC prediction, and are
essential for the ISC prediction model.
Table 4. The statistical of test results for ISC estimation
Minus
feature Test set precision recall f-score
F1
Test 1 0.9656 0.8331 0.9053
Test 2 0.9243 0.7688 0.8395
Test 3 0.9384 0.9384 0.9384
Average 0.9512 0.8468 0.8944
F2
Test 1 0.9243 0.8660 0.8942
Test 2 0.7557 0.9196 0.8297
Test 3 0.9354 0.9354 0.9354
Average 0.8718 0.9070 0.8864
F3
Test 1 0.9322 0.8799 0.9053
Test 2 0.8660 0.8145 0.8395
Test 3 0.9384 0.9384 0.9384
Average 0.9122 0.8776 0.8944
F4
Test 1 1.0000 0.8331 0.9053
Test 2 0.9243 0.7688 0.8395
Test 3 0.9384 0.9384 0.9384
Average 0.9512 0.8468 0.8944
F5
Test 1 1.0000 0.8331 0.9053
Test 2 0.9243 0.7688 0.8395
Test 3 0.9354 0.9354 0.9354
Average 0.9402 0.8458 0.8934
5.2. The influence of hyperparameter on the RFC model
The RFC model is very easy to use, and only one parameter needs to be adjusted: the number of
DT nTree. The parameter nTree is the number of DTs used in the RFC model, indicating how many sample
subsets there are. A larger nTree means that more DTs are used for classification in the RFC model, which
easily leads to overfitting. When the value of nTree is smaller, fewer DTs are used for classification in the
RFC model, and the model is not easy to fit and may be underfit. Therefore, when the parameter nTree is
too large or too small, the generalization ability of the model may not be ideal. As shown in Fig. 10, when
nTree is greater than 90, the three indicators of prediction precision, recall rate and f-core tend to stabilize,
and the classification accuracy value on test set 1 reaches the maximum value of 100%.
Page 16
Int. J. Electrochem. Sci., 16 (2021) Article ID: 210463
16
Figure 10. The relationship between the parameter nTree and performance metrics
The optimal number of DT nTree has the greatest impact on the RFC model. Of course, the model
has other parameters, but the impact is small. For example, the maximum depth of the DT indicates the
maximum depth that the DT can grow when the RFC model is constructed. If set to none, the DT will not
control the depth of the subtree when constructing the optimal prediction model. When the model has a
large sample size and many features, limiting the maximum depth can be considered to prevent excessive
computer overhead. When the model sample size is small, there is no need to limit the maximum depth.
5.3. Comparison with other ISC detection methods
The research is based on symmetrical loop circuit topology to detect the internal short circuit in a
battery pack connected in parallel [35]. The internal short circuit is judged based on number theory and
circuit topology. The recursive least squares (RLS) algorithm can be used to lock the faulty unit online,
and an ISC state with a resistance of less than 10 Ω can be detected within 15 s. Another work developed
a lumped thermal evolution model (TEM) based on the battery equivalent circuit model (ECM) [36]. An
extreme learning machine (ELM) is used to synthesize multiple scattered configuration TEM/ECM
submodels to approximate the distribution characteristics of actual batteries. Multiple types of correlation
vector machines (RVM) are used to distinguish the battery ISC states. The experimental results verify the
reliability of the model structure, the level misjudgment rate is 14.59%, and the state misjudgment rate is
as low as 3.13%. In [37], the author proposed an early ISC detection method based on the state of charge
(SOC) correlation, which can be used for the online detection of battery ISC under dynamic conditions.
The SOC of each battery is estimated through an extended Kalman filter (EKF), and a moving window is
used to calculate the correlation coefficients for adjacent batteries to ensure the accuracy and stability of
the estimation. Experimental results show that the method is fast and accurate, and can detect the early ISC
of 100 Ω online under dynamic conditions within 20.4 hours. The research presented in [38] proposes a
novel and accurate algorithm based on a model that can detect the soft ISCr state of the battery online
regardless of the load current. The battery equivalent circuit model with ISCr state is used to extract the
open circuit voltage of the battery, thereby obtaining the enhanced relationship between the open circuit
voltage and the charging state. The research results show that the relative error of the estimated failure
index does not exceed 6.4%. This paper uses the HPPC test method to collect the voltage response curves
of normal batteries and ISC state batteries as sample data, and then constructs sample feature variables F1-
F5 to train the RFC model. The test precision, average recall rate and f score are 0.9526, 0.8533 and 0.8988,
respectively. The experimental results show that this method can achieve high-precision battery ISC
Page 17
Int. J. Electrochem. Sci., 16 (2021) Article ID: 210463
17
prediction. In the [35], symmetric loop circuit topology is mainly used to detect the battery ISC state. In
the [36] and [38], the prediction of the battery ISC state is based on the battery ECM, which is highly
dependent on the battery model. In the [37], it is necessary to use the EKF to obtain the battery SOC, which
easily increases the estimation error.
6. CONCLUSIONS
The HPPC method is used to test normal batteries and ISC batteries, and the voltage response curve
of the batteries is collected as the data sample. Then, the RFC model is trained by the data sample to predict
the battery ISC. Based on the above research, the following conclusions can be drawn.
First, the HPPC test method is used to collect the partial voltage response curve as sample data.
This nonintrusive and nondamaging method only takes several minutes to complete, and is easy to
implement in engineering. The parameters 0R ,
1R , 1C ,
2R , and 2C of the second-order RC battery ECM
are acquired by using the MATLAB curve fitting tool to fit the relaxation curve in the sample data, which
constitutes the feature variables F1-F5 of the sample. To configure the RFC model, only one parameter,
nTree, needs to be tuned, because the other parameters have little effect on the performance of the model.
As shown in Fig. 10, when the parameter nTree is greater than 90, the test precision, recall rate, and f-score
are stable between 0.8 and 1.0, and the classification accuracy reaches the maximum value of 97.46%. By
analyzing the influence of the parameter nTree on the performance of the RFC model, the parameters of
the RFC model can be determined. Third, the trained RFC model is verified by the three random test data
sets. The average values of the test precision, recall and f-score are 0.9526, 0.8533, and 0.8988,
respectively. Experimental results show that this method achieves high-precision battery ISC prediction.
CREDIT AUTHORSHIP CONTRIBUTION STATEMENT
Bin Xiao: Investigation, Methodology, Writing original draft, Writing-review & editing, Validation,
Formal analysis. Bing Xiao: Project administration, Supervision, Validation.
DECLARATION OF COMPETING INTEREST
The authors declare that they have no known competing financial interests or personal relationships that
could have appeared to influence the work reported in this paper.
ACKNOWLEDGMENTS
The authors gratefully acknowledge the financial support from the Natural Science Foundation of
Guangdong Province, Grant/Award Number: 2015A010106005
References
1. C. J. Orendorff, E. P. Roth, and G. Nagasubramanian, J. Power Sources, 15(2011) 6554.
2. N. Williard, W. He, C. Hendricks, and M. Pecht, Energies, 6(2013) 4682.
3. Aircraft incident report: auxiliary power unit battery fire. Japan airlines Boeing 787, JA 829J,
Page 18
Int. J. Electrochem. Sci., 16 (2021) Article ID: 210463
18
Boston, Massachusetts, January 7, 2013. National Transportation Safety Board, DC. Rep no.
PB2014-108867, 2014.
4. M. G. Ouyang, M. X. Zhang, X. N. Feng, L. G. Lu, J. Q. Li, X. M. He, Y. J. Zheng, J. Power
Sources, 294(2015)272
5. X. N. Feng, C. H. Weng, M. G. Ouyang, and J. Sun, Appl. Energy, 161(2016)168
6. R. Zhao, J. Liu, and J. J. Gu, Appl. Energy, 173(2016) 29.
7. Z. Y. Chen, R. Xiong, J. P. Tian, X. Shang, and J. H. Lu, Appl. Energy, 184(2016) 365.
8. G. Z. Liang, Y. M. Zhang, Q. Han, Z. P. Liu, Z. Jiang, S. Tian, J. Power Sources, 342 (2017) 836.
9. Y. D. Zhu, F. W. Yan, J. Q. Kang, C. Q. Du, Int. J. Electrochem. Sci., 12(2017) 6895.
10. T. R. Tanim, M. Garg, C. D. Rahn, Proceedings of the ASME 2016 Power and Energy Conference,
Charlotte, North Carolina, USA
11. H. Wang, E. Lara-Curzio, E. T. Rule, C. S. Winchester, J. Power Sources, 342(2017) 913.
12. J. Zheng, Y. Xu, X. Gao, J. Zheng, H. He, Z. Li, Int. J. Electrochem. Sci., 12(2018) 11620
13. H. Wang, A. Kumar, S. Simunovic, S. Allu, S. Kalnaus, J. A. Turner, J. C. Helmers, E. T. Rules, C.
S. Winchester, P. Gorney, J. Power Sources, 341 (2017) 156.
14. R. Zhao, J. Liu, J. J. Gu, Energy, 123 (2017) 392.
15. P. Ramadass, W. F. Fang, Z. M. Zhang, J. Power Sources, 248 (2014) 769.
16. D. P. Finegan, E. Darcy, M. Keyser, B. Tjaden, T. M. M. Heenan, R. Jervis, J. J. Bailey, R. Malik,
N. T. Vo, O. V. Magdysyuk, R. Atwood, M. Drakopoulos, M. DiMichiel, A. Rack, G. Hinds, D. J.
L. Bretta and P. R. Shearing, Energy Environ. Sci., 6(2017) 1377.
17. M. B. Chen, F. F. Bai, W. J. Song, J. Lv, S. L. Lin, Z. P. Feng, Y. L. Li, Y. L. Ding, Appl Therm
Eng, 120(2017) 506.
18. M. B. Chen, F. F. Bai, S. I. Lin, W. J. Song, Y. Li, Z. P. Feng, Appl. Therm. Eng., 146(2019) 775.
19. C. Zhang, S. Santhanagopalan, M. A. Sprague, A. A. Pesaran, J. Power Sources, 2015(290) 102.
20. F. Sun, R. Moroni, K. Dong, H. Markötter, D. Zhou, A. Hilger, L. Zielke, R. Zengerle, S. Thiele,
J. Banhart, and I. Manke, ACS Energy Lett, 2(2017) 94.
21. R. Guo, L. G. Lu, M. G. Ouyang, X. N. Feng, Sci. Rep., 6(2016) 30248.
22. R. Guo, L. G. Lu, M. G. Ouyang, X. N, Feng, Sci Rep, 6(2016) 30248.
23. X. D. Kong, G. L. Plett, M. S. Trimboli, Z. D. Zhang, D. D. Qiao, T. Z. Zhao, Y. J. Zheng, J.
Storage Mater., 27(2020) 101085.
24. D. S. Ren, X. N. Feng, L. S. Liu, H. J. Hsu, L. G. Lu, L. Wang, X. M. He, M. G. Ouyang, Energy
Storage Mater, 34(2021) 563.
25. L. S. Liu, X. N. Feng, M. X. Zhang, L. G. Lu, X. B. Han, X. M. He, M. G. Ouyang, Appl. Energy,
259(2020) 114143.
26. S. Santhanagopalan, P. Ramadass, J. Zhang, J. Power Sources, 1(2009): 550.
27. X. N. Feng, M. G. Ouyang, X. Liu, L. G. Lu, Y. Xia, X. M. He, Energy Storage Mater., 10(2018)
246.
28. X. N. Feng, M. Fang, X. M. He, M. G. Ouyang, L. G. Lu, H. Wang, M. X. Zhang, J. Power
Sources, 255(2014) 294.
29. J. C. Jiang, Q. J. Liu, C. P. Zhang, W. G. Zhang, IEEE Trans. Ind. Electron., 12(2014) 6844
30. P. D. Weidman, D. Ahn, R. Raj, J. Power Sources, 249 (2014) 219.
31. N. Tosun, Int. J. Adv. Manuf. Technol., 28(2006) 450.
32. L. Breiman, Machine Learning, 45(2001) 5.
33. L. Breiman, J. Friedman, C. J. Stone, R. A. Olshen, 1984, Chapman and Hall/CRC Press.
34. Matlab. Available: https://www.mathworks.com/products/matlab.html
35. Y. Pan, X. N. Feng, M. X. Zhang, X. B. Han, L. G. Lu, M. G. Ouyang, J. Cleaner Prod., 255(2020)
120277.
36. J. L. Xie, L. Zhang, T. Q. Yao, Z. C. Li, J. Storage Mater, 32(2020) 101957.
37. X. Lai, W. Yi, X. D. Kong, X. B. Han, L. Zhou, T. Sun, Y. J. Zheng, J. Storage Mater, 30(2020)
101514.
Page 19
Int. J. Electrochem. Sci., 16 (2021) Article ID: 210463
19
38. M. Seo, M. J. Park, Y. B. Song, S. W. Kim, IEEE Access, 8(2020) 70947.
© 2021 The Authors. Published by ESG (www.electrochemsci.org). This article is an open access
article distributed under the terms and conditions of the Creative Commons Attribution license
(http://creativecommons.org/licenses/by/4.0/).