119 Rakenteiden Mekaniikka (Journal of Structural Mechanics) Vol. 41, No 3, 2008, pp. 119-136 A parametric fracture mechanics study of the effect of a cold lap defect on fatigue strength Mikko Heiskanen Summary. Several finite element analyses were carried out to study the effect of local geomet- rical variation of weld on fatigue strength of non-load-carrying cruciform joints in as-welded condition under tensile loading. Cruciform joints can be found in many heavy industrial applica- tions, such as in junctions of longitudinal and transverse stiffeners in welded plate girders of shipyard cranes and orthotropic plates of ships. The variables were toe radius, cold lap and flank angle. The fatigue assessment was carried out with linear-elastic fracture mechanics in plane strain and under mixed-mode II I K K - conditions. The Paris crack growth law was used to pre- dict the growth rate. An analytical model was developed and its accuracy was compared to the available experimental fatigue test results. Key words: fatigue crack growth, finite element analysis, fracture mechanics, mixed mode fracture, welded joints Nomenclature a Crack length of cold lap A Throat thickness C Fatigue crack growth coefficient E Young’s modulus i K Stress intensity factor of mode i (i=I, II) ieq I K Equivalent stress intensity factor th K Threshold stress intensity factor m Fatigue crack growth exponent N Number of cycles r Toe radius R Stress ratio T Plate thickness β Flank angle ∆ Range in cyclic loading c θ ∆ Crack kink angle ν Poisson’s ratio σ Normal stress y σ Yield stress BC Boundary condition FAT Fatigue strength at 6 10 2 ⋅ cycles with 95 % survival probability FEA Finite element analysis IIW International Institute of Welding
Transcript
119
Rakenteiden Mekaniikka (Journal of Structural Mechanics)Vol. 41, No 3, 2008, pp. 119-136
A parametric fracture mechanics study of theeffect of a cold lap defect on fatigue strength
Mikko Heiskanen
Summary. Several finite element analyses were carried out to study the effect of local geomet-rical variation of weld on fatigue strength of non-load-carrying cruciform joints in as-weldedcondition under tensile loading. Cruciform joints can be found in many heavy industrial applica-tions, such as in junctions of longitudinal and transverse stiffeners in welded plate girders ofshipyard cranes and orthotropic plates of ships. The variables were toe radius, cold lap and flankangle. The fatigue assessment was carried out with linear-elastic fracture mechanics in planestrain and under mixed-mode III KK − conditions. The Paris crack growth law was used to pre-dict the growth rate. An analytical model was developed and its accuracy was compared to theavailable experimental fatigue test results.
a Crack length of cold lapA Throat thicknessC Fatigue crack growth coefficientE Young’s modulus
iK Stress intensity factor of mode i (i=I, II)
ieqIK Equivalent stress intensity factor
thK Threshold stress intensity factorm Fatigue crack growth exponentN Number of cyclesr Toe radiusR Stress ratioT Plate thicknessβ Flank angle∆ Range in cyclic loading
cθ∆ Crack kink angleν Poisson’s ratioσ Normal stress
yσ Yield stressBC Boundary conditionFAT Fatigue strength at 6102 ⋅ cycles with 95 % survival probabilityFEA Finite element analysisIIW International Institute of Welding
120
LEFM Linear-elastic fracture mechanicsLUT Lappeenranta University of TechnologyMAG Metal Active GasSCF Stress concentration factorSIF Stress intensity factorS-N Stress-life curve
Introduction
It is well documented that welds are the weakest part of a fatigue-loaded structure dueto local weld geometry and different types of weld imperfections which strongly affecton the fatigue strength. The local geometry affects on the local stress concentrations of astructure and the welding process can create crack-like defects, such as cold laps andundercuts, which during cyclic loading may lead to a large scatter in fatigue life. Theconventional fatigue design rules for welded joints, which are based on the S-N curves,only partially consider weld defects what can initiate during fabrication. Usually, the S-N curves are based on the laboratory tests of welds with “normal” quality, even though,what is a normal quality is not always clearly specified. There is a demand for betterunderstanding of the influence of macro-geometrical effects, structural discontinuitiesand weld defects that produce a high local stress.
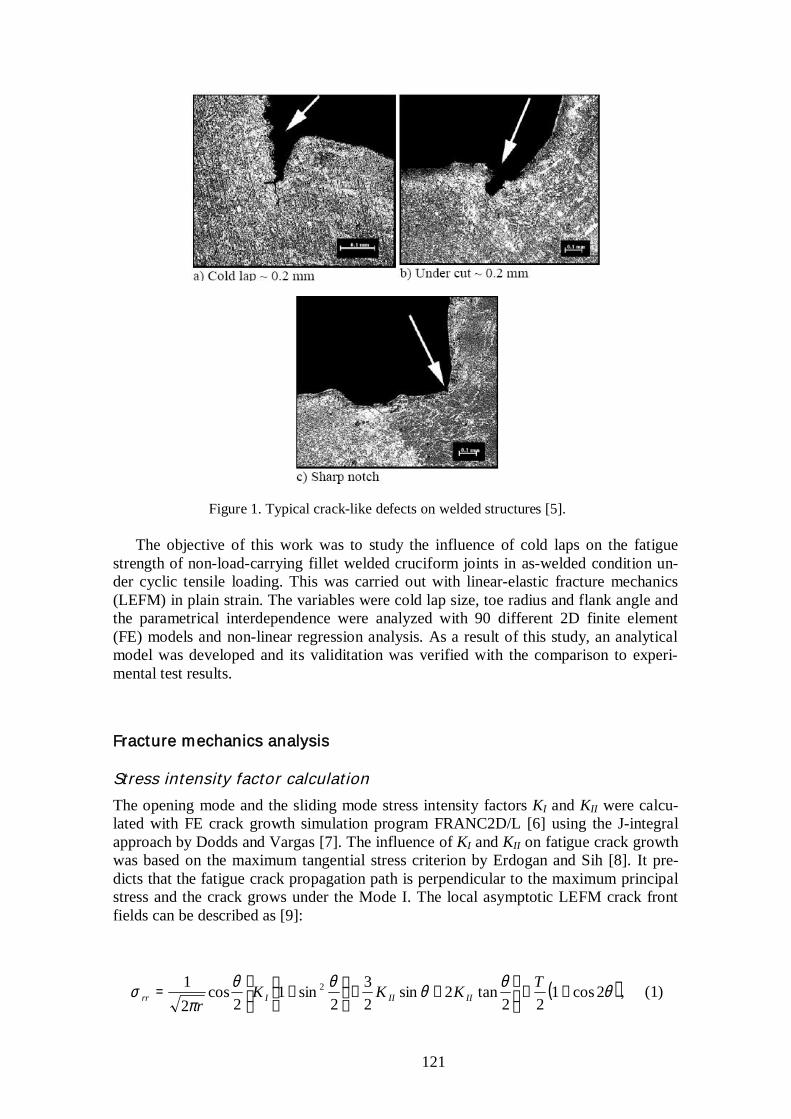
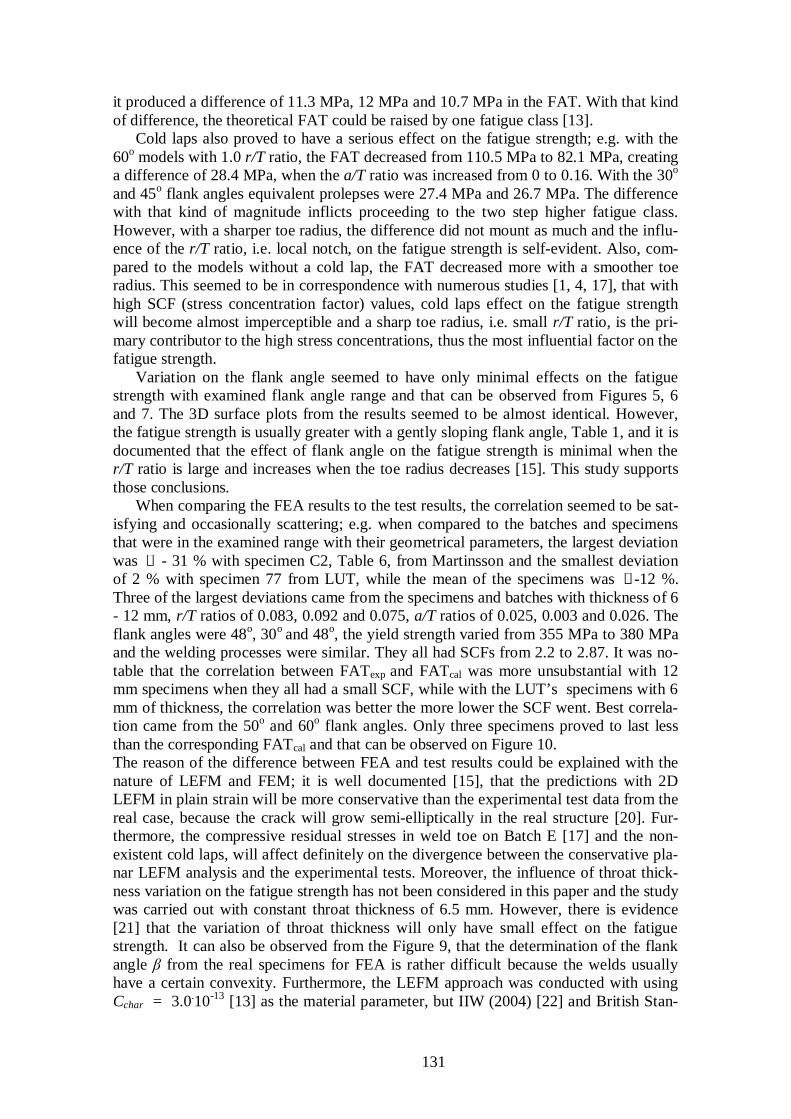
Typical types of weld defects, what can be found on cruciform joints [1], are crackat the weld toe, crack at the root, interbead crack and cold lap and are usually the conse-quences of improper fabrication. Cold lap, Figure 1, is a weld defect, where the weldfiller material has not properly fused with the base metal or the previous welds pass ma-terial [2]. The arc has not melted the base metal sufficiently and has caused a slightlymolten puddle to flow into the base material without bonding. Numerous test programshave demonstrated the detrimental effect of cold laps and individual analysis resultshave shown influence of fatigue cracks growing from cold lap defects. An investigationcovered by Lopez and Korsgen [3], proved that 80 % of all discovered weld defects inMAG (Metal Active Gas) welds are cold laps. The range of a typical cold lap size is be-tween 0.01 – 0.14 mm. Moreover, there seems to be an obvious connection betweenhigh speed welding and the occurrence frequency of cold laps [4].
121
Figure 1. Typical crack-like defects on welded structures [5].
The objective of this work was to study the influence of cold laps on the fatiguestrength of non-load-carrying fillet welded cruciform joints in as-welded condition un-der cyclic tensile loading. This was carried out with linear-elastic fracture mechanics(LEFM) in plain strain. The variables were cold lap size, toe radius and flank angle andthe parametrical interdependence were analyzed with 90 different 2D finite element(FE) models and non-linear regression analysis. As a result of this study, an analyticalmodel was developed and its validitation was verified with the comparison to experi-mental test results.
Fracture mechanics analysis
Stress intensity factor calculationThe opening mode and the sliding mode stress intensity factors KI and KII were calcu-lated with FE crack growth simulation program FRANC2D/L [6] using the J-integralapproach by Dodds and Vargas [7]. The influence of KI and KII on fatigue crack growthwas based on the maximum tangential stress criterion by Erdogan and Sih [8]. It pre-dicts that the fatigue crack propagation path is perpendicular to the maximum principalstress and the crack grows under the Mode I. The local asymptotic LEFM crack frontfields can be described as [9]:
( )θθ
θθθ
πσ 2cos1
22tan2sin
23
2sin1
2cos
21 2 ++
−+
+=
TKKKr IIIIIrr , (1)
122
( )θθθθπ
σ θθ 2cos12
sin23
2cos
2cos
21 2 −+
−=
TKKr III , (2)
[ ] θθθθπ
σ θ 2sin2
)1cos3(sin2
cos221 TKK
r IIIr −−+= , (3)
where rrσ , θθσ and θσ r are the stress components from a distance r and angle θ fromthe crack tip in the cylindrical-polar coordinate system. The T-stress is a constant com-ponent of the stress field and acting parallel to the crack tip. With using first-order kink-ing theory, differentiating the first term in Equation (2) with respect to θ and denotingθ = cθ∆ , the crack growth direction perpendicular to the maximum principal stress canbe expressed as [9]:
( )( )
+−=∆ −
III
IIIc KK
KK/4
/811tan2
21θ . (4)
Mixed-mode interaction can be considered by neglecting the second term from theEquation (2), denoting θ = cθ∆ , multiplying both sides with rπ2 and denoting the leftside as
eqIK∆ , i.e., the tangential stress θθσ in the Mode I is put equal to the θθσ in theMode I and Mode II combination. Then, the equivalent SIF will be:
2cossin
23
2cos2 c
cIIc
II KKKeq
θθ
θ ∆
∆−
∆=∆ . (5)
When the loading is a pure shear Mode II with a crack kink angle of -70.5°,
eqIK∆ =1.15KII. The crack growth direction will change if the initial crack directiondoes not satisfy the propagation direction in the Mode I. The ∆KIeq will be approxi-mately equal to KI for the following crack propagation steps, if the crack growth incre-ment is small enough [10].
Fatigue life calculation
For the fatigue life calculation, the Paris–Erdogan relationship [11] was used. It has thefollowing form:
( )mKCdNda
∆= , (6)
123
where a is the crack length, N is the number of cycles, C is a material constant, K∆ isthe opening mode SIF range and m is also a material constant and the phase II slope onlog-log plot. Stress ratios R >0 can be assessed by a form of the crack propagation equa-tion proposed by Forman [12]:
( )R
KCdNda m
−∆
=1
. (7)
The N can be solved with separating the variables and integrating:
∫ ∆−
=f
i
a
amif KC
daRN)()1( . (8)
For the material constants, charC = 13100.3 −⋅ , 13107.1 −⋅=meanC and m = 3 (inNmm-3/2 and mm units) were used and they are recommended by International Instituteof Welding (IIW) [13] for fatigue assessment of ferrite-pearlite steel welded joints in as-welded condition. meanC is the mean crack growth rate coefficient and charC is the char-acteristic crack growth coefficient corresponding to 95 % survival probability. Thethreshold thK∆ value was not used in this study.
Fatigue analysis with fatigue crack growth simulator
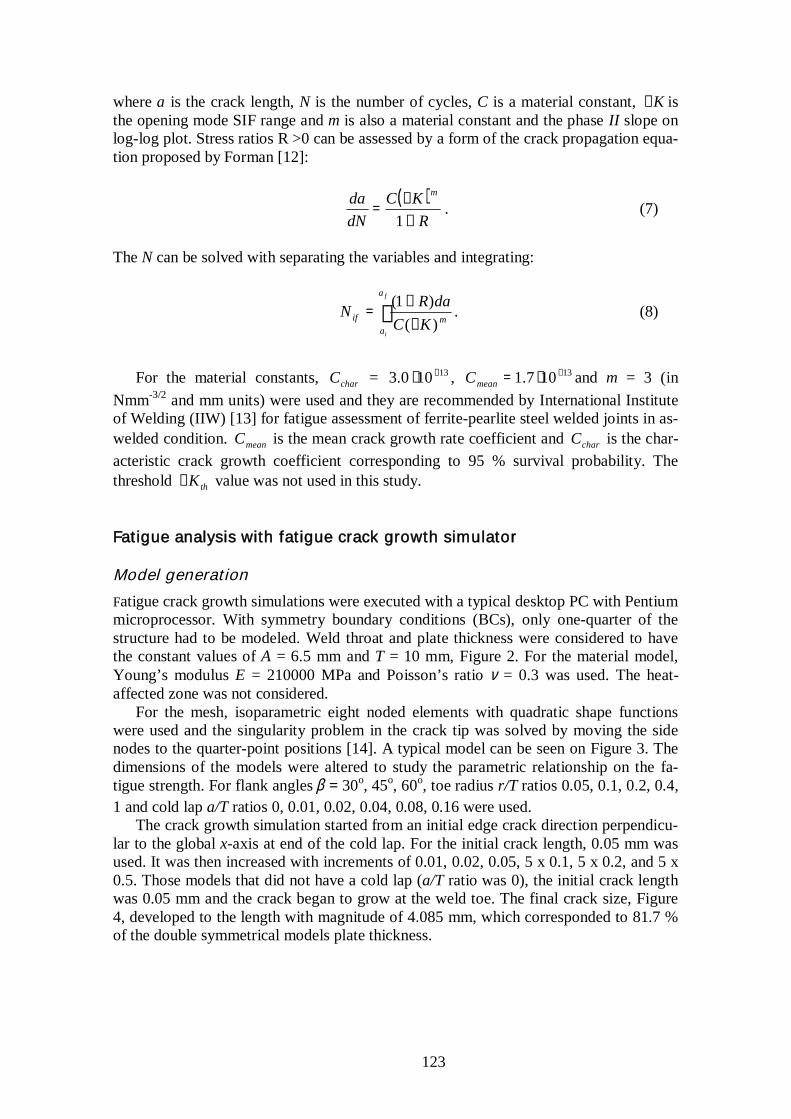
Model generationFatigue crack growth simulations were executed with a typical desktop PC with Pentiummicroprocessor. With symmetry boundary conditions (BCs), only one-quarter of thestructure had to be modeled. Weld throat and plate thickness were considered to havethe constant values of A = 6.5 mm and T = 10 mm, Figure 2. For the material model,Young’s modulus E = 210000 MPa and Poisson’s ratio ν = 0.3 was used. The heat-affected zone was not considered.
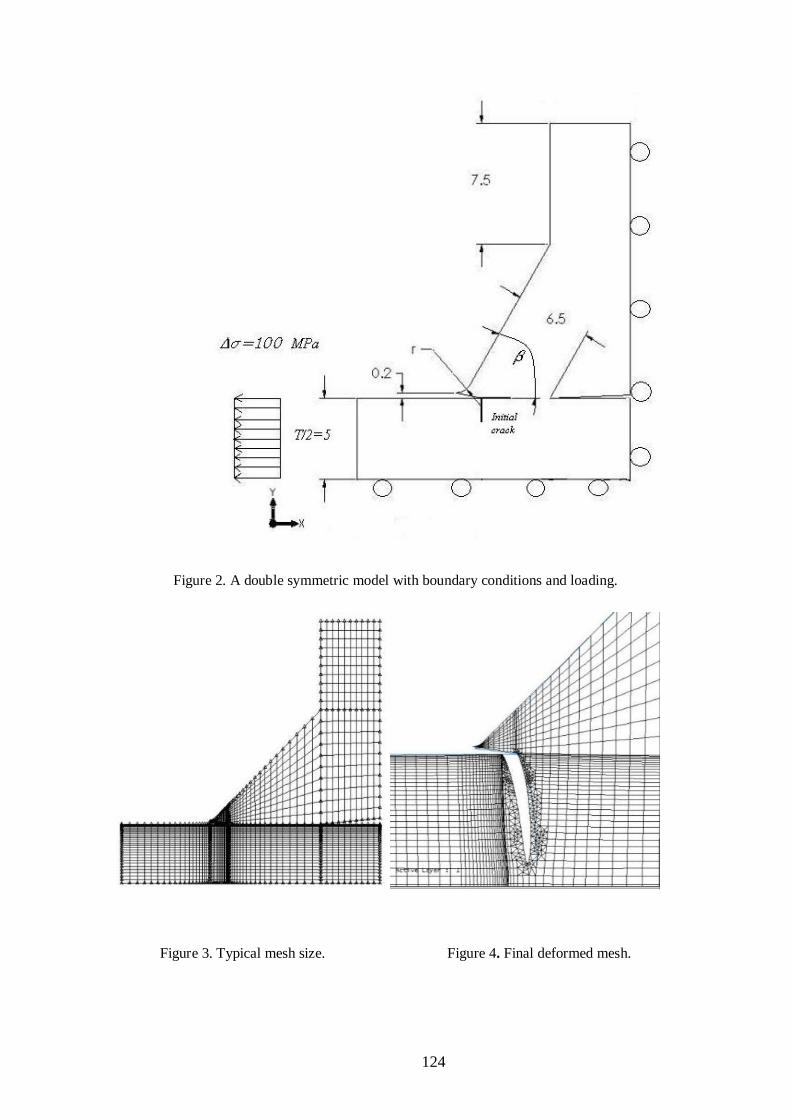
For the mesh, isoparametric eight noded elements with quadratic shape functionswere used and the singularity problem in the crack tip was solved by moving the sidenodes to the quarter-point positions [14]. A typical model can be seen on Figure 3. Thedimensions of the models were altered to study the parametric relationship on the fa-tigue strength. For flank angles β = 30o, 45o, 60o, toe radius r/T ratios 0.05, 0.1, 0.2, 0.4,1 and cold lap a/T ratios 0, 0.01, 0.02, 0.04, 0.08, 0.16 were used.
The crack growth simulation started from an initial edge crack direction perpendicu-lar to the global x-axis at end of the cold lap. For the initial crack length, 0.05 mm wasused. It was then increased with increments of 0.01, 0.02, 0.05, 5 x 0.1, 5 x 0.2, and 5 x0.5. Those models that did not have a cold lap (a/T ratio was 0), the initial crack lengthwas 0.05 mm and the crack began to grow at the weld toe. The final crack size, Figure4, developed to the length with magnitude of 4.085 mm, which corresponded to 81.7 %of the double symmetrical models plate thickness.
124
Figure 2. A double symmetric model with boundary conditions and loading.
Figure 3. Typical mesh size. Figure 4. Final deformed mesh.
125
Fatigue strength calculation
Fatigue strength of a welded joint is characterized by a fatigue class, FAT [13], whichidentifies the stress range corresponding to 6102 ⋅ cycles to failure with a 95 % survivalprobability calculated from a mean value of a two-sided 75 % confidence level. In thisstudy, The Paris-Erdogan relationship, Equation (6) and Equation (8) was used withequivalent Mode I values of the SIF range to obtain the cycles to failure. To convert thecycles to failure to a characteristic fatigue class were carried out as follows [15]:
36102 ⋅
∆= refref
NFAT σ , (9)
where refσ∆ was the adapted tensile load of 100 MPa and refN was the predicted fatiguelife of the given model. To compare the results from the crack growth simulation with50 % survival probability to the experimental fatigue test results, a conversion wasmade:
FATFATCC
FATmean
charmean ⋅≈⋅= 208.13 , (10)
where meanFAT is the mean fatigue strength at 6102 ⋅ cycles.
Results
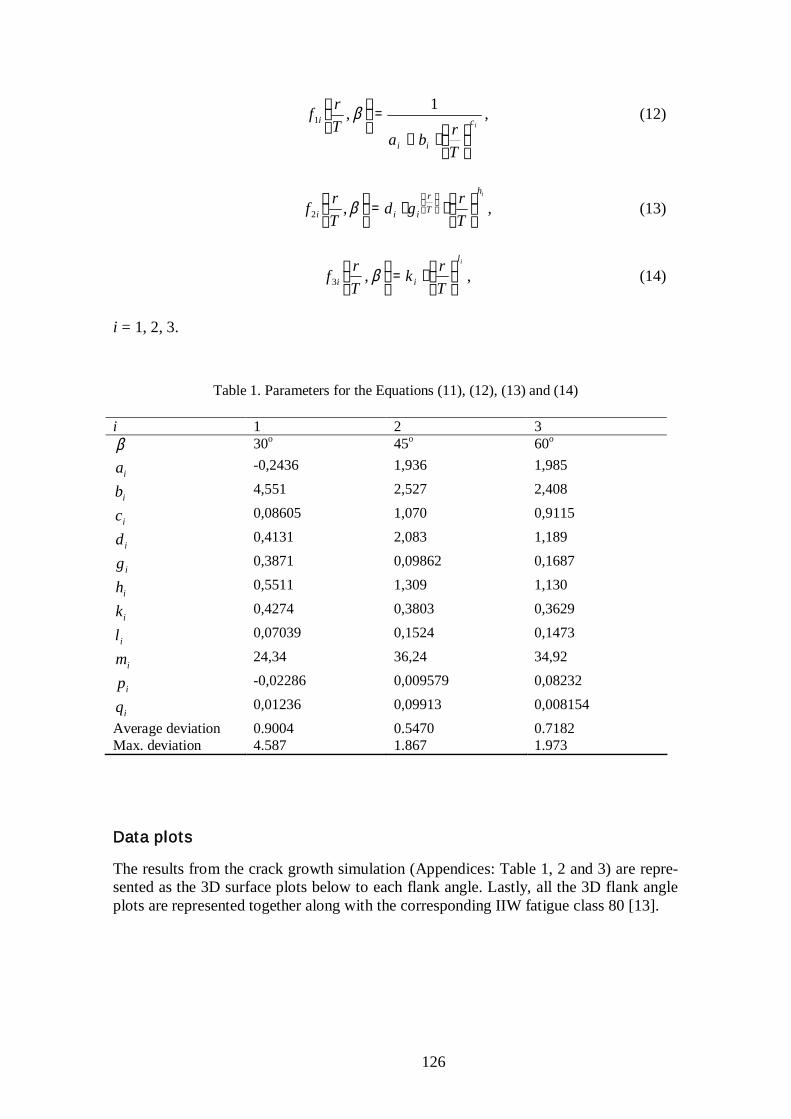
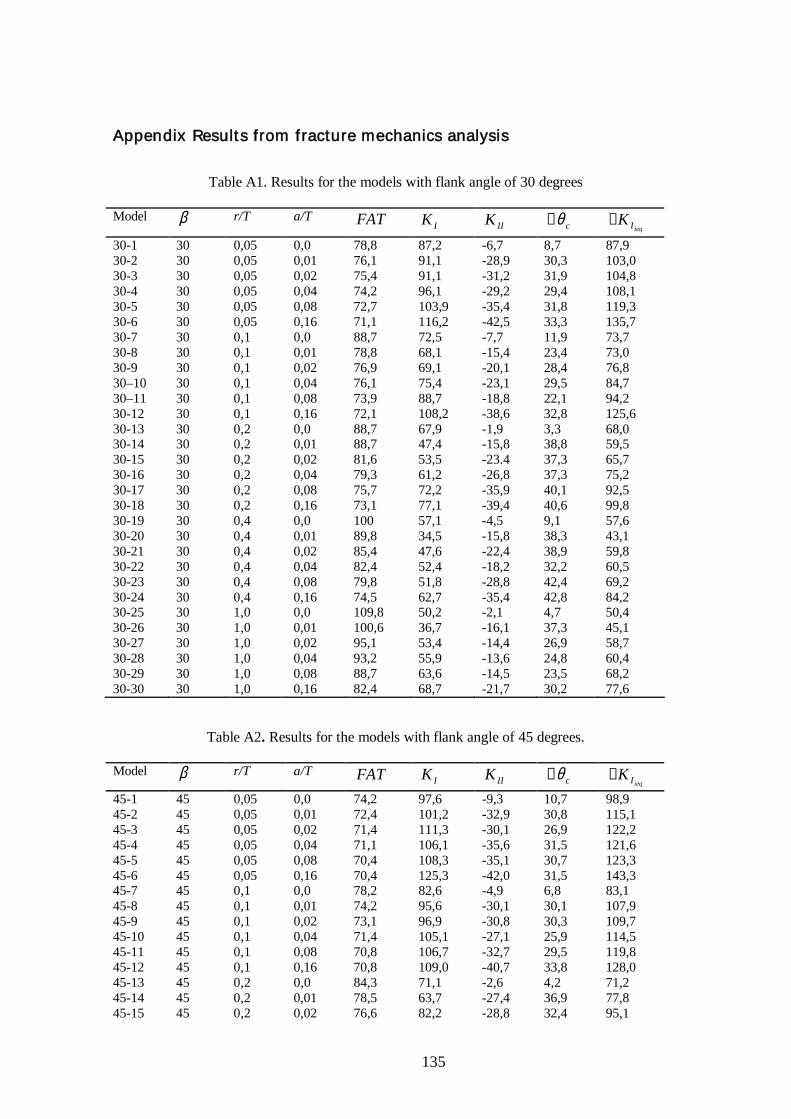
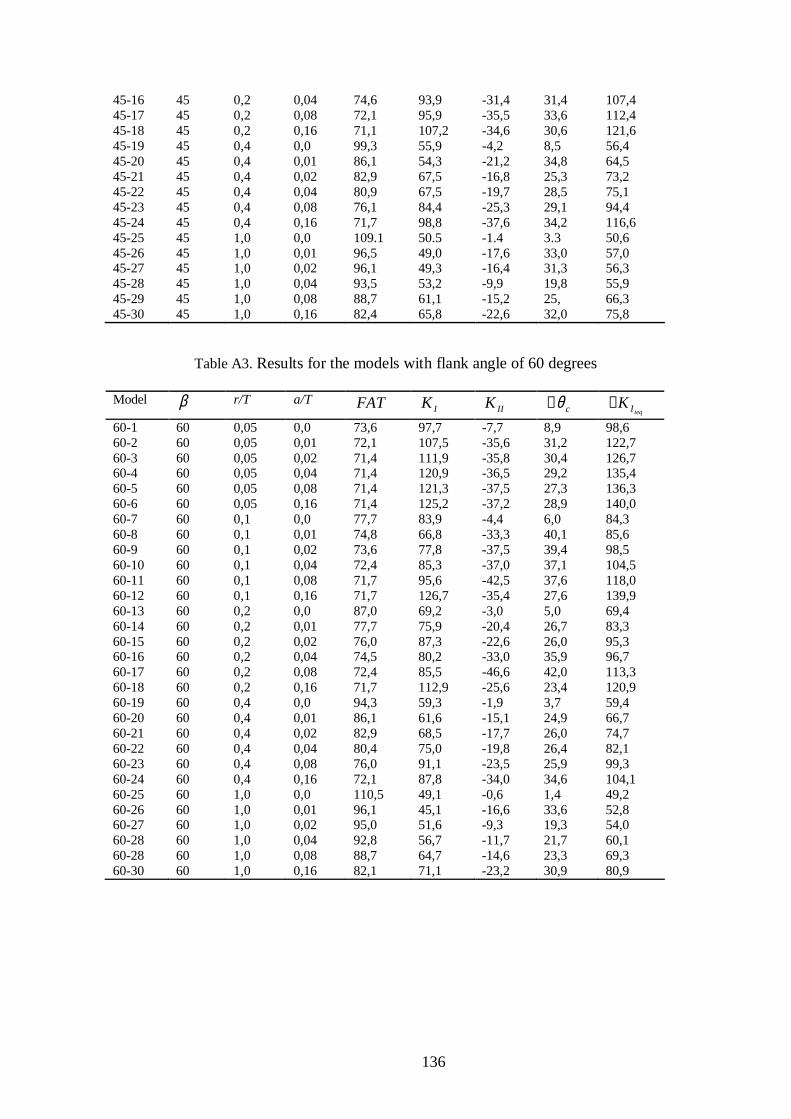
Non-linear regression analysisThe results from the crack growth simulation for each model are represented in Appen-dices. For the initial crack, the stress intensity factor ranges for KI and KII along with thecrack kink angles c were obtained from the simulator. Then, the equivalent stress in-tensity factors KIieqwere calculated separately. The FAT, relative toe radius r/T, rela-tive cold lap size a/T and flank angle were curve-fitted with non-linear regressionanalysis [16]. The parametric Equation (11) along with the adjunction functions, Equa-tions (12, 13 and 14), are presented below. The parameters for the parametric equationand adjunction functions are presented in the Table 1. Furthermore, the average devia-tion and the maximum deviation from the predicted FAT of the parametric Equation(11) are presented lastly.
2,
21
3
,,
,,
⋅+
⋅+
⋅
+
=
Trq
Trp
Ta
Trf
Trf
mTr
TaFAT
ii
Trf
ii
i
i β
ββ
β , (11)
where
126
ic
ii
i
Trba
Trf
⋅+
=
1,1 β , (12)
ih
Tr
iii Trgd
Trf
⋅⋅=
β,2 , (13)
il
ii Trk
Trf
⋅=
β,3 , (14)
i = 1, 2, 3.
Table 1. Parameters for the Equations (11), (12), (13) and (14)
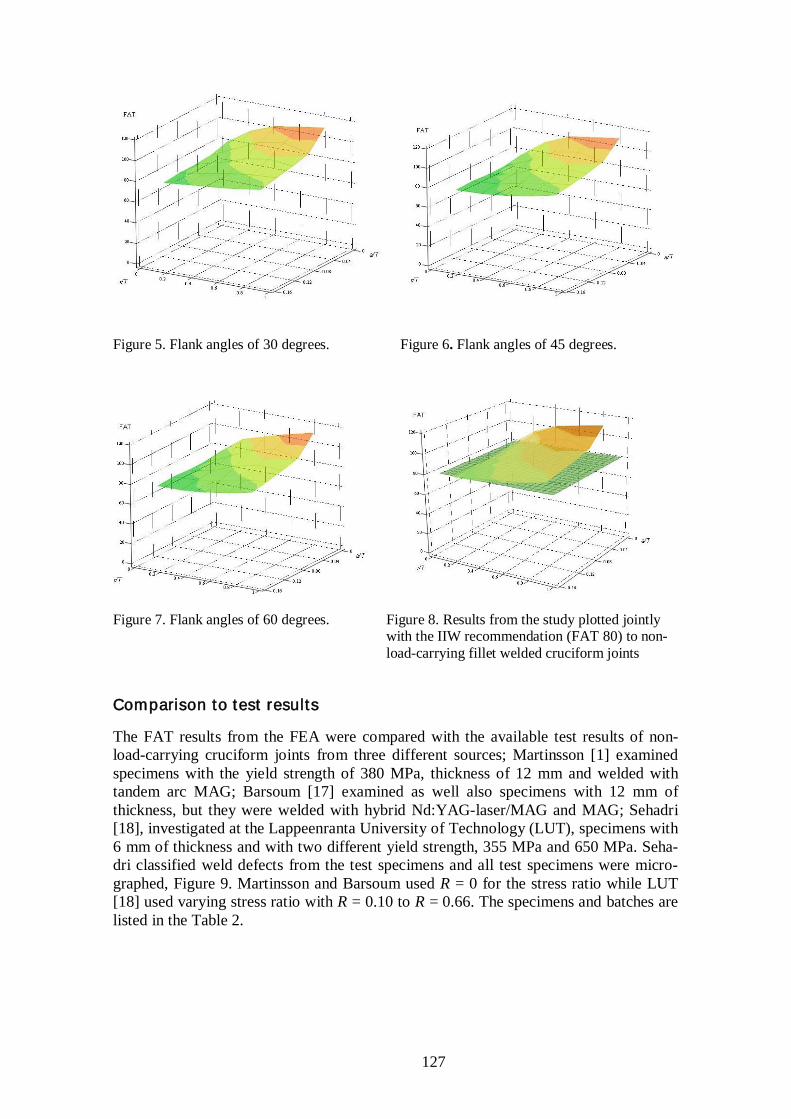
The results from the crack growth simulation (Appendices: Table 1, 2 and 3) are repre-sented as the 3D surface plots below to each flank angle. Lastly, all the 3D flank angleplots are represented together along with the corresponding IIW fatigue class 80 [13].
127
Figure 5. Flank angles of 30 degrees. Figure 6. Flank angles of 45 degrees.
Figure 7. Flank angles of 60 degrees. Figure 8. Results from the study plotted jointlywith the IIW recommendation (FAT 80) to non-load-carrying fillet welded cruciform joints
Comparison to test results
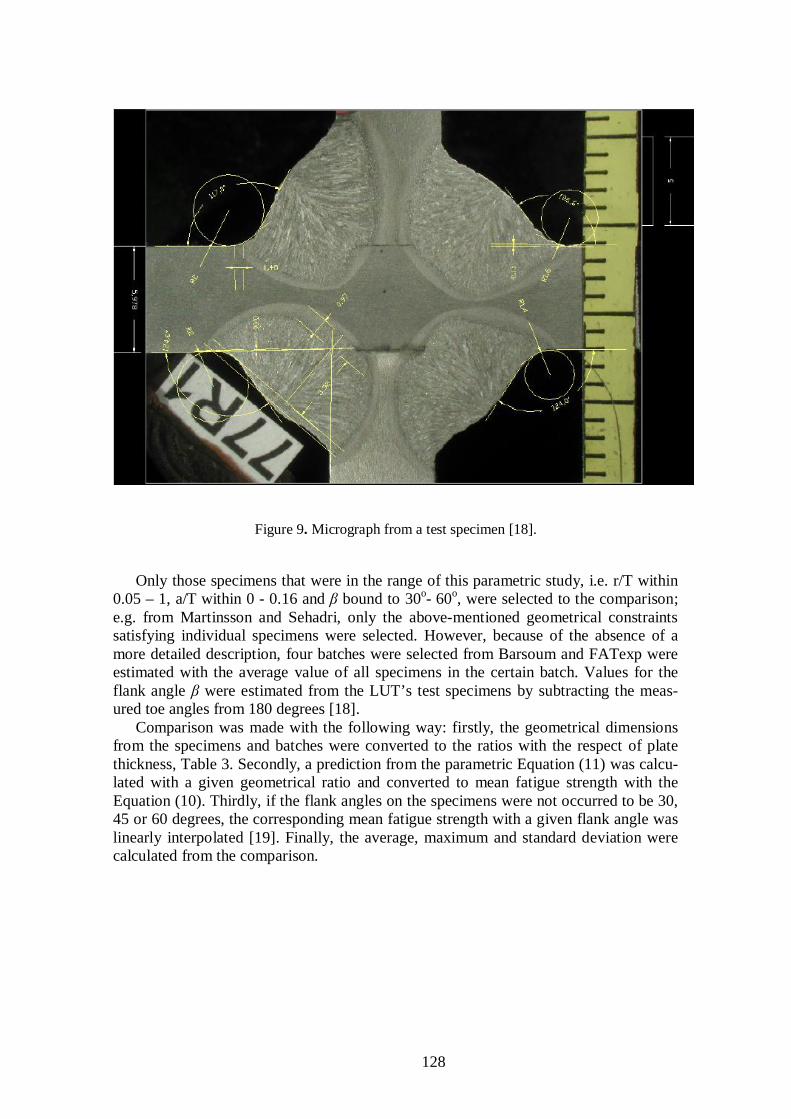
The FAT results from the FEA were compared with the available test results of non-load-carrying cruciform joints from three different sources; Martinsson [1] examinedspecimens with the yield strength of 380 MPa, thickness of 12 mm and welded withtandem arc MAG; Barsoum [17] examined as well also specimens with 12 mm ofthickness, but they were welded with hybrid Nd:YAG-laser/MAG and MAG; Sehadri[18], investigated at the Lappeenranta University of Technology (LUT), specimens with6 mm of thickness and with two different yield strength, 355 MPa and 650 MPa. Seha-dri classified weld defects from the test specimens and all test specimens were micro-graphed, Figure 9. Martinsson and Barsoum used R = 0 for the stress ratio while LUT[18] used varying stress ratio with R = 0.10 to R = 0.66. The specimens and batches arelisted in the Table 2.
128
Figure 9. Micrograph from a test specimen [18].
Only those specimens that were in the range of this parametric study, i.e. r/T within0.05 – 1, a/T within 0 - 0.16 and bound to 30o- 60o, were selected to the comparison;e.g. from Martinsson and Sehadri, only the above-mentioned geometrical constraintssatisfying individual specimens were selected. However, because of the absence of amore detailed description, four batches were selected from Barsoum and FATexp wereestimated with the average value of all specimens in the certain batch. Values for theflank angle were estimated from the LUT’s test specimens by subtracting the meas-ured toe angles from 180 degrees [18].
Comparison was made with the following way: firstly, the geometrical dimensionsfrom the specimens and batches were converted to the ratios with the respect of platethickness, Table 3. Secondly, a prediction from the parametric Equation (11) was calcu-lated with a given geometrical ratio and converted to mean fatigue strength with theEquation (10). Thirdly, if the flank angles on the specimens were not occurred to be 30,45 or 60 degrees, the corresponding mean fatigue strength with a given flank angle waslinearly interpolated [19]. Finally, the average, maximum and standard deviation werecalculated from the comparison.
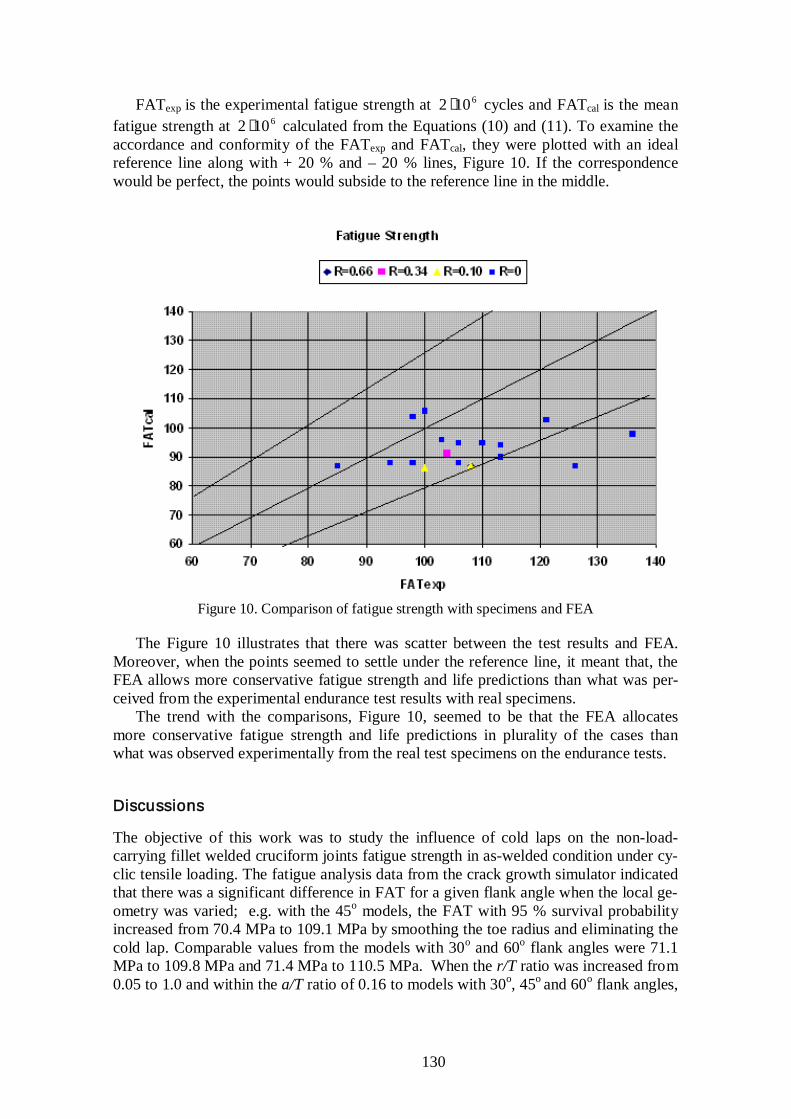
FATexp is the experimental fatigue strength at 6102 ⋅ cycles and FATcal is the meanfatigue strength at 6102 ⋅ calculated from the Equations (10) and (11). To examine theaccordance and conformity of the FATexp and FATcal, they were plotted with an idealreference line along with + 20 % and – 20 % lines, Figure 10. If the correspondencewould be perfect, the points would subside to the reference line in the middle.
Figure 10. Comparison of fatigue strength with specimens and FEA
The Figure 10 illustrates that there was scatter between the test results and FEA.Moreover, when the points seemed to settle under the reference line, it meant that, theFEA allows more conservative fatigue strength and life predictions than what was per-ceived from the experimental endurance test results with real specimens.
The trend with the comparisons, Figure 10, seemed to be that the FEA allocatesmore conservative fatigue strength and life predictions in plurality of the cases thanwhat was observed experimentally from the real test specimens on the endurance tests.
Discussions
The objective of this work was to study the influence of cold laps on the non-load-carrying fillet welded cruciform joints fatigue strength in as-welded condition under cy-clic tensile loading. The fatigue analysis data from the crack growth simulator indicatedthat there was a significant difference in FAT for a given flank angle when the local ge-ometry was varied; e.g. with the 45o models, the FAT with 95 % survival probabilityincreased from 70.4 MPa to 109.1 MPa by smoothing the toe radius and eliminating thecold lap. Comparable values from the models with 30o and 60o flank angles were 71.1MPa to 109.8 MPa and 71.4 MPa to 110.5 MPa. When the r/T ratio was increased from0.05 to 1.0 and within the a/T ratio of 0.16 to models with 30o, 45o and 60o flank angles,
131
it produced a difference of 11.3 MPa, 12 MPa and 10.7 MPa in the FAT. With that kindof difference, the theoretical FAT could be raised by one fatigue class [13].
Cold laps also proved to have a serious effect on the fatigue strength; e.g. with the60o models with 1.0 r/T ratio, the FAT decreased from 110.5 MPa to 82.1 MPa, creatinga difference of 28.4 MPa, when the a/T ratio was increased from 0 to 0.16. With the 30o
and 45o flank angles equivalent prolepses were 27.4 MPa and 26.7 MPa. The differencewith that kind of magnitude inflicts proceeding to the two step higher fatigue class.However, with a sharper toe radius, the difference did not mount as much and the influ-ence of the r/T ratio, i.e. local notch, on the fatigue strength is self-evident. Also, com-pared to the models without a cold lap, the FAT decreased more with a smoother toeradius. This seemed to be in correspondence with numerous studies [1, 4, 17], that withhigh SCF (stress concentration factor) values, cold laps effect on the fatigue strengthwill become almost imperceptible and a sharp toe radius, i.e. small r/T ratio, is the pri-mary contributor to the high stress concentrations, thus the most influential factor on thefatigue strength.
Variation on the flank angle seemed to have only minimal effects on the fatiguestrength with examined flank angle range and that can be observed from Figures 5, 6and 7. The 3D surface plots from the results seemed to be almost identical. However,the fatigue strength is usually greater with a gently sloping flank angle, Table 1, and it isdocumented that the effect of flank angle on the fatigue strength is minimal when ther/T ratio is large and increases when the toe radius decreases [15]. This study supportsthose conclusions.
When comparing the FEA results to the test results, the correlation seemed to be sat-isfying and occasionally scattering; e.g. when compared to the batches and specimensthat were in the examined range with their geometrical parameters, the largest deviationwas ≈ - 31 % with specimen C2, Table 6, from Martinsson and the smallest deviationof 2 % with specimen 77 from LUT, while the mean of the specimens was ≈ -12 %.Three of the largest deviations came from the specimens and batches with thickness of 6- 12 mm, r/T ratios of 0.083, 0.092 and 0.075, a/T ratios of 0.025, 0.003 and 0.026. Theflank angles were 48o, 30o and 48o, the yield strength varied from 355 MPa to 380 MPaand the welding processes were similar. They all had SCFs from 2.2 to 2.87. It was no-table that the correlation between FATexp and FATcal was more unsubstantial with 12mm specimens when they all had a small SCF, while with the LUT’s specimens with 6mm of thickness, the correlation was better the more lower the SCF went. Best correla-tion came from the 50o and 60o flank angles. Only three specimens proved to last lessthan the corresponding FATcal and that can be observed on Figure 10.The reason of the difference between FEA and test results could be explained with thenature of LEFM and FEM; it is well documented [15], that the predictions with 2DLEFM in plain strain will be more conservative than the experimental test data from thereal case, because the crack will grow semi-elliptically in the real structure [20]. Fur-thermore, the compressive residual stresses in weld toe on Batch E [17] and the non-existent cold laps, will affect definitely on the divergence between the conservative pla-nar LEFM analysis and the experimental tests. Moreover, the influence of throat thick-ness variation on the fatigue strength has not been considered in this paper and the studywas carried out with constant throat thickness of 6.5 mm. However, there is evidence[21] that the variation of throat thickness will only have small effect on the fatiguestrength. It can also be observed from the Figure 9, that the determination of the flankangle from the real specimens for FEA is rather difficult because the welds usuallyhave a certain convexity. Furthermore, the LEFM approach was conducted with usingCchar = 3.0.10-13 [13] as the material parameter, but IIW (2004) [22] and British Stan-
132
dard 7910: 1999 [23] have recommended slightly higher values with Cchar= 5.0.10-13 andCchar= 5.21.10-13, which reduces the predicted FAT with 95 % survival probability by15.6 % and 16.8 %. This leads into more conservative fatigue strength predictions.
Finally, a conclusion could be made that the parametric Equation (11) predicts effec-tively credible and slightly conservative FAT values that can be used on fatigue analysisand design. The study was made with steel as the material, but the parametric equationcan be also used to aluminium, when the FAT is reduced to one-third from the originalvalue [20]. LEFM works most accurately to welds with lower quality than welds withsmooth toe radius and without any significant defects due to negligence of crack initia-tion period, which’s proportion of total fatigue life increases with high quality welds[20, 24].
Conclusions
The objective of this work was to study the influence of cold laps on the fatigue strengthof non-load-carrying fillet welded cruciform joints under cyclic tensile loading. The as-sumption of as-welded condition made the fatigue crack initiation period to be consid-ered non-existent. LEFM in plain strain was used for fatigue analysis with several FEmodels and different weld geometry variations. The ratio of cold lap size and toe radiusto the plate thickness and the flank angle were systematically altered and analyzed andthe parametric relationships between those variables were formulated with the respect ofFAT with 95% survival probability and curve-fitted to a parametric Equation (11). Steelwas used as the material and the FAT predictions will cover also aluminium when theFAT value is reduced to one-third. The FAT predictions from the parametric equationwere converted to mean fatigue strength, FATmean, and compared to numerous test re-sults with different investigations of non-load-carrying fillet welded cruciform joints.Based on these proceedings, the following conclusions can be made:
1) Cold laps effect significantly on the fatigue strength.
2) With a small toe radius, cold laps will not effect on the fatigue strength nearly as much as with a large toe radius.
3) Variation in the flank angle from 30 to 60 degrees will not produce a considerable fluctuation on the fatigue strength.
4) The predictions from the analytical model are corresponding with the test resultsfrom similar structure details and weld defects.
5) Cold laps substantial effect on the fatigue strength is evident and should be consid ered critically in designing, fabrication and quality inspecting stages.
6) LEFM in plane strain works well for this kind of problem and allocates creditablepredictions that are most accurate on welds with lower quality due to non-existentcrack initiation period.
133
Acknowledgements
This work was conducted in the Department of Mechanical Engineering at the Lappeen-ranta University of Technology as the part of the “LAATU” weld quality project,funded by Finnish industry and the National Technology Agency of Finland. Acknowl-edgements go to Professor Gary Marquis and Dr. Timo Nykänen, who supervised thisstudy and to Dr. Timo Björk, who was the Project Coordinator.
References
[1] Martinsson, J. Fatigue Strength of Welded Cruciform Joints with Cold Laps. Design and Analysis of Welded High Strength Steel Structures. 2002. EMAS ltd.
ISBN 1 901537 34 X.[2] NDT Resource center. [On-Line]. Retrieved January 3rd 2007 from: http://www.ndt-
ed.org/.[3] Lopez Martinez, L. and Korsgen, S. Characterization of Welded Defect Distribution
and Weld Geometry in Welded Fatigue Test Specimens. Fatigue Under SpectrumLoading an in Corrosive Environments. 1993. EMAS ltd. Warley, UK.
[4] Samuelsson, J. Cold Laps and Weld Quality Acceptance Limits. Design and Analy-sis of Welded High Strength Steel Structures. 2002. EMAS ltd. ISBN 1 901537 34X.
[5] Martinsson, J. Fatigue Assessment of Complex Welded Structures. Doctoral Thesis.2005. ISBN 91-2783-968-6. [On-Line]. Retrieved December 25th 2006 from:http://www.divaportal.org/diva/getDocument?urn_nbn_se_kth_diva 166-2 full-text.pdf
[6] James M. and Swenson D. FRANC2D/L: A Crack Propagation Simulator for PlaneStructures. Available from: http://www.mne.ksu.edu/~franc2d/.
[7] Dodds RH and Vargas PM, Numerical evaluation of domain and contour integralfor nonlinear fracture mechanics: formulation and implementation aspects. Reportfrom University of Illinois at Urbana-Champaign, Dept. of Civil Engineering, 1988.
[8] Erdogan F. and Sih GC. ASME J Basic Engng 1963; 85: 519-527.[9] Ingraffea, A., Wawrzynek, P. Finite Element Methods for Linear Elastic Fracture
Mechanics.Chapter 3.1 in Comprehensive Structural Integrity. 2003. Elsevier Sci-ence Ltd., Oxford, England.[On-Line]. Retrieved November 1st 2008from:http://www.cfg.cornell.edu/education/education.htm.
[10] Nykänen, Timo. Fatigue crack growth simulations in laser welded lap joints. IIW-Document XIII-1707-98.
[11] Paris, P.C and Erdogan, F. A critical analysis of crack propagation law, TransASME, J Basic Eng, 1963, 85, 528-539.
[12] Forman, R. G., Kearney, V.E. and Engle, R.M. Numerical analysis of crack propa-gation in cyclic loaded structures, Trans ASME, J Basic Eng, 1967, 89, 459.
[13] Hoppacher, A. Fatigue Design of Welded Joints and Components, Recommenda-tions of IIW Joint Working Group XIII-XV, doc. XIII-1539-96/XV-845-96, Abing-ton Publishing, 1996.
[14] Bathe, K-J. Finite Element Procedures, Prentice-Hall, Inc. A Simon & SchusterCompany, Eaglewood Cliffs, New Jersey 07632, 1996.
[15] Nykänen, T., Marquis, G. and Björk, T. Fatigue analysis of non-load-carrying filletwelded cruciform joints. Engineering Fracture Mechanics, Volume 74, Issue 3, pp.399-415, February 2007.
[16] Sherrod PH. NLREG. Nonlinear Regression Analysis Program. Available from:http://www.nlreg.com/.
[17] Barsoum, Z. Fatigue Strength of Cruciform Joints Welded with Different WeldingProcesses. International Symposium on Integrated Design and Manufacturing ofWelded Structures. March 13-14, 2007, Eskilstuna, Sweden.
[18] Sehadri, A. Statistical Variation of Weld Profiles and Their Expected Influence onFatigue Strength. Master’s Thesis. 2006. Lappeenranta University of Technology.
[19] Hyams, D. CurveExpert 1.3. A comprehensive curve fitting system for Windows.Availablefrom: http://www.ebicom.net/~dhyams/cmain.htm.
[20] Radaj, D. and Sonsino, C-M. Fatigue assessment of welded joints by local ap-proaches, Woodhead Publishing Ltd, 1998.
[21] Nykänen, T., Marquis, G., Björk, T. Approximative master curve for fatigue as-sessment of cruciform joints with non-load-carrying welds. Finnish Welding Soci-ety Design Forum 7 – 8.6.2007, Lahti.
[22] Hobbacher, A. Recommendations for Fatigue Design of Welded Joints and Com-ponents. IIWDocument XIII-1965-03/XV-1127-03. Update July 2004.
[23] Guide on methods for assessing the acceptability of flaws in metallic structures,British Standard BS 7910:1999, 1999.
[24] Björk, T., Marquis, G., Quality Assessment of Welds for Fatigue Loaded Struc-tures. International Symposium on Integrated Design and Manufacturing of WeldedStructures. March 13-14, 2007, Eskilstuna, Sweden.
Mikko HeiskanenKonecranes Heavy Lifting CorporationP.O. Box 662FIN-05801 HyvinkääFINLANDe-mail: [email protected]